3.1. Rhythmicity Data
The one-way ANCOVA tests that compared all of the groups’ average 24 h rhythmicity with year as a covariate and experiment cycle as a nested covariate was significant, F(22, 19,839) = 590.52, p < 0.001. Overall, the analysis showed that there were significant differences in average 24 h rhythmicity between the groups. Post hoc tests revealed significantly higher rhythmicity rates in AlCl3 before and after Fiji groups compared to the AlCl3 before and after DI groups. There were significant main effects for experimental group [F(20, 19,839) = 642.33, p < 0.001], year [F(1, 19,839) = 1531.60, p < 0.001], and experiment cycle, F(1, 19,839) = 167.37, p < 0.001. Post hoc comparisons were run using a Bonferroni correction to compare the different experimental groups.
The post hoc comparisons of the average 24 h rhythmicity for the AlCl3 at 25 mg/L concentration groups showed significant differences in rhythmicity for the AlCl3 at 25 mg/L before (AlCl3 25 mg/L→Fiji) and after Fiji (Fiji→AlCl3 25 mg/L) and the AlCl3 at 25 mg/L before (AlCl3 25 mg/L→DI) and after DI water (DI→AlCl3 25 mg/L) groups, as shown in
Tables S1 and S2 and
Figure 1A. The AlCl3 25 mg/L→Fiji group (
M = −30.61,
SD = 48.51) had significantly higher rhythmicity levels compared to the AlCl3 25 mg/L→DI (
M = 7.61,
SD = 809.75,
p < 0.001) and DI→AlCl3 25 mg/L (
M = −490.09,
SD = 579.84,
p < 0.001) groups, as shown in
Table S1. The AlCl3 25 mg/L→DI group had significantly lower rhythmicity levels compared to the Fiji→AlCl3 25 mg/L group (
M = −27.51,
SD = 70.41,
p < 0.001) and significantly higher rhythmicity levels compared to the DI→AlCl3 25 mg/L group (
p < 0.001), as shown in
Tables S1 and S2,
Figure 1A. The Fiji→AlCl3 25 mg/L group had significantly higher rhythmicity rates compared to the DI→AlCl3 25 mg/L group (
p < 0.001). The only comparison that was not significantly different was between the AlCl3 25 mg/L→Fiji group and the Fiji→AlCl3 25 mg/L group,
p = 1.000. Overall, there was evidence of an effect of aluminum on rhythmicity with significant differences between the groups that received DI water and Fiji water. The bees that received Fiji before or after AlCl3 25 mg/L exhibited significantly higher rates of rhythmicity compared to the bees that received aluminum before or after DI water. There was not a significant difference in rhythmicity between the bees that received AlCl3 25 mg/L before Fiji and the bees that received aluminum after Fiji.
The post hoc comparisons of the average 24 h rhythmicity for the AlCl3 at 75 mg/L groups showed significant differences in rhythmicity for the AlCl3 at 75 mg/L before (AlCl3 75 mg/L→Fiji) and after Fiji (Fiji→AlCl3 75 mg/L) and the AlCl3 at 75 mg/L before (AlCl3 75 mg/L→DI) and after DI water groups (DI→AlCl3 75 mg/L), as shown in
Tables S1 and S2 and
Figure 1B. The AlCl3 75 mg/L→Fiji group (
M = 0.59,
SD = 45.93) had significantly higher rhythmicity levels compared to the AlCl3 75 mg/L→DI (
M = −778.20,
SD = 495.16,
p < 0.001) and DI→AlCl3 75 mg/L (
M = −436.52,
SD = 618.91) groups (
p < 0.001), as shown in
Table S1. The AlCl3 75 mg/L→DI group had significantly lower rhythmicity levels compared to the Fiji→AlCl3 75 mg/L (
M = −11.56,
SD = 36.66,
p < 0.001) and the DI→AlCl3 75 mg/L groups (
p < 0.001), as shown in
Tables S1 and S2 and
Figure 1B. The Fiji→AlCl3 75 mg/L group had significantly higher rhythmicity rates compared to the DI→AlCl3 75 mg/L group,
p < 0.001. There was no significant difference between the AlCl3 75 mg/L→Fiji and Fiji→AlCl3 75 mg/L groups,
p = 1.000. Overall, there was evidence of an effect of aluminum on rhythmicity with significant differences between the groups that received DI water and Fiji water at the AlCl3 75 mg/L concentration. The bees that received Fiji before or after AlCl3 75 mg/L exhibited significantly higher rates of rhythmicity compared to the bees that received aluminum before or after DI water. There was not a significant difference in rhythmicity between the bees that received AlCl3 75 mg/L before Fiji and the bees that received aluminum after Fiji.
The post hoc comparisons of the average 24 h rhythmicity for the AlCl3 150 mg/L groups showed significant differences in rhythmicity for the AlCl3 at 150 mg/L before (AlCl3 150 mg/L→Fiji) and after (Fiji→AlCl3 150 mg/L) Fiji and the AlCl3 at 150 mg/L before (AlCl3 150 mg/L→DI) and after (DI→AlCl3 150 mg/L) DI water groups, as shown in
Tables S1 and S2 and
Figure 1C. The AlCl3 150 mg/L→Fiji group (
M = 7.19,
SD = 54.58) had significantly higher rhythmicity levels compared to the AlCl3 150 mg/L→DI (
M = −227.77,
SD = 315.57,
p < 0.001) and DI→AlCl3 150 mg/L (
M = −77.56,
SD = 401.39) groups (
p < 0.001), as shown in
Table S1. The AlCl3 150 mg/L→Fiji group had significantly lower rhythmicity rates compared to the Fiji→AlCl3 150 mg/L (
M = 10.97,
SD = 71.49),
p < 0.001. The AlCl3 150 mg/L→DI group had significantly lower rhythmicity levels compared to the Fiji→AlCl3 150 mg/L (
p < 0.001) and DI→AlCl3 150 mg/L groups (
p < 0.001), as shown in
Tables S1 and S2 and
Figure 1C. The AlCl3 150 mg/L→Fiji group had significantly higher rhythmicity rates compared to the DI→AlCl3 150 mg/L group,
p < 0.001. Overall, there was evidence of an effect of aluminum on rhythmicity with significant differences between the groups that received DI water and Fiji water at the AlCl3 150 mg/L concentration. The bees that received Fiji before or after AlCl3 150 mg/L exhibited significantly higher rates of rhythmicity compared to the bees that received aluminum before or after DI water. There was a significant difference in rhythmicity between the bees that received AlCl3 150 mg/L before Fiji and the bees that received aluminum after Fiji. Bees that received AlCl3 150 mg/L before Fiji water had significantly lower rhythmicity rates compared to bees that received aluminum after Fiji water.
The post hoc comparisons of the average 24 h rhythmicity for the AlCl3 300 mg/L groups showed significant differences in rhythmicity for the AlCl3 at 300 mg/L before (AlCl3 300 mg/L→Fiji) and after Fiji (Fiji→AlCl3 300 mg/L) and the AlCl3 at 300 mg/L before (AlCl3 300 mg/L→DI) and after DI water (DI→AlCl3 300 mg/L) groups. The AlCl3 300 mg/L→Fiji group (
M = −61.33,
SD = 40.28) had significantly higher rhythmicity levels compared to the AlCl3 300 mg/L→DI (
M = −411.91,
SD = 408.33,
p < 0.001) and DI→AlCl3 300 mg/L (
M = −327.60,
SD = 464.39) groups (
p < 0.001), as shown in
Table S1 and
Figure 1D. The AlCl3 300 mg/L→Fiji group had significantly lower rhythmicity rates compared to the Fiji→AlCl3 300 mg/L (
M = −11.62,
SD = 41.48) group,
p < 0.001. The AlCl3 300 mg/L→DI group had significantly lower rhythmicity levels compared to the Fiji→AlCl3 300 mg/L (
p < 0.001) and the DI→AlCl3 300 mg/L groups (
p = 0.02), as shown in
Tables S1 and S2 and
Figure 1A. The Fiji→AlCl3 300 mg/L group had significantly higher rhythmicity rates compared to the DI→AlCl3 300 mg/L group (
p < 0.001). Overall, there was evidence of an effect of aluminum on rhythmicity with significant differences between the groups that received DI water and Fiji water at the AlCl3 300 mg/L concentration. The bees that received Fiji before or after AlCl3 300 mg/L exhibited significantly higher rates of rhythmicity compared to the bees that received aluminum before or after DI water. There was a significant difference in rhythmicity between the bees that received AlCl3 300 mg/L before Fiji and the bees that received aluminum after Fiji. Bees that received AlCl3 300 mg/L before Fiji water had significantly lower rhythmicity rates compared to bees that received aluminum after Fiji water.
Two additional one-way ACOVA tests were conducted, one for daytime activity and one for nighttime activity. The one-way ANCOVA for daytime (0600–1800 h) rhythmicity while controlling for year and experiment cycle was significant,
F(22, 9074) = 400.30,
p < 0.001). There were significant main effects for year [
F(1, 9074) = 1082.39,
p < 0.001], experiment cycle [
F(1, 9074) = 112.56,
p < 0.001], and aluminum concentration,
F(20, 9074) = 436.86,
p < 0.001. Overall, year, experiment cycle, and aluminum concentration significantly impacted daytime rhythmicity rates. The Fiji 1, DI water before and after Fiji water, Fiji→AlCl3 1500 mg/L, and Fiji→AlCl3 300 mg/L daytime groups exhibited no significant differences compared to the controls, as shown in
Table S2 for descriptive statistics and
Figure 1A–D. However, the remainder of the AlCl3 before and after Fiji and AlCl3 before and after DI water groups along with the Fiji 2 group showed significant differences compared to the DI water controls (see
Table S2 for descriptive statistics and
Figure 1A–D). Cumulatively, the data showed significant daytime differences between the treatment groups and the DI water control for all but five of the groups.
The one-way ANCOVA for nighttime (1800–0600 h) rhythmicity while controlling for year and experiment cycle was significant,
F(22, 10,742) = 293.10,
p < 0.001). There were significant main effects for year [
F(1, 10,742) = 685.22,
p < 0.001], experiment cycle [
F(1, 10,742) = 82.96,
p < 0.001], and aluminum concentration,
F(20, 10,742) = 314.98,
p < 0.001. Overall, year, experiment cycle, and aluminum concentration significantly impacted nighttime rhythmicity rates. The Fiji 1, DI water before and after Fiji water, Fiji→AlCl3 150 mg/L, and Fiji→AlCl3 300 mg/L nighttime groups exhibited no significant differences compared to the controls, as shown in
Table S2 for descriptive statistics and
Figure 1A–D. However, the remainder of the AlCl3 before and after Fiji and AlCl3 before and after DI water groups along with the Fiji 2 group showed significant differences to controls (see
Table S2 for descriptive statistics and
Figure 1A–D). Cumulatively, the data showed significant nighttime differences between the treatment groups and the DI water control for all but five of the groups.
Additional single sample
t-test analyses were conducted with the daytime and nighttime data to compare each of the experimental groups to a zero-baseline. Overall, 14 out of the 21 groups had significantly lower rhythmicity levels during the daytime compared to the zero-baseline,
Tables S1 and S2. When AlCl3 at 75 mg/L was introduced prior to Fiji water (AlCl3 75 mg/L→Fiji) and AlCl3 at 25 mg/L was introduced prior to DI water (AlCl3 25 mg/L→DI) groups exhibited no significant differences in daytime rhythmicity levels from the zero-baseline. During the daytime, Fiji water 1, DI Water before Fiji water, and AlCl3 at 150 mg/L before and after Fiji groups all had significantly higher rhythmicity rates compared to the zero-baseline.
During the nighttime, 13 out of the 21 groups had significantly lower rhythmicity levels compared to the zero-baseline, as shown in
Table S1. The same four groups, Fiji water 1, DI Water before Fiji, AlCl3 at 150 mg/L before and after Fiji water, had significantly higher nighttime rhythmicity rates compared to the zero-baseline. Additionally, the same two groups, AlCl3 at 75 mg/L before Fiji water and AlCl3 at 25 mg/L before DI water, exhibited no significant differences in daytime rhythmicity levels from the zero-baseline. A third group, AlCl3 at 150 mg/L after DI water, exhibited no significant differences in nighttime rhythmicity compared to the zero-baseline.
In comparison, 12 out of the 20 groups had significantly lower rhythmicity levels for their average 24 h activity levels. The same four groups from the daytime and nighttime, Fiji water 1, DI water before Fiji, and AlCl3 at 150 mg/L before and after Fiji water groups had significantly higher rhythmicity levels compared to the zero-baseline. The DI water after Fiji water, and AlCl3 at 300 mg/L after Fiji water groups all had significantly higher rhythmicity rates compared to the zero-baseline. The same two groups, AlCl3 at 75 mg/L before Fiji water and AlCl3 at 25 mg/L before DI water, exhibited no significant differences in rhythmicity levels during their average 24 h of activity compared to the zero-baseline.
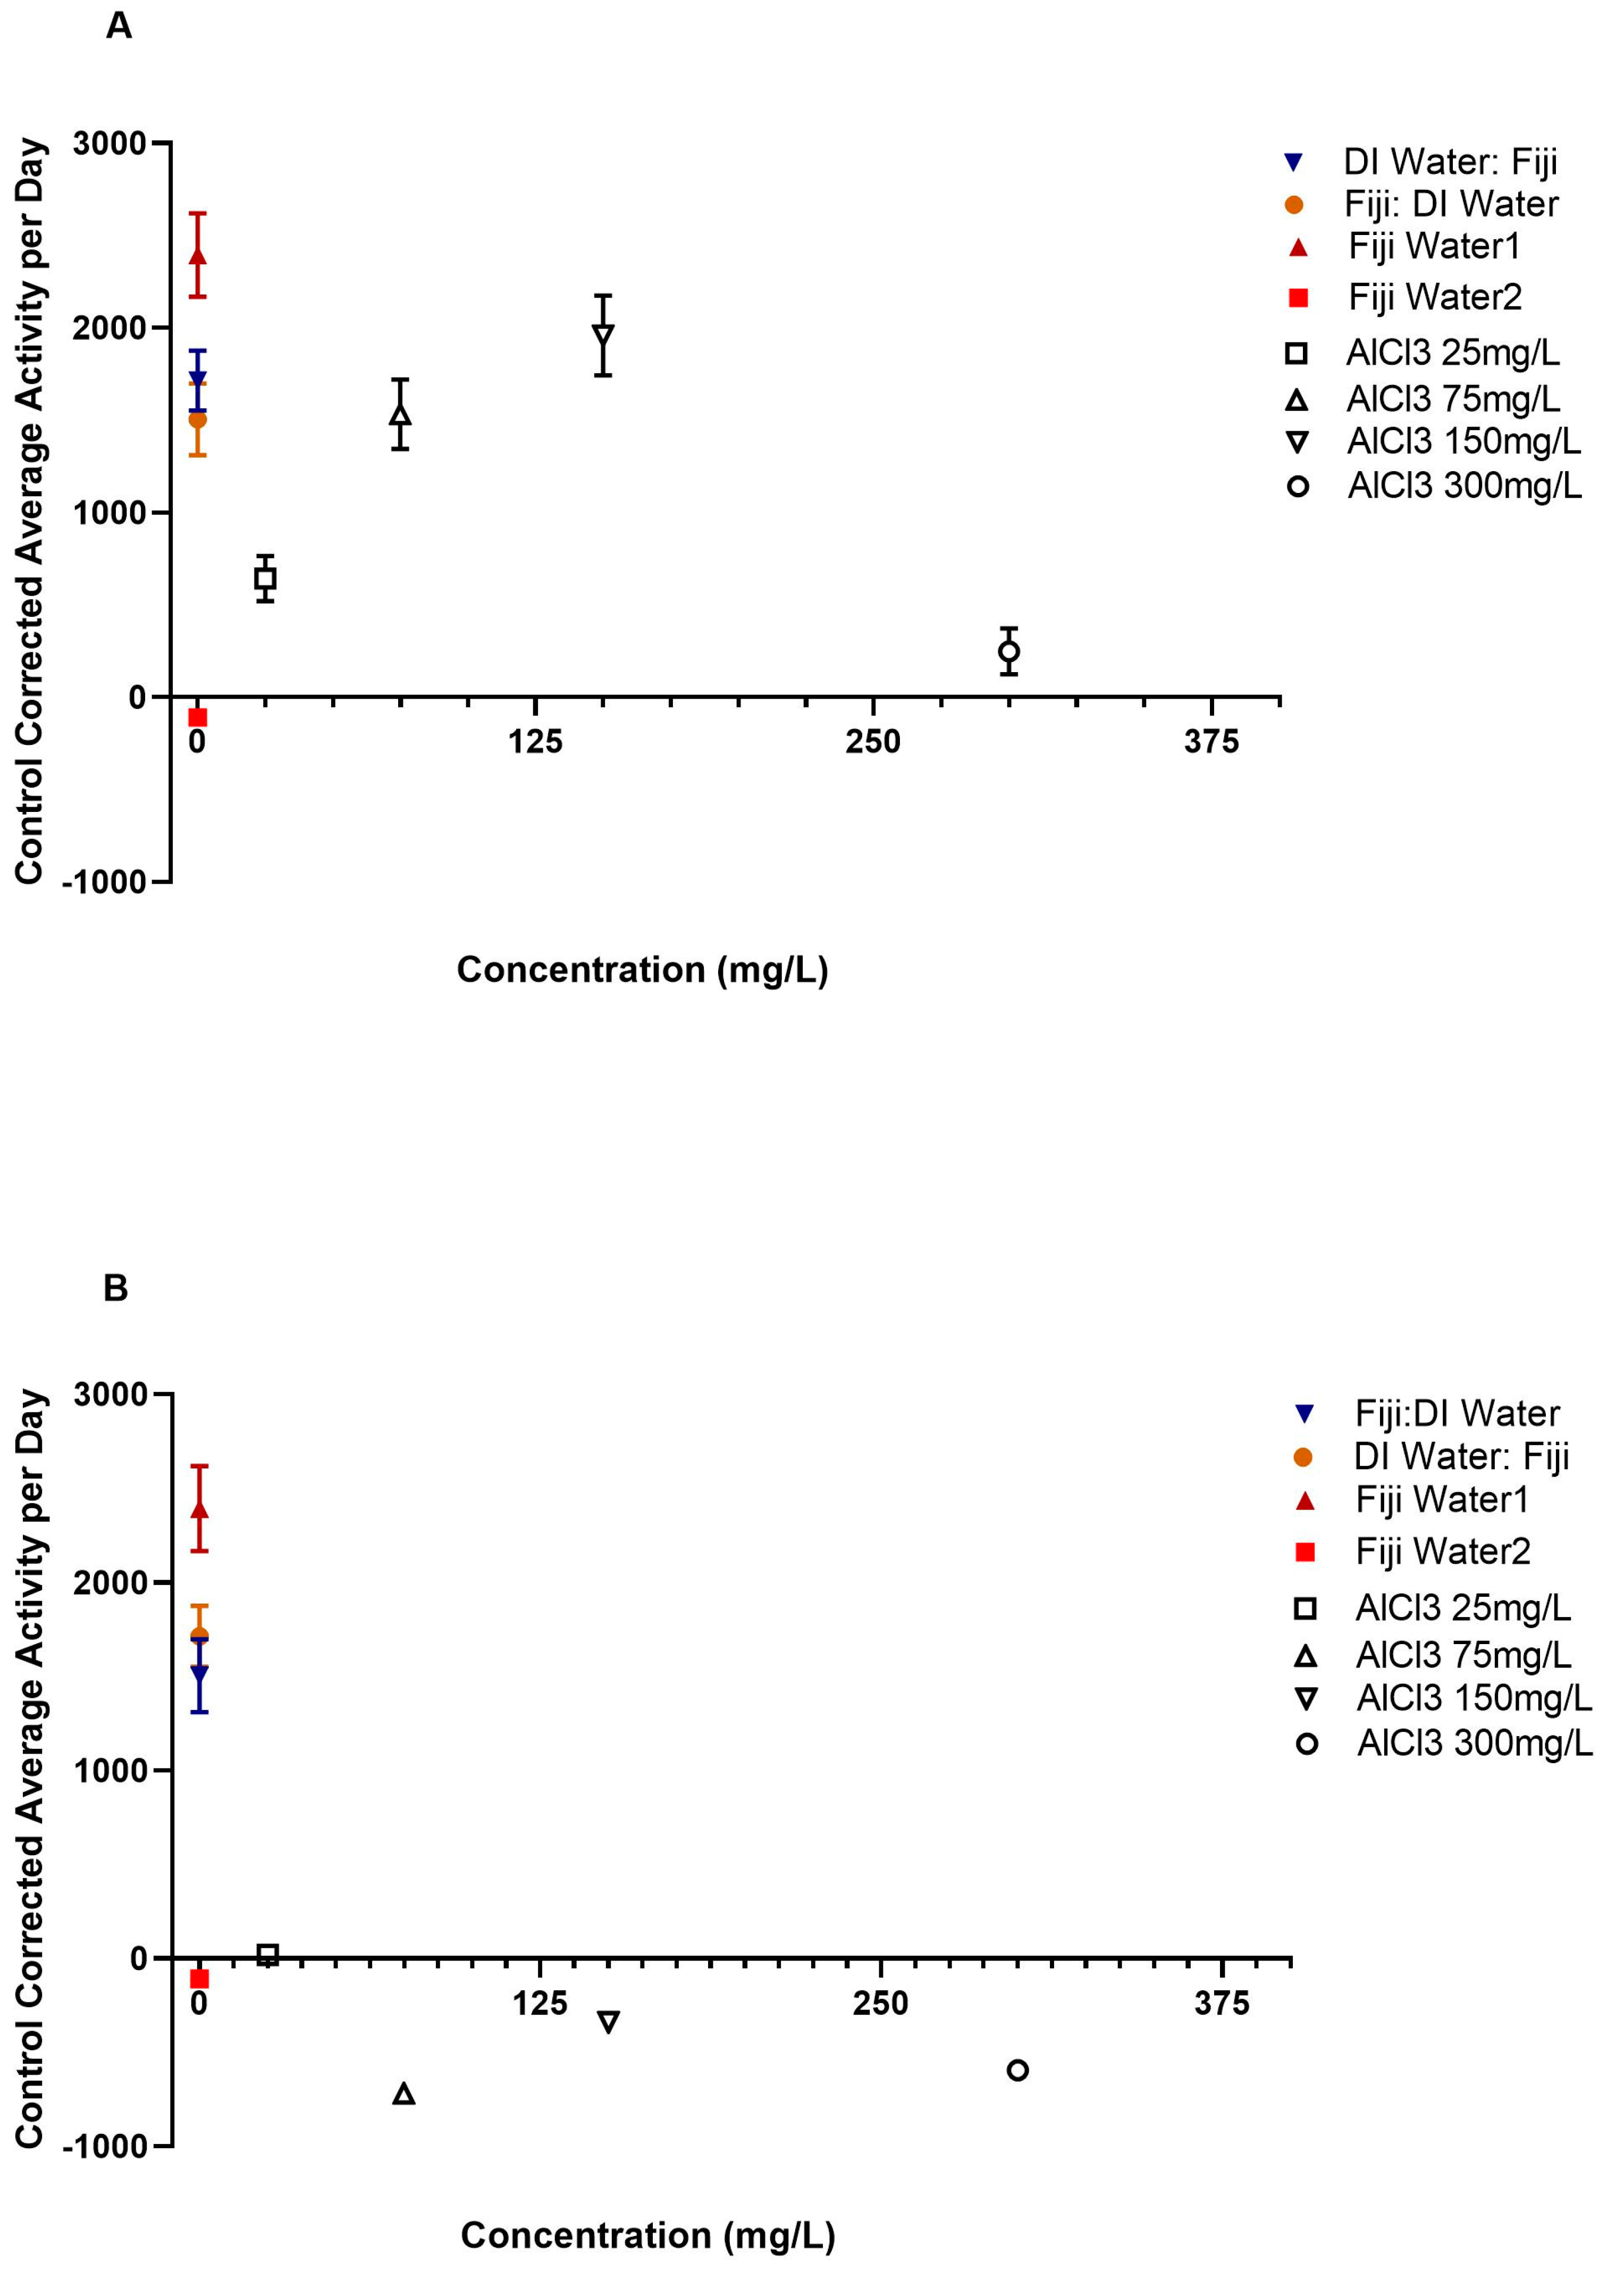
3.2. Average Daily Activity
The one-way ANCOVA test that compared all of the groups’ average daily activity with year as a covariate and experiment cycle as a nested covariate was significant,
F(22, 14,435) = 131.58,
p < 0.001. Overall, the analysis showed that there were significant differences in average daily activity between the groups. Post hoc tests revealed significantly higher average daily activity rates between a portion of the AlCl3 before and after Fiji groups compared to the AlCl3 before and after DI groups. There were significant main effects for experimental group [
F(20, 14,435) = 66.39,
p < 0.001] and year,
F(1, 14,435) = 33.02,
p < 0.001. There was no significant main effect for the experiment cycle,
F(1, 14,435) = 0.09,
p = 0.759. Post hoc comparisons were run using a Bonferroni correction to compare the different groups, as shown in
Tables S3 and S4 and
Figure 2A–D.
Post hoc comparisons for the AlCl3 25 mg/L groups showed significant differences in average daily activity between the AlCl3 before DI and both the AlCl3 after Fiji and after DI groups after controlling for year and experiment cycle, as shown in
Tables S3 and S4 and
Figure 2A–D. The AlCl3 25 mg/L→DI (
M = −18.34,
SD = 1116.22) had significantly higher average daily activity rates compared to the DI→AlCl3 25 mg/L (
M = −443.90,
SD = 921.70,
p = 0.005) group. The Fiji→AlCl3 25 mg/L group (
M = −1022.76,
SD = 2546.14) had significantly higher average daily activity levels compared to the DI→AlCl3 25 mg/L group,
p < 0.001. There were no significant differences between the AlCl3 25 mg/L→Fiji group and the AlCl3 at 25 mg/L before (
p = 1.00) or after DI (
p = 0.12) groups, as seen in
Tables S3 and S4 and
Figure 2A–D. Additionally, there was no significant difference between the AlCl3 before and after Fiji groups,
p = 1.00. There also was no significant difference between the AlCl3 25 mg/L→DI group and the Fiji→AlCl3 25 mg/L group,
p = 0.922. Overall, there was only a significant difference between the AlCl3 before and after DI groups and the AlCl3 after Fiji groups with the aluminum after DI group. The AlCl3 25 mg/L before Fiji group had significantly higher average daily activity rates compared to the AlCl3 after DI group. Additionally, the AlCl3 25 mg/L after Fiji group had significantly higher average daily activity levels compared to the AlCl3 25 mg/L after DI group. There were no significant differences between any of the other AlCl3 25 mg/L before and after Fiji groups or the other AlCl3 25 mg/L before and after DI water and AlCl3 25 mg/L before and after Fiji water groups.
There were significant differences between the AlCl3 at 75 mg/L before and after DI and the AlCl3 75 mg/L before and after Fiji groups in average daily activity, as shown in
Tables S3 and S4 and
Figure 2A–D. The AlCl3 75 mg/L→Fiji group (
M = 1532.74,
SD = 2707.88) had significantly higher average daily activity rates compared to the AlCl3 at 75 mg/L before (
M = −718.89,
SD = 740.99,
p < 0.001) and after DI (
M = −878.82,
SD = 3402.04,
p < 0.001) groups, and Fiji→AlCl3 75 mg/L (
M = 801.10,
SD = 2051.49,
p < 0.001) groups. The AlCl3 300 mg/L→DI group had significantly lower average daily activity levels compared to the Fiji→AlCl3 75 mg/L group,
p < 0.001. There was not a significant difference between the AlCl3 at 75 mg/L before and after DI groups (
p = 1.00), as seen in
Tables S3 and S4 and
Figure 2A–D. The AlCl3 at Fiji→AlCl3 75 mg/L group had a significantly higher average daily activity rate compared to the DI→AlCl3 300 mg/L group,
p < 0.001. Overall, there were significant differences between the AlCl3 before and after DI groups and the AlCl3 before and after Fiji groups. There was also a significant difference between the AlCl3 before and after Fiji water groups. The AlCl3 75 mg/L before Fiji group had significantly higher average daily activity rates compared to the AlCl3 75 mg/L before and after DI groups. Additionally, the AlCl3 75 mg/L after Fiji group had significantly higher average daily activity levels compared to the AlCl3 75 mg/L before and after DI groups. The AlCl3 75 mg/L before Fiji group had significantly higher average daily activity rates compared to the AlCl3 75 mg/L after Fiji group. There were no significant differences between the AlCl3 75 mg/L before and after DI water groups.
There were also significant differences between the AlCl3 at 150 mg/L before and after DI and the AlCl3 at 150 mg/L before and after Fiji groups in average daily activity, as shown in
Tables S3 and S4 and
Figure 2A–D. The AlCl3 at 150 mg/L before Fiji group (
M = 1958.36,
SD = 3068.83) had significantly higher average daily activity rates compared to the AlCl3 at 150 mg/L before DI (
M = −338.41,
SD = 813.07,
p < 0.001) and AlCl3 at 150 mg/L after DI (
M = −214.79,
SD = −7.83) groups,
p < 0.001. There was not a significant difference between the AlCl3 at 150 mg/L before Fiji group and the AlCl3 at 150 mg/L after Fiji group (
M = 1592.61,
SD = 3151.64),
p = 1.00. The AlCl3 at 150 mg/L before DI group had significantly lower average daily activity levels compared to the AlCl3 at 150 mg/L after Fiji group,
p < 0.001. There was not a significant difference between the AlCl3 at 150 mg/L before DI group and the AlCl3 at 150 mg/L after DI group (
p = 1.00), as shown in
Tables S3 and S4 and
Figure 2A–D. The AlCl3 at 150 mg/L after Fiji group has a significantly higher average daily activity rate compared to the AlCl3 at 150 mg/L after DI group,
p < 0.001. Overall, there were significant differences between the AlCl3 before and after DI groups and the AlCl3 before and after Fiji groups. There was also a significant difference between the AlCl3 before and after Fiji water groups. The AlCl3 150 mg/L before Fiji group had significantly higher average daily activity rates compared to the AlCl3 150 mg/L before and after DI groups. Additionally, the AlCl3 150 mg/L after Fiji group had significantly higher average daily activity levels compared to the AlCl3 150 mg/L before and after DI group. There were no significant differences between the AlCl3 150 mg/L before and after DI water groups and the AlCl3 150 mg/L before and after Fiji groups.
The majority of the AlCl3 at 300 mg/L before and after DI and the AlCl3 at 300 mg/L before and after Fiji groups exhibited no significant differences in average daily activity rates, as shown in
Tables S3 and S4. There was only a significant difference between the AlCl3 at 300 mg/L before DI group (
M = −595.04,
SD = 809.19) and the ALCL3 at 300 mg/L after Fiji group (
M = 752.48,
SD = 2037.25) in average daily activity, as shown in
Tables S3 and S4 and
Figure 2A–D. The AlCl3 at 300 mg/L after DI group (
M = −371.71,
SD = 784.12) exhibited no significant differences in average daily activity rates compared to the AlCl3 at 300 mg/L after Fiji group,
p = 1.00. There was not a significant difference between the AlCl3 at 300 mg/L before Fiji group (
M = 248.77,
SD = 1550.81) and the AlCl3 at 300 mg/L before and after DI groups,
p = 1.00. There was also no significant difference between the AlCl3 at 300 mg/L before Fiji group and the AlCl3 at 300 mg/L after Fiji group. Additionally, there was no significant difference between the AlCl3 at 300 mg/L before DI group and the AlCl3 at 300 mg/L after DI group (
p = 1.00), as shown in
Tables S3 and S4 and
Figure 2A–D. There also was no significant difference between the AlCl3 at 300 mg/L after Fiji group compared to the AlCl3 at 300 mg/L after DI group,
p = 0.08. Overall, there was only a significant difference AlCl3 300 mg/L before DI group and the AlCl3 300 mg/l after Fiji group. The AlCl3 300 mg/L before DI group had significantly lower average daily activity rates compared to the AlCl3 300 mg/L after Fiji group. There were no significant differences between any of the other AlCl3 300 mg/L before or after DI groups and the other AlCl3 300 mg/L before or after Fiji water groups. There were also no significant differences between the AlCl3 300 mg/L before and after DI water groups and the AlCl3 300 mg/L before and after Fiji groups.
Additional single sample
t-test analyses were conducted utilizing the daytime and nighttime data to compare each of the experimental groups to a zero-baseline. The no aluminum experimental design control groups (Fiji water→DI water, DI water→Fiji water, and Fiji water 1) all had significantly higher average daily activity rates (
Table S3 and
Figure 2A) compared to the zero-baseline group. In comparison, the AlCl3→ DI (except for the AlCl3 25 mg/L→ DI) and DI→AlCl3 control groups along with the Fiji water 2 group had significantly lower average daily activity levels compared to the zero-baseline. Additionally, all but five of the aluminum treatments showed significantly decreased average daily activity regardless of whether the bees received Fiji water before or after exposure (
Table S3 and
Figure 2A–D). Bees in the AlCl3 25 mg/L→ Fiji, Fiji→ AlCl3 150 mg/L, and Fiji→ AlCl3 300 mg/L groups showed significantly higher than average daily activity rates compared to the zero-baseline (
Table S3). In addition, bees in the AlCl3 75 mg/L→ Fiji group exhibited no significant difference in average daily activity compared to the zero-baseline, as shown in
Table S3.
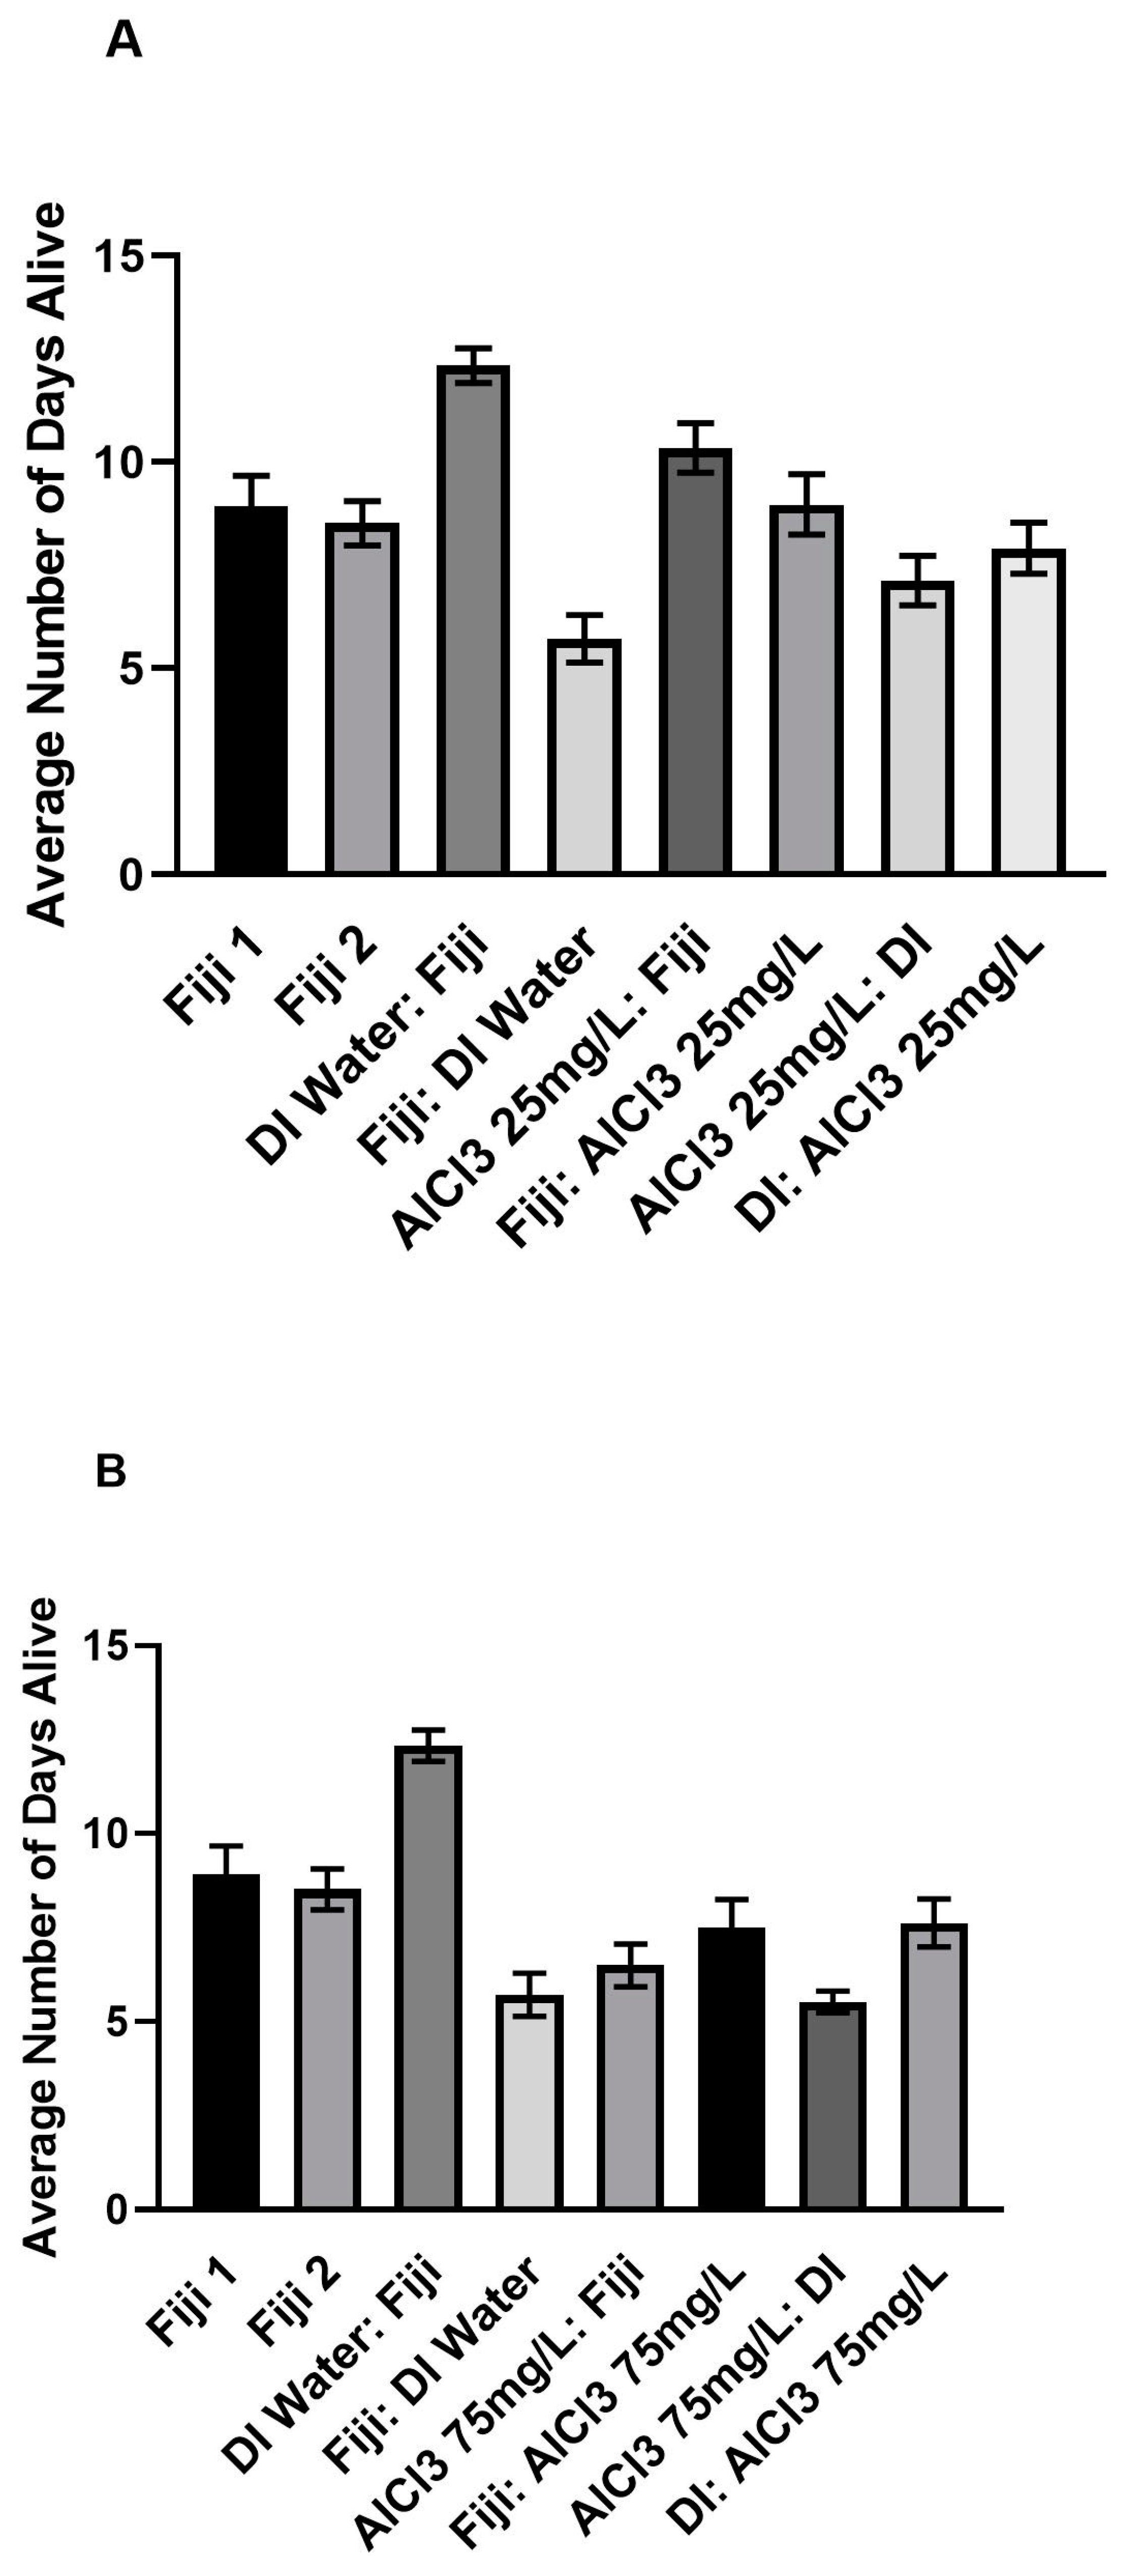
3.3. Mortality
The one-way ANCOVA test that compared all of the groups’ number of days alive with year as a covariate and experiment as a nested covariate was significant,
F(21, 828) = 13.67,
p < 0.001. Overall, the analysis showed that there were significant differences in the number of days alive between the groups. Post hoc tests revealed that on average, three of the AlCl3 groups that received Fiji water were alive significantly longer than their respective AlCl3 groups that received DI water. There was a significant main effect for experimental group,
F(19, 828) = 11.96,
p < 0.001. There was no significant main effect for year [
F(1, 828) = 0.19,
p = 0.663] or experiment cycle,
F(1, 828) = 2.26,
p = 0.134. Post hoc comparisons were run using a Bonferroni correction to compare the different groups, as shown in
Tables S5 and S6 and
Figure 3A–D and
Figure 4A–D.
Only three out of all of the post hoc comparisons within the ALCL3 concentration groups were significant, as shown in
Tables S5 and S6. The AlCl3 at 25 mg/L, 150 mg/L, and 300 mg/L groups each had one significant comparison. The AlCl3 at 75 mg/L was the only concentration that had no significant comparisons, as shown in
Figure 3B and
Figure 4B.
There was a significant difference in the number of days alive between the AlCl3 at 25 mg/L before Fiji and the AlCl3 at 25 mg/L before DI group after controlling for year and experiment cycle, as shown in
Tables S5 and S6,
Figure 3A and
Figure 4A. The AlCl3 at 25 mg/L before Fiji group (
M = 10.34,
SD = 3.39) were alive for significantly more days compared to the AlCl3 at 25 mg/L before DI group (
M = 7.13,
SD = 3.51),
p < 0.001. None of the other comparisons within the 25 mg/L concentration were significant, as shown in
Tables S5 and S6.
There was a significant difference in the number of days alive between the AlCl3 at 150 mg/L before DI and the AlCl3 at 150 mg/L after Fiji group after controlling for year and experiment cycle, as shown in
Tables S5 and S6,
Figure 3C and
Figure 4C. The AlCl3 at 150 mg/L before DI group (
M = 4.25,
SD = 3.60) were alive for significantly fewer days compared to the AlCl3 at 150 mg/L after Fiji group (
M = 9.53,
SD = 3.92),
p < 0.001. None of the other comparisons within the 150 mg/L concentration were significant, as shown in
Tables S5 and S6.
There was also a significant difference in the number of days alive between the AlCl3 at 300 mg/L before DI and the AlCl3 at 300 mg/L after Fiji group after controlling for year and experiment cycle, as shown in
Tables S5 and S6,
Figure 3D and
Figure 4D. The AlCl3 at 300 mg/L before DI group (
M = 4.88,
SD = 1.67) were alive for significantly fewer days compared to the AlCl3 at 300 mg/L after Fiji group (
M = 7.94,
SD = 2.36),
p = 0.008. None of the other comparisons within the 300 mg/L concentration were significant, as shown in
Tables S5 and S6.
The results of mortality comparisons within the 16-day time period indicated that bees in the AlCl3 at 150 mg/L after DI group (M = 4.25, SD = 3.60) had the most rapid mortality followed by the AlCl3 at 300 mg/L before (M = 4.88, SD = 1.67) and after DI (M = 4.88, SD = 1.16) groups. Overall, both the AlCl3 at 300 mg/L before and after DI groups were alive for an average of 4.88 days independently, which was lower than the AlCl3 at 300 mg/L after Fiji group (M = 7.94, SD = 2.36). Interestingly, bees in the DI water before Fiji group (M = 12.34, SD = 2.36) had the highest number of days alive of the Experimental control groups. In comparison, the Fiji 1 (M = 8.92, SD = 3.67) and Fiji 2 (M = 8.52, SD = 3.05) experimental control bees had the next highest average number of days alive. Overall, when comparing within concentration there were not a lot of significant differences in the number of days alive. However, when comparing between groups, there were significant differences between the experimental controls as well as different concentrations.


