Article

Comparative Mitogenome Analyses of Subgenera and Species Groups in Epeorus (Ephemeroptera: Heptageniidae)

1
The Key Laboratory of Jiangsu Biodiversity and Biotechnology, College of Life Sciences, Nanjing Normal University, Nanjing 210023, China
2
School of Life Sciences, Qufu Normal University, Qufu 273165, China
3
Nanjing Institute of Environmental Sciences, Ministry of Ecology and Environment/State Environmental Protection Scientific Observation, Nanjing 210042, China
*
Author to whom correspondence should be addressed.
Insects 2022, 13(7), 599; https://doi.org/10.3390/insects13070599
Submission received: 1 June 2022 / Revised: 28 June 2022 / Accepted: 28 June 2022 / Published: 30 June 2022

Abstract

:

Simple Summary

As one of the most species-rich genera of Ephemeroptera, Epeorus Eaton, 1881, was found to be widely distributed in Holarctic and Oriental regions, and nine subgenera have been reported. Previous phylogenetic studies of Epeorus were mainly focused on morphological characters or several gene fragments. Here, 15 mitogenomes of Epeorus are sequenced and the comparative mitogenome analysis of six subgenera is performed. The gene rearrangement of trnI-trnM-trnQ-NCR-ND2 was first found in the genus. In addition, differences in genetic composition and codon usage between the species with this kind of rearrangement and other Epeorus species were observed. Phylogenetic analyses show that three subgenera, Proepeorus, Belovius and Iron, are not monophyletic groups, and our results imply that gill structures are not always appropriate for the classification of subgenera in Epeorus.

Abstract

Epeorus Eaton, 1881 is a diverse mayfly genus in Heptageniidae comprising more than 100 species which are further divided into nine subgenera and several species groups. However, the classification and the phylogenetic relationships among them are still uncertain. Here, 15 complete mitochondrial genomes of Epeorus were sequenced and compared together with six available ones of same genus in the NCBI database. Based on morphological classification, the 21 mitogenomes were classified into six subgenera (Proepeorus, Epeorus s.str., Belovius, Iron, Caucasiron and Siniron) and four species groups (G1, G2, montanus and longimanus). Among all analyzed mitogenomes, the gene rearrangement of trnI-trnM-trnQ-NCR-ND2 was first found occurring in three species of group G1, whereas the gene block trnI-trnM-trnQ-trnM-ND2 was observed in all other mitogenomes of Epeorus. Furthermore, the genetic composition and codon usage of species in group G1 were also significantly different from all other Epeorus species, except group longimanus. The intergenic spacer between trnA and trnR, which has the stem-loop secondary structure, occurred in all 21 mitogenomes, and the sequences of stems and loops were conserved within species groups. Furthermore, the phylogenetic analyses strongly support the monophyly of all species groups, although three of six recognized subgenera Proepeorus, Belovius, and Iron, were shown as the non-monophyletic groups.

1. Introduction

Heptageniidae is known as one of the most species-rich families of mayfly (Ephemeroptera). They have dorsoventrally flattened nymphal bodies and are adapted to the aquatic habitats with swift currents [1]. Within this family, three subfamilies were taxonomically recognized: Ecdyonurinae, Heptageniinae and Rhithrogeninae [2,3]. Epeorus Eaton, 1881, a genus of the latter subfamily, has more than 100 described species all over the world, and most of them are distributed in Holarctic and Oriental regions [4,5,6,7,8]. Currently, nine subgenera and several species groups have been proposed for this genus [7,8,9,10,11]. Morphologically, the species of Epeorus can be divided into two types based on nymphal stage [9,10]: (1) Iron/g1 (see Kluge [10]), including subgenera Iron, Ironopsis, Caucasiron, Alpiron and Siniron, has a “suction disc” structure formed by gill lamellae; (2) all other species containing the subgenera Epeorus s.str., Proepeorus, Belovius and Albertiron are without the “suction disc”. Although the phylogenetic relationships within Epeorus have been investigated using morphological characters or a few gene fragments in some studies [9,10,11], the monophyly of those subgenera and species groups as well as their phylogeny are still controversial.
In recent years, more species and intermediate types of genus Epeorus have been reported, especially for the subgenus Proepeorus, a taxon characterized by plesiomorphies only [8]. Among Chinese Proepeorus species, two distinct groups were proposed, since they are significantly different from the type species: the (1) “single-spine” group (nymphs with single spines on abdominal terga, defined as species group “G1” in this work), and the (2) “paired-spines” group (nymphs have paired spines on abdominal terga, defined as species group “G2” here). The former group is similar to group longimanus (a species group of subgenus Iron [12]) morphologically, whereas the latter one resembles the subgenus Siniron, which also has “paired-spines”. Thus, more evidence is needed to confirm the definition of these subgenera and clarify their phylogenetic relationships.
The mitochondrial genome is an important molecular marker that has been widely used to study the phylogenetic relationship of insects and other animal groups [13,14,15]. It contains 37 genes: 13 protein-coding genes (PCGs), 2 ribosomal RNA genes (rRNAs), 22 transfer RNA genes (tRNAs), and the A+T-rich region (or called control region, CR) [16,17]. The gene rearrangements and long non-coding regions (NCR) (or intergenic spacer, IGS) could also bring important information to the phylogenetic analyses [18,19,20]. The studies on the mitochondrial genomes of Ephemeroptera and Heptageniidae have increased in recent years [18,19,21,22,23]. The duplication of trnM has been observed in all reported mitochondrial genomes of Rhithrogeninae and Ecdyonurinae species (except Paegniodes cupulatus), and the genes were arranged as CR-trnI-trnM-trnQ-trnM-ND2, and another rearrangement (CR-trnI-trnM-trnQ-NCR-ND2) was reported in the Heptageniinae species [18,19,24,25,26]. In addition, a conserved intergenic spacer (IGS) between trnA and trnR was also observed in all heptageniid species [18,19]. For Epeorus, there are currently 16 published mitochondrial genomes, of which only seven species have been identified in GenBank. Hence, the phylogenetic relationship and comparison between the subgenera and species groups within Epeorus based on mitogenome data are still poorly understood.
Here, 21 complete mitogenome sequences belonging to six subgenera of Epeorus were compared and analyzed, including six previously reported ones and 15 newly obtained sequences in this work. The mitogenomic features of different subgenera or species groups within Epeorus were compared and their phylogenetic relationships were also reconstructed. The results can not only expand our knowledge on the mitogenomic features of Heptageniidae and Epeorus, but also provide new information for the definition of the subgenus within Epeorus.

2. Materials and Methods

2.1. Sample Collection, Identification and DNA Extraction

All specimens were collected in China between 2014–2021 (see Table S1). The morphological identification was based on Kluge [10] and Ma et al. [7,8]. All samples were preserved in 100% ethanol and stored at −20 °C in the Mayfly Collection of Nanjing Normal University. The genomic DNA was extracted from the muscle tissue of each species using TIANamp Genomic DNA Kit (TIANGEN, Beijing, China). DNA concentrations were determined by Nanodrop 2000 spectrophotometer.

2.2. Mitogenome Sequencing and Assembly

The genomic DNA of all species was sequenced using next-generation sequencing (NGS) on Illumina NovaSeq platform. TruSeqTM DNA Sample Prep Kit was used for library construction of each sample (insert size 400 bp). All libraries were then sequenced based on the PE150 mode (paired-end, 2 × 150 bp). More than 4GB raw data of each sample were trimmed so that adapter contamination, short and low-quality reads were removed using Fastp [27]. NOVOPlasty 4.2.1 was used for the de novo assembly of mitogenome [28], with the parameter k-mer = 33 and the COI gene of Epeorus dayongensis (accession number: MT112895) as the seed sequence. In order to verify the accuracy of NGS sequencing results, three gene fragments of all 15 samples were sequenced using Sanger sequencing: fragment of COI, fragment of rrnL, and fragment containing block (trnI-trnM-trnQ-trnM/NCR-ND2). Two pairs of general primers were used for the first two fragments, and fifteen pairs of specific primers were designed for the last one (shown in Table S5) [29,30]. r-Taq polymerase (Takara, Beijing, China) was used for the polymerase chain reaction (PCR) based on the method of Yanai et al. [31].

2.3. Mitogenome Annotation and Analyses

The mitogenomes were annotated using MITOS WebServer initially [32], and checked by alignments with available sequences of Epeorus from GenBank using ClustalW in MEGA11 [33]. The secondary structures of tRNAs were determined using tRNAscan-SE 2.0 and MITOS WebServer [34]. The circular maps of mitogenomes were portrayed using the visualize module of MitoZ [35].
Nucleotide composition and relative synonymous codon usage (RSCU) were calculated using MEGA11 [33]. The AT-skew and GC-skew were calculated by the formulas: AT-skew = (A − T)/(A + T) and GC-skew = (G − C)/(G + C) [36]. A sliding window analysis of 200 bp (step size 20 bp) was used to estimate nucleotide diversity (Pi) of 13PCGs by DnaSP V6 [37]. Genetic distances of the mitogenomes of Epeorus species were estimated using MEGA11 based on Kimura 2-parameter model [38]. The ratio of non-synonymous/synonymous rate (ratio of Ka/Ks) of 13 PCGs was conducted by DnaSP V6.

2.4. Phylogenetic Analysis

A total of 24 mitogenomes of Heptageniidae were used for the phylogenetic reconstruction, including two species of Ecdyonurinae and one species of Rhithrogeninae as out groups. A total of 15 newly sequenced mitogenomes and 6 available mitogenomes of Epeorus were selected as the ingroup taxa. All sequences of Epeorus used in this work have been morphologically identified, and their subgenera have been confirmed. We also found that Epeorus bifurcatus (GenBank accession number: MW381293) reported previously should be identified as Epeorus falcatus according to the morphological characters [8], and it has been modified in this work (Table 1). Some other available mitochondrial genomes of Epeorus were not used in this work because we cannot guarantee the accuracy of their morphological identification.
The nucleotide sequences of 13 PCGs were aligned with MAFFT [39] L-INS-i (accurate) strategy and codon alignment mode in PhyloSuite v1.2.2 [40]. Sequences of rRNAs were aligned with MAFFT [39] G-INS-i (accurate) strategy. The ambiguously sites of all alignments were removed using Gblocks 0.91b [41]. Individual genes were than concatenated using PhyloSuite v1.2.2. Two datasets were used for the reconstruction of phylogenetic relationship: the (1) PCGs matrix, including all codon positions of 13 protein-coding genes; and the (2) PR matrix, containing 13 PCGs and two rRNAs. For the phylogenetic reconstruction, Bayesian Inference (BI) and Maximum Likelihood (ML) analyses were performed based on both datasets. The partition model of each dataset was selected by the PartitionFinder2 based on BIC (Bayesian information criterion) criterion and greedy algorithm (Tables S6 and S7) [42]. BI phylogenies were reconstructed using MrBayes 3.2.6 through online CIPRES Science gateway [43,44], with the following settings: two parallel runs with four Markov chains were run for 10 million generations (with sample frequency of 1000), with a burn-in of 25% trees. RAxML 8.2.0 were used for ML analyses, with the model of GTRGAMMAI and 1000 bootstrap replicates [45]. FigTree 1.4.2 (http://tree.bio.ed.ac.uk/software/figtree/; accessed on 5 July 2021) was used for the edit of phylogenetic trees.

3. Results and Discussion

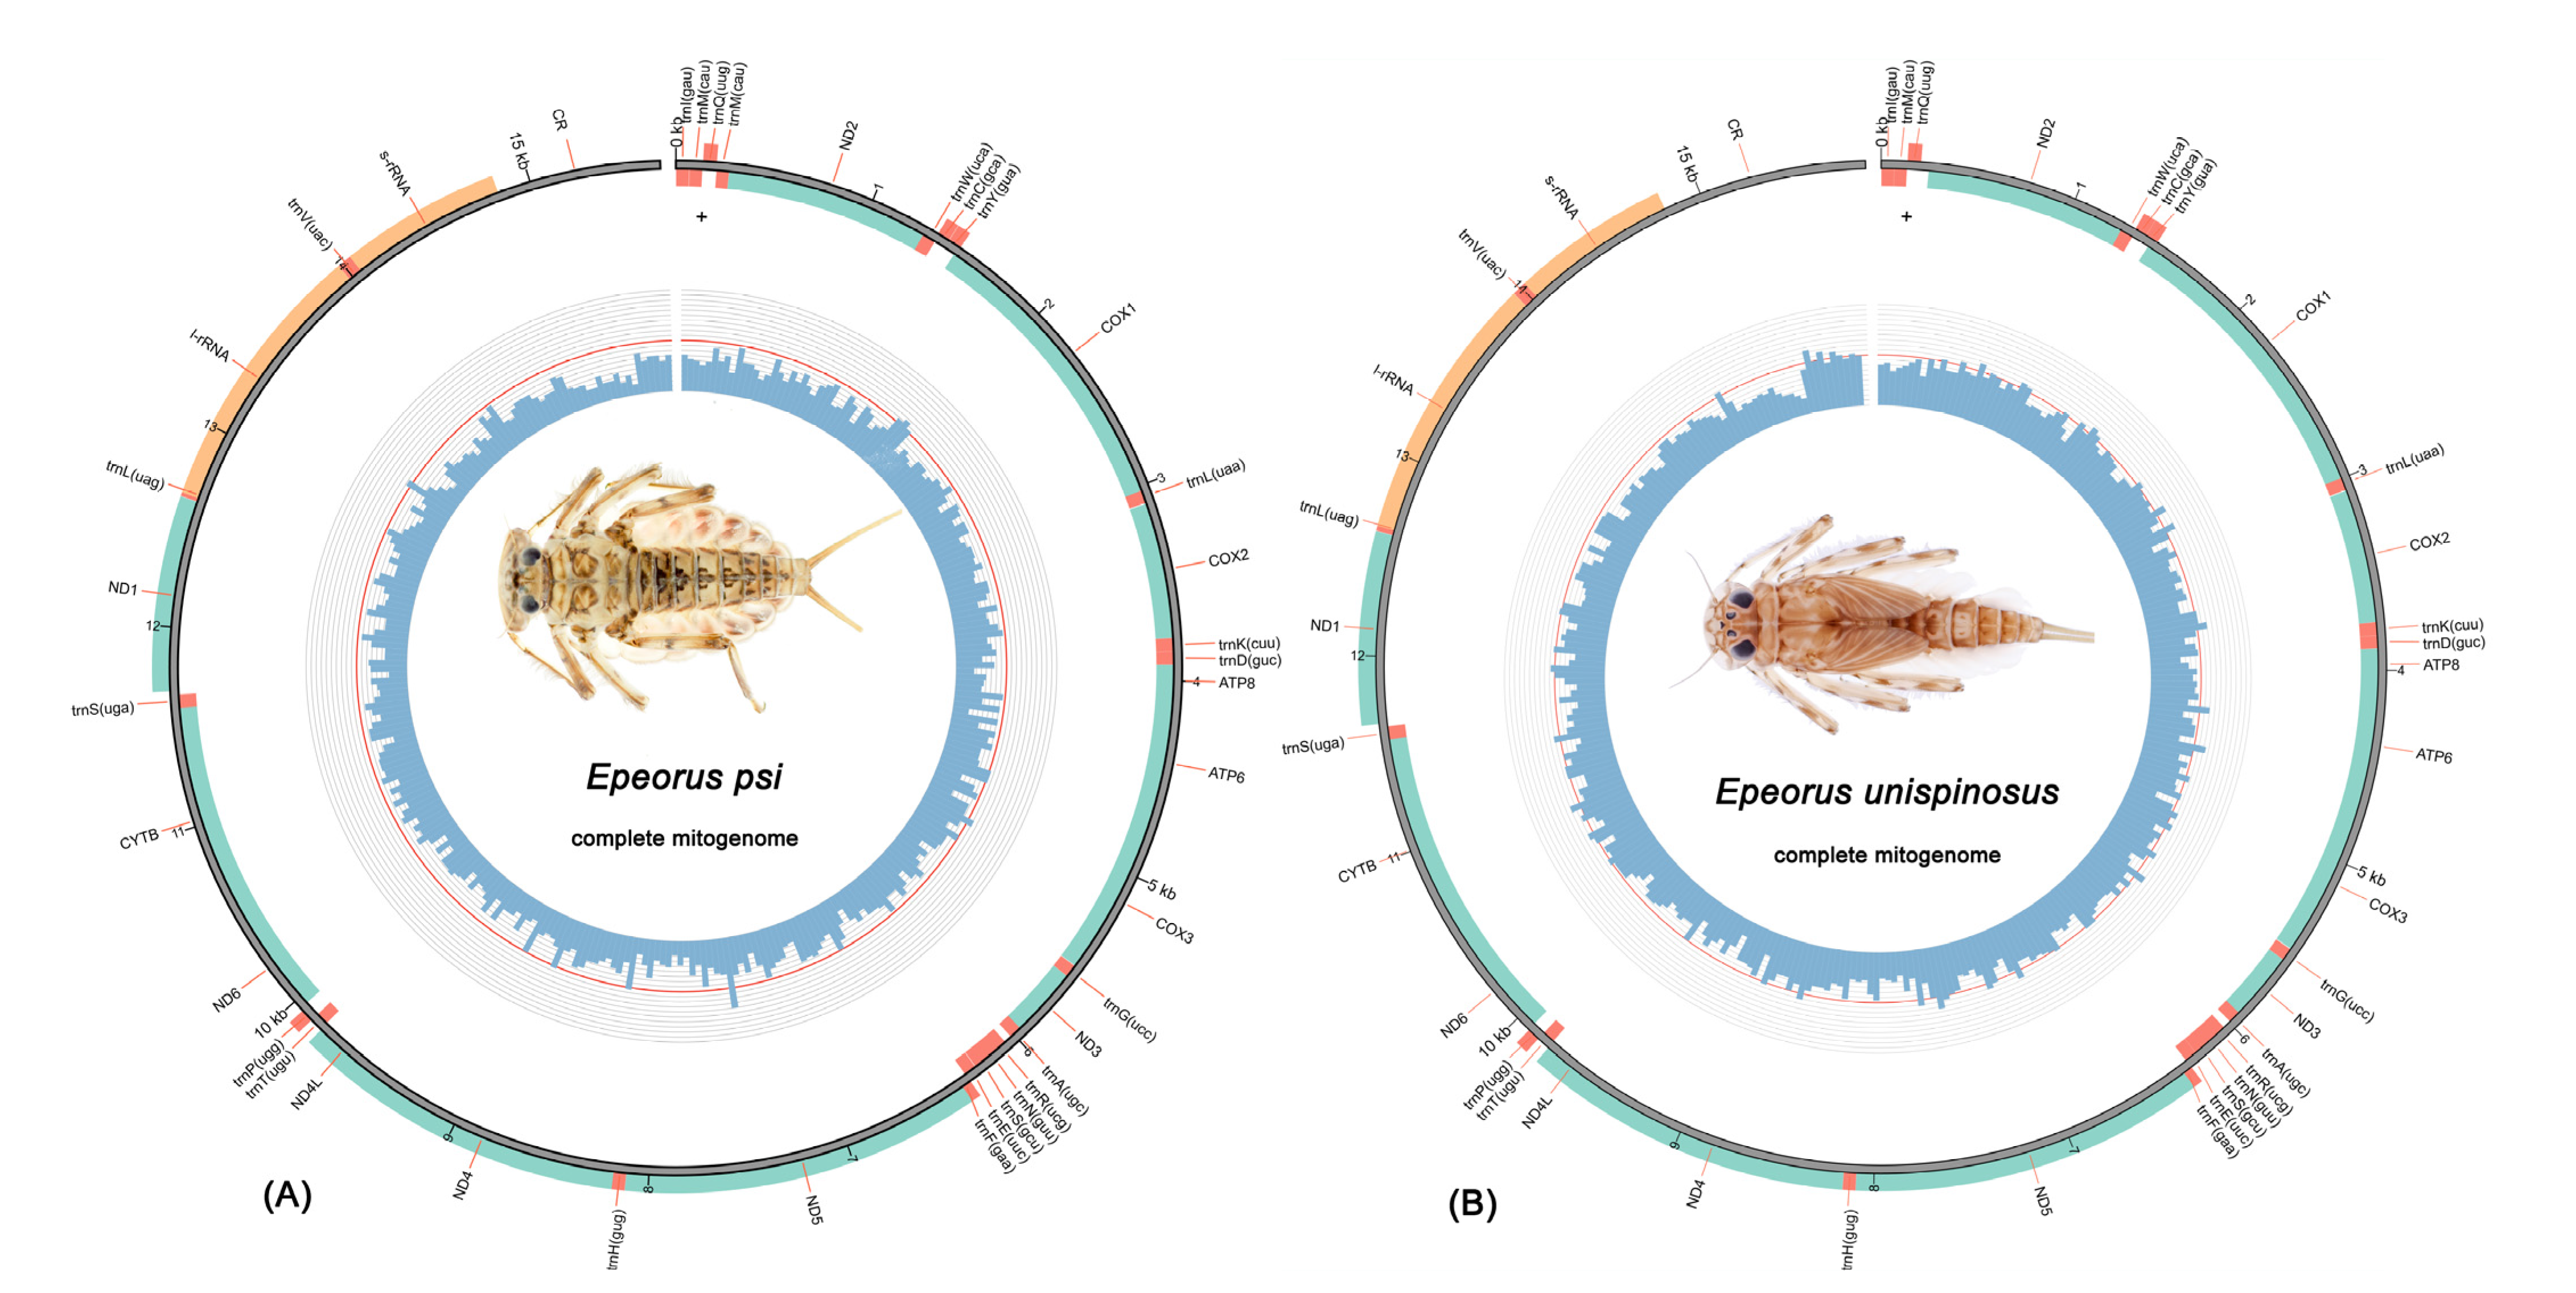
3.1. Mitogenome Organization and Composition

All mitogenomes of 15 new samples were sequenced and compared with 6 available mitogenomes of Epeorus, and all sequences were deposited in GenBank (GenBank accession number: OK495692–OK495706). The total lengths of the 21 mitogenomes ranged from 15,338 bp (Epeorus carinatus) to 15,849 bp (Epeorus unispinosus), and the variation was mainly caused by the different sizes of CRs (Table S2). Three mitogenomes of species group G1 (E. gibbus, E. unispinosus and E. sp. 1) contained 37 genes (13 PCGs, 22 tRNAs and two rRNAs), whereas all other mitogenomes of Epeorus comprised an additional trnM (13 PCGs, 23 tRNAs and two rRNAs), which conformed to most Heptageniidae reported previously [18,19] (Figure 1). Among all mitogenomes, most genes (9 PCGs and 14 or 15 tRNAs) were encoded on the major strand, and the remaining genes were encoded on the minor strand.
In addition to the genetic composition, the A + T content of group G1 was also significantly different from other Epeorus species (except E. alexandri, group longimanus). For most Epeorus species, the A + T content ranged from 63.8% (E. rhithralis, group G2) to 67.8% (E. herklotsi, Siniron); whereas in group G1 and longimanus (E. alexandri), the A + T content ranged from 57.7% (E. unispinosus) to 59.9 % (E. alexandri) (Figure 2). Similar variations of A + T content also occurred in PCGs and CR (Table S2). Additionally, most mitogenomes of Epeorus showed negative AT-skews (−0.028 to −0.0002), except for group G1 (0.03 to 0.045), longimanus (0.01), and Epeorus aculeatus (0.005). The GC-skews of all mitogenomes were obviously negative (−0.206 to −0.315) (Table S2).
In summary, group G1 is different from other Epeorus species in terms of genetic composition, A + T content, and AT-skews. Among other species of Epeorus, the closest one to group G1 is E. alexandri (group longimanus), and this is also consistent with the morphological characters: species of group G1 possess similar mouthparts and genitalia to species of group longimanus [8].

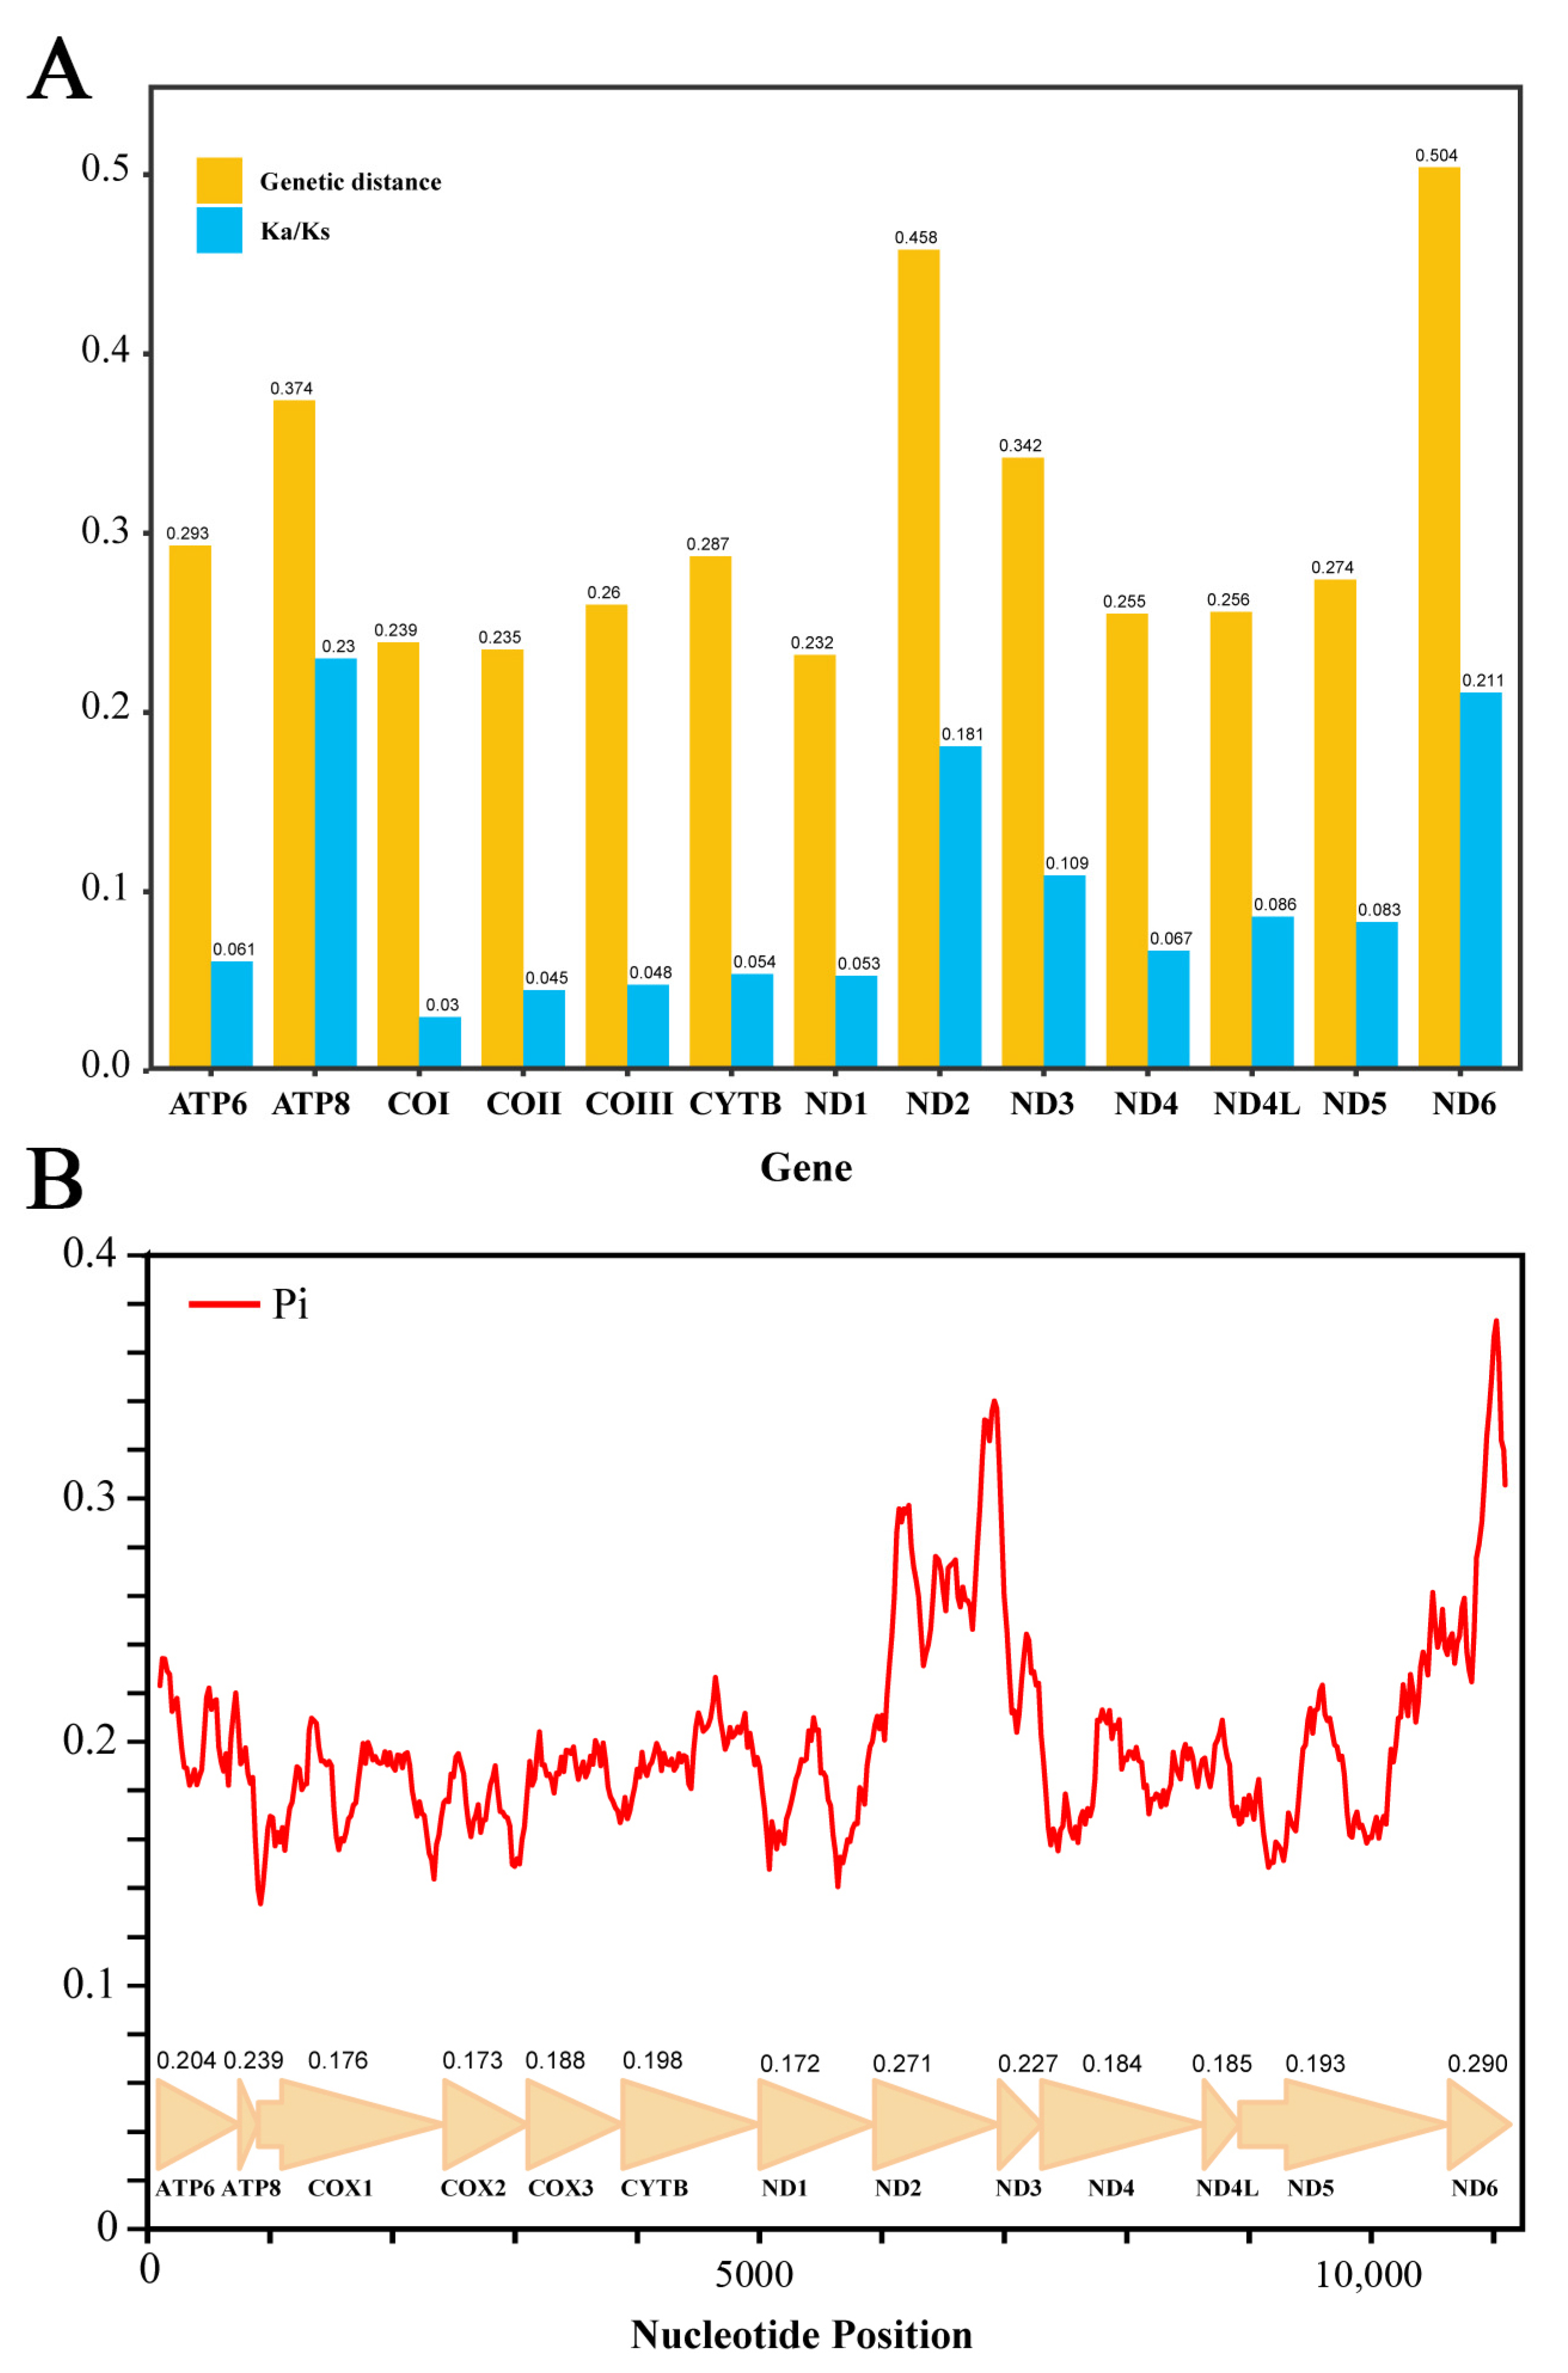
3.2. Analysis of Protein-Coding Genes

The total length of PCGs for the majority of Epeorus mitogenomes was 11,217 bp, except for E. gibbus (11,215 bp), E. unispinosus (11,229 bp), and E. sp.1 (11,226 bp). Both the AT-skews and GC-skews of all samples were negative (Table S2), and this is consistent with most heptageniids in previous studies [18,19]. The start codons of most PCGs were conservative in Epeorus species (Table S3), containing ATG (COII, COIII, CYTB, ND1, ND4, ND4L), ATA (ATP6), and ATT (COI). For ATP8, ND2, and ND5, two types of start codons were found (ATG, GTG). The start codon ATC was only found in ND3 of five species (E. gibbus, E. sp. 1, E. alexandri, E. dayongensis, and E. tuberculatus), whereas ATG was used as the start codon of ND3 only in Epeorus s.str. (E. melli and E. sp. 2) and E. carinatus. TTG was used as the start codon only in ND6 of E. unispinosus. Most PCGs stopped with TAA or TAG codons, and the incomplete terminating codon T was only found in COII, ND4, ND5, and CYTB, and it was consistent with the heptageniid mitogenomes sequenced previously [18,19]. The relative synonymous codon usage (RSCU) of 21 Epeorus mitogenomes was calculated and compared (Table S4, Figure 3). The RSCU values of several codons like CUC (Leu1), CCC (Pro), AGC (Ser1), AGG (Ser1), and GGC (Gly) in group G1 and longimanus were significantly greater than that of all other Epeorus, and this is consistent with the relatively higher C + G contents in PCGs of group G1 and longimanus.
The nucleotide diversity (Pi) of 13 aligned PCGs among all 21 mitogenomes was calculated by a sliding window analysis (Figure 4). In all PCGs, ND6 (Pi = 0.29), ND2 (Pi = 0.271), and ATP8 (Pi = 0.239) were showing a relatively high nucleotide diversity, whereas the ND1 (Pi = 0.172), COI (Pi = 0.176), and COII (Pi = 0.173) had comparatively low Pi value. Moreover, the pairwise genetic distances of these 13 PCGs also showed a similar result: ND2, ND6, and ATP8 have high average values of distances, whereas ND1, COII, and COI showed relatively low distance values (Figure 4). Furthermore, the ratio of Ka/Ks was calculated to estimate the selective pressure of all 13 PCGs. Here, all the PCGs evolved under a purifying selection (Ka/Ks < 0.5) ranged from a strongly purifying selection (0.03 of COI and 0.045 of COII) to a relaxed purifying selection (0.23 of ATP8, 0.21 of ND6, and 0.18 of ND2) (Figure 4). The results of nucleotide diversity, genetic distance, and ratios of Ka/Ks of Epeorus showed similar tendency with the analyses of Heptageniidae [18]. As the relatively conserved genes with a slow evolution rate, COI, COII, and ND1 could be selected as potential barcoding markers for species identification in Epeorus.

3.3. Transfer and Ribosomal RNA Genes

Except for the three species of group G1, all other Epeorus have an additional trnM besides 22 typical tRNAs genes. The length of tRNAs ranged from 63 to 71 bp, and all of them were folded into the typical clover-leaf secondary structure, except trnS1. As observed in other insects and Ephemeroptera, the DHU arm were also missing in trnS1 of all Epeorus mitogenomes. Two rRNAs were encoded on the N-strand in all 21 mitogenomes. The rrnL was located between trnL1 and trnV, with the sizes ranging from 1272 to 1284 bp. The rrnS was located between trnV and control region, and the sizes ranged from 779 to 787 bp. This indicates that the sizes of the rrnL of three species in Siniron (from 1272 to 1273 bp) were significantly smaller than that of all other Epeorus mitogenomes (from 1279 to 1284 bp), which might be a feature that can be used to identify the subgenus Siniron.

3.4. Non-Coding Regions

The non-coding regions of mitogenomes of Epeorus consist of control regions and several IGSs. The control region of Epeorus mitogenomes is located between rrnS and trnI genes, and is the longest non-coding region in the whole mitogenome. The total length of CR of 21 mitogenomes ranged from 504 (E. carinatus) to 1042 bp (E. unispinosus). Similar to the case of the A + T contents in total mitogenomes and PCGs, the A + T contents in CR of group G1 and longimanus (range from 58.9% to 67.8%) were also obviously smaller than other Epeorus mitogenomes (range from 72.8% to 78.9%) (Table S2). Moreover, compared to other genera in Heptageniidae [18,19], only the Epeorus species had a relatively high A + T contents in the control region, which is always <70% in other Heptageniidae species.
The long IGS between trnA and trnR is seen as the molecular synapomorphy of the family Heptageniidae [18,19], and it was also observed in all 21 Epeorus mitogenomes, with lengths ranging from 33 to 46 bp. They can be folded as stem-loop secondary structures (Figure 5). By comparing the IGSs of all 21 mitogenomes, we found that the sequences of stems and loops are variable between different species within a certain subgenus (except Siniron) but conserved within species groups or species (Figure 5B). It seems that the IGS between trnA and trnR may be a useful marker for the identification of species group (or species) in Epeorus.

3.5. Gene Arrangement

According to the previous studies of heptageniid mitogenomes, only one species (Paegniodes cupulatus) had the gene arrangement that identifies with the ancestral gene order, and all other mitogenomes of Rhithrogeninae and Ecdyonurinae species have an extra trnM between trnQ and ND2, forming the gene cluster (CR-trnI-trnM-trnQ-trnM-ND2). In addition, another rearrangement (CR-trnI-trnM-trnQ-NCR-ND2) was only found in the species of Heptageniinae. In other words, until now, only two types of gene rearrangements have been observed in Heptageniidae [18,19].
In this work, most mitogenomes of Epeorus had the extra trnM and the gene block (CR-trnI-trnM-trnQ-trnM-ND2), which agreed with the previous research. Moreover, the other rearrangement was also first found in Epeorus (only for the three species of group G1): the trnM between trnQ and ND2 was replaced by a non-coding region (range from 39 to 41 bp), forming the gene cluster (CR-trnI-trnM-trnQ-NCR-ND2), which previously only occurred in species of Heptageniinae. Similar to other species of Heptageniinae [19], the NCR between trnQ and ND2 in groups G1 also showed a low similarity to other adjacent genes, and the sequences were not conserved among the three species in group G1. Therefore, we assume that the NCR between trnQ and ND2 in group G1 was the sequence formed by the loss of trnM. It seems that the same gene cluster (CR-trnI-trnM-trnQ-NCR-ND2) in the mitogenomes of Epeorus and Heptageniinae were formed independently and should be regarded as the convergent evolution or homoplasy between these two taxa. A similar inversion in trnI-trnQ-trnM (ancestral order) for trnI-trnM-trnQ also occurs in 5 other different orders [46].

3.6. Phylogenetic Relationship

The two phylogenetic trees (BI and ML) based on dataset PCGs have the same topology as the ML tree of dataset PR (Figure 6). Moreover, the position of E. pellucidus in the BI tree of dataset PR is different from the former three analyses (Figure S1). The monophyly of genus Epeorus was highly supported in all analyses, and each tree was divided into two main clades: group G1 + group G2 + Siniron + group montanus + group longimanus + Caucasiron + E. pellucidus (clade A) and Epeorus s.str. + E. carinatus (clade B) (Figure 6). The monophyly of the two main clades were well supported in all trees but two species of Belovius (E. carinatus and E. pellucidus) were placed into different clades. In previous studies, the identification of Belovius was mainly based on the structure of the gills in the nymphal stage, whereas the characters of adults were often overlooked [10]. Here, we found that E. carinatus can be clustered with Epeorus s.str. based on the similar structure of the penis (without titillators, the imaginal characters of E. carinatus is according to unpublished data) in the adult stage, whereas all species of clade A (including E. pellucidus) possessed the titillators (Figure 6). Moreover, the two-clades pattern was also reflected in the start codon of ND3; ATG was only used as the start codon in clade B, whereas ATT and ATC were used as the start codons of all species in clade A (Table S3).
Within clade A, the position of E. pellucidus was unstable, in that, both topologies were not well supported in the node containing this species (Figure 6, Figures S1 and S2). Consequently, more samples of the Belovius species in further research were needed to confirm this place with confidence. The monophyly of all species groups in clade A were highly supported in all analyses (Figure 6, Figures S1 and S2). Group longimanus clustered with group G1 consistently, and this coincided with the morphological evidence proposed in Ma et al. [8]. In addition, these two groups were also very close in terms of the A + T content and codon usage bias, which were significantly different from all other Epeorus in this work. Moreover, group G2 was highly supported as the sister clade to the subgenus Siniron, and this also verified the hypothesis that the character of “paired spines” on abdominal terga in nymphs is the synapomorphy of these two lineages. Group montanus clustered with Caucasiron in all analyses but was only well supported in BI tree based on the PCG dataset, whereas the monophyly of Siniron + group G2 + group montanus + Caucasiron was well supported in all analyses.
Except for Caucasiron, Siniron and Epeorus s.str., all other subgenera involved in this work were shown as non-monophyletic groups according to the phylogenetic trees reconstructed here (Figure 6). The result implies that gill structures or characters were not always appropriate for the classification of subgenera. A similar result was also obtained by Hrivniak et al. [11], who found that the “suction disc” of the gill structure is a homoplasy of several unrelated lineages according to the phylogenetic analysis based on five gene fragments. Thus, for the definition or classification of subgenera within Epeorus, a comprehensive consideration of more morphological features (e.g., mouthparts, abdominal spines and genitalia of adults) and molecular evidence is necessary.

4. Conclusions

In this study, 21 mayfly mitogenomes (including 15 newly sequenced) of the genus Epeorus were analyzed and compared. The rearrangement of trnI-trnM-trnQ-NCR-ND2, which was observed only in the species of subfamily Heptageniinae previously, was first found in Epeorus (Rhithrogeninae), but restricted to species group G1 (nymphal terga with single median spine). Furthermore, the genetic composition and codon usage bias of species in group G1 also displayed distinct differences compared with all other Epeorus species, except group longimanus. The close relationship between group G1 and longimanus was also strongly supported by the phylogenetic topologies. Moreover, the monophyly of all species groups and cluster of group G2 (nymph with a pair of abdominal spines on terga) + subgenus Siniron also had strong branch support. In contrast, three subgenera (Proepeorus, Iron, and Belovius) were found to be non-monophyletic. It seems that the traditional morphological features (such as the gill structure of nymphs) used in the classification of subgenera in Epeorus should be updated and molecular evidence should also be considered in defining a subgenus in future works.

Supplementary Materials

The following supporting information can be downloaded at: https://www.mdpi.com/article/10.3390/insects13070599/s1, Figure S1: Phylogenetic relationships of Epeorus constructed by BI method based on datasets PR, node numbers represent the values of posterior probability; Figure S2: Phylogenetic relationships of Epeorus constructed by ML method based on datasets PR, node numbers represent the values of bootstrap; Table S1: Collection of information of Epeorus species in this study; Table S2: Nucleotide composition of 21 Epeorus mitogenomes; Table S3: Start and stop codons of 13 PCGs; Table S4: Codon count and relative synonymous codon usage (RSCU) of 21 Epeorus mitogenomes; Table S5: Primers for mitogenomes of Epeorus used in this study; Table S6: Partition schemes and best-fitting models selected in PCG dataset; Table S7: Partition schemes and best-fitting models selected in PR dataset.

Author Contributions

Conceptualization, C.Z. and Z.M.; methodology, Z.M. and R.L.; software, Z.M. and R.L.; validation, X.Z.; formal analysis, Z.M. and R.L.; investigation, Z.M., B.Z. and X.Z.; data curation, Z.M.; writing—original draft preparation, Z.M.; writing—review and editing, C.Z. and R.L.; visualization, Z.M. and R.L.; supervision, C.Z.; project administration, C.Z.; funding acquisition, C.Z. All authors have read and agreed to the published version of the manuscript.

Funding

This work was supported by the National Natural Science Foundation of China, grant numbers 31750002 and 32070475; the Priority Academic Program Development of Jiangsu Higher Education Institutions (PAPD); the key projects of science-technology basic condition platform from The Ministry of Science and Technology of the People’s Republic of China, grant number 2005DKA21402; Project of Biological Resources Survey in Wuyishan National Park; the Biodiversity Survey and Assessment Project of the Ministry of Ecology and Environment of China, grant number 2019HJ2096001006.

Institutional Review Board Statement

Not applicable.

Informed Consent Statement

Not applicable.

Data Availability Statement

The data that support the findings of this study are openly available in National Center for Biotechnology Information at https://www.ncbi.nlm.nih.gov/nuccore (accessed on 1 December 2021), reference numbers OK495692–OK495706.

Acknowledgments

We would like to thank Xiaohan Shu for creating Figure 3.

Conflicts of Interest

The authors declare no conflict of interest.

References

  1. Ditsche-Kuru, P.; Koop, J.H.E. New insights into a life in current: Do the gill lamellae of Epeorus assimilis and Iron alpicola larvae (Ephemeroptera: Heptageniidae) function as a sucker or as friction pads? Aquat. Insects 2009, 31, 495–506. [Google Scholar] [CrossRef]
  2. Wang, T.Q.; McCafferty, W.P. Heptageniidae (Ephemeroptera) of the world. Part I: Phylogenetic higher classification. T. Am. Entomol. Soc. 2004, 130, 11–45. [Google Scholar]
  3. Webb, J.M.; McCafferty, W.P. Heptageniidae of the world. Part II. Key to the genera. Can. J. Arthropod Ident. 2008, 7, 1–55. [Google Scholar]
  4. Sartori, M.; Brittain, J.E. Order Ephemeroptera. In Ecology and General Biology: Thorp and Covich’s Freshwater Invertebrates; Thorp, J., Rogers, D.C., Eds.; Academic Press: Salt Lake City, UT, USA, 2015; pp. 873–891. [Google Scholar]
  5. Sivaruban, T.; Barathy, S.; Arunchalam, M.; Venkataraman, K.; Sivaramakrishnan, K.G. Epeorus petersi, a new species of Heptageniidae (Ephemeroptera) from the Western Ghats of southern India. Zootaxa 2013, 3731, 391–394. [Google Scholar] [CrossRef] [Green Version]
  6. Boonsoong, B.; Braasch, D. Heptageniidae (Insecta, Ephemeroptera) of Thailand. ZooKeys 2013, 272, 61–93. [Google Scholar] [CrossRef] [Green Version]
  7. Zhenxing, M.; Changfa, Z. A new subgenus of Epeorus and its five species from China (Ephemeroptera: Heptageniidae). Insect Syst. Evol. 2022, 53, 264–303. [Google Scholar] [CrossRef]
  8. Ma, Z.X.; Lei, Z.M.; Li, W.J.; Zhou, C.F. A revision of Epeorus (Proepeorus) in China, with descriptions of two new species (Ephemeroptera, Heptageniidae). J. Nat. Hist. 2021, 55, 1131–1159. [Google Scholar] [CrossRef]
  9. Braasch, D. Neue Eintagsfliegen der Gattungen Epeorus und Iron aus dem Himalaja (Ephemeroptera, Heptageniidae). Entomol. Nachr. Und Ber. 2006, 50, 79–88. [Google Scholar]
  10. Kluge, N.J. Phylogenetic System of Ephemeroptera; Kluwer Academic Publishers: Dordrecht, The Netherlands, 2004; p. 442. [Google Scholar]
  11. Hrivniak, Ľ.; Sroka, P.; Bojková, J.; Godunko, R.J.; Soldán, T.; Staniczek, A.H. The impact of Miocene orogeny for the diversification of Caucasian Epeorus (Caucasiron) mayflies (Ephemeroptera: Heptageniidae). Mol. Phylogenet. Evol. 2020, 146, 106735. [Google Scholar] [CrossRef]
  12. Kluge, N.J.; Tiunova, T.M. Palearctic mayflies of the group longimanus of the subgenus Iron of Epeorus (Ephemeroptera, Heptageniidae). Vestn. Zool. 1989, 4, 7–14. [Google Scholar]
  13. Yan, L.; Xu, W.; Zhang, D.; Li, J. Comparative analysis of the mitochondrial genomes of flesh flies and their evolutionary implication. Int. J. Biol. Macromol. 2021, 174, 385–391. [Google Scholar] [CrossRef] [PubMed]
  14. Kobayashi, G.; Itoh, H.; Fukuda, H.; Kojima, S. The complete mitochondrial genome of the sand bubbler crab Scopimera globosa and its phylogenetic position. Genomics 2021, 113, 831–839. [Google Scholar] [CrossRef] [PubMed]
  15. Yu, P.; Zhou, L.; Yang, W.T.; Miao, L.J.; Li, Z.; Zhang, X.J.; Wang, Y.; Gui, J.F. Comparative mitogenome analyses uncover mitogenome features and phylogenetic implications of the subfamily Cobitinae. BMC Genom. 2021, 22, 50. [Google Scholar] [CrossRef] [PubMed]
  16. Boore, J.L. Animal mitochondrial genomes. Nucleic Acids Res. 1999, 27, 1767–1780. [Google Scholar] [CrossRef] [Green Version]
  17. Cameron, S.L. Insect mitochondrial genomics: Implications for evolution and phylogeny. Annu. Rev. Entomol. 2014, 59, 95–117. [Google Scholar] [CrossRef] [Green Version]
  18. Li, R.; Lei, Z.M.; Li, W.J.; Zhang, W.; Zhou, C.F. Comparative Mitogenomic Analysis of Heptageniid Mayflies (Insecta: Ephemeroptera): Conserved Intergenic Spacer and tRNA Gene Duplication. Insects 2021, 12, 170. [Google Scholar] [CrossRef]
  19. Xu, X.D.; Guan, J.Y.; Zhang, Z.Y.; Cao, Y.R.; Cai, Y.Y.; Storey, K.B.; Yu, D.N.; Zhang, J.Y. Insight into the phylogenetic relationships among three subfamilies within Heptageniidae (Insecta: Ephemeroptera) along with low-temperature selection pressure analyses using mitogenomes. Insects 2021, 12, 656. [Google Scholar] [CrossRef]
  20. Du, C.; Zhang, L.; Lu, T.; Ma, J.; Zeng, C.; Yue, B.; Zhang, X. Mitochondrial genomes of blister beetles (Coleoptera, Meloidae) and two large intergenic spacers in Hycleus genera. BMC Genom. 2017, 18, 698. [Google Scholar] [CrossRef]
  21. Li, R.; Zhang, W.; Ma, Z.X.; Zhou, C.F. Novel gene rearrangement pattern in the mitochondrial genomes of Torleya mikhaili and Cincticostella fusca (Ephemeroptera: Ephemerellidae). Int. J. Biol. Macromol. 2020, 165, 3106–3114. [Google Scholar] [CrossRef]
  22. Li, R.; Zhang, W.; Ma, Z.X.; Zhou, C.F. First complete mitogenomes of three mayflies in the genus Afronurus (Ephemeroptera: Heptageniidae) and their implications for phylogenetic reconstruction. Biologia 2021, 76, 2291–2302. [Google Scholar] [CrossRef]
  23. Xu, X.D.; Jia, Y.Y.; Cao, S.S.; Zhang, Z.Y.; Storey, K.B.; Yu, D.N.; Zhang, J.Y. Six complete mitochondrial genomes of mayflies from three genera of Ephemerellidae (Insecta: Ephemeroptera) with inversion and translocation of trnI rearrangement and their phylogenetic relationships. PeerJ 2020, 8, e9740. [Google Scholar] [CrossRef] [PubMed]
  24. Zhou, D.; Wang, Y.Y.; Sun, J.Z.; Han, Y.K.; Zhou, C.F. The complete mitochondrial genome of Paegniodes cupulatus (Ephemeroptera: Heptageniidae). Mitochondrial DNA A 2016, 27, 925–926. [Google Scholar] [CrossRef] [PubMed]
  25. Gao, X.Y.; Zhang, S.S.; Zhang, L.P.; Yu, D.N.; Zhang, J.Y.; Cheng, H.Y. The complete mitochondrial genome of Epeorus herklotsi (Ephemeroptera: Heptageniidae) and its phylogeny. Mitochondrial DNA B 2018, 3, 303–304. [Google Scholar] [CrossRef] [PubMed] [Green Version]
  26. Zhang, W.; Li, R.; Zhou, C.F. Complete mitochondrial genomes of Epeorus carinatus and E. dayongensis (Ephemeroptera: Heptageniidae): Genomic comparison and phylogenetic inference. Gene 2021, 777, 145467. [Google Scholar] [CrossRef]
  27. Chen, S.; Zhou, Y.; Chen, Y.; Gu, J. fastp: An ultra-fast all-in-one FASTQ preprocessor. Bioinformatics 2018, 34, i884–i890. [Google Scholar] [CrossRef]
  28. Nicolas, D.; Patrick, M.; Guillaume, S. Novoplasty: De novo assembly of organelle genomes from whole genome data. Nucleic Acids Res. 2017, 45, e18. [Google Scholar]
  29. Folmer, O.; Black, M.; Hoeh, W.; Lutz, R.; Vrijenhoek, R. DNA primers for amplification of mitochondrial cytochrome c oxidase subunit I from diverse metazoan invertebrates. Mol. Mar. Biol. Biotech. 1994, 3, 294–299. [Google Scholar]
  30. Ogden, T.H.; Whiting, M.F. Phylogeny of Ephemeroptera (mayflies) based on molecular evidence. Mol. Phylogenet. Evol. 2005, 37, 625–643. [Google Scholar] [CrossRef]
  31. Yanai, Z.; Sartori, M.; Dor, R.; Dorchin, N. Molecular phylogeny and morphological analysis resolve a long-standing controversy over generic concepts in Ecdyonurinae mayflies (Ephemeroptera: Heptageniidae). Syst. Entomol. 2017, 42, 182–193. [Google Scholar] [CrossRef]
  32. Bernt, M.; Donath, A.; Juhling, F.; Externbrink, F.; Florentz, C.; Fritzsch, G.; Putz, J.; Middendorf, M.; Stadler, P.F. MITOS: Improved de novo metazoan mitochondrial genome annotation. Mol. Phylogenet. Evol. 2013, 69, 313–319. [Google Scholar] [CrossRef]
  33. Tamura, K.; Stecher, G.; Kumar, S. MEGA 11: Molecular Evolutionary Genetics Analysis Version 11. Mol. Biol. Evol. 2021, 38, 3022–3027. [Google Scholar] [CrossRef] [PubMed]
  34. Lowe, T.M.; Chan, P.P. tRNAscan-SE On-line: Integrating search and context for analysis of transfer RNA genes. Nucleic Acids Res. 2016, 44, W54–W57. [Google Scholar] [CrossRef] [PubMed]
  35. Meng, G.; Li, Y.; Yang, C.; Liu, S. MitoZ: A toolkit for mitochondrial genome assembly, annotation and visualization. Nucleic Acids Res. 2019, 47, e63. [Google Scholar] [CrossRef] [PubMed]
  36. Perna, N.T.; Kocher, T.D. Patterns of nucleotide composition at fourfold degenerate sites of animal mitochondrial genomes. J. Mol. Evol. 1995, 41, 353–358. [Google Scholar] [CrossRef]
  37. Rozas, J.; Ferrer-Mata, A.; Sánchez-DelBarrio, J.C.; Guirao-Rico, S.; Librado, P.; Ramos-Onsins, S.E.; Alejandro, S.G. DnaSP 6: DNA sequence polymorphism analysis of large data sets. Mol. Biol. Evol. 2017, 34, 3299–3302. [Google Scholar] [CrossRef]
  38. Kimura, M. A simple method for estimating evolutionary rate of base substitutions through comparative studies of nucleotide sequences. J. Mol. Evol. 1980, 16, 111–120. [Google Scholar] [CrossRef]
  39. Katoh, K.; Standley, D.M. MAFFT multiple sequence alignment software version 7: Improvements in performance and usability. Mol. Biol. Evol. 2013, 30, 772–780. [Google Scholar] [CrossRef] [Green Version]
  40. Zhang, D.; Gao, F.; Jakovlić, I.; Zou, H.; Zhang, J.; Li, W.X.; Wang, G.T. PhyloSuite: An integrated and scalable desktop platform for streamlined molecular sequence data management and evolutionary phylogenetics studies. Mol. Ecol. Resour. 2020, 20, 348–355. [Google Scholar] [CrossRef]
  41. Talavera, G.; Castresana, J. Improvement of phylogenies after removing divergent and ambiguously aligned blocks from protein sequence alignments. Syst. Biol. 2007, 56, 564–577. [Google Scholar] [CrossRef] [Green Version]
  42. Lanfear, R.; Frandsen, P.B.; Wright, A.M.; Senfeld, T.; Calcott, B. Partition Finder 2: New methods for selecting partitioned models of evolution formolecular and morphological phylogenetic analyses. Mol. Biol. Evol. 2016, 34, 772–773. [Google Scholar]
  43. Ronquist, F.; Teslenko, M.; Mark, P.V.D.; Ayres, D.L.; Darling, A.; Höhna, S.; Larget, B.; Liu, L.; Suchard, M.A.; Huelsenbeck, J.P. MrBayes 3.2: Efficient Bayesian phylogenetic inference and model choice across a large model space. Syst. Biol. 2012, 61, 539–542. [Google Scholar] [CrossRef] [PubMed] [Green Version]
  44. Miller, M.A.; Wayne, P.; Terri, S. The CIPRES science gateway: A community resource for phylogenetic analyses. In Proceedings of the 2011 TeraGrid Conference: Extreme Digital Discovery, Salt Lake City, UT, USA, 18–21 July 2011; pp. 1–8. [Google Scholar]
  45. Stamatakis, A. RAxML version 8: A tool for phylogenetic analysis and post-analysis of large phylogenies. Bioinformatics 2014, 30, 1312–1313. [Google Scholar] [CrossRef] [PubMed]
  46. Moreno-Carmona, M.; Cameron, S.L.; Quiroga, C.F.P. How are the mitochondrial genomes reorganized in Hexapoda? Differential evolution and the first report of convergences within Hexapoda. Gene 2021, 791, 145719. [Google Scholar] [CrossRef] [PubMed]
Figure 1. Mitochondrial maps for two types of rearrangement in Epeorus: (A) E. psi (with gene block trnI-trnM-trnQ-trnM-ND2); (B) E. unispinosus (with gene block trnI-trnM-trnQ-NCR-ND2).
Insects 13 00599 g001
Figure 2. Scatterplots of A + T content and value of AT-skew for whole mitogenomes of Epeorus.
Insects 13 00599 g002
Figure 3. Relative synonymous codon usage (RSCU) of the mitogenomes of eight representative Epeorus species (including all species groups involved in this work).
Insects 13 00599 g003
Figure 4. (A) Ratio of non-synonymous (Ka) to synonymous (Ks) substitution rates and average genetic distance of 13 PCGs among 21 Epeorus mitogenomes. (B) Sliding window analysis of 13 aligned PCGs among 21 Epeorus mitogenomes. The red line shows the value of nucleotide diversity (Pi).
Insects 13 00599 g004
Figure 5. The intergenic spacers (IGS) between trnA and trnR in Epeorus mitogenomes: (A) The stem-loop structure; and the (B) alignment of the sequences for stems and loops among 21 Epeorus mitogenomes. The conserved sequences are in red boxes and the variable sites are shown in red. (C) The stem-loop structure of all IGS among 21 mitogenomes.
Insects 13 00599 g005
Figure 6. Phylogenetic relationships of Epeorus constructed by BI and ML methods based on datasets PCGs. Numbers separated by a slash on node are posterior probability and bootstrap values. The line drawings represent two types of genitalia of the clade A and B.
Insects 13 00599 g006
Table 1. GenBank accession numbers of species used in this study.
FamilyGenusSubgenusSpecies GroupSpeciesGenBank ID
HeptageniidaeEpeorusProepeorusG1Epeorus gibbusOK495692 (this study)
G1Epeorus unispinosusOK495693 (this study)
G1Epeorus sp. 1OK495694 (this study)
G2Epeorus aculeatusOK495695 (this study)
G2Epeorus bispinosusOK495696 (this study)
G2Epeorus rhithralisOK495697 (this study)
G2Epeorus falcatusMW381293
Epeorus Epeorus melliMW381294
Epeorus sp. 2OK495698 (this study)
Belovius Epeorus carinatusMT112896
Epeorus pellucidusMW381296
IronlongimanusEpeorus alexandriOK495699 (this study)
montanusEpeorus montanusMW381295
montanusEpeorus sp. 3OK495700 (this study)
Siniron Epeorus herklotsiOK495701 (this study)
Epeorus dayongensis 01MT112895
Epeorus dayongensis 02OK495703 (this study)
Epeorus tuberculatusOK495702 (this study)
Caucasiron Epeorus psiOK495704 (this study)
Epeorus sp. 4OK495705 (this study)
Epeorus sp. 5 OK495706 (this study)
Out group
Paegniodes Paegniodes cupulatusMW381300
Parafronurus Parafronurus youiEU349015
Afronurus Afronurus furcataMW381292
Publisher’s Note: MDPI stays neutral with regard to jurisdictional claims in published maps and institutional affiliations.

