Soil Mite (Acari: Mesostigmata) Communities and Their Relationships with Some Environmental Variables in Experimental Grasslands from Bucegi Mountains in Romania

 ,
, 

Abstract
:Simple Summary
Abstract
1. Introduction
2. Materials and Methods
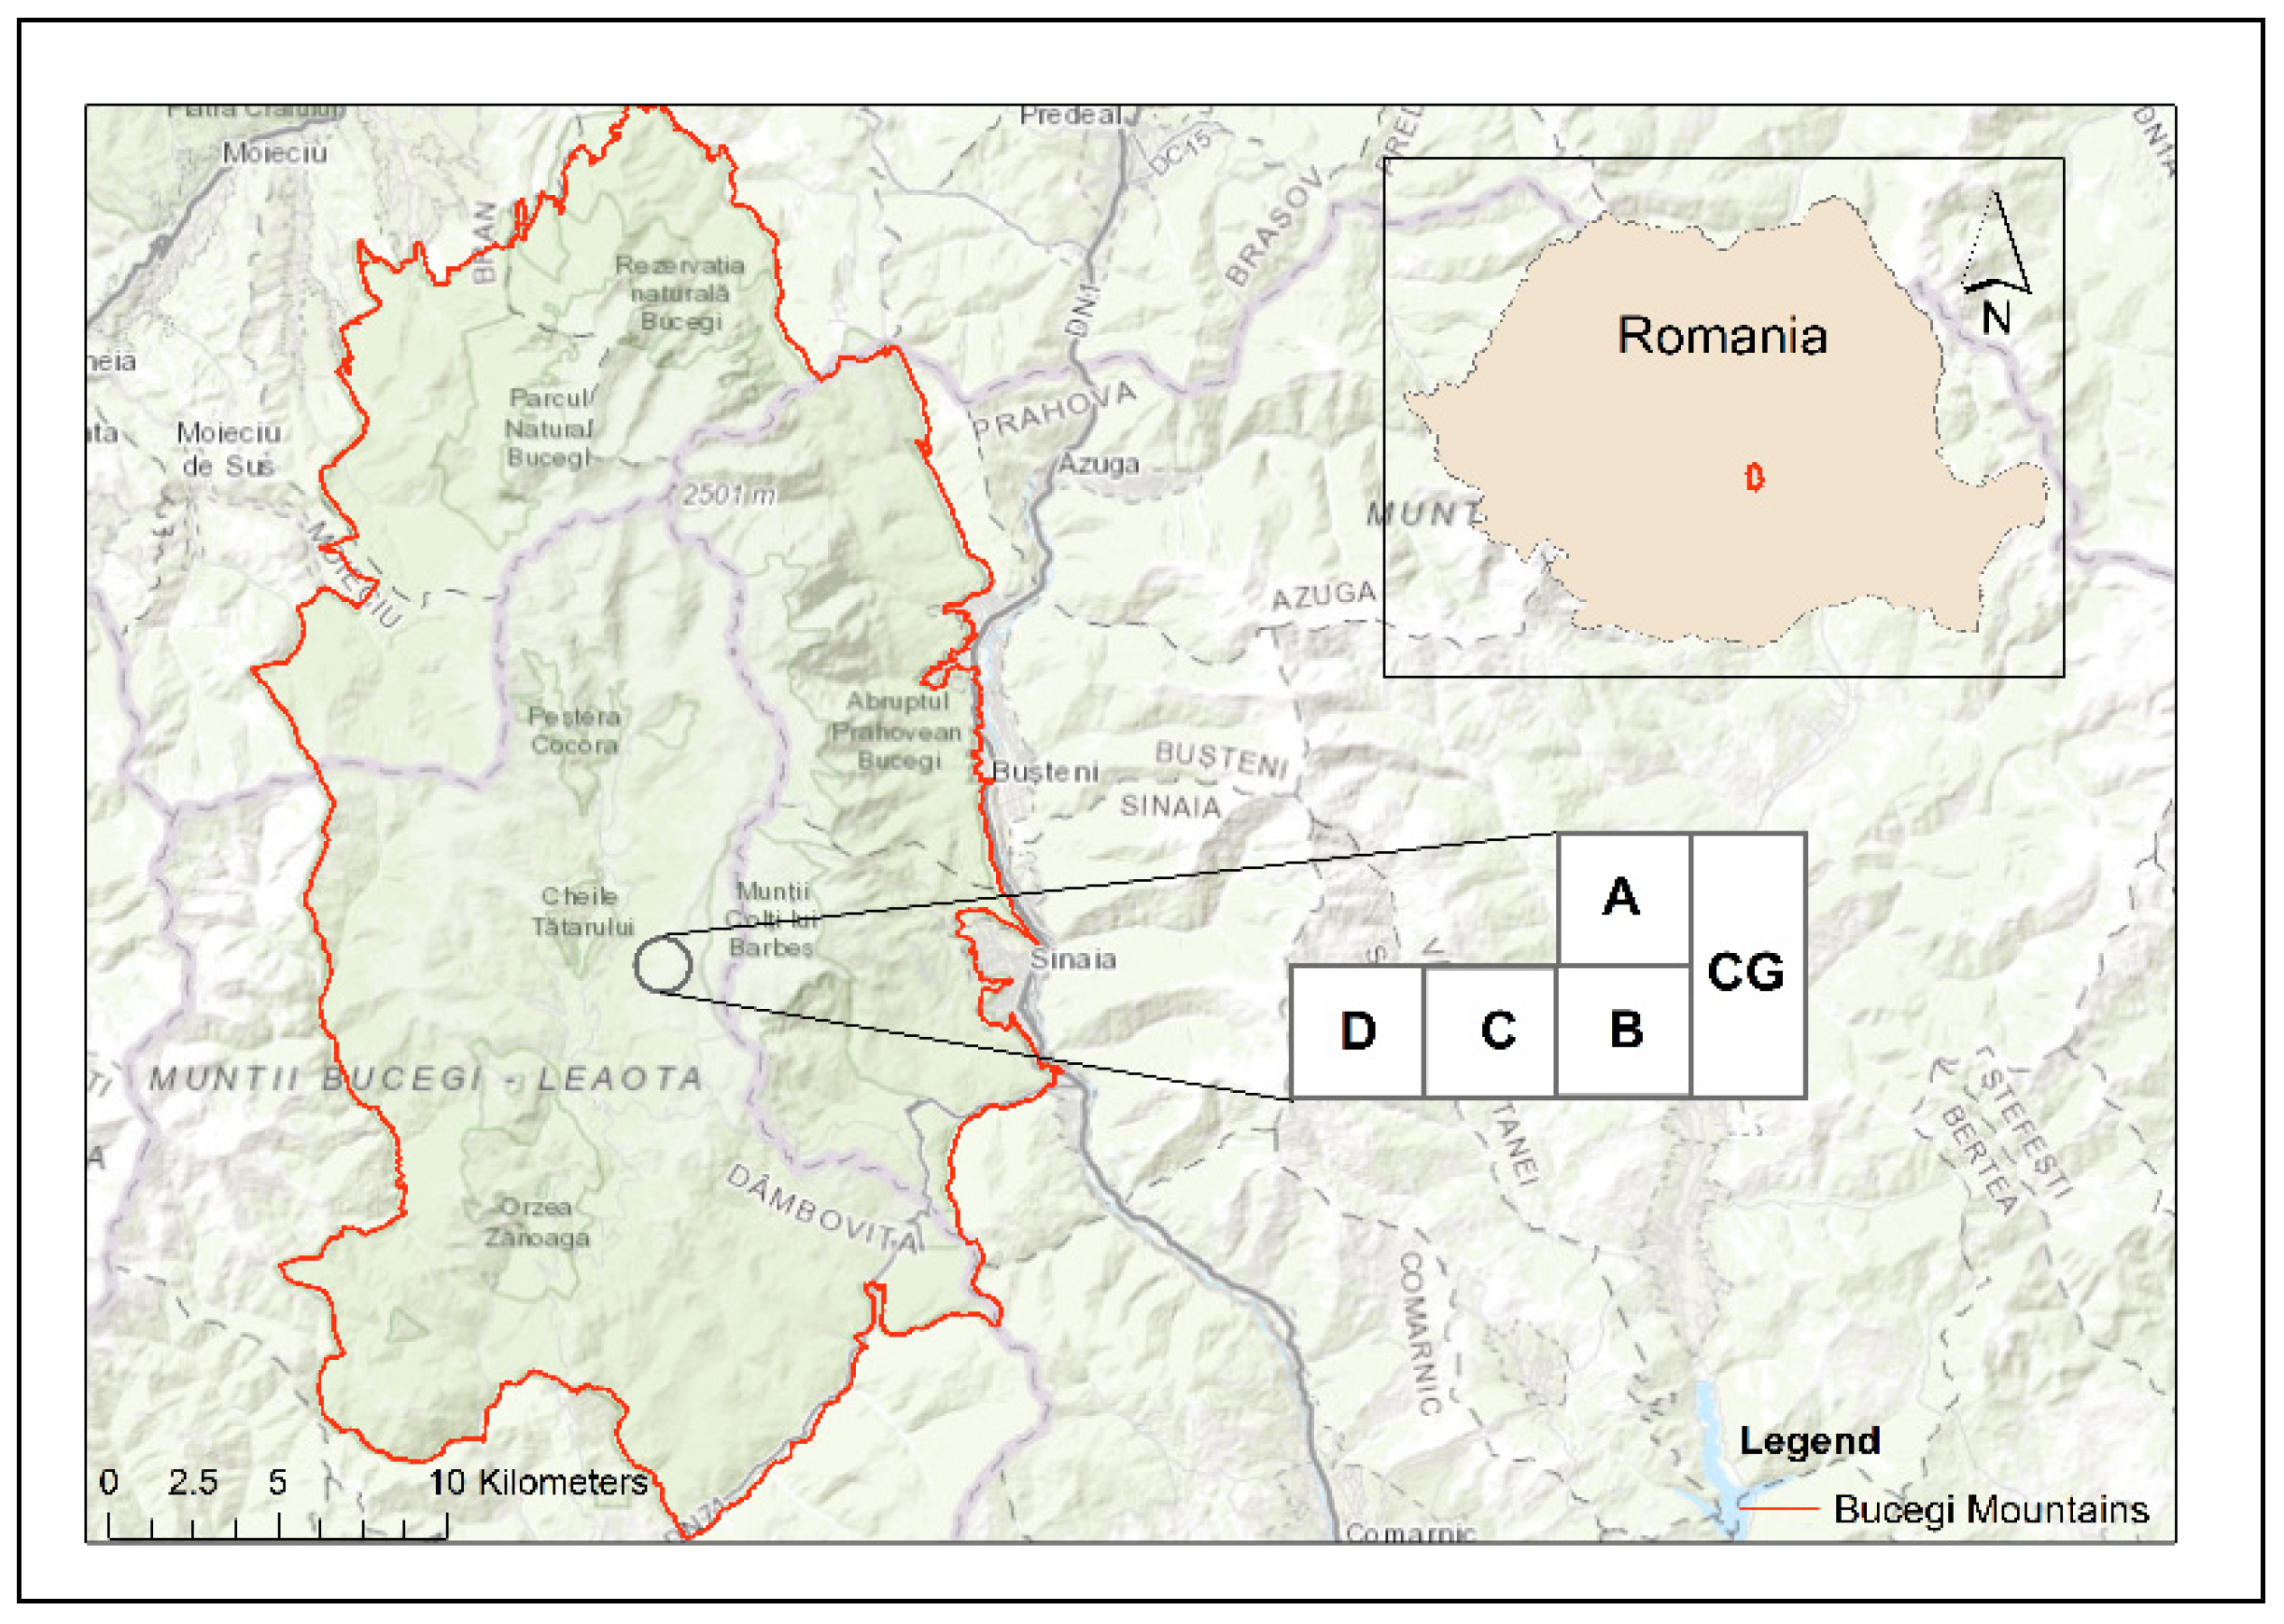
2.1. Study Area
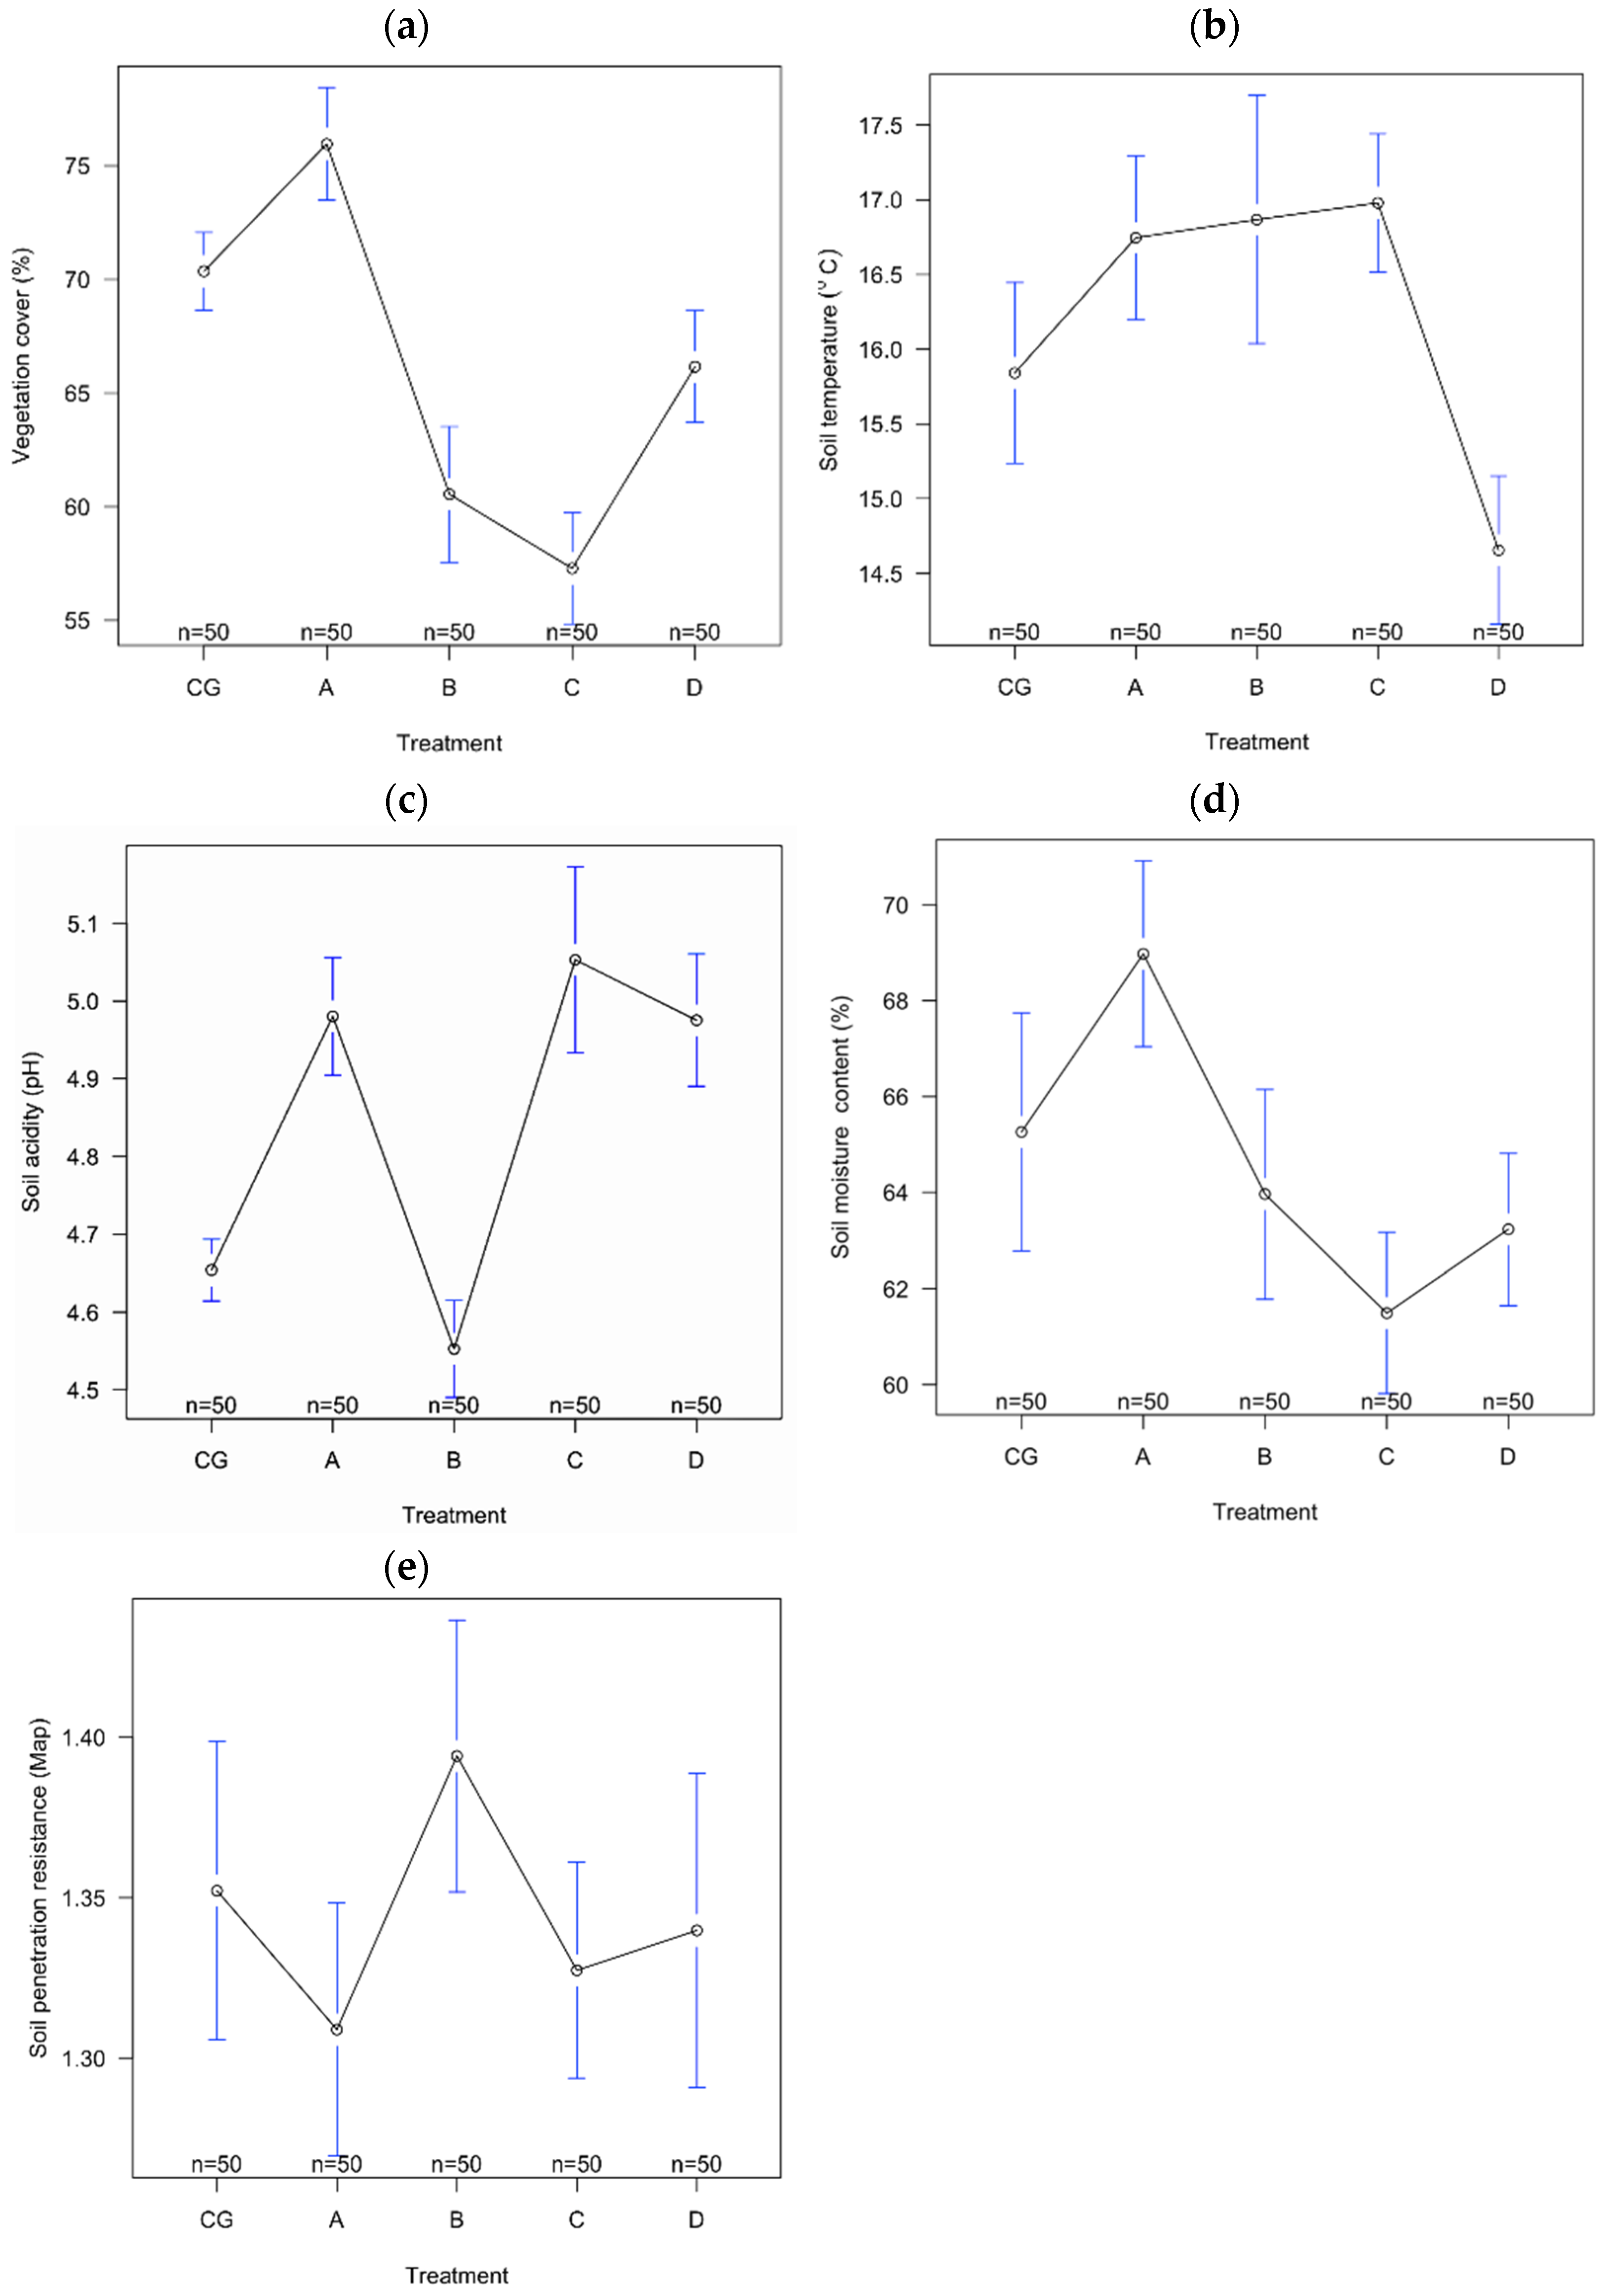
- Control plot-grassland (CG) is a semi-natural pasture, unimproved, and grazed in the summer with cows. It is located at 45°21′23.7″ N; 25°27′38.9″ E; at 1758 m altitude, with an eastern exposure and a slope by 5°. The dominant plant species were Agrostis capillaris L., Festuca ovina L., Pilosella aurantiaca (L.) F.W. Schultz and Sch. Bip., Ligusticum mutellina (L.) Crantz, Nardus stricta L., Potentilla aurea L., Polytrichum sp., Ranunculus acris L., and Trifolium repens L. The control plot-grassland was chosen on the basis of having no inorganic or organic (cattle manure) fertilisers and no other human intervention (e.g., reseeding) (Figure 2a). Plot A is a semi-natural pasture, located at 45°21′24.3″ N; 25°27′39.5″ E; at 1758 m altitude, with an eastern exposure and a slope by 5°. The dominant plant species were A. capillaris L., Deschampsia cespitosa (L.) P. Beauv., Festuca rubra L., Phleum alpinum L., Poa pratensis L. and Polygonum bistorta L. It was fertilised with chemical fertilisers in three periods 2000–2002, 2010–2012, and 2014–2016, with an average application rate per year by 100 kg ha−1 N + 50 kg ha−1 P2O5 + 50 kg ha−1 K2O (Figure 2b).
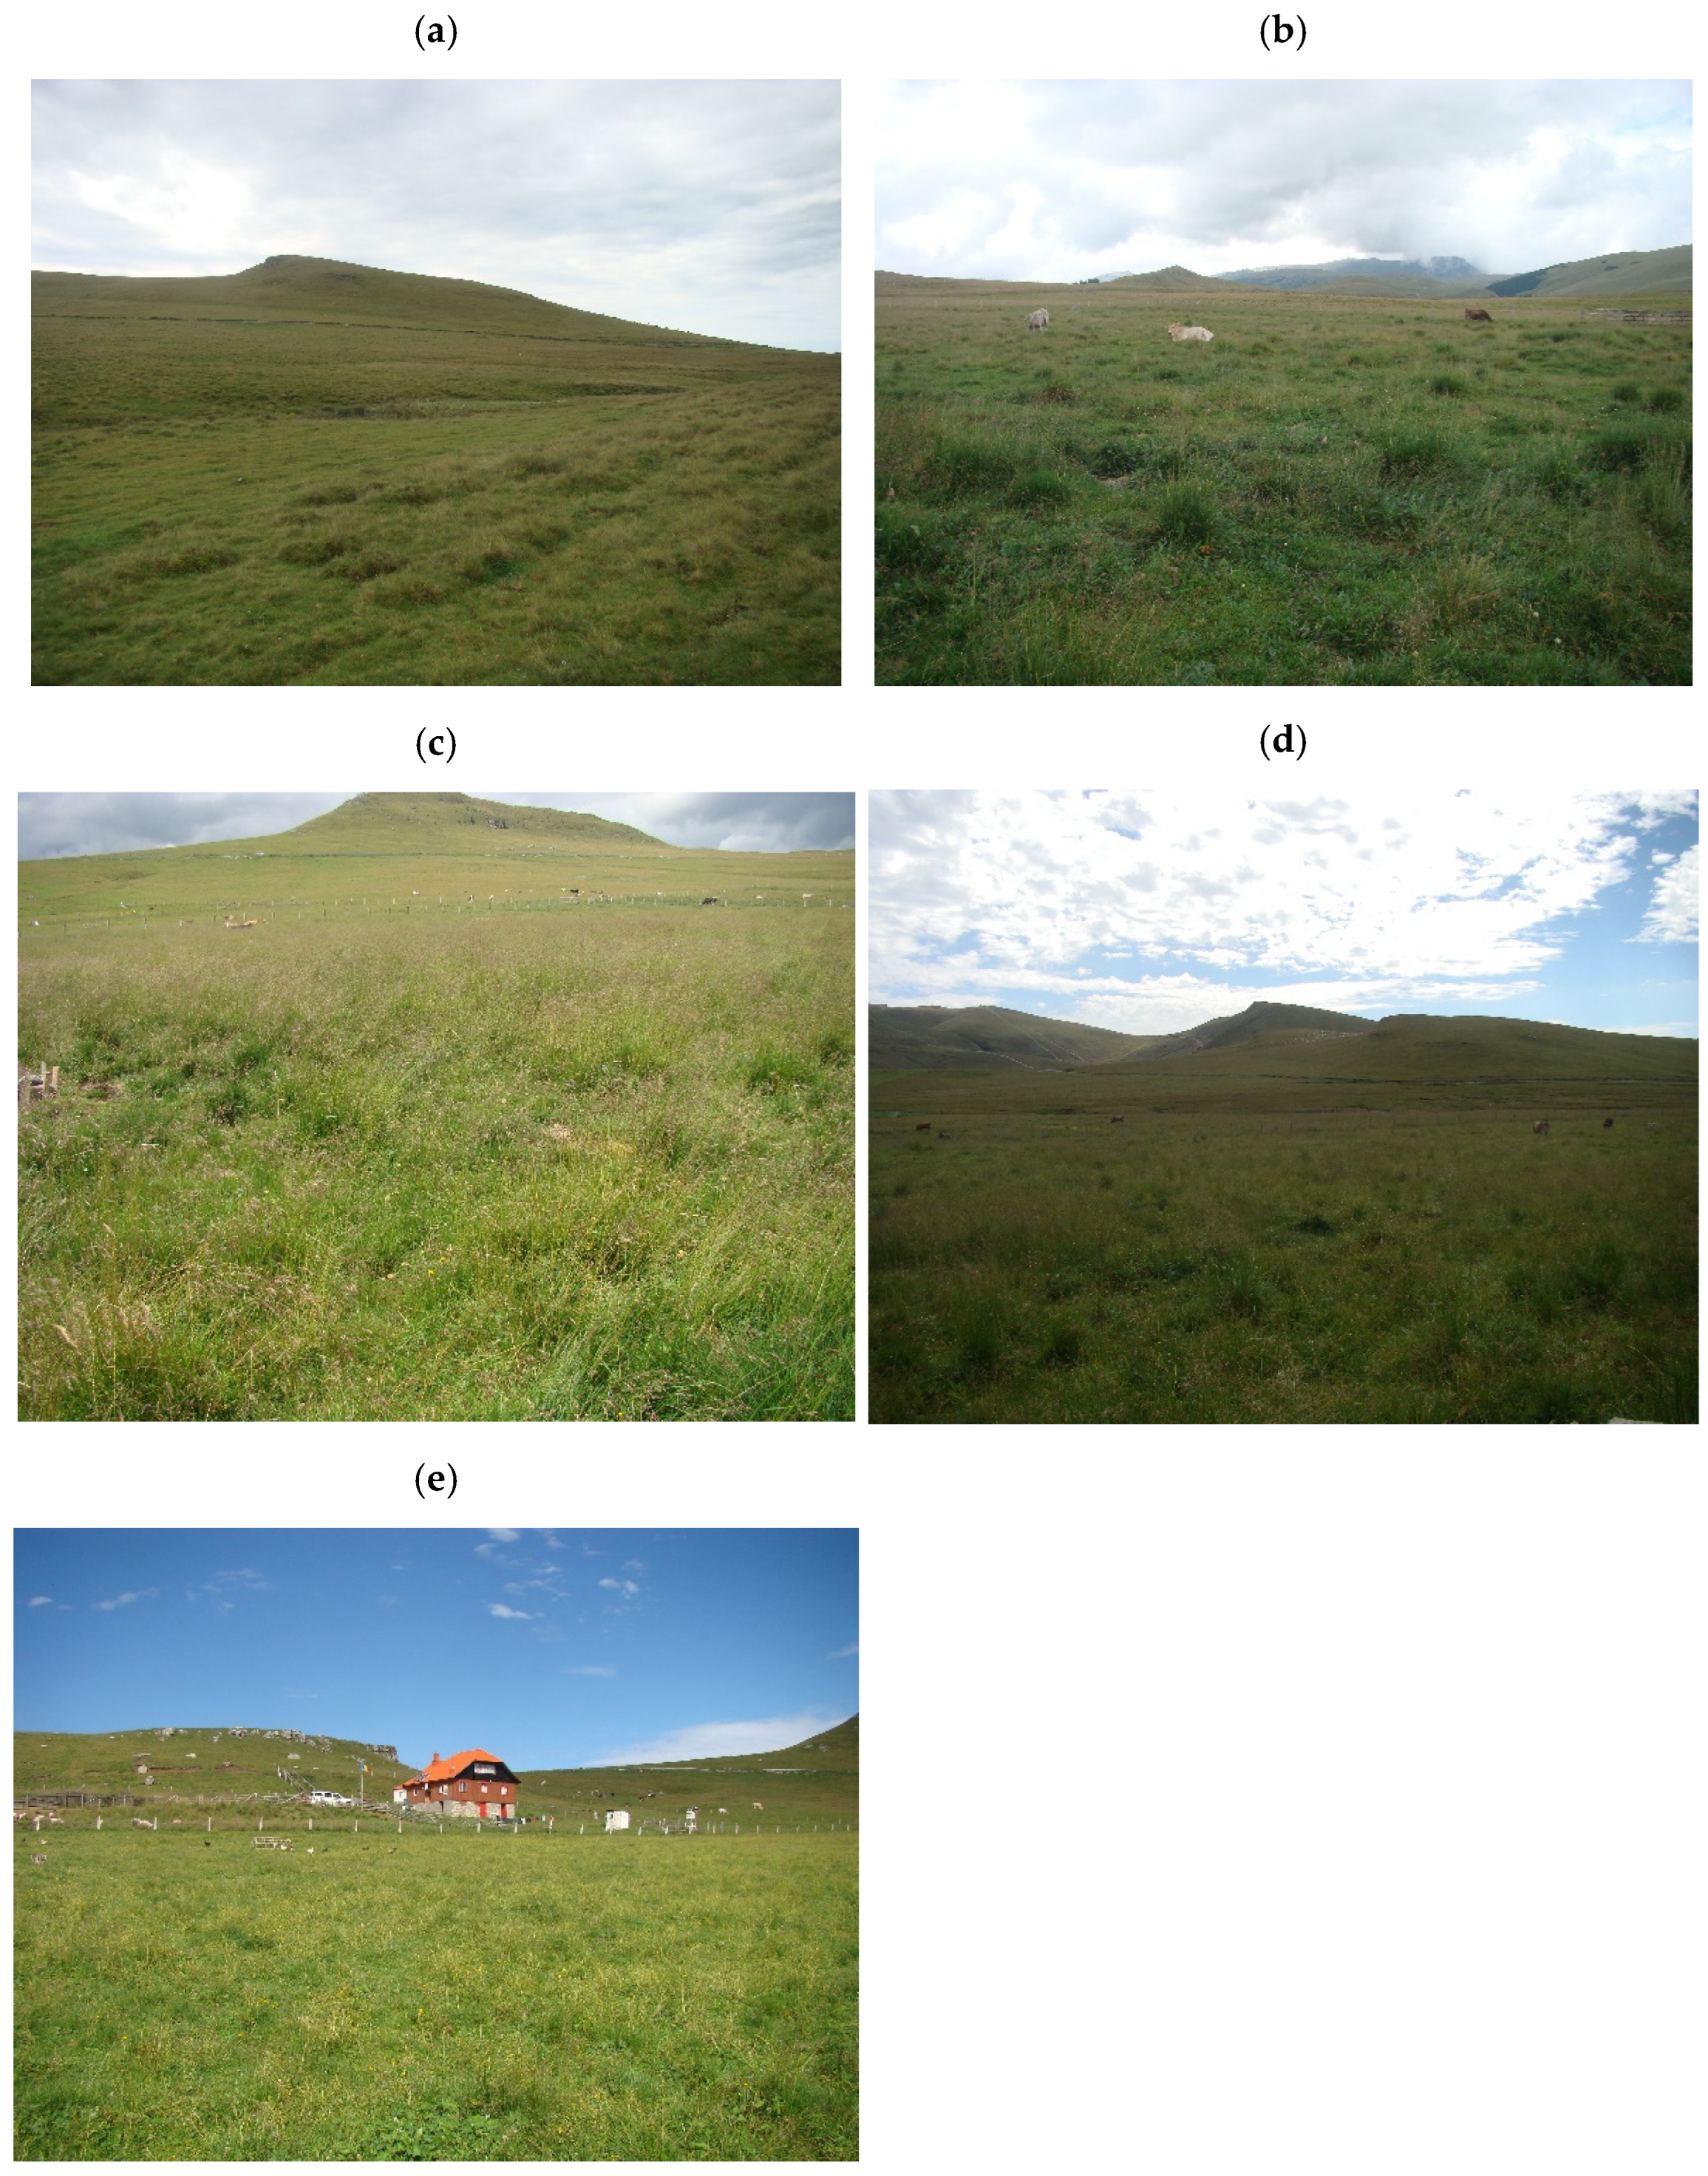
- Plot B is a semi-natural pasture, located at 45°21′24.9″ N; 25°27′39.9″ E; at 1782 m altitude, with an eastern exposure, and no slope. The dominant plant species were D. cespitosa (L.) P. Beauv., P. alpinum L., Phleum pratense L., R. acris L., and T. repens L. It was chemically fertilised in 1996–1998 with an average application rate of 150 kg ha−1 N + 75 kg ha−1 P2O5 + 75 kg ha−1 K2O and organically fertilised in 2004, 2010, and 2016 by paddocking with dairy cows. Cattle manure was added as an input of organic matter (Figure 2c).
- Plot C is a semi-natural pasture, situated at 45°21′24.7″ N; 25°27′35.0″ E; at 1782 m altitude, with an eastern exposure and a slope by 5°. The dominant plant species were Agrostis vinealis Schreb., L. mutellina (L.) Crantz, Poa annua L., P. pratensis L., P. bistorta L., and T. repens L. It was limed in 1995, chemically fertilised similar to the B variant, and paddocked in 2003, 2009, and 2015. To correct the acidity of the soil to 2/3 Ah (hydrolytic acidity), a sterile lime powder (CaO) was used, in a dose of approximately 7.5 tons/ha, only once at the beginning of the experiments in the summer of 1995. In plot C, the powdered lime was spread on the surface of the land, without incorporation. Cattle manure was added as an input of organic matter (Figure 2d).
- Plot D is a pasture that was reseeded in the late summer of 1995, after a herbicide Roundup at 5 l ha−1, calcium liming (the CaO was incorporated in soil), being chemically fertilised, similar to the plot C variant, and paddocked in 2002, 2008, and 2014. It is situated at 45°21′23.9″ N; 25°27′34.5″ E; at 1784 m altitude, with an eastern exposure, and a slope by 5°. The sown mixture of grasses and perennial legumes comprised: P. pratense L. Favorit variety (40%), F. pratensis Huds. Transilvan variety (25%), Lolium perenne L. Marta variety (5%), Trifolium hybridum L.—local population from Braşov (15%), and Lotus corniculatus L. Livada variety (15%). Cattle manure was added as an input of organic matter (Figure 2e).
2.2. Mite Samples
2.3. Environmental Variables
2.4. Data Analysis
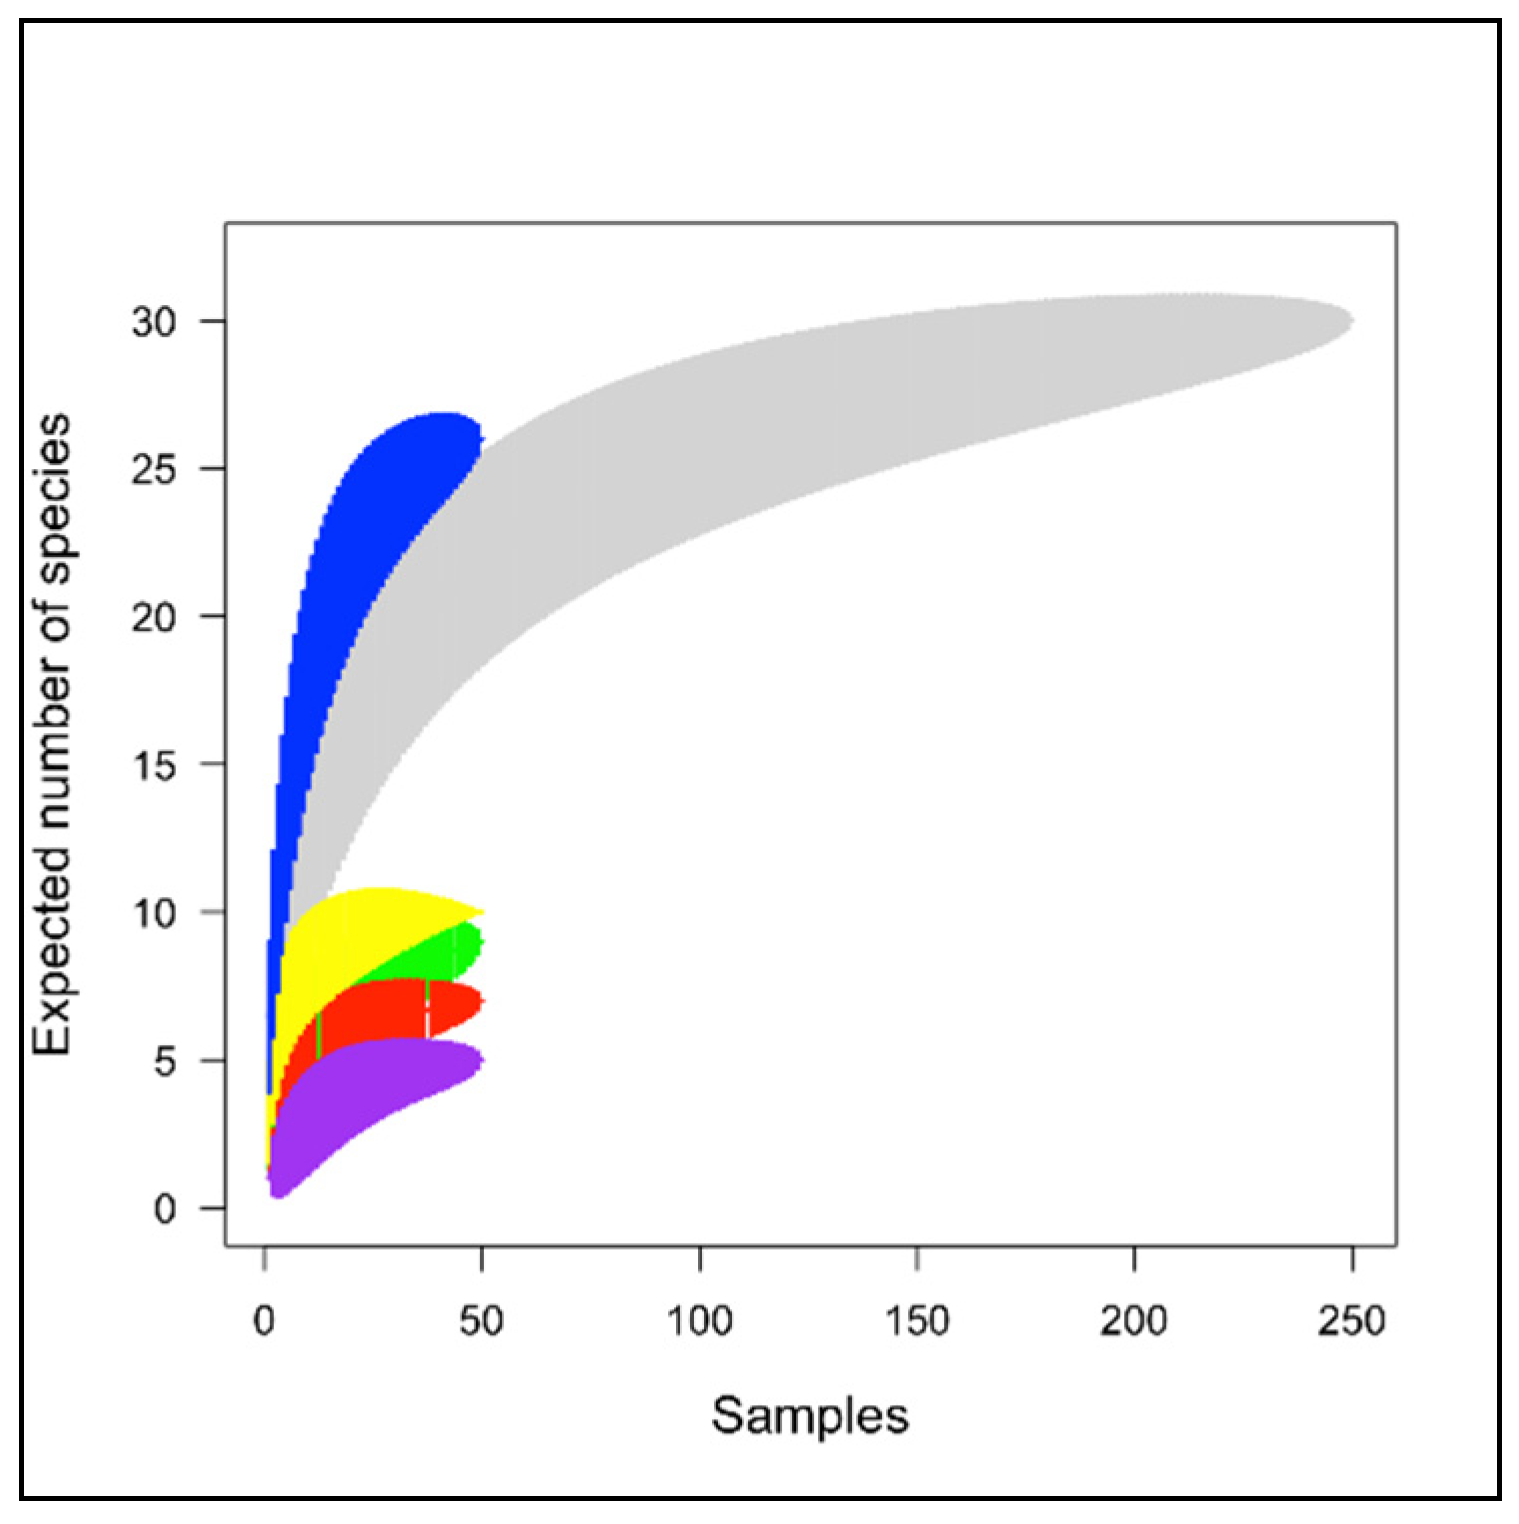
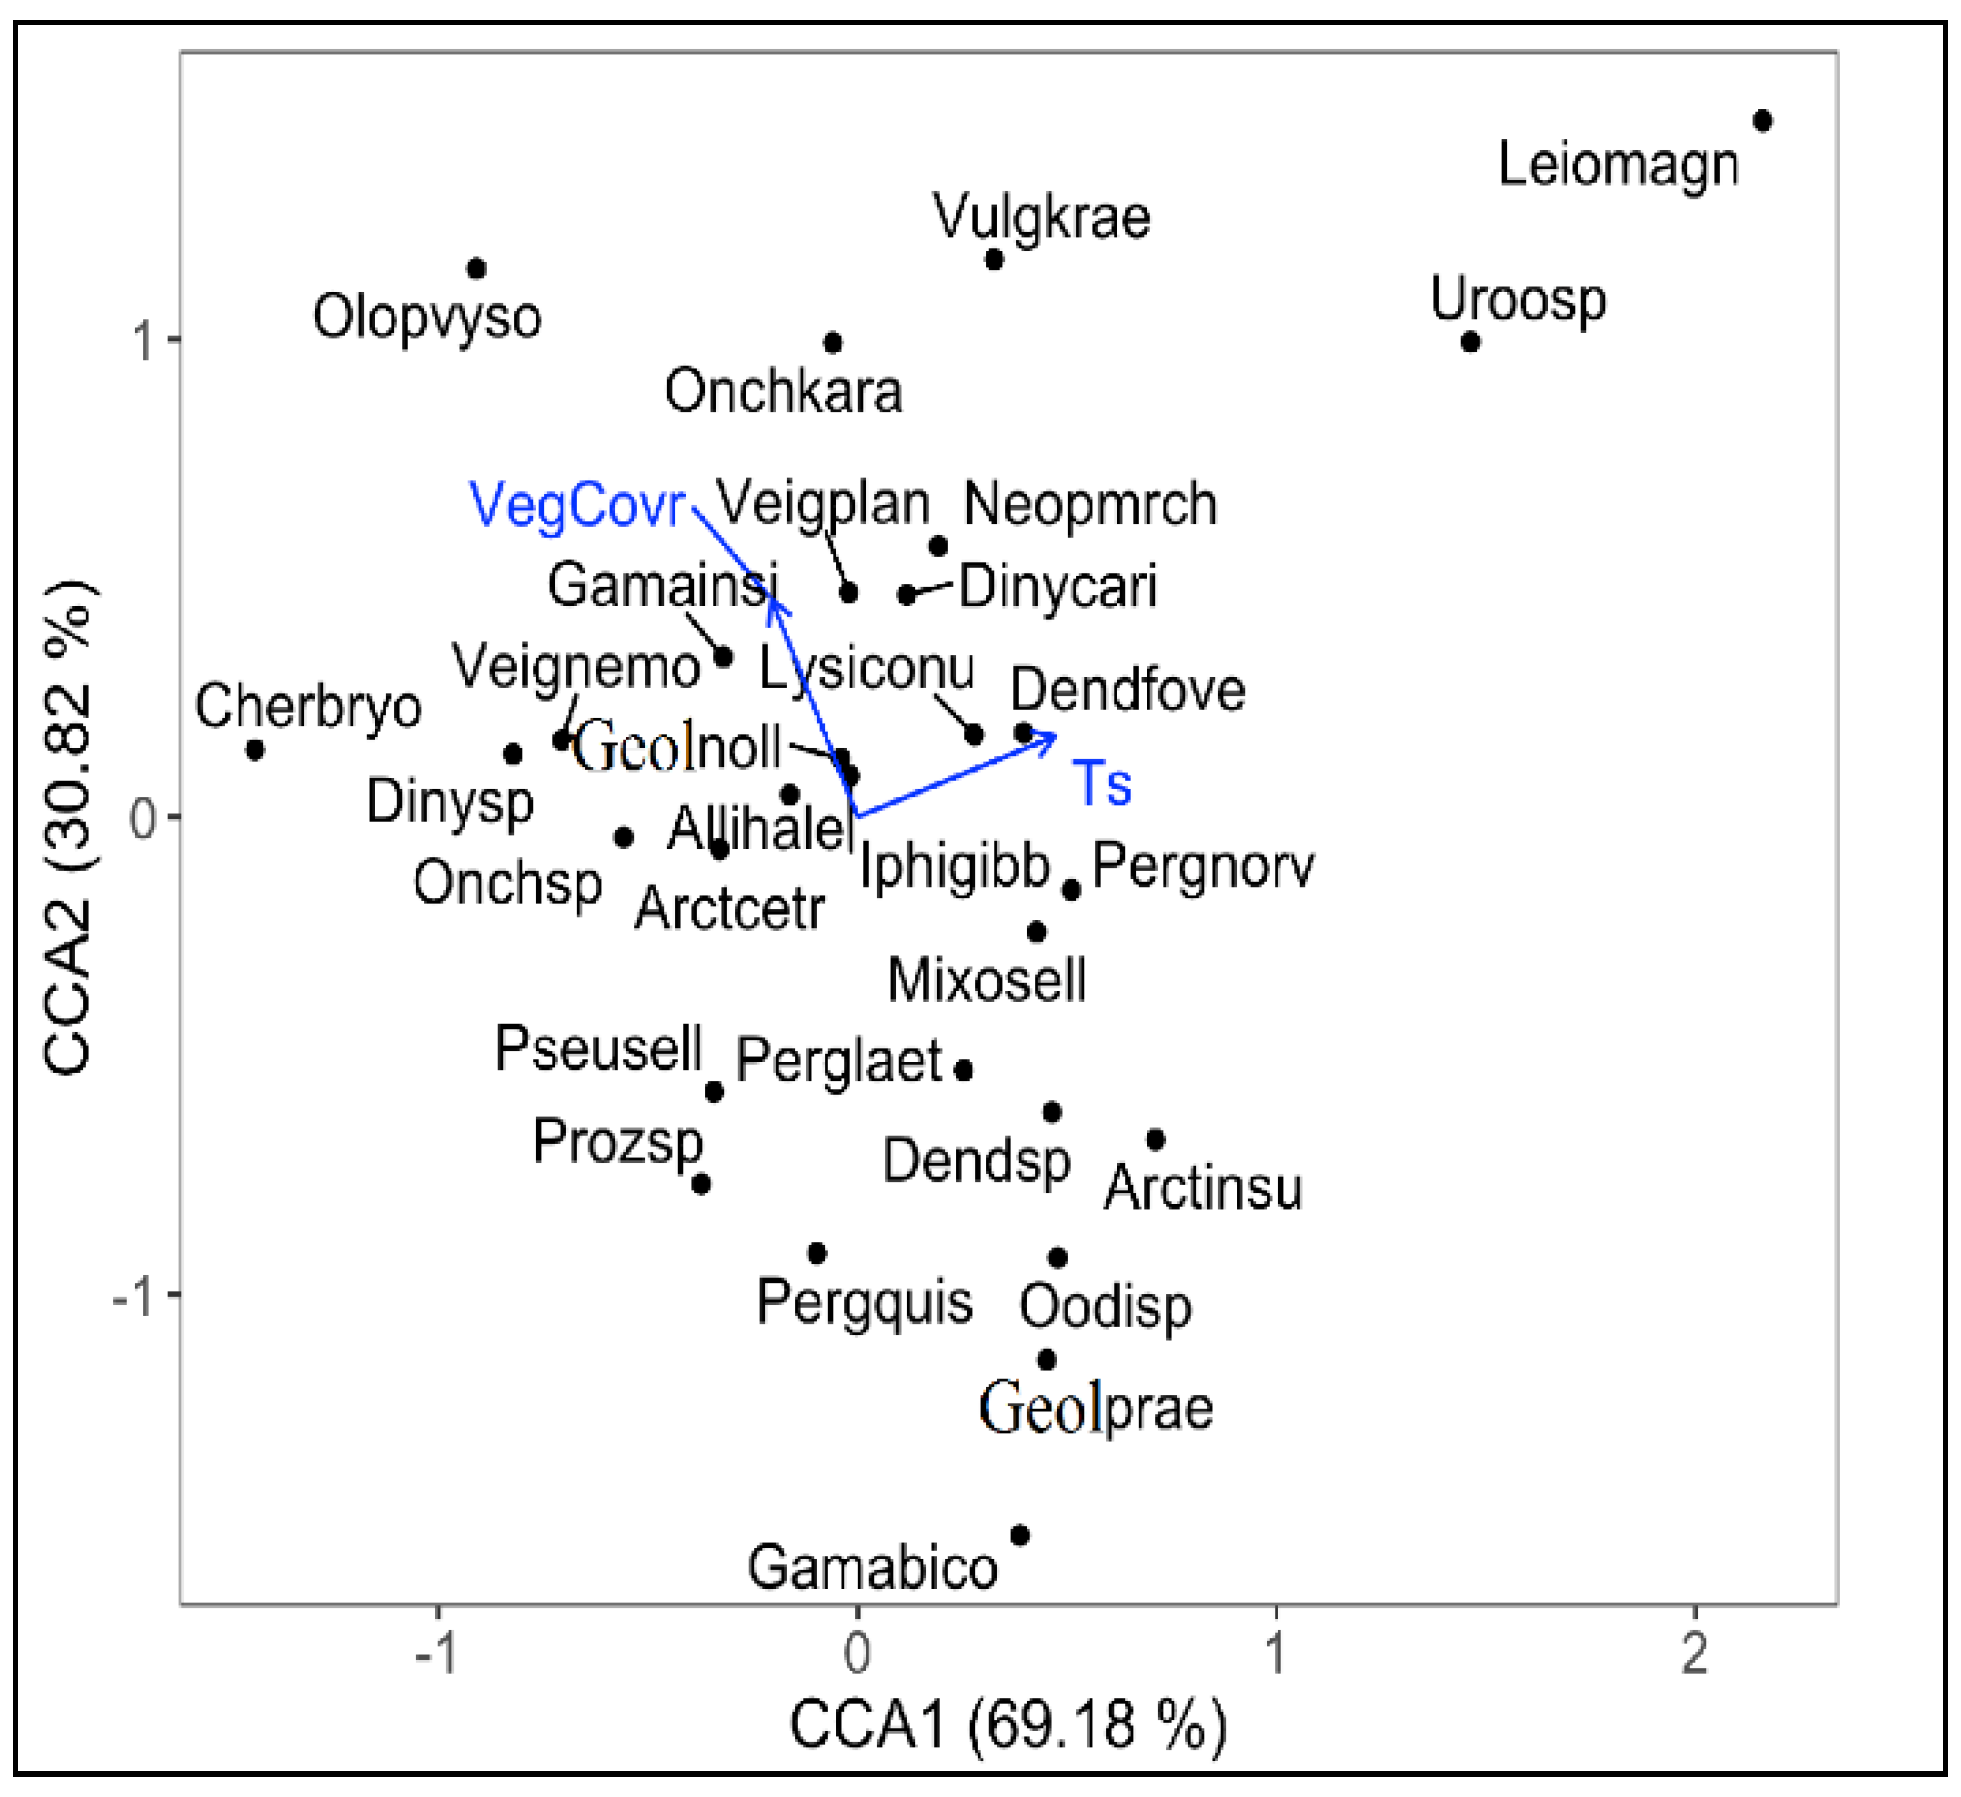
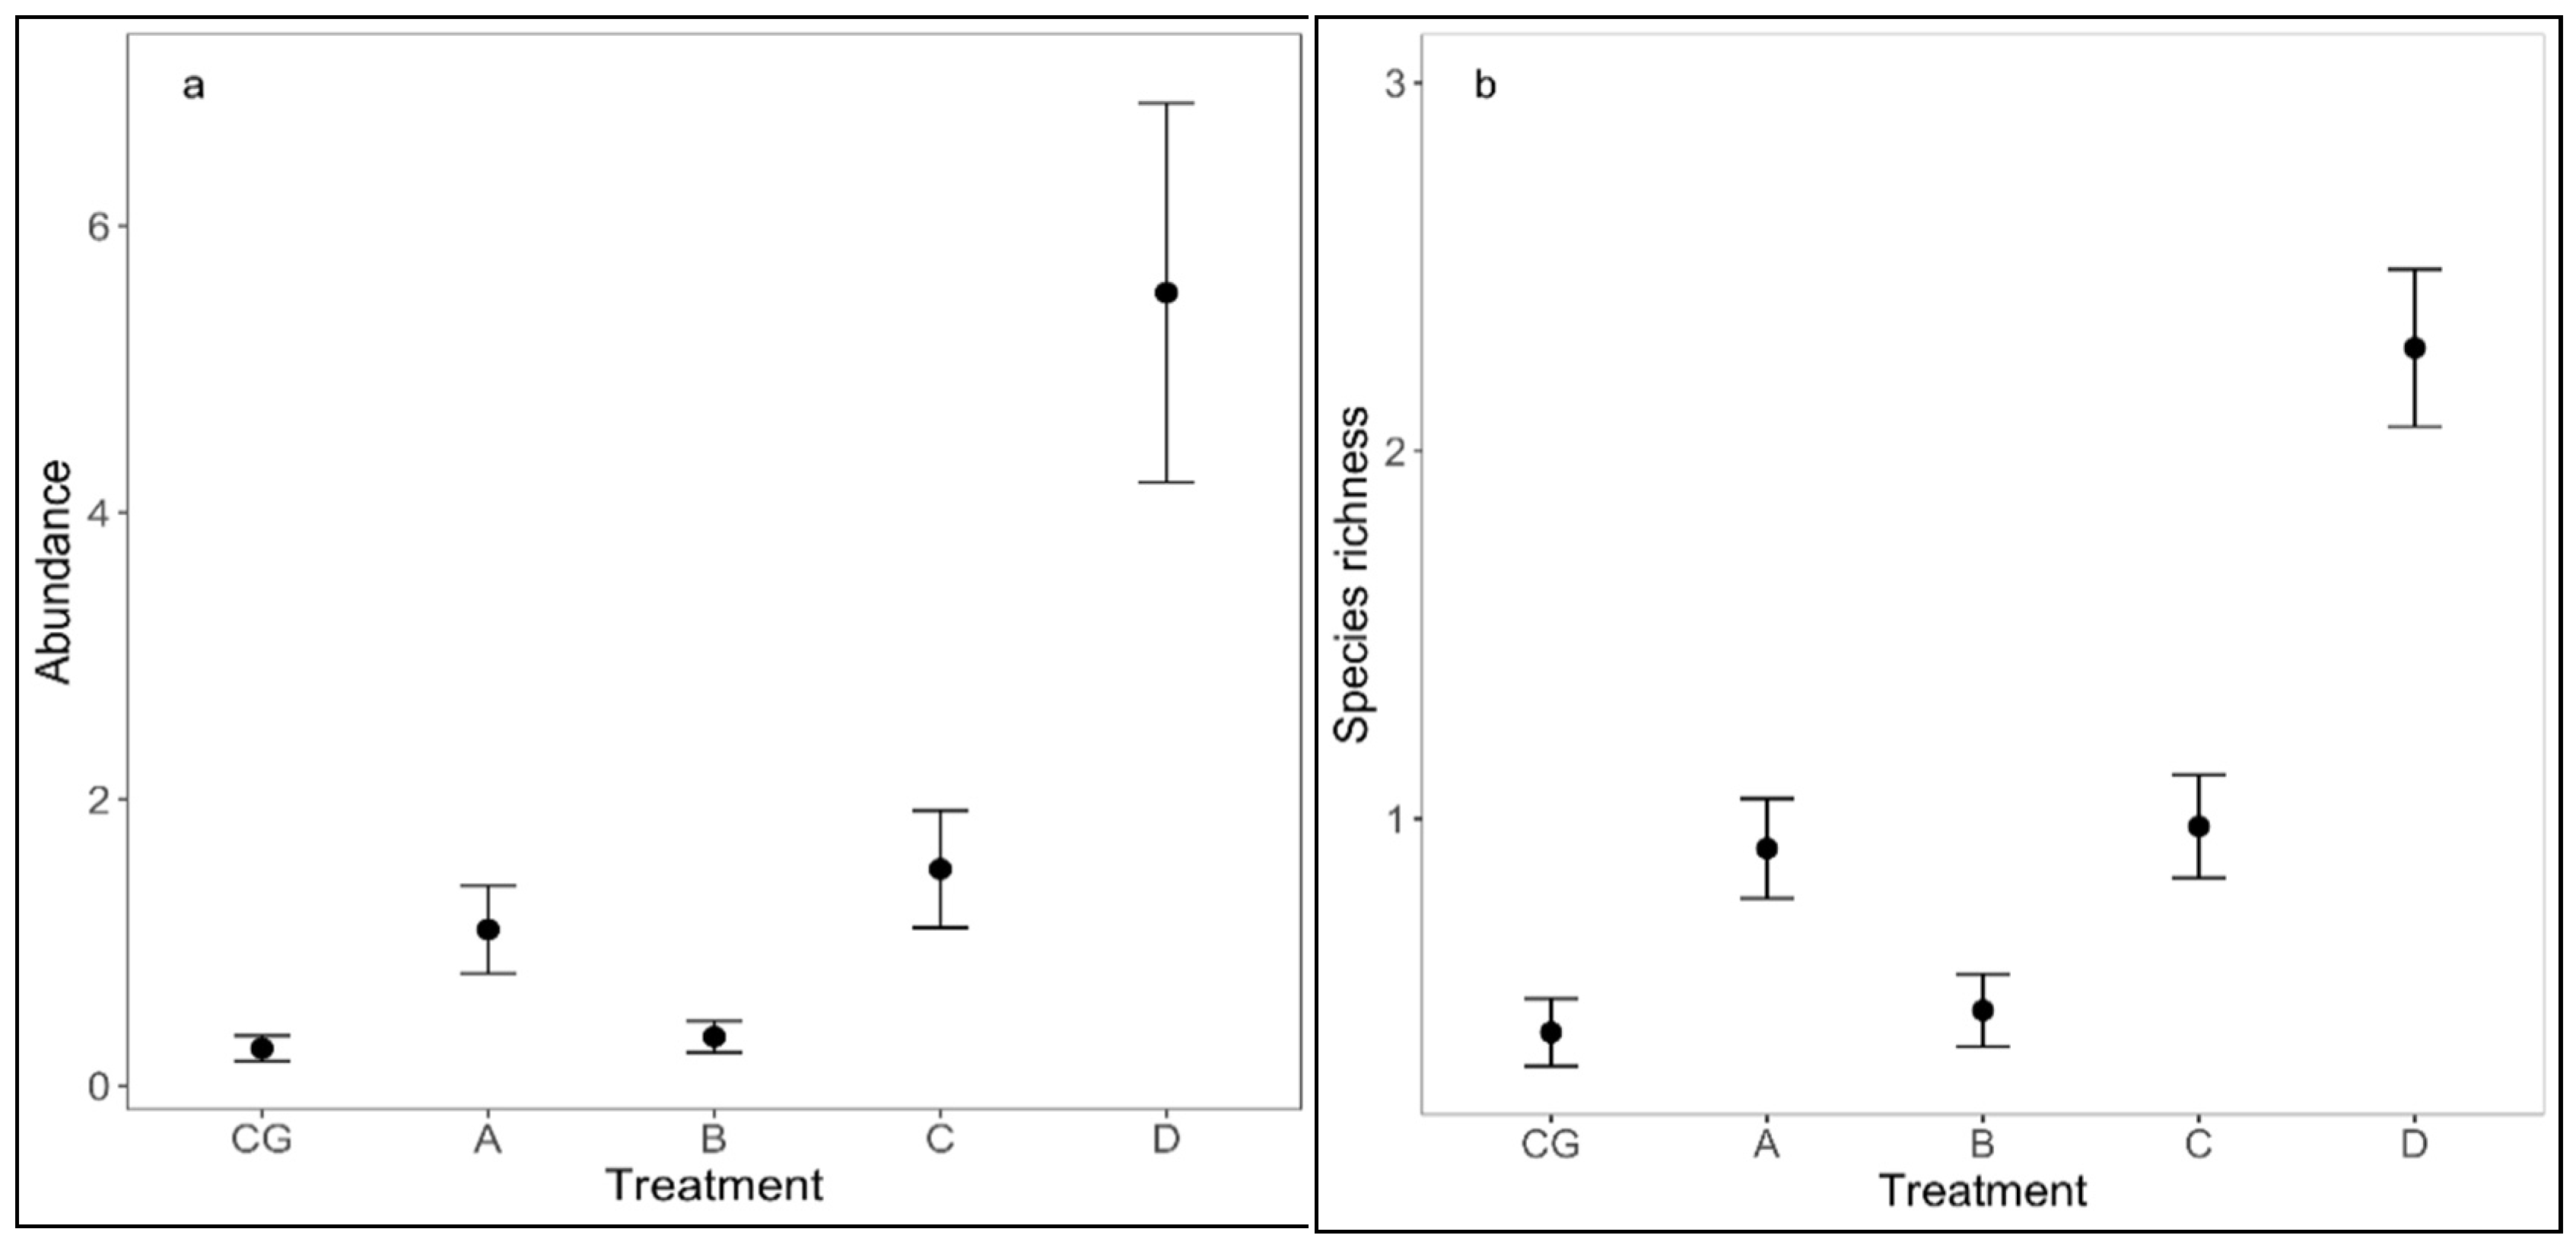
3. Results
4. Discussion
5. Conclusions
Supplementary Materials
Author Contributions
Funding
Institutional Review Board Statement
Informed Consent Statement
Data Availability Statement
Acknowledgments
Conflicts of Interest
References
- Huyghe, C.; De Vliegher, A.; Van Gils, B.; Peeters, A. Grasslands and Herbivore Production in Europe and Effects of Common Policies; Éditions Quæ: Versailles, France, 2014; pp. 1–320. [Google Scholar]
- Maruşca, T.; Mocanu, V.; Haş, E.C.; Tod, M.A.; Andreoiu, A.C.; Dragoş, M.M.; Blaj, V.A.; Ene, T.A.; Silistru, D.; Ichim, E.; et al. Ghid de Întocmire a Amenajamentelor Pastorale; Editura Capolavoro Braşov: Braşov, Romania, 2014; pp. 1–250. [Google Scholar]
- Dąbrowska-Prot, E.; Wasiłowska, A. Ecological importance of meadow patches in protected forest area: Floristic diversity and the dynamics of insect communities. Pol. J. Ecol. 2010, 58, 741–758. [Google Scholar]
- Seeber, J.; Seeber, G.U.H.; Kössler, W.; Langel, R.; Scheu, S.; Meyer, E. Abundance and trophic structure of macrodecomposers on alpine pastureland (Central Alps, Tyrol): Effects of abandonment of pasturing. Pedobiologia 2005, 49, 221–228. [Google Scholar] [CrossRef]
- Pärtel, M.; Bruun, H.H.; Sammul, M. Biodiversity in temperate European grasslands: Origin and conservation. In Proceedings of the 13th International Occasional Symposium of the European Grassland Federation 10, Tartu, Estonia, 29–31 August 2005; pp. 1–14. [Google Scholar]
- Carlier, L.; De Vliegher, A.; Rotar, I. Importance and functions of European grasslands. Bull. USAMV-CN 2005, 61, 17–26. [Google Scholar]
- Birkhofer, K.; Diekötter, T.; Boch, S.; Fischer, S.M.; Müller, J.; Socher, S.; Wolters, V. Soil fauna feeding activity in temperate grassland soils increases with legume and grass species richness. Soil Biol. Biochem. 2011, 43, 2200–2207. [Google Scholar]
- Hartel, T.; Dorresteijn, I.; Klein, C.; Máthé, O.; Moga, C.I.; Öllerer, K.; Roellig, M.; von Wehrden, H.; Fischer, J. Wood-pastures from a traditional rural region of Eastern Europe: Characteristics, biodiversity and threats. Biol. Conserv. 2013, 166, 267–275. [Google Scholar] [CrossRef]
- Silva, J.P.; Toland, J.; Jones, W.; Eldridge, J.; Thorpe, E.; O’Hara, E. LIFE and Europe’s Grasslands: Restoring a Forgotten Habitat; Office for Official Publications of the European Communities: Luxembourg, 2008; pp. 1–53. [Google Scholar]
- Maruşca, T. Appeal to Village Tradition—Agrisilvopastoral Reviews; Transilvania University Publishing House: Braşov, Romania, 2012; pp. 1–461. [Google Scholar]
- Maruşca, T.; Has, E.C.; Blaj, V.A. Researches on pastoral activities and biodiversity in the Bucegi Natural Park. In Proceedings of the 17th Meeting of the FAO-CIHEAM Mountain Pasture Network-Pastoralism and Ecosystem Conservation, Trivero, Italy, 5–7 June 2013; pp. 172–175. [Google Scholar]
- Dunea, D.; Dincă, N.; Iordache, S. Spatio-temporal characterization of natural grasslands from Bucegi Natural Park using remote sensing resources. Sci. Pap. Ser. A Agron. 2014, 62, 180–185. [Google Scholar]
- Manu, M.; Băncilă, R.I.; Iordache, V.; Bodescu, F.; Onete, M. Impact assessment of heavy metal pollution on soil mite communities (Acari: Mesostigmata) from Zlatna Depression—Transylvania. Process. Saf. Environ. Prot. 2017, 108, 121–134. [Google Scholar] [CrossRef]
- Manu, M.; Iordache, V.; Băncilă, R.I.; Bodescu, F.; Onete, M. The influence of the environment variables on soil mite communities (Acari: Mesostigmata) from overgrazed grassland ecosystems—Romania. Ital. J. Zool. 2017, 83, 89–97. [Google Scholar] [CrossRef]
- Manu, M.; Onete, M.; Florescu, L.; Bodescu, F.; Iordache, V. Influence of heavy metal pollution on soil mite communities (Acari) in Romanian grasslands. North-West. J. Zool. 2017, 13, 200–210. [Google Scholar]
- Blaj, V.A.; Maruşca, T.; Andreoiu, A.C.; Mocanu, V. The long-term effect on cow’s milk quality of methods for improving subalpine grasslands. In Grassland Resources for Extensive Farming Systems in Marginal Lands: Major Drivers and Future Scenarios; Porqueddu, C., Franca, A., Lombardi, G., Molle, G., Peratoner, G., Hopkins, A., Eds.; Grassland Science of Europe, Wageningen Academic Publishers: Wageningen, The Netherlands, 2017; Volume 22, pp. 109–111. [Google Scholar]
- Le Bagousse-Pinguet, Y.; de Bello, F.; Vandewalle, M.; Leps, J.; Sykes, M.T. Species richness of limestone grasslands increases with trait overlap: Evidence from within- and between-species functional diversity partitioning. J. Ecol. 2014, 102, 466–474. [Google Scholar] [CrossRef]
- Risch, A.C.; Ochoa-Hueso, R.; van der Putten, W.H.; Bump, J.K.; Busse, M.D.; Frey, B.; Gwiazdowicz, D.J.; Page-Dumroese, D.S.; Vandegehuchte, M.L.; Zimmermann, S.; et al. Size-dependent loss of aboveground animals differentially affects grassland ecosystem coupling and functions. Nat. Commun. 2018, 9, 3684. [Google Scholar] [CrossRef] [PubMed] [Green Version]
- Walter, D.E.; Proctor, H.C. Mites: Ecology, Evolution and Behaviour; Springer: New York, NY, USA, 2013; pp. 1–494. [Google Scholar]
- Nielsen, U.N.; Osler, G.H.R.; Campbell, C.D.; Burslem, D.F.R.P.; van der Wal, R. The influence of vegetation type, soil properties and precipitation on the composition of soil mite and microbial communities at the landscape scale. J. Biogeogr. 2010, 37, 1317–1328. [Google Scholar] [CrossRef]
- Klarner, B.; Maraun, M.; Scheu, S. Trophic diversity and niche partitioning in a species rich predator guild—Natural variations in stable isotope ratios (13C/12C, 15N/14N) of mesostigmatid mites (Acari, Mesostigmata) from Central European beech forests. Soil Biol. Biochem. 2013, 57, 327–333. [Google Scholar] [CrossRef]
- N’Dria, J.K.; Pokou, P.K.; Séka, F.A.; N’Da, R.A.G.; Lagerlöf, J. Edaphic characteristics and environmental impact of rubber tree plantations on soil mite (Acari) communities. Acarologia 2018, 58, 951–962. [Google Scholar] [CrossRef]
- Meehan, M.L.; Song, Z.; Proctor, H. Roles of environmental and spatial factors in structuring assemblages of forest floor Mesostigmata in the boreal region of Northern Alberta, Canada. Int. J. Acarol. 2018, 44, 300–309. [Google Scholar] [CrossRef]
- Jie, L.; Gao, M.; Liu, J.; Guo, Y.; Liu, D.; Zhu, X.; Wu, D. Spatial distribution patterns of soil mite communities and their relationships with edaphic factors in a 30-year tillage cornfield in northeast China. PLoS ONE 2018, 13, e0199093. [Google Scholar]
- Cole, L.; Buckland, S.M.; Bardgett, R.D. Relating microarthropod community structure and diversity to soil fertility manipulations in temperate grassland. Soil Biol. Biochem. 2005, 37, 1707–1717. [Google Scholar] [CrossRef]
- Cole, L.; Buckland, S.M.; Bardgett, R.D. Influence of disturbance and nitrogen addition on plant and soil animal diversity in grassland. Soil Biol. Biochem. 2008, 40, 505–514. [Google Scholar] [CrossRef]
- Briones, M.J.I.; Ostle, N.J.; McNamara, N.P.; Poskitt, J. Functional shifts of grassland soil communities in response to soil warming. Soil Biol. Biochem. 2009, 41, 315–322. [Google Scholar] [CrossRef]
- Wissuwa, J.; Salamon, J.A.; Frank, T. Effects of habitat age and plant species on predatory mites (Acari, Mesostigmata) in grassy arable fallows in Eastern Austria. Soil Biol. Biochem. 2012, 50, 96–107. [Google Scholar] [CrossRef] [Green Version]
- Vandegehuchte, M.L.; Raschein, U.; Schütz, M.; Gwiazdowicz, D.J.; Risch, A.C. Indirect Short- and Long-Term Effects of Aboveground Invertebrate and Vertebrate Herbivores on Soil Microarthropod Communities. PLoS ONE 2015, 10, e0118679. [Google Scholar] [CrossRef] [PubMed]
- Mitchell, R.J.; Urpeth, H.M.; Britton, A.J.; Black, H.; Taylor, A.R. Relative importance of local and large-scale drivers of alpine soil microarthropod communities. Oecologia 2016, 182, 913–924. [Google Scholar] [CrossRef]
- Mitchell, R.J.; Urpeth, H.M.; Britton, A.J.; Taylor, A.R. Soil microarthropod-plant community relationships in alpine moss-sedge heath. Appl. Soil. Ecol. 2017, 111, 1–8. [Google Scholar] [CrossRef]
- González-Maceá, O.; Scheu, S. Response of Collembola and Acari communities to summer flooding in grassland plant diversity experiment. PLoS ONE 2018, 13, e0202862. [Google Scholar]
- Murvanidze, M.; Todria, N.; Mumladze, L.; Kalatozishvili, L. Diversity of soil mite communities in different habitats of Saskhori quarries, Georgia. Persian J. Acarol. 2018, 7, 297–305. [Google Scholar]
- Battigelli, S.P.; McIntyre, G.S. Effects on Longterm Overgrazing on Soil Quality in Southern British Columbia; Report No. 3; Krzic, M., Broersma, K., Thompson, D., Bomke, A., Eds.; Beef Cattle Industry Development Fund: Vancouver, BC, Canada, 1999; pp. 1–9. [Google Scholar]
- Schon, N.L.; Mackay, A.D.; Minor, M.A.; Yeates, G.W.; Hedley, M.J. Soil fauna in grazed New Zealand hill country pastures at two management intensities. Appl. Soil. Ecol. 2008, 40, 218–228. [Google Scholar] [CrossRef]
- Schon, N.L.; Mackay, A.D.; Yeates, G.W.; Minor, M.A. Separating the effects of defoliation and dairy cow treading pressure on the abundance and diversity of soil invertebrates in pastures. Appl. Soil. Ecol. 2010, 46, 209–221. [Google Scholar] [CrossRef]
- Schon, N.L.; Mackay, A.D.; Minor, M.A. Soil fauna in sheep-grazed hill pastures under organic and conventional livestock management and in an adjacent ungrazed pasture. Pedobiologia 2011, 54, 161–168. [Google Scholar] [CrossRef]
- Behan-Pelletier, V.M.; Kanashiro, D. Acari in grassland soils of Canada. In Arthropods of Canadian Grasslands. Ecology and Interactions in Grassland Habitats, B.S.C.; Shorthouse, J.D., Floate, K.D., Eds.; Biological Survey of Canada: Ottawa, ON, Canada, 2010; Volume 1, pp. 137–166. [Google Scholar]
- Onen, O.; Ko, K. Seasonal and Vertical Distribution of Acarina Fauna of Grassland, Çankaya. Univ. J. Sci. Eng. 2011, 8, 277–289. [Google Scholar]
- Arroyo, J.; Grady, A.O.; Vance, H.; Bolger, T. The mite (Acari: Oribatida, Mesostigmata) assemblages associated with Lasius flavus (Hymenoptera: Formicidae) nests and surrounding soil in an Irish grassland. Biol. Environ. Proc. R. Irish. Acad. 2015, 115, 17–28. [Google Scholar] [CrossRef]
- Călugăr, A. Qualitative and quantitative studies upon the edaphic microarthropods fauna in some grassland ecosystems from Moldavian Plain (Romania). Compl. Muz. Şt. Nat. Ion Borcea Bacău Stud. Comunicări 2006, 21, 230–231. [Google Scholar]
- Călugăr, A. On the gamasid fauna (Acari: Gamasina) from the grassland ecosystems of the Moldavian Plain (Romania). Compl. Muz. Şt. Nat. Ion Borcea Bacău Stud. Comunicări 2006, 21, 232–235. [Google Scholar]
- Stănilă, A.L.; Dumitru, M. Soil zones in Romania and pedogenetic processes. Agric. Agric. Sci. Proc. 2016, 10, 135–139. [Google Scholar] [CrossRef] [Green Version]
- Balogh, J. The Oribatids Genera of the World; Akadémiai Kiádo: Budapest, Hungary, 1972; pp. 1–188. [Google Scholar]
- Krantz, G.W.; Walter, D.E. A Manual of Acarology, 3rd ed.; Texas Tech University Press: Lubbock, TX, USA, 2009; pp. 1–526. [Google Scholar]
- Ghiliarov, M.S.; Bregetova, N.G. Opredeliteli Obitayushchikh v Pochve Kleshcheĭ Mesostigmata. In Akademia Nauk USSR, Zoologicheskiĭ Institut Evolyucionoĭ Morfologii i Ekologii Zhivotnikh im A.H. Savertova; Izd. Nauka: Leningrad, Russia, 1977; pp. 1–780. [Google Scholar]
- Hyatt, K.H. Mites of the subfamily Parasitinae (Mesostigmata: Parasitidae) in the British Isles. Bull. Br. Mus. Nat. Hist. Zool. 1980, 38, 237–378. [Google Scholar] [CrossRef]
- Karg, W. Acari (Acarina), Milben Parasitiformes (Anactinochaeta) Cohors Gamasina Leach. Raubmilben. Entomol. Fenn. 1993, 59, 10–12. [Google Scholar]
- Mašán, P. Macrochelid Mites of Slovakia (Acari, Mesostigmata, Macrochelidae); Institute of Zoology, Slovak Academy of Science: Bratislava, Slovakia, 2003; pp. 1–149. [Google Scholar]
- Mašán, P.; Fenďa, P. Zerconid Mites of Slovakia (Acari, Mesostigmata, Zerconidae); Institute of Zoology, Slovakia Academy of Science: Bratislava, Slovakia, 2004; pp. 1–238. [Google Scholar]
- Mašán, P. Review of the Family Pachylaelapidae in Slovakia with Systematics and Ecology of European Species (Acari: Mesostigmata: Eviphidoidea); Institute of Zoology, Slovak Academy of Science: Bratislava, Slovakia, 2007; pp. 1–66. [Google Scholar]
- Mašán, P.; Fenďa, P.; Mihál, I. New edaphic mites of the genus Veigaia from Slovakia and Bulgaria, with a key to the European species (Acari, Mesostigmata, Veigaiidae). Zootaxa 2008, 1897, 1–19. [Google Scholar] [CrossRef] [Green Version]
- Mášan, P.; Halliday, B. Review of the European genera of Eviphididae (Acari: Mesostigmata) and the species occurring in Slovakia. Zootaxa 2010, 2585, 1–122. [Google Scholar] [CrossRef]
- Mášan, P.; Halliday, B. Review of the mite family Pachylaelapidae (Acari: Mesostigmata). Zootaxa 2013, 3776, 1–66. [Google Scholar] [CrossRef] [PubMed] [Green Version]
- Özbek, H.H.; Halliday, B. Four new species of Olopachys Berlese from Turkey (Acari: Pachylaelapidae), with a key to the world species. Syst. Appl. Acarol. 2015, 20, 139–152. [Google Scholar]
- Ivan, D.; Doniță, N. Metode Practice Pentru Studiul Ecologic și Geographic al Vegetației; Facultatea de Biologie, Universitatea din București: Bucureşti, Romania, 1975; pp. 1–250. [Google Scholar]
- Borcard, D.; Geiger, W.; Matthey, W. Oribatid mite assemblages in a contact zone between a peat-bog and a meadow in the Swiss Jura (Acari, Oribatida): Influence of landscape structures and historical process. Pedobiologia 1995, 39, 318–330. [Google Scholar]
- Legendre, P.; Legendre, L. Numerical Ecology; Elsevier Science: Amsterdam, The Netherlands, 1998; pp. 1–853. [Google Scholar]
- Madej, G.; Skubala, P. Colonization of a dolomitic dump by mesostigmatid mites (Acari, Mesostigmata). In Acarid Phylogeny and Evolution: Adaptation in Mites and Ticks; Bernini, F., Nannelli, R., Nuzzaci, G., de Lillo, E., Eds.; Springer: Dordrecht, The Netherlands, 2002; pp. 175–184. [Google Scholar]
- Manu, M.; Băncilă, R.I.; Onete, M. Soil mite communities (Acari: Gamasina) from different ecosystem types from Romania. Belg. J. Zool. 2013, 143, 30–41. [Google Scholar]
- Borcard, D.; Legendre, P.; Drapeau, P. Partialling out the Spatial Component of Ecological Variation. Ecology 1992, 73, 1045–1055. [Google Scholar] [CrossRef] [Green Version]
- lme4: Linear Mixed-Effects Models Using ‘Eigen’ and S4. Available online: https://cran.r-project.org/web/packages/lme4/index.html (accessed on 10 January 2021).
- Ter Braak, T.F.C. Canonical Correspondence Analysis: A new eigenvector technique for Multivariate Direct Gradient Analysis. Ecology 1987, 67, 1167–1179. [Google Scholar] [CrossRef] [Green Version]
- RVAideMemoire: Testing and Plotting Procedures for Biostatistics. Available online: https://cran.r-project.org/package=RVAideMemoire (accessed on 10 January 2021).
- Clarke, K.R. Non-parametric multivariate analyses of changes in community structure. Aust. J. Ecol. 1993, 18, 117–143. [Google Scholar] [CrossRef]
- Dufrêne, M.; Legendre, P. Species assemblages and indicator species: The need for a flexible asymmetrical approach. Ecol. Monog. 1997, 67, 345–366. [Google Scholar] [CrossRef]
- Gotelli, N.J.; Colwell, R.K. Quantifying biodiversity: Procedures and pitfalls in the measurement and comparison of species richness. Ecol. Lett. 2001, 4, 379–391. [Google Scholar] [CrossRef] [Green Version]
- Burnham, K.P.; Anderson, D.R. Model Selection and Multimodel Inference: A Practical Information—Theoretic Approach; Springer: New York, NY, USA, 2002; pp. 1–488. [Google Scholar]
- Johnson, J.B.; Omland, K.S. Model selection in ecology and evolution. Trends Ecol. Evol. 2004, 19, 101–108. [Google Scholar] [CrossRef] [PubMed]
- AICcmodavg: Model Selection and Multimodel Inference Based on (Q)AIC(c). Available online: http://CRAN.R-project.org/package=AICcmodavg (accessed on 10 January 2021).
- The R Project for Statistical Computing. Available online: http://www.R-project.org/ (accessed on 10 January 2021).
- Salmane, I. Investigations of Gamasina mites (Acari, Mesostigmata) in natural and man-affected soils in Latvia. In Proceedings of the 13th International Colloquium of the European Invertebrate Survey, Leiden, The Netherlands, 2–5 September 2001; pp. 129–137. [Google Scholar]
- Slomian, S.; Gulvik, M.E.; Madej, G.I.; Austad, I. Gamasina and Microgyniina (Acari, Gamasida) from soil and tree hollows at two traditional farms in Sognog Fjordane, Norway. Norw. J. Entomol. 2005, 52, 39–48. [Google Scholar]
- Ruf, A.; Beck, L. The use of predatory soil mites’ sinecological soil classification and assessment concepts, with perspectives for oribatid mites. Ecotoxicol. Environ. Saf. 2005, 62, 290–299. [Google Scholar] [CrossRef]
- Skorupski, M.; Belter, W.; Kamczyc, J.; Wierzbicka, A. Soil mites (Acari, Mesostigmata) of the ‘Torfowiska Doliny Izery’Reserve in the Sudety Mountains. Soil Organ. 2008, 80, 261–270. [Google Scholar]
- Postma-Blaauw, M.B.; de Goede, R.G.M.; Bloem, J.; Faber, J.H.; Brussaard, L. Agricultural intensification and de-intensification differentially affect taxonomic diversity of predatory mites, earthworms, enchytraeids, nematodes and bacteria. Appl. Soil Ecol. 2012, 57, 39–49. [Google Scholar] [CrossRef]
- Stanescu, M.; Gwiazdowicz, D.J. Preliminary research on Mesostigmata mites (Acari) from a spruce forest in the Bucegi Massif in Romania. Acta Sci. Pol. Silvarum Colendarum Ratio Ind. Lignaria 2004, 3, 79–84. [Google Scholar]
- Manu, M.; Ion, S. Characterisic soil mite’s communities (Acari: Gamasina) for some natural forests from Bucegi Natural Park—Romania. Period. Biol. 2014, 116, 93–101. [Google Scholar]
- Manu, M. The similarities between predator mite populations (Acari: Gamasina) from some natural forests in Bucegi Massif, Romania. Biologia 2012, 67, 390–396. [Google Scholar]
- Salmane, I.; Spugis, V. Mites in Baltic Sea coastal habitats (Akmensrags, Latvia) with special reference to Mesostigmata. Acarologia 2008, 48, 163–170. [Google Scholar]
- Skorupski, M.; Gornowicz, R.; Spaeth, M.; Wierzbicka, A.K. Mites of the order Mesostigmata on plots reforested with Scots pine after various kinds of soil preparation and wood residue utilization after clear-cutting. Biol. Lett. 2011, 48, 57–65. [Google Scholar] [CrossRef] [Green Version]
- Urbanowski, C.K.; Horodecki, P.; Kamczyc, P.; Skorupski, M.; Jagodziński, A.M. Succession of Mite Assemblages (Acari, Mesostigmata) during Decomposition of Tree Leaves in Forest Stands Growing on Reclaimed Post-Mining Spoil Heap and Adjacent Forest Habitats. Forest 2018, 9, 718. [Google Scholar] [CrossRef] [Green Version]
- Minor, M.A.; Volk, T.A.; Norton, R.A. Effects of site preparation techniques on communities of soil mites (Acari: Oribatida, Acari: Gamasida) under short-rotation forestry plantings in New York, USA. Appl. Soil Ecol. 2004, 25, 181–192. [Google Scholar] [CrossRef]
- Gwiazdowicz, D. Ascid Mites (Acari, Gamasina) from Selected Forest Ecosystems and Microhabitats in Poland; University Augusta Cieszkowskiego: Poznan, Poland, 2007; pp. 1–248. [Google Scholar]
- Manu, M.; Călugăr, A.; Badiu, D. Distribution of the genus Veigaia Oudemans, 1905 (Mesostigmata: Veigaiidae) in Romania, with notes on the species ecology. Biologia 2017, 72, 628–641. [Google Scholar] [CrossRef]
- Manu, M.; Băncilă, R.I.; Bîrsan, C.C.; Mountford, O.; Onete, M. Soil mite communities (Acari: Mesostigmata) as indicators of urban ecosystems in Bucharest, Romania. Sci. Rep. 2021, 11, 3794. [Google Scholar] [CrossRef]
- Santamaría, J.M.; Moraza, M.L.; Elustondo, D.; Baquero, E.; Jordana, R.; Lasheras, E.; Bermejo, R.; Ariňo, A.H. Diversity of acari and collembola along a pollution gradient in soils of a Pyrenean forest ecosystem. Environ. Eng. Manag. J. 2012, 11, 1159–1169. [Google Scholar] [CrossRef]
- Coulson, S.J.; Fjellberg, A.; Melekhina, E.N.; Taskaeva, A.A.; Lebedeva, N.V.; Belkina, O.A.; Seniczak, S.; Seniczak, A.; Gwiazdowicz, D.J. Microarthropod communities of industrially disturbed or imported soils in the High Arctic; the abandoned coal mining town of pyramiden, Svalbard. Biodivers. Conserv. 2015, 24, 1671–1690. [Google Scholar] [CrossRef]
- Messer, C.; Walther, J.; Dettner, K.; Schulz, S. Chemical deterrents in podurid Collembola. Pedobiologia 2000, 44, 210–220. [Google Scholar] [CrossRef]
- Koehler, H.; Warrelmann, J.; Frische, T.; Behrend, P.; Walter, U. In-Situ Phytoremediation of TNT-Contaminated Soil. Acta. Biotechnol. 2002, 22, 67–80. [Google Scholar] [CrossRef]
- Cox, C. Glyphosate, Part 2: Human Exposure and Ecological Effects. J. Pestic. Reform. 1995, 15, 14–20. [Google Scholar]
- Duke, S.O. Glyphosate: Environmental Fate and Impact. Weed Sci. 2020, 68, 201–207. [Google Scholar] [CrossRef]
- Karg, W. Milben als Indikatoren zur Optimierung von Pflanzenschutzmassnahmen in Apfelintensivanlagen. Pedobiologia 1978, 18, 415–425. [Google Scholar]
- Bedano, J.C.; Domínguez, A.; Arolfo, R.; Wall, L.G. Effect of Good Agricultural Practices under no-till on litter and soil invertebrates in areas with different soil types. Soil Till. Res. 2016, 158, 100–109. [Google Scholar] [CrossRef]
- Rieff, G.G.; Natal-da-Luz, T.; Renaud, M.; Azevedo-Pereira, H.M.V.S.; Chichorro, F.; Schmelz, R.M.; Sousa, J.P. Impact of no-tillage versus conventional maize plantation on soil mesofauna with and without the use of a lambda-cyhalothrin based insecticide: A terrestrial model ecosystem experiment. Appl. Soil Ecol. 2019, 147, 103381. [Google Scholar] [CrossRef]
- Schneider, K.; Maraun, M. Top-down control of soil microarthropods—Evidence from a laboratory experiment. Soil Biol. Biochem. 2009, 41, 170–175. [Google Scholar] [CrossRef]
- McElroy, M.; Papadopoulos, Y.A.; Glover, K.E.; Dong, Z.; Fillmore, S.A.E.; Johnston, M.O. Interactions between Cultivars of Legumes Species (Trifolium pratense L., Medicago sativa L.) and Grasses (Phleum pratense L., Lolium perenne L.) under Different Nitrogen Levels. Can. J. Plant Sci. 2016, 97, 214–225. [Google Scholar] [CrossRef] [Green Version]
- Griegel, A. Effects of the summer flood 1997 on the collembolan and gamasid fauna in a Lower Oder Valley floodplain. Peckiana 2008, 5, 105–114. [Google Scholar]
- Călugăr, A. Soil mesostigmatid mites as a potential tool for bioindication concerning ecological status of forest. Acarologia 2018, 58, 18–24. [Google Scholar] [CrossRef]
- Kamczyc, J.; Urbanowski, C.; Pers-Kamczyc, E. Mite communities (Acari: Mesostigmata) in young and mature coniferous forests after surface wildfire. Exp. Appl. Acarol. 2017, 72, 145–160. [Google Scholar] [CrossRef] [PubMed] [Green Version]


| Treatment | Species | IndVal | p |
|---|---|---|---|
| A | Geolaelaps nolli | 26.8 | <0.05 |
| B | Dendrolaelaps sp. | 24.5 | <0.05 |
| D | Dinychus sp. | 31.7 | <0.01 |
| Pergamasus norvegicus | 29.0 | <0.05 | |
| Cheroseius bryophilus | 25.8 | <0.05 | |
| A + C | Mixozercon sellnicki | 28.1 | <0.05 |
| C + D | Lysigamasus conus | 27.6 | <0.05 |
| Model Structure | LL | K | AICc | ∆i | wi |
|---|---|---|---|---|---|
| Abundance | |||||
| Treatment | −545.63 | 6 | 1103.26 | 0.00 | 0.27 |
| Treatment + RPs | −545.47 | 7 | 1104.93 | 1.67 | 0.12 |
| Treatment + VegCovr | −545.48 | 7 | 1104.96 | 1.70 | 0.12 |
| Treatment + Rhs | −545.52 | 7 | 1105.04 | 1.78 | 0.11 |
| Treatment + pH | −545.54 | 7 | 1105.09 | 1.83 | 0.11 |
| Treatment + Ts | −545.60 | 7 | 1105.21 | 1.95 | 0.10 |
| Treatment + VegCovr + pH | −545.40 | 8 | 1106.79 | 3.53 | 0.05 |
| Treatment + VegCovr + Ts | −545.47 | 8 | 1106.94 | 3.68 | 0.04 |
| Species richness | |||||
| Treatment | −305.74 | 6 | 623.47 | 0.00 | 0.26 |
| Treatment + RPs | −305.36 | 7 | 624.71 | 1.24 | 0.14 |
| Treatment + Ts | −305.48 | 7 | 624.97 | 1.50 | 0.12 |
| Treatment + pH | −305.61 | 7 | 625.21 | 1.74 | 0.10 |
| Treatment + Rhs | −305.71 | 7 | 625.43 | 1.95 | 0.10 |
| Treatment + VegCovr | −305.74 | 7 | 625.47 | 2.00 | 0.10 |
| Treatment + VegCovr + Ts | −305.48 | 8 | 626.97 | 3.50 | 0.05 |
| Treatment + VegCovr + pH | −305.61 | 8 | 627.21 | 3.74 | 0.04 |
| Estimate | SE | z Value | p | |
|---|---|---|---|---|
| Abundance | ||||
| CG–A | −1.432 | 0.421 | −3.399 | 0.0027 |
| CG–B | −0.272 | 0.446 | −0.610 | 0.767 |
| CG–C | −1.758 | 0.417 | −4.216 | <0.001 |
| CG–D | −3.056 | 0.410 | −7.451 | <0.001 |
| Species richness | ||||
| CG–A | −0.784 | 0.263 | −2.977 | 0.015 |
| CG–B | −0.134 | 0.299 | −0.447 | 1.000 |
| CG–C | −0.847 | 0.261 | −3.249 | 0.007 |
| CG–D | −1.692 | 0.237 | −7.124 | <0.001 |
| Environmental Variables | df | MS | F | p |
|---|---|---|---|---|
| Vegetation cover (%) | 4 | 2800.9 | 37.66 | <0.001 |
| Soil moisture content (%) | 4 | 2.504 | 30.91 | <0.001 |
| Soil temperature (°C) | 4 | 48.29 | 10.79 | <0.001 |
| Soil acidity (pH) | 4 | 394.2 | 7.951 | <0.001 |
| Soil penetration resistance (Map) | 4 | 0.05135 | 2.29 | >0.05 |
| Diff | 95% LCL | 95% UCL | p adj | |
|---|---|---|---|---|
| Vegetation cover (%) | ||||
| CG–A | 5.60 | −0.859 | 10.340 | 0.011 |
| CG–B | −9.82 | −14.560 | −5.079 | <0.001 |
| CG–C | −13.08 | −17.820 | −8.339 | <0.001 |
| CG–D | −4.20 | −8.940 | 0.540 | 0.109 |
| Soil moisture content (%) | ||||
| CG–A | 0.326 | 0.169 | 0.482 | 0.011 |
| CG–B | −0.101 | −0.257 | 0.055 | 0.388 |
| CG–C | 0.399 | 0.242 | 0.555 | <0.001 |
| CG–D | 0.321 | 0.164 | 0.477 | <0.001 |
| Soil temperature (°C) | ||||
| CG–A | 0.904 | −0.258 | 2.066 | 0.208 |
| CG–B | 1.026 | −0.136 | 2.188 | 0.112 |
| CG–C | 1.138 | −0.024 | 2.300 | 0.058 |
| CG–D | −1.186 | −2.348 | −0.023 | 0.043 |
| Soil acidity (pH) | ||||
| CG–A | 3.716 | −0.154 | 7.586 | 0.066 |
| CG–B | −1.296 | −5.166 | 2.574 | 0.888 |
| CG–C | −3.770 | −7.640 | 0.100 | 0.060 |
| CG–D | −2.030 | −5.900 | 1.840 | 0.601 |
Publisher’s Note: MDPI stays neutral with regard to jurisdictional claims in published maps and institutional affiliations. |
© 2022 by the authors. Licensee MDPI, Basel, Switzerland. This article is an open access article distributed under the terms and conditions of the Creative Commons Attribution (CC BY) license (https://creativecommons.org/licenses/by/4.0/).
Share and Cite
Manu, M.; Băncilă, R.I.; Mountford, O.J.; Maruşca, T.; Blaj, V.A.; Onete, M. Soil Mite (Acari: Mesostigmata) Communities and Their Relationships with Some Environmental Variables in Experimental Grasslands from Bucegi Mountains in Romania. Insects 2022, 13, 285. https://doi.org/10.3390/insects13030285
Manu M, Băncilă RI, Mountford OJ, Maruşca T, Blaj VA, Onete M. Soil Mite (Acari: Mesostigmata) Communities and Their Relationships with Some Environmental Variables in Experimental Grasslands from Bucegi Mountains in Romania. Insects. 2022; 13(3):285. https://doi.org/10.3390/insects13030285
Chicago/Turabian StyleManu, Minodora, Raluca Ioana Băncilă, Owen John Mountford, Teodor Maruşca, Vasile Adrian Blaj, and Marilena Onete. 2022. "Soil Mite (Acari: Mesostigmata) Communities and Their Relationships with Some Environmental Variables in Experimental Grasslands from Bucegi Mountains in Romania" Insects 13, no. 3: 285. https://doi.org/10.3390/insects13030285