Article

Integrative Insight into Relationships between Florivorous Thrips Haplothrips leucanthemi and H. niger (Insecta, Thysanoptera)

by
Agnieszka Kaczmarczyk-Ziemba
1,*,
Halina Kucharczyk
2,
Marek Kucharczyk
2 and
Kinga Kucharska
3
1
Department of Evolutionary Genetics and Biosystematics, Faculty of Biology, University of Gdansk, 80-308 Gdansk, Poland
2
Department of Zoology and Nature Protection, Faculty of Biology and Biotechnology, Maria Curie Sklodowska University, 20-033 Lublin, Poland
3
Faculty of Biology and Biotechnology, Maria Curie Sklodowska University, 20-033 Lublin, Poland
*
Author to whom correspondence should be addressed.
Insects 2022, 13(3), 279; https://doi.org/10.3390/insects13030279
Submission received: 4 February 2022 / Revised: 7 March 2022 / Accepted: 8 March 2022 / Published: 11 March 2022
(This article belongs to the Special Issue Economic Pest Thrips: Biology, Ecology, and Population Genetics)

Abstract

:

Simple Summary

In this work, we aimed to determine the genetic diversity of Haplothrips leucanthemi and H. niger. The latter is recognized as a parthenogenetic form of H. leucanthemi and is also considered to be a pest in clover-seed plantations. Molecular analyses were performed at both the mitochondrial (COI) and nuclear levels (28S and ITS2). Additionally, as a part of an integrative approach, we determined and analyzed their microbiota profiles, based on high-throughput 16S rRNA gene sequencing.

Abstract

Haplothrips niger is recognized as a parthenogenetic form of H. leucanthemi and is also considered to be a pest in clover-seed plantations. On the contrary, some researchers highlight the distinctiveness of H. niger and H. leucanthemi. Taking into account these two points of view, as well as the lack of molecular studies investigating the relationship between the mentioned thrips, we decided to perform analyses of both mitochondrial (COI) and nuclear markers (28S and ITS2) to determine the genetic diversity of H. leucanthemi and H. niger. Additionally, as a part of an integrative approach, we determined and analyzed their microbiota profiles, based on high-throughput 16S rRNA gene sequencing. The results of the molecular analyses revealed high intraspecific diversity of H. leucanthemi and did not support the distinctiveness of H. niger. The identified microbiota profiles were similar in both species and the performed analyses also did not support the distinctiveness of H. niger. Significant differences were, in turn, observed between H. leucanthemi and H. niger larvae. Moreover, two known endosymbiotic bacteria were found in the analyzed microbiota profiles (i.e., Wolbachia and Rickettsia). Nevertheless, these symbionts were not predominantly found in the bacterial communities that are associated with H. niger and thus, its impact on the parthenogenetic mode of its reproduction seems less likely.

1. Introduction

The systematics and taxonomy of the order Thysanoptera at the genus level have been under discussion for many years, and has been recently summarized by Mound and Hastenpflug-Vesmanis (2021) [1]. In this group of insects, synonymization is frequently noticed, not only at the genus level (currently, 420 names in synonymy) but also at the species level (see ThripsWiki 2021). Many thrips species that are currently considered to be synonymous have been described based only on their color, body size, or sexual and alary dimorphism [2,3]. Those issues have been recognized, e.g., for the genus Haplothrips (inter alia for H. davisi and H. fissus, H. robustus and H. sesuvii, or H. tritici and H. cerealis species pairs) [2,4,5,6]. Although Haplothrips is the third largest genus in Thysanoptera (240 species, [1]), there are very few studies that involved molecular analyses or evaluations of Haplothrips taxonomy or the determination of the genetic distances among the valid species. The study described by Timm et al. (2008) provided a COI-based molecular identification key for H. nigricornis and H. clarisetis and gave preliminary insight into the genetic distance between those two species [7]. More recently, a study based on DNA barcoding has been applied in order to evaluate the relationships between two morphospecies: H. andresi and H. gowdeyi. Although both mentioned species can be distinguished by morphological characteristics, the determined genetic distance between them is low, and thus not all of the applied delimitation methods indicate them as distinct species [8].
However, the molecular studies mentioned above involved Haplothrips species that are not synonymized. In the present study, we applied an integrative approach in order to determine relationships between florivorous Haplothrips leucanthemi (Schrank, 1781) and H. niger (Osborne, 1883), and to verify their potential distinctiveness. Currently, H. niger is considered a parthenogenetic synonym [4,5] but, on the contrary, the European literature refers to the distinctiveness of H. leucanthemi and H. niger [9]. Both species seem to be strictly associated with different host plants: H. leucanthemi with Leucanthemum vulgare and L. ircutianum (Asteraceae), and H. niger with Trifolium species (Fabaceae) [9], which suggests that H. niger can be recognized as an H. leucanthemi biotype. Importantly, H. niger is also considered to be a pest in clover-seed plantations, feeding both on flowers (crown petals or pollen) and fruits, which in turn reduces the seed yield [10,11,12]. Parthenogenetic H. niger females are more fertile, which may result in a rapid increase in its populations in infested plantations. In turn, the bisexual H. leucanthemi is not a recognized pest of Trifolium plants and its individuals are effective pollinators of Asteraceae plants. Hence, determining the relationships between those two species is important not only for the proper description of thrips-species diversity, but also for the identification of pests that threaten commercial crops.
Priesner (1964) [13], Schliephake and Klimt (1979) [14], and Moritz (2006) [15] described morphological differences between H. leucanthemi and H. niger, but further studies revealed that the measurements overlap considerably and the definitive separation of both species is problematic [9]. However, measurements performed by members of our team (H.K. and K.K.) on archival specimens revealed the existence of some subtle morphological differences in both adults and second instar larvae that might be species specific (details in Appendix A: Table A1 and Table A2, Figure A1, Figure A2 and Figure A3). First of all, in adults the prothorax and abdominal segment IX are longer in H. leucanthemi, but the prothorax epimeral setae are longer in H. niger. Differences can also be seen in the postocular setae, which are pointed at the apex in H. leucanthemi and blunt in H. niger adults. Similar observations have been previously described by Schliephake and Klimt (1979) [14], and Moritz (2006) [15]. Moreover, a new potentially species-specific difference was observed in adults: the spiracle on abdominal segment VIII is round and its diameter is larger in H. leucanthemi than in H. niger (17.5 μm versus 10 μm on average). Additional potentially species-specific differences have also been identified for second instar larvae. Measurements of the body, antennae, as well as the prothorax setae (D1, D4, D5, and D6) lengths revealed their higher values in H. niger larvae. In turn, the length and width of spiracles on the mesothorax and abdomen (segments II and VIII), and the numbers of cells in the spiracles were higher in H. leucanthemi larvae.
Taking into account those premises that prove at least the subtle distinctiveness of H. leucanthemi and H. niger, as well as the lack of molecular studies investigating their relationships, we decided to perform analyses of both mitochondrial (COI) and nuclear markers (28S and ITS2) to determine the genetic diversity of H. leucanthemi and H. niger. Additionally, as part of an integrative approach, we determined and analyzed the microbiota profiles associated with both H. leucanthemi and H. niger. Those analyses were based on high-throughput 16S rRNA gene sequencing.

2. Materials and Methods

Haplothrips leucanthemi and H. niger are not endangered or protected in the sampling areas, and sampling activities were not carried out at locations where specific permission is required. Specimens for molecular analyses were collected in June and July of 2019 from five sampling sites located in eastern Poland (Table 1). All larvae were collected from the same plants as adults. Species identification was performed based on the morphological traits described by Schliephake and Klimt (1979) [14], and Moritz (2006) [15]. The collected specimens were reared on their host plants: Leucanthemum vulgare, L. ircutianum, Trifolium montanum, and T. pratense, respectively. Thrips feeding in flowers of those plants were put into round plastic boxes (diameter 100 mm, height 40 mm) with a ring of moist filter paper placed on the bottom. All containers were stored in phytotron chambers under laboratory conditions at 22 °C with 16 h of light, 8 h of dark, and a 60% humidified atmosphere [16]. Both larvae and adults (females) were then picked from host plants, individually collected into sterile Eppendorf tubes and then stored at −80 °C until further analysis.
The collected specimens were then surface sterilized in 95% ethanol for 5 s to remove surface microbes and then washed three times in sterile distilled water. Finally, all individuals were separately transferred to sterile, distilled water, and then lysis buffer and proteinase K were added. DNA was extracted using Sherlock AX kit (A&A Biotechnology, Gdansk, Poland) according to the manufacturer’s protocol. Genetic material was extracted from the entire body of each of the collected thrips (specimens were not pooled). Sterile equipment was used to avoid cross-contamination of samples. The quantity and quality of the extracted DNA were evaluated using a NanoDrop ND-1000 spectrophotometer (NanoDrop Technologies Inc., Wilmington, DE, USA). After extraction, the DNA was stored at −20 °C until further use.
The mitochondrial COI fragment was amplified using primers HCO-2198/LCO-1490 [17]. Nuclear markers were amplified using THrd1a/28S B (28S) [18,19] and ITSF/ITSR (ITS2) [20] primers, respectively. In the case of 28S, additional internal primers were used during sequencing (28S THrd3a and 28S THrd3b, respectively) [19]. All PCR protocols are given in Table S1. Products of amplification were separated by 1% agarose gel electrophoresis in a 1x SB buffer and visualized with SimplySafe (EURx, Gdańsk, Poland) in UV light. All products were purified with EPPiC Fast (A&A Biotechnology, Gdynia, Poland) according to the protocol and sequenced with the BigDye terminator cycle sequencing method. In the case of ITS2, only amplicons obtained for homozygous specimens were sequenced. All newly obtained sequences were deposited in the GenBank database (accession nos. MZ047773-MZ047779 for COI, MZ191780-MZ191791 for 28S, and MZ478147-MZ478157 for ITS2).
The genetic material extracted from collected specimens was also used for microbiota profiling. The V3-V4 hypervariable regions of the bacterial 16S rRNA gene were amplified using primers 341F/785R [21]. Libraries were prepared with a two-step PCR protocol based on Illumina’s “16S metagenomic library prep guide” (15044223 Rev. B), NEBNext® Q5 Hotstart High-Fidelity DNA polymerase (New England BioLabs Inc., Ipswich, MA, USA), according to the manufacturer’s protocol using Q5® Hot Start High-Fidelity 2× Master Mix (NEBNext—New England BioLabs). The PCR conditions were as follows: 98 °C for 30 s for initial denaturation, 98 °C for 10 s, 55 °C for 30 s, 72 °C for 20 s repeated for 25 cycles, followed by a final extension at 72 °C for 2 min, and the Nextera Index kit (2 × 250 bp). Paired-end (PE, 2 × 250 nt) sequencing with a 5% PhiX spike-in was performed with an Illumina MiSeq (MiSeq Reagent kit v2) at Genomed, Warsaw, Poland, following the manufacturer’s run protocols (Illumina, Inc., San Diego, CA, USA). The automatic primary analysis and the demultiplexing of the raw reads were performed with MiSeq with the use of MiSeq Reporter (MSR) v2.6 (16S Metagenomics Protocol). Raw NGS data were deposited and are fully available in the European Nucleotide Archive (accession number PRJNA730011).
The obtained raw sequential reads were then analyzed using dedicated software. Mitochondrial and nuclear sequences were analyzed using the BLAST application (Basic Local Alignment Search Tool) to browse sequences deposited in the NCBI database and to identify sequences that were homologous with them [22]. All sequences were manually corrected using BIOEDIT 5.0.9 [23] and aligned in CLUSTAL OMEGA using default settings [24]. Additionally, COI sequences were translated into amino-acid sequences using the EMBOSS-TRANSEQ application to check against pseudogenes [25,26]. The software package DNASP 5.10.01 was used to retrieve haplotypes [27] and MEGA X software was applied in order to calculate the uncorrected p-distances [28]. Additionally, in MEGA X we calculated the uncorrected p-distances among other species belonging to the Haplothrips genus. Sequences submitted to the GenBank public database were used in that analysis and its aim was to estimate the range of interspecies genetic distance within the genus. Moreover, the COI sequences obtained here were combined with those from GenBank to reconstruct phylogenetic relationships among the selected Haplothrips species. An analysis in jMODELTEST 2.1.10 with the assumptions of the Bayesian information criterion [29] allowed us to determine a model of evolution that best fit the data (HKY + I + G). A phylogenetic analysis was carried out using the Bayesian approach implemented in MRBAYES 3.1.2 [30]. The Markov chain Monte Carlo search was run with four chains for 10 million generations with a sampling frequency of 1/1000 trees, with a burn-in of 10%. The sequence of Haplothrips carpathicus (GenBank accession number: MG491888) was used as an outgroup in that analysis. The final phylogenetic tree was visualized in FIGTREE 1.4.2 (http://tree.bio.ed.ac.uk/software/figtree/, accessed on 23 November 2021) and edited in INKSCAPE 1.0.1 (https://inkscape.org, accessed on 23 November 2021). In turn, the reconstruction of the phylogenetic relationships among the haplotypes identified in the present study, with a TCS method [31], was undertaken in POPART software [32]. Outgroup sequences were not added to those analyses.
In the case of the microbiota profiling, demultiplexed paired-end reads were imported into QIIME2 (2019.1 release) [33]. The DADA2 algorithm was applied to filter out noise and correct errors in marginal sequences, remove chimeric sequences, merge paired-end reads, and summarize amplicon sequence variants (ASVs) [34]. The taxonomy assignment was performed with a pre-trained SILVA 132 99% out-based Naïve-Bayes classifier [35]. ASVs matching with chloroplast and mitochondrial sequences were removed from the dataset for downstream analyses. The determination of alpha and beta diversity was performed using the QIIME2 core-diversity metrics. The dataset was rarefied to a depth of 21,193 reads per sample. Differences in alpha-diversity indices among the sample groups were statistically assessed with the Kruskal–Wallis test. To view the composition of the samples at each level of taxonomy, the QIIME2 taxa-bar-plot command was used.
Further statistical analyses were conducted using specialized software. PRIMER 7 software [36] was used to calculate a permutation-based multivariate analysis of variance (PERMANOVA) and to determine whether there were significant differences among predefined groups of samples (i.e., grouped according to the taxonomy of the host or its developmental stage). The same software was used to calculate a two-dimensional principal-coordinate analysis (PCoA) and non-metric multidimensional scaling (nMDS), as well as to generate PCoA and nMDS plots. In PAST 4.0 software [37] we performed similarity-percentage analysis (SIMPER) to calculate the average dissimilarities in bacterial-community structures between samples at the family level. According to the Diss/SD values, we identified those families which were primarily responsible for the observed differences among profiles (larger number means more consistent contributions to the dissimilarity between profiles). A similarity-profile (SIMPROF) test was used to identify well-defined groups of samples [38]. Finally, to illustrate the most abundant bacterial families and microbiome relationships across the tested samples, a heatmap and dendrogram were generated with the Bray–Curtis dissimilarity index. All statistical multivariate analyses were performed using PRIMER 7 software.

3. Results

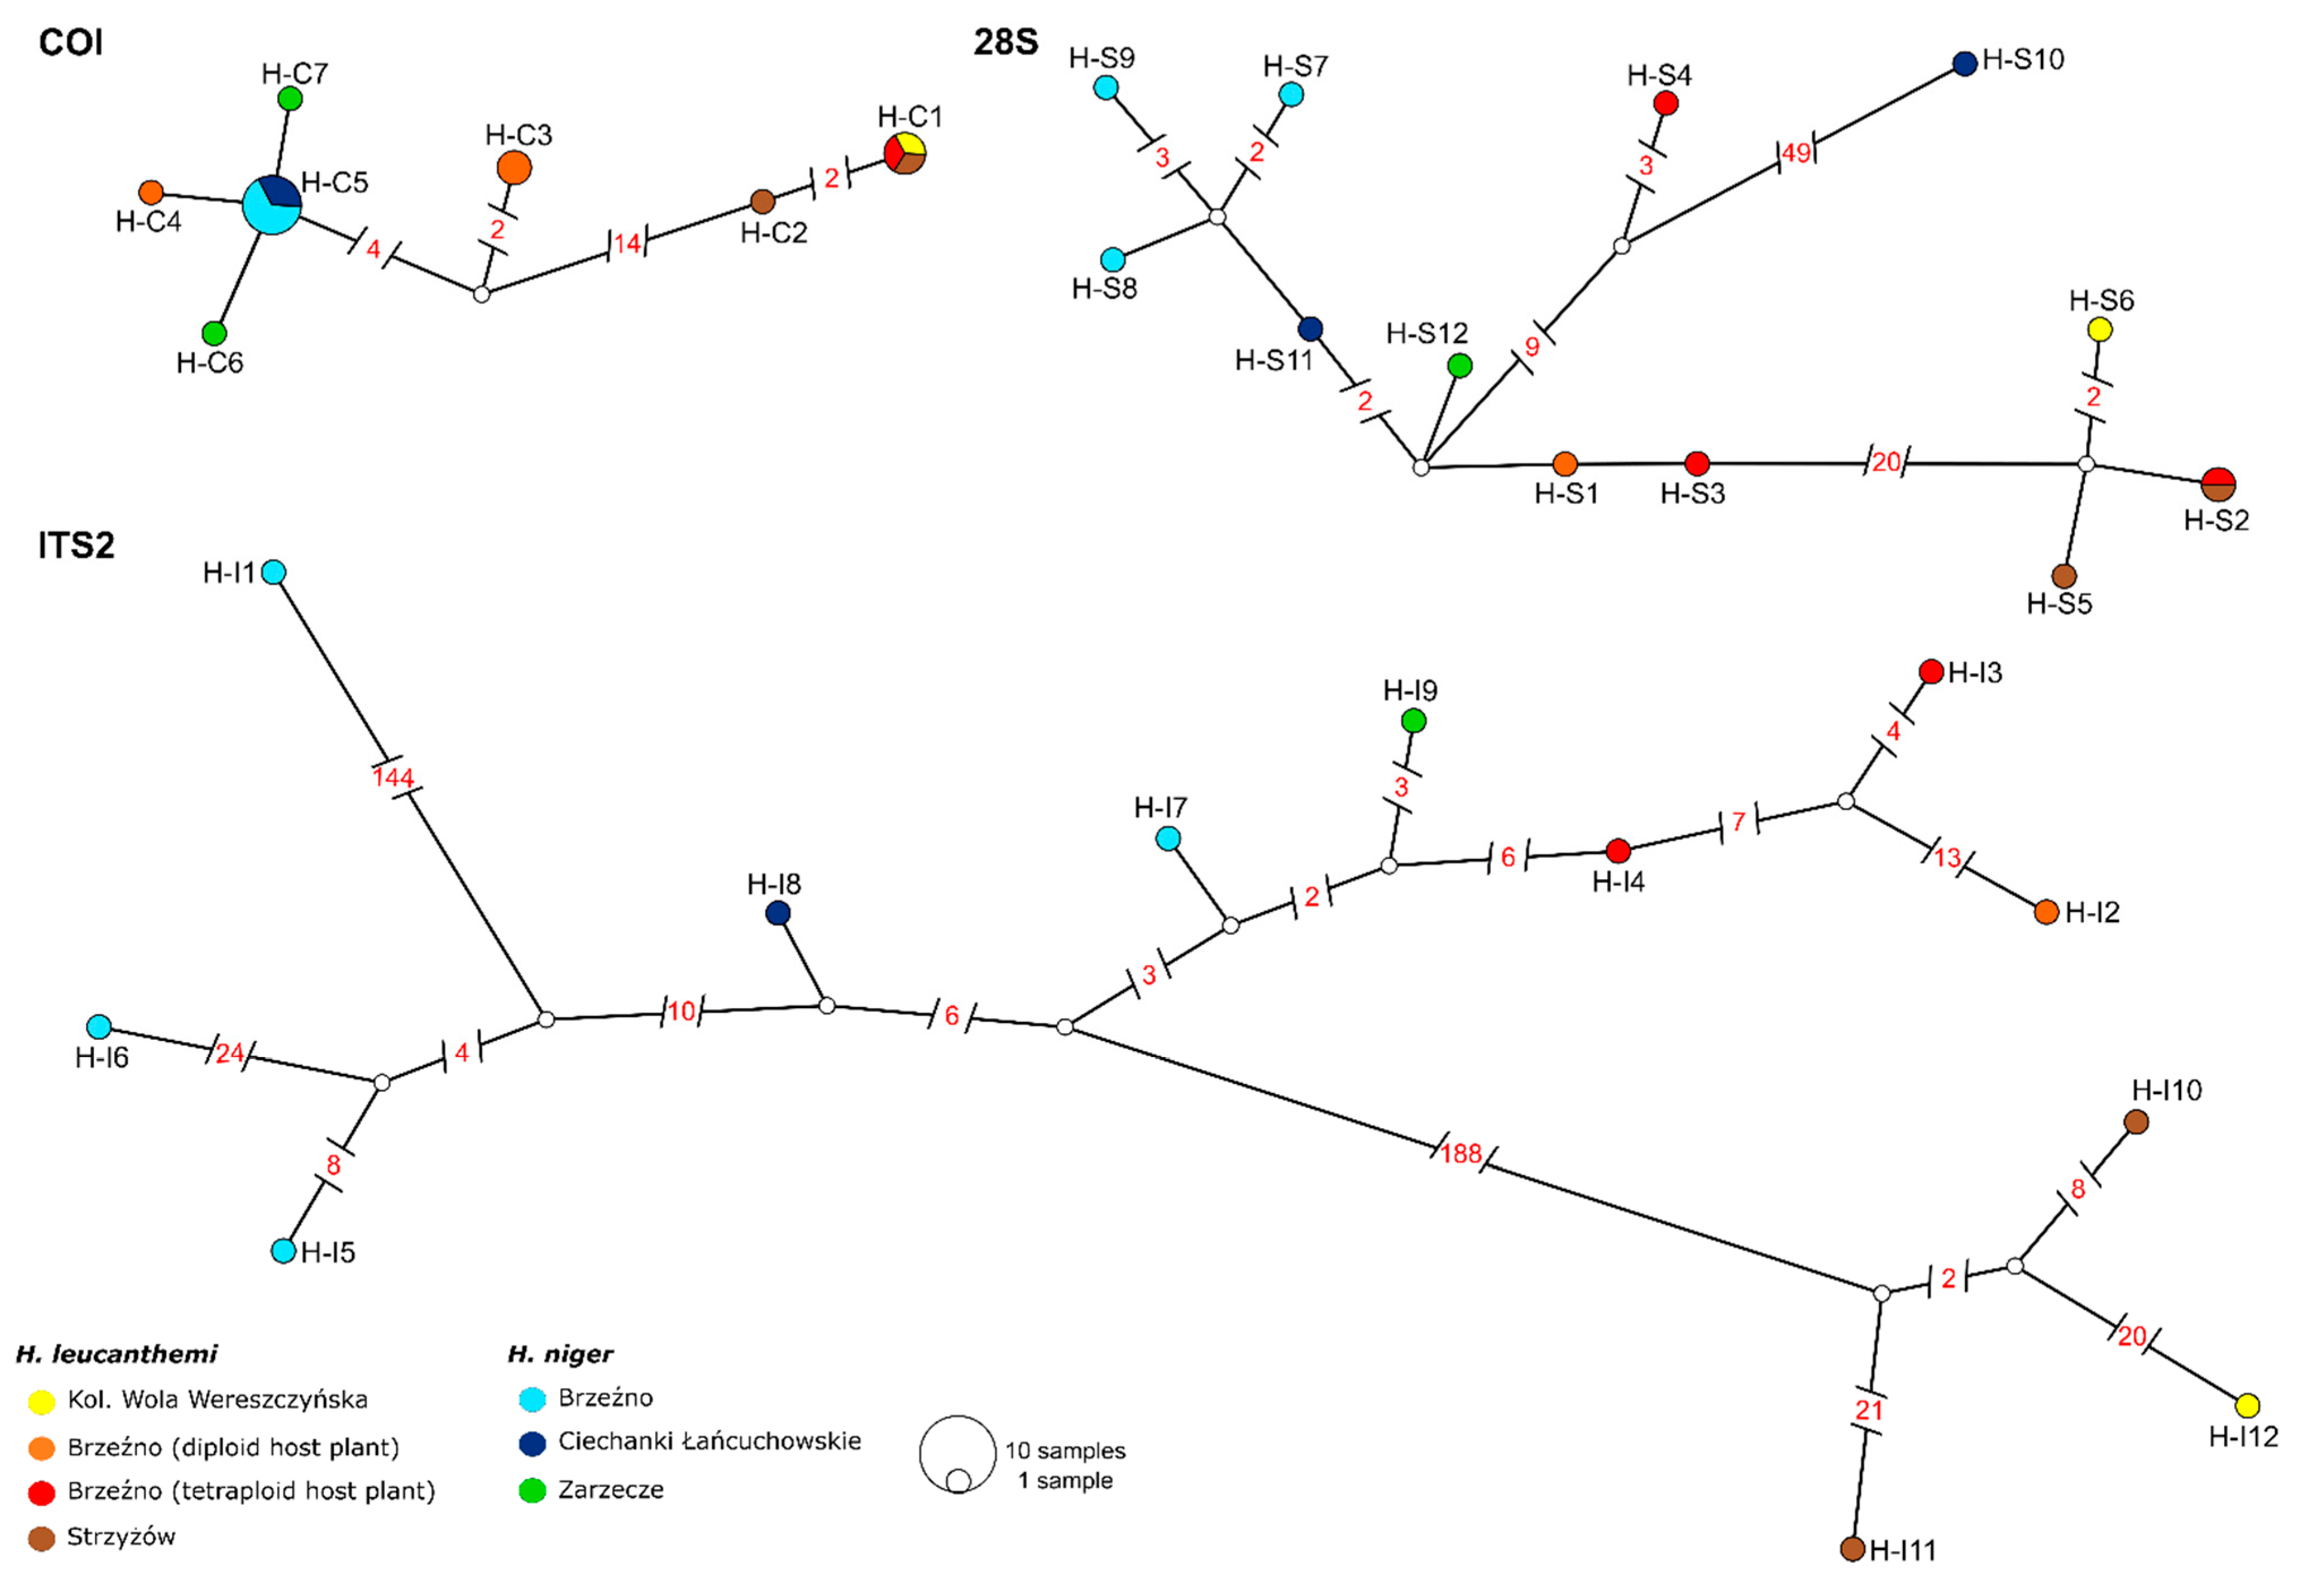
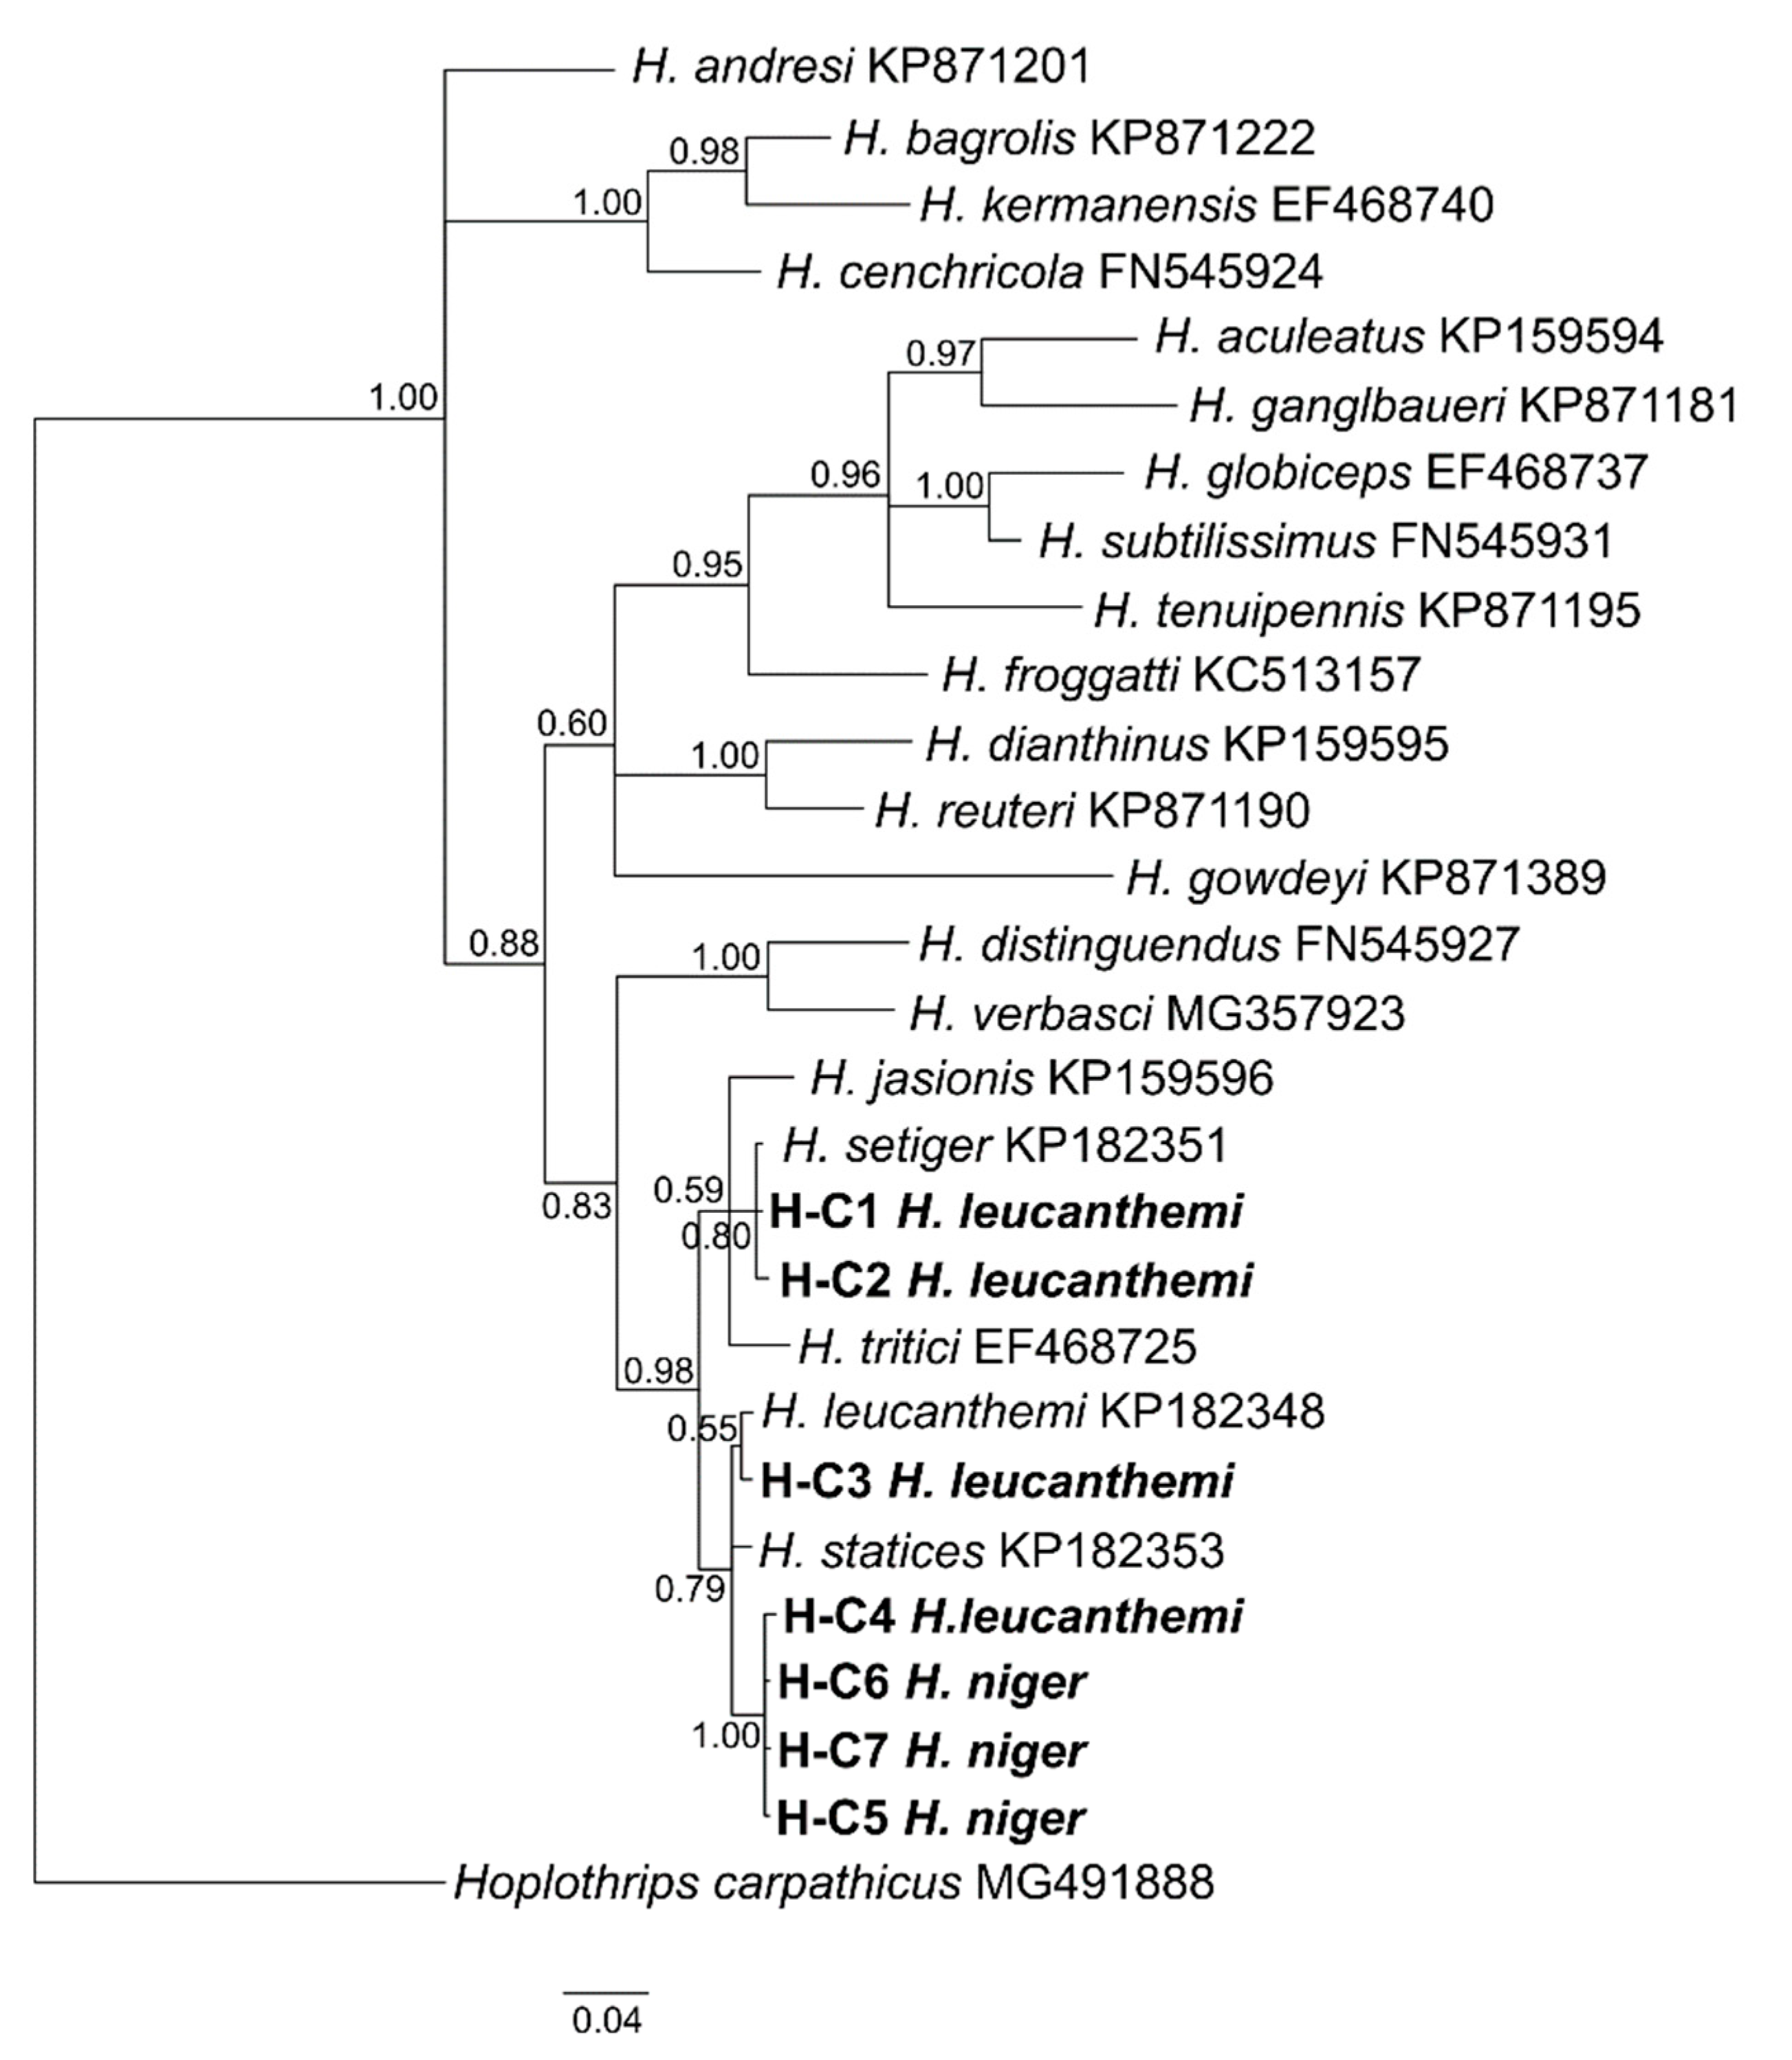
3.1. Phylogenetic Analyses

Both mitochondrial and nuclear markers were successfully amplified for collected individuals. Seven COI haplotypes were identified based on the nucleotide substitutions present in the analyzed sequences (589 bp). In turn, twelve unique sequences were identified both for 28S (705 bp) and for ITS2 (828 bp) (Table 2). In those sequences, both nucleotide substitutions and indels were noticed. None of the identified haplotypes (neither mitochondrial nor nuclear) was shared between representatives of H. leucanthemi and H. niger.
The topologies of the haplotype networks determined for selected markers did not support the distinctiveness of H. leucanthemi and H. niger, and the haplotypes identified for both thrips species did not form separate haplogroups (Figure 1). Complex relationships among identified haplotypes were also seen in the calculated values of the p-distance for pairs of those haplotypes (Table S2). In the case of COI, the values of the p-distance were estimated to be in the range of 0.00170–0.03565. The lowest values were reported for two pairs of haplotypes identified for H. niger (H-C5–H.C6 and H-C5–H-C7) but also for a pair of haplotypes determined for H. niger and H. leucanthemi (H-C5 and H-C4). In turn, the highest values were mainly reported for pairs including haplotypes determined for two selected species (i.e., pairs H-C1–H-C6, and H-C1–H-C7) but also for pair H-C1–H-C4 where both haplotypes were identified for H. leucanthemi. For nuclear markers, the values of the p-distance were estimated to be in the range of 0.00144–0.11705 for 28S and 0.00783–0.42629 for ITS2 (Table S2). Similar to the p-distance estimated for COI, the highest values were calculated for pairs including haplotypes that were determined for two thrips species.
The mitochondrial COI haplotypes determined here were also used to resolve phylogenetic relationships among H. leucanthemi, H. niger, and other congeneric species (Figure 2). Neither H. leucanthemi nor H. niger formed a monophyletic clade. Haplotypes H-C1 and H-C2 (both determined for H. leucanthemi) were more similar to the sequence determined for H. setiger (GenBank accession number: KP182351) than to other haplotypes of H. leucanthemi. In turn, the haplotypes determined for H. niger were closely related to haplotype H-C4 that was identified for H. leucanthemi, which was also seen in the haplotype network (Figure 1). Surprisingly, the haplotype determined for H. statices (GenBank accession number: KP182353) was intermingled with those identified for both H. leucanthemi and H. niger. Additionally, values of the p-distance indicated the high similarity of those haplotypes (mean p-distance: 0.0174 between H. leucanthemi and H. statices, and 0.0150 between H. niger and H. statices) (Table S3).

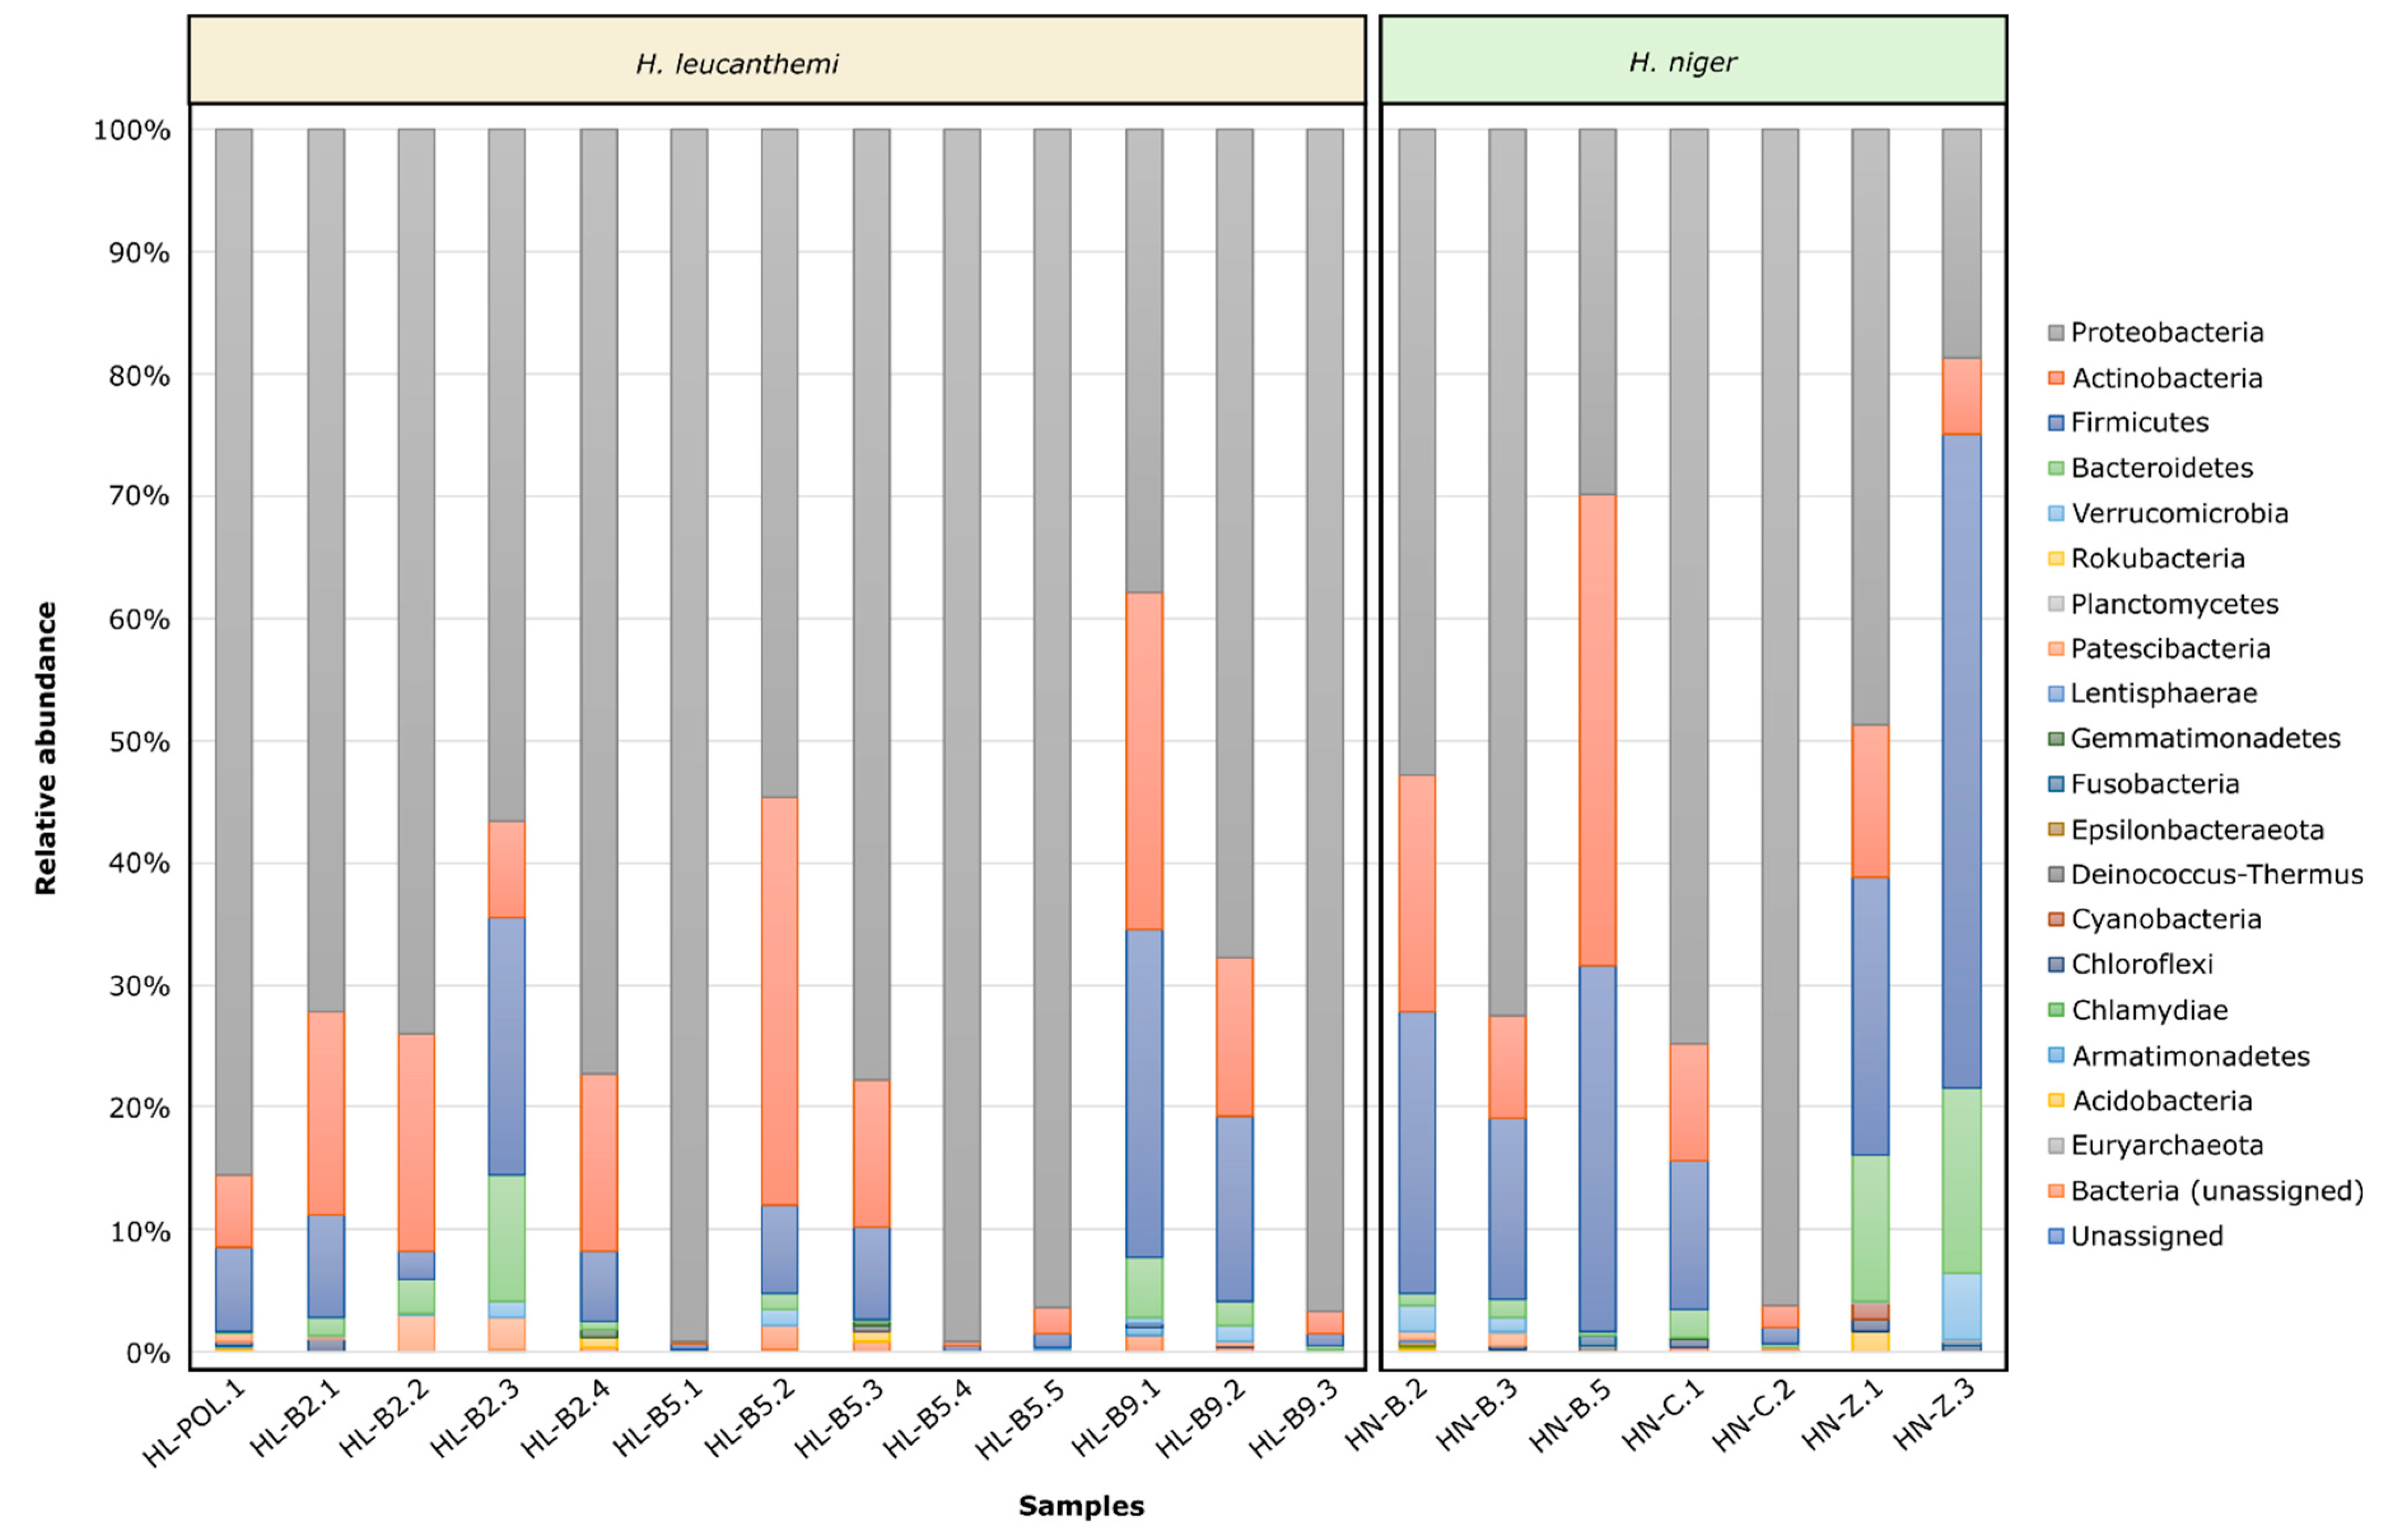
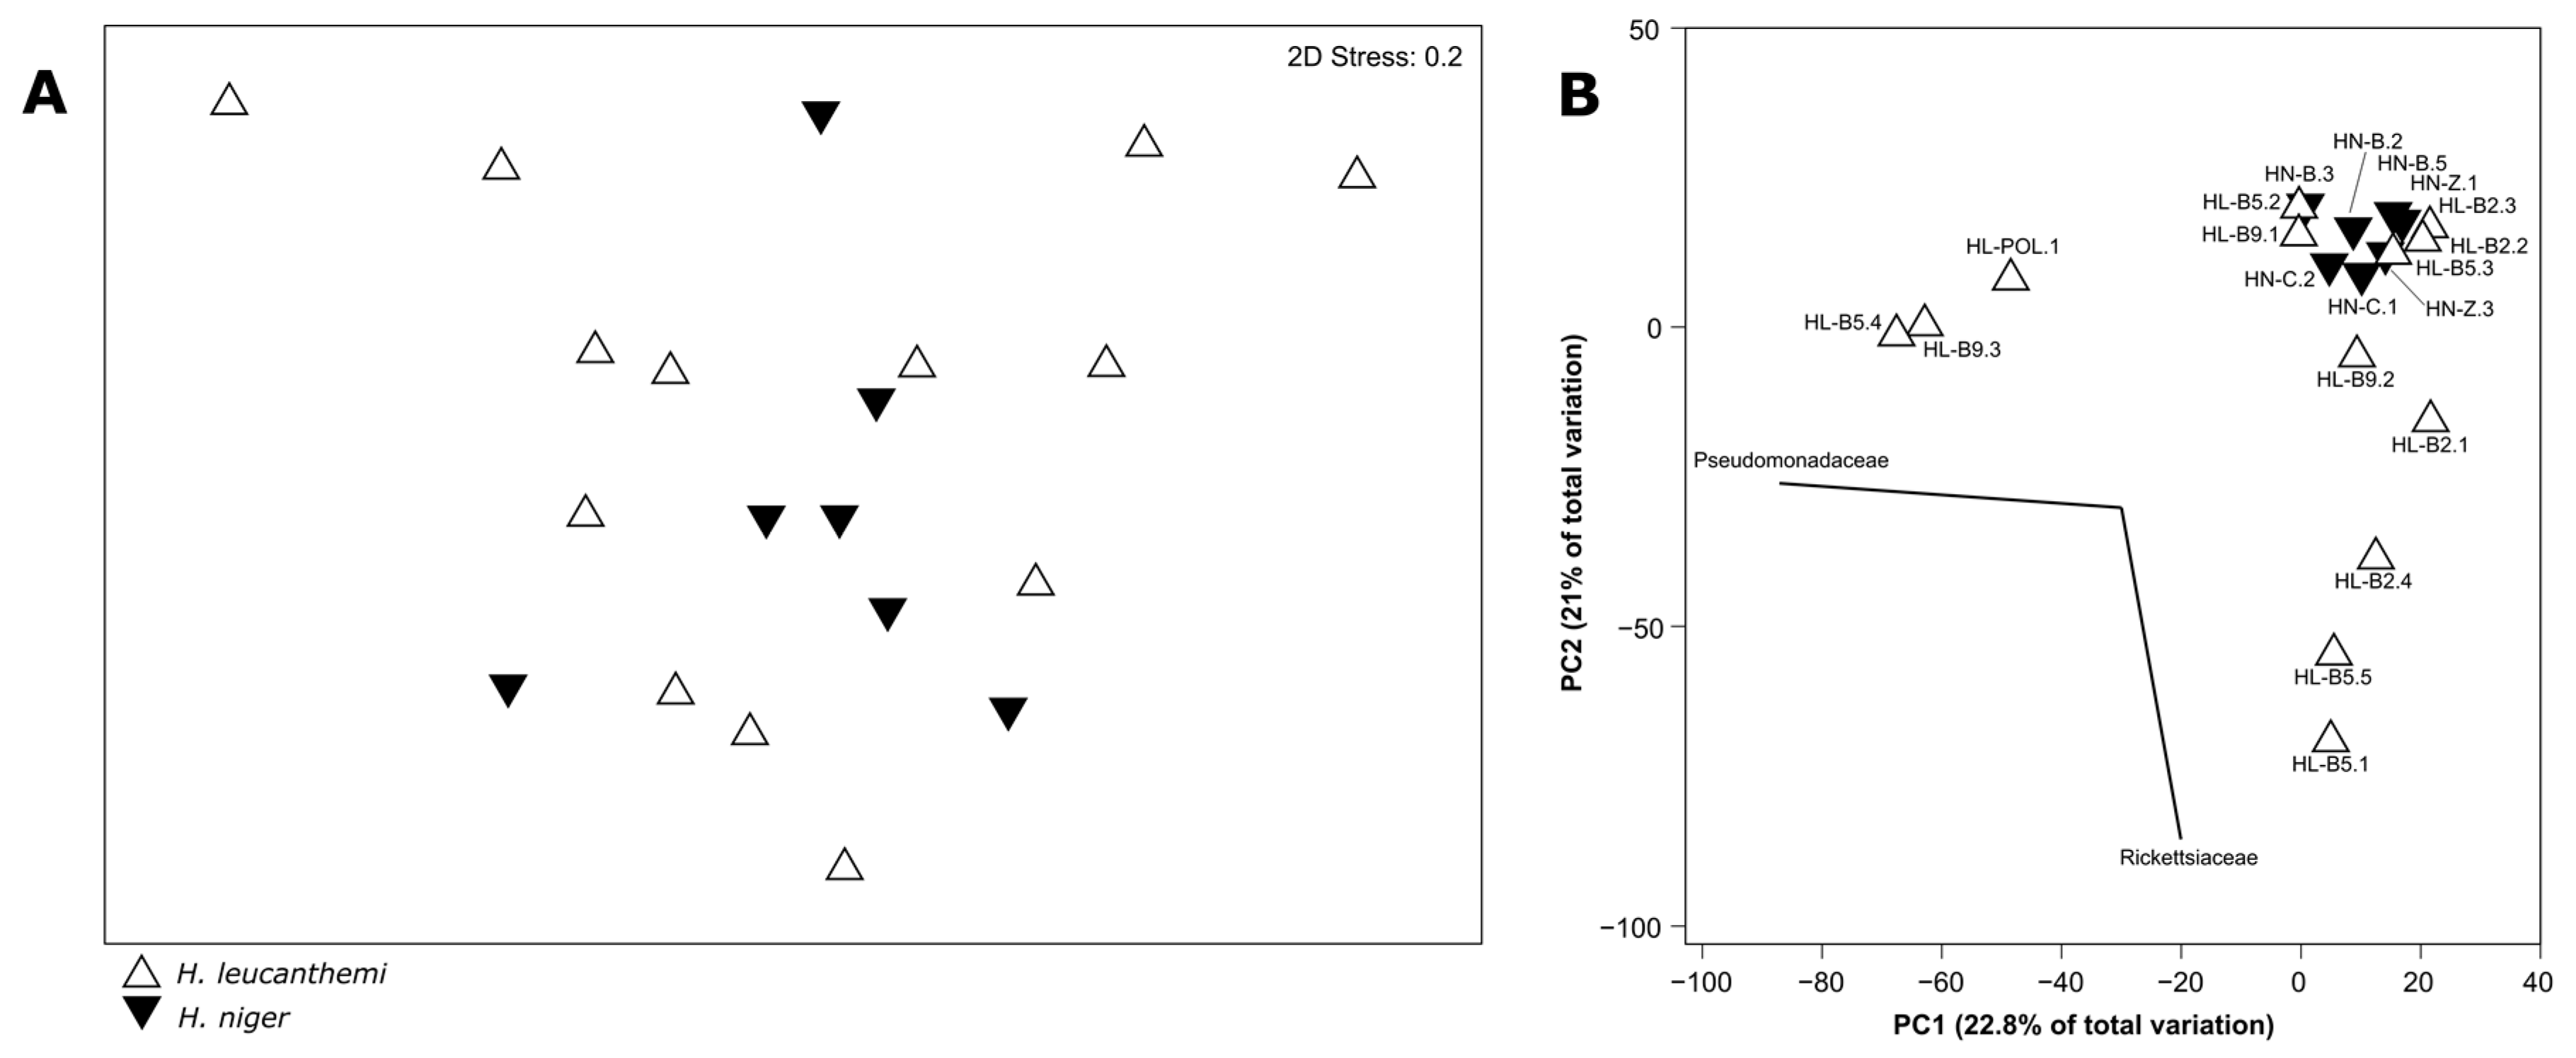
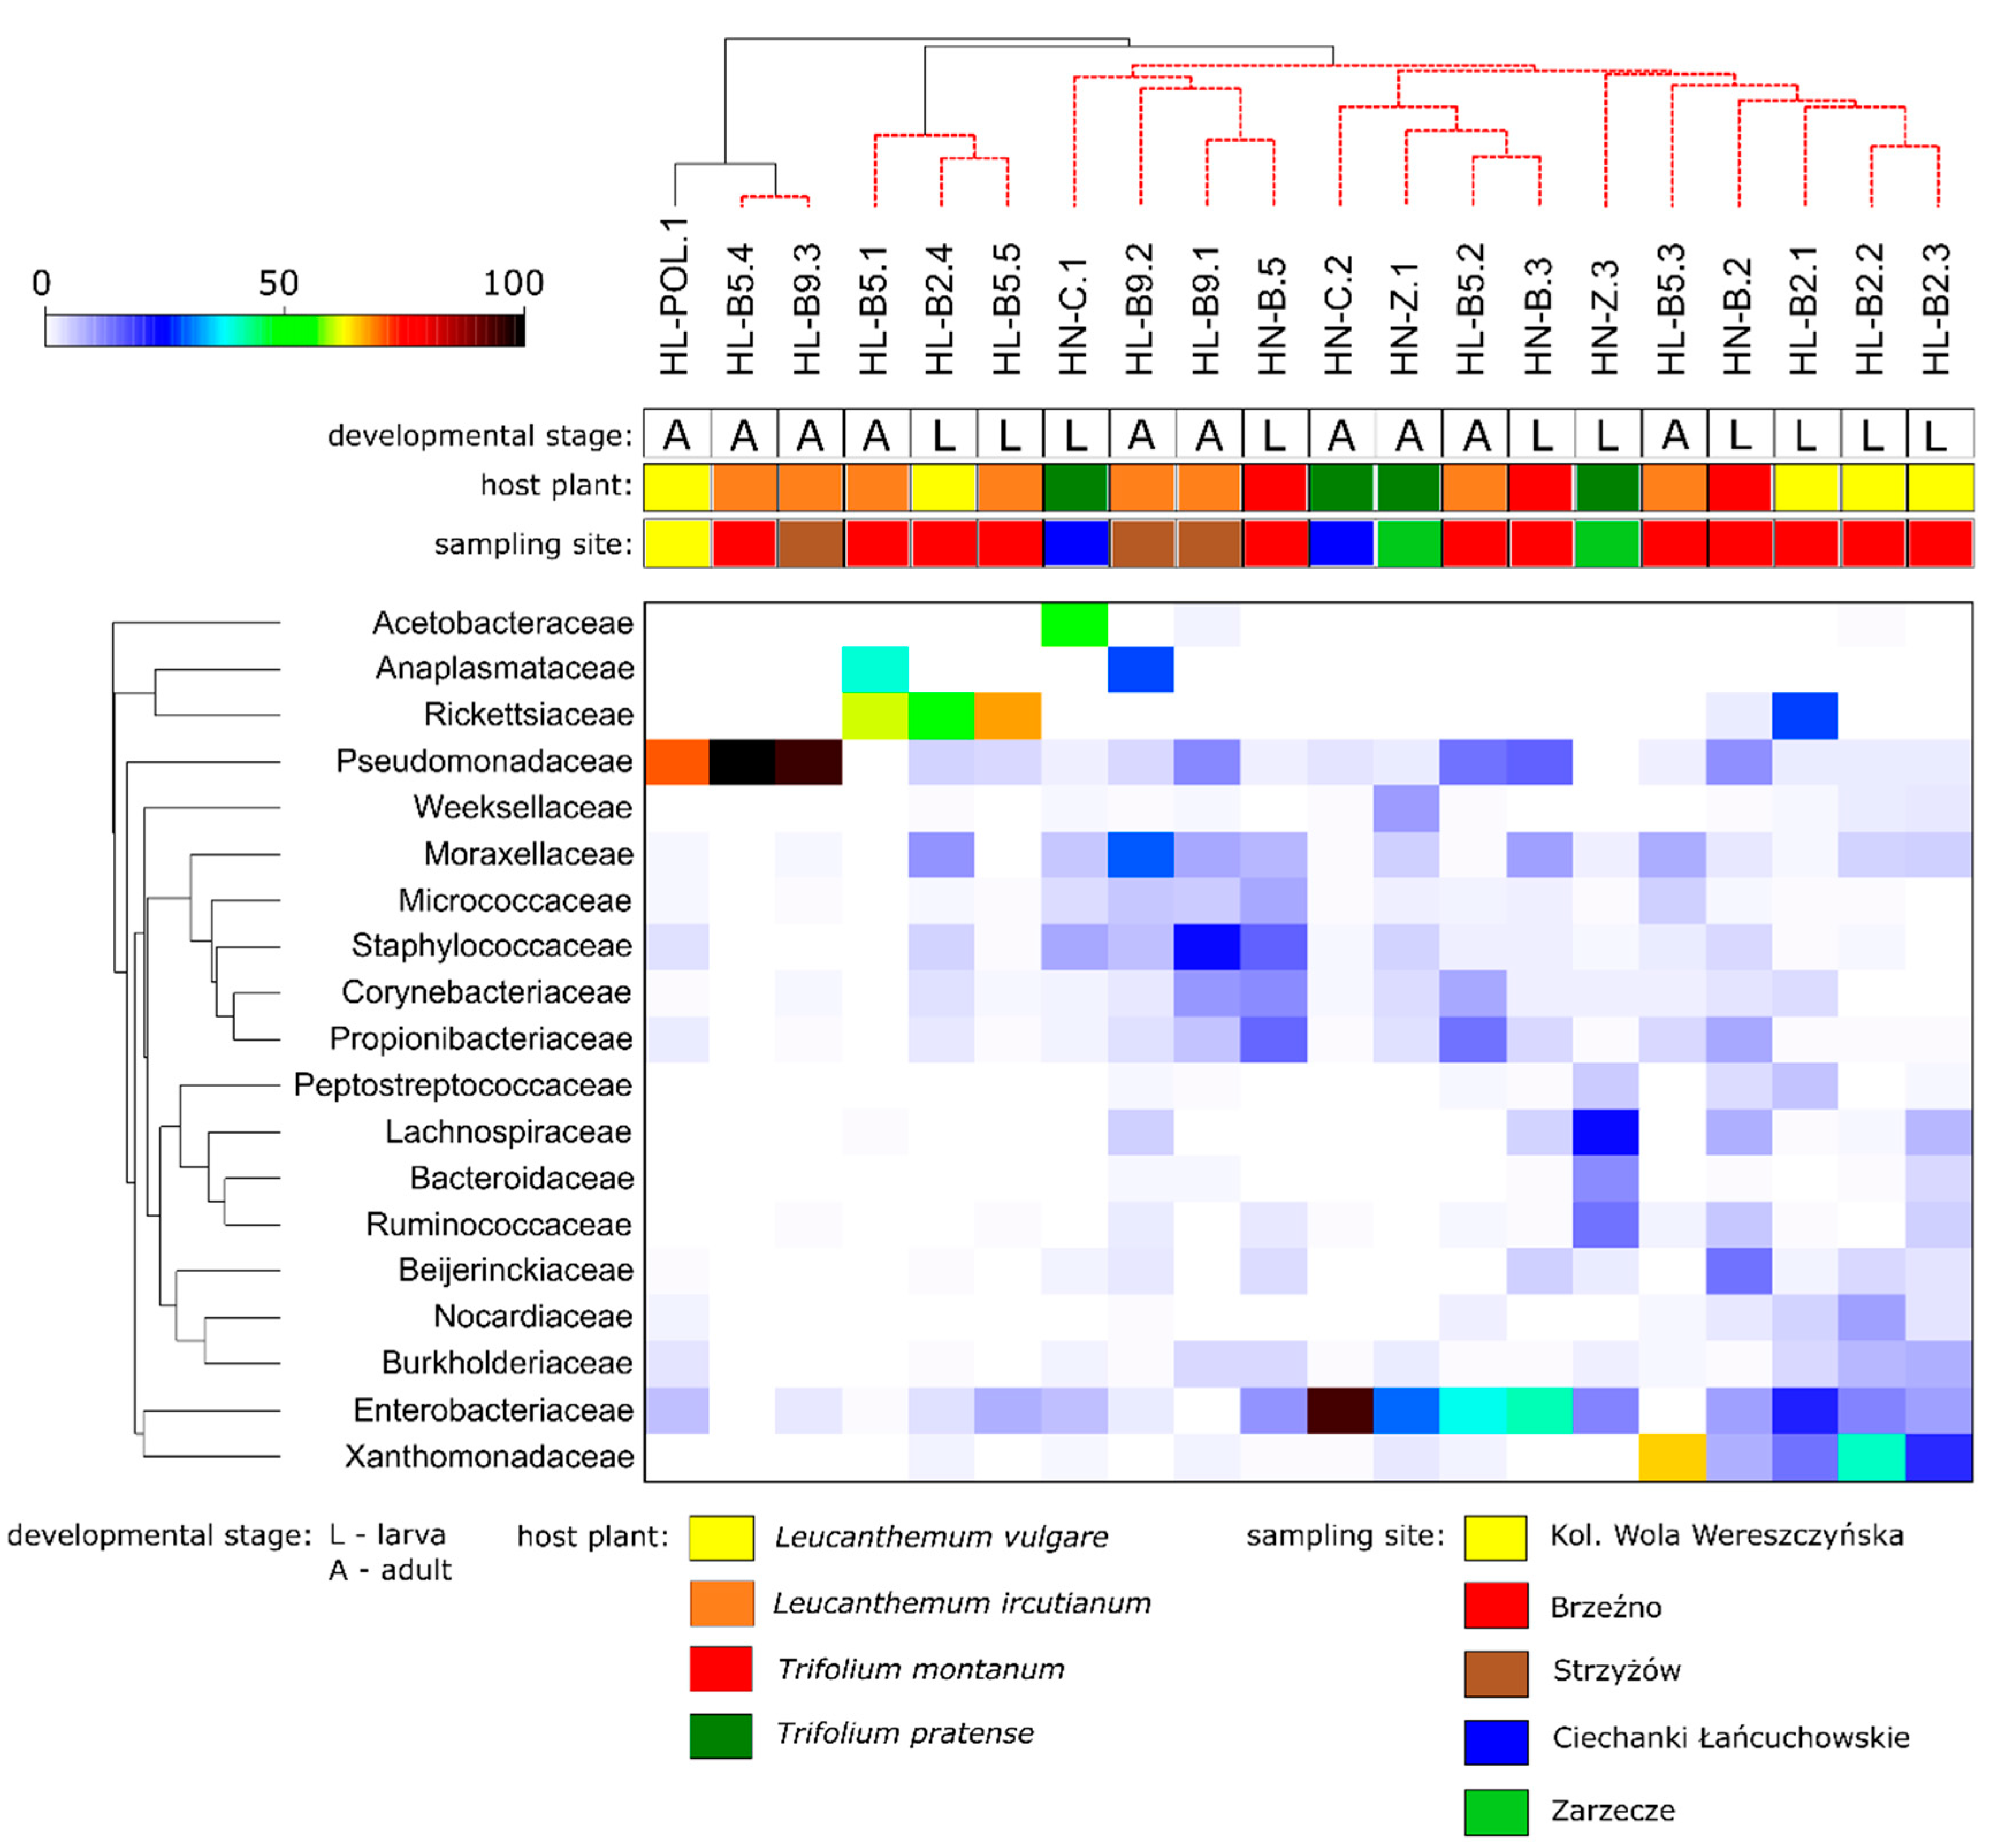
3.2. Microbiota Profiling

After quality control and removing both mitochondrial and chloroplast sequences, we obtained a total of 1,359,460 demultiplexed sequences from 20 specimens of H. leucanthemi and H. niger. The mean sequence frequency was 69,973.0 per specimen (in the range of 21,193 for HN-C.1 to 95,998 for HL-B2.1). Analyses of alpha-diversity metrics revealed that the only significant difference was observed between the Shannon indices calculated for profiles determined for the H. leucanthemi adults and H. niger larvae (Kruskal–Wallis test (H): 4.20, p < 0.05).
The taxonomic classification yielded 19 phyla present in the analyzed microbial communities (Table S4). All tested samples contained high abundances of Proteobacteria, Actinobacteria, Firmicutes, and Bacteroidetes (Figure 3). Representatives of those phyla jointly accounted for more than 93.62% of the total identified microorganisms (in the range of 93.62% for HN-Z3 to 99.99% for HL-B5.1). In turn, Actinobacteria and Gammaproteobacteria were the most abundant groups at the class level, and Pseudomonadales, Enterobacteriales, and Rickettsiales were the most abundant orders. At the family level, Pseudomonadaceae, Rickettsiaceae, and Enterobacteriaceae (Table S4) were found with the highest average abundances. Moreover, two known endosymbiotic bacteria, Wolbachia and Rickettsia, were found in the analyzed profiles. They were identified mostly in bacterial communities associated with H. leucanthemi (Wolbachia in HL-B5.1, HL-B5.3, and HL-B9.2; Rickettsia in HL-POL.1, HL-B2.1, HL-B2.2, HL-B2.4, HL-B5.1, HL-B5.3, HL-B5.5, and HN-B2) (Table S4).
The nMDS analysis based on the abundances of all the identified microbial families showed a high similarity of the tested microbiota profiles that were grouped according to the taxonomy of the host (stress value = 0.2; Figure 4A). Although the results of the PERMANOVA analysis showed that the differences between those two groups of microbiota profiles are significant (Pseudo-F = 1.8953, p = 0.048), the p-value was close to the significance limit. In turn, the PERMANOVA analysis that was performed on datasets that were grouped according to both the taxonomy of host and its developmental stage showed significant differences among the groups (Pseudo-F = 1.7240, p = 0.024). Nevertheless, the pairwise tests showed that only the differences identified between the determined profiles for both H. leucanthemi and H. niger larvae are significant (Pseudo-F = 1.3413, p = 0.037). The differences among the profiles that were grouped according to the host plant were not significant (Pseudo-F = 1.3087, p = 0.158).
The high similarity of the determined microbiota profiles was also observed in the PCoA plot (Figure 4B). The analysis identified two families (Pseudomonadaceae and Rickettsiaceae) that were determined as grouping vectors for the tested profiles. In turn, the SIMPER analysis indicated that 19 families were primarily responsible for the differences among the samples. The relative abundances of these families were used to generate a heatmap for all the tested profiles (Figure 5). The SIMPROF analysis did not support the profiles that were grouped according to the taxonomy of the specimens for which these profiles were determined, the host’s developmental stage, the host plant, or the sampling site. However, in this case, the PERMANOVA analysis also supported significant differences between the groups that were determined according to the host’s taxonomy (Pseudo-F = 1.9760, p = 0.048), as well as both the host’s taxonomy and developmental stage (Pseudo-F = 1.7609, p = 0.027). The pairwise tests showed that the differences were significant between the profiles associated with H. leucanthemi and H. niger larvae (Pseudo-F = 1.3292, p = 0.047). Other potential factors did not cause significant differences among the tested microbial communities.

4. Discussion

Thysanoptera is one of the insect orders in which taxonomic ambiguities are frequently observed. Undoubtedly, reported problems are strictly correlated with the small body size of both immature and adult thrips, their morphological polymorphisms and frequent lack of solid morphological characteristics, the co-existence of different species on the same host plant, and the high intraspecific variation found within thrips populations [39,40]. Thus, unambiguous delimitation of thrips species based only on diagnostic morphological traits is often difficult and burdened with a risk of error for inexperienced entomologists. In those cases, additional analyses (e.g., analyses of molecular markers or ecological factors) seem to be very helpful. An integrative approach supported by molecular analyses of COI mitochondrial markers allowed us to, e.g., consider Aeolothrips intermedius, Thrips tabaci and T. palmi complexes of cryptic (sub)species, as well as to identify Frankliniella occidentalis and Scirtothrips dorsalis species [41,42,43].
In the present study, we applied molecular analyses to resolve the relationships between Haplothrips leucanthemi and H. niger, the latter of which is considered to be a parthenogenetic form and potential biotype of H. leucanthemi. Those analyses represent the first integrative approach to resolve the relationships between these species and to test the potential differences at both the mitochondrial and nuclear level, as well as in profiles of their associated microbiota, which could be congruent with the observed subtle morphological differences that have been previously noticed in both selected species.
The molecular analyses were primarily based on the divergence of the COI gene fragment. Previously, this mitochondrial marker has been successfully utilized in the molecular identification of thrips species (also those infesting economically important crops) (e.g., [7,44,45,46,47]), in the substantiation of morphological-characteristic-based species identification [48], and in the discrimination of thrips reproductive forms [49], as well as in the identification of genetic variants, biotypes, ecotypes, cryptic species and species complexes [42,50]. The idea of a COI-based species identification assumes that the intraspecific divergence in this barcode marker is lower than 2% [51,52]. However, for several thrips species, the COI sequences demonstrate high intraspecific diversity resulting in a low barcode gap among those species [53]. Our results are in line with that observation (the highest value of the p-distance between two COI haplotypes determined for H. leucanthemi was 3.6%). In turn, the lowest value of the p-distance that was calculated for haplotypes determined for H. leucanthemi and H. niger was 0.02%, and such a value is characteristic of intraspecific rather than interspecific divergence. Moreover, the analysis of the mean p-distances that were calculated for the COI data determined for other Haplothrips species revealed that the low barcode gap is also observed in this genus (e.g., 1.7% between H. leucanthemi and H. statices, and 1.5% between H. niger and H. statices). Nevertheless, the analyses based on the COI revealed that the relationships between H. leucanthemi and H. niger are vague, and that specimens identified as H. niger should instead be recognized as H. leucanthemi. That observation was also supported by the analyses of nuclear markers.
The topology of the networks based on 28S and ITS2 data also did not reveal the clear separation of those two thrips representatives.
As an additional part of our chosen integrative approach, we also determined and analyzed the microbiota profiles associated with the collected specimens. The obtained results were congruent with those previously described for other thrips species. Proteobacteria, Actinobacteria, Firmicutes, and Bacteroidetes were found to be the most abundant bacterial phyla. Those groups are dominant in microbiota profiles of different insect species [54,55,56], and were also the most abundant in bacterial communities associated with other thrips, e.g., Hoplothrips carpathicus [57], Scirtothrips dorsalis [58], Thrips palmi [56], and T. tabaci [59].
Further analyses were performed to identify potential differences among the profiles determined for both H. leucanthemi and H. niger specimens. However, the nMDS, PCoA, and SIMPROF analyses showed a high similarity of the tested bacterial communities. Surprisingly, the SIMPROF analysis did not support the groups of profiles that were identified according to the developmental stage of the host.
Differences in the associated microbiota, which are congruent with the host’s development, have been previously reported for the fungivorous thrips Hoplothrips carpathicus [57] and other insect species (e.g., the oriental fruit flies Bactrocera dorsalis [60] and B. tryoni [61], the stag beetle Phalacrognathus muelleri [62], or the fungivorous beetle Bolitophagus reticulatus [63]), where significant dissimilarities were especially observed between the microbiota associated with larvae and adults. In the present study, the sample size was limited and additional microbiota profiles associated with those two developmental stages of H. leucanthemi and H. niger should be analyzed to confirm the lack of significant differences among their associated bacterial communities (especially taking into account that the results of the pairwise PERMANOVA tests supported the significant differences between the profiles associated with H. leucanthemi larvae and adults, and between the profiles determined for both H. leucanthemi and H. niger larvae).
Surprisingly, the results of the PERMANOVA analysis supported the significant differences between the microbiota profiles that were grouped according to the host taxonomy. Previous studies on insect microbiota have shown that the host’s taxonomy significantly affects gut bacterial communities [55,56]. Nevertheless, the p-value calculated here was on the verge of significance, so the observed differences are subtle rather than diagnostic.
The microbiota profiling performed in the present study revealed the presence of two known endosymbiotic bacteria (i.e., Wolbachia and Rickettsia) in the tested bacterial communities. Both of these endosymbionts have been described as bacteria that are able to manipulate host’s reproduction in several ways in order to enhance their own spread, and the induction of parthenogenesis is one such modification [64]. Endosymbiont-induced parthenogenesis has been observed in different hosts, e.g., mites, wasps, and thrips [64]. Moreover, further antibiotic treatment of thrips, e.g., Franklinothrips vespiformis or Hercinothrips femoralis, were introduced the production of males that copulated with females [65,66]. However, in the case of F. vespiformis, the experimental mating under laboratory conditions did not affect the sex ratios of the next generation, suggesting that the sperm do not fertilize the eggs [66]. H. niger is widely recognized as a parthenogenetic form of H. leucanthemi. Thus, one may expect that Wolbachia and Rickettsia should be present in the bacterial communities that are associated with its larvae and adults, but those bacteria were mostly observed in H. leucanthemi microbiota and were identified only in one H. niger profile. Thus, the endosymbiont-induced parthenogenesis in H. niger seems less likely. However, the present study should be considered as preliminary research, as a limited number of specimens were included in the main analyses. Thus, this study should be continued in a more comprehensive approach to confirm the obtained results.

5. Conclusions

An integrative approach based on the analyses of mitochondrial and nuclear molecular markers and microbiota profiling was used to determine the relationships between H. leucanthemi and H. niger. The results of the molecular analyses revealed the high intraspecific diversity of H. leucanthemi and did not support the distinctiveness of H. niger. The identified microbiota profiles were similar in both species and the performed analyses did not support the distinctiveness of H. niger. Significant differences were, in turn, observed between H. leucanthemi and H. niger larvae. Moreover, two known endosymbiotic bacteria were found in the analyzed microbiota profiles (i.e., Wolbachia and Rickettsia). Nevertheless, those symbionts were not predominantly found in the bacterial communities that are associated with H. niger and thus, its impact on the parthenogenetic mode of its reproduction seems less likely. However, in the present preliminary study, a limited number of H. leucanthemi and H. niger specimens were tested and further, more comprehensive studies are needed to confirm the obtained results.

Supplementary Materials

The following are available online at https://www.mdpi.com/article/10.3390/insects13030279/s1, Table S1: Thermocycling conditions for a routine amplification of selected mitochondrial and nuclear markers, Table S2: Values of p-distance and standard error for mitochondrial and nuclear haplotypes identified for Haplothrips leucanthemi and H. niger, Table S3: Mean values of p-distance and standard error for mitochondrial COI haplotypes identified for Haplothrips species. COI sequence for Thrips tabaci was used as an outgroup, Table S4: The relative abundance of microbial 16S rDNA sequences at different taxonomic levels.

Author Contributions

Conceptualization, A.K.-Z. and H.K.; project administration, A.K.-Z. and H.K.; resources, A.K.-Z. and H.K.; investigation, A.K.-Z., H.K., M.K. and K.K.; methodology, A.K.-Z. and H.K.; formal analysis, A.K.-Z., H.K. and K.K.; software, A.K.-Z.; data curation, A.K.-Z.; writing—original draft preparation, A.K.-Z. and H.K.; visualization, K.K.; writing—review and editing, A.K.-Z., H.K. and M.K. All authors have read and agreed to the published version of the manuscript.

Funding

This research received no external funding.

Institutional Review Board Statement

Not applicable.

Data Availability Statement

All newly obtained sequences are deposited in the GenBank database (accession nos. MZ047773-MZ047779, MZ191780-MZ19179, and MZ478147-MZ478157). Raw NGS data are deposited and fully available in the European Nucleotide Archive (accession no. PRJNA730011).

Acknowledgments

Calculations were carried out at the Centre of Informatics Tricity Academic Supercomputer & Network (Gdansk, Poland).

Conflicts of Interest

The authors declare no conflict of interest.

Appendix A

  • Sample Collection for Morphometric Study
The morphometric study on larvae of the two selected species were conducted in 2010–2011. The specimens of H. leucanthemi and H. niger were collected at various sites in eastern and southern Poland. Archival specimens deposited at the Department of Zoology and Nature Protection, Maria Curie-Skłodowska University in Lublin were also used in the study (Table A1). Most of the insects (except those donated by Zawirska) were collected in the field mainly along the roadsides and on meadows where their host plants grow. The insects were reared under the laboratory conditions which were described by Kucharczyk and Stanisławek [16]. Finally, the microscopic slides have been made in accordance with the procedures described by Mound and Kibby [67]. The morphometric characteristics of 15–20 specimens of larvae collected on each sampling site (Table A1) were analyzed. Photos were taken using an OLYMPUS BX 61 microscope and an Olympus CellSens Dimension image analyzer.
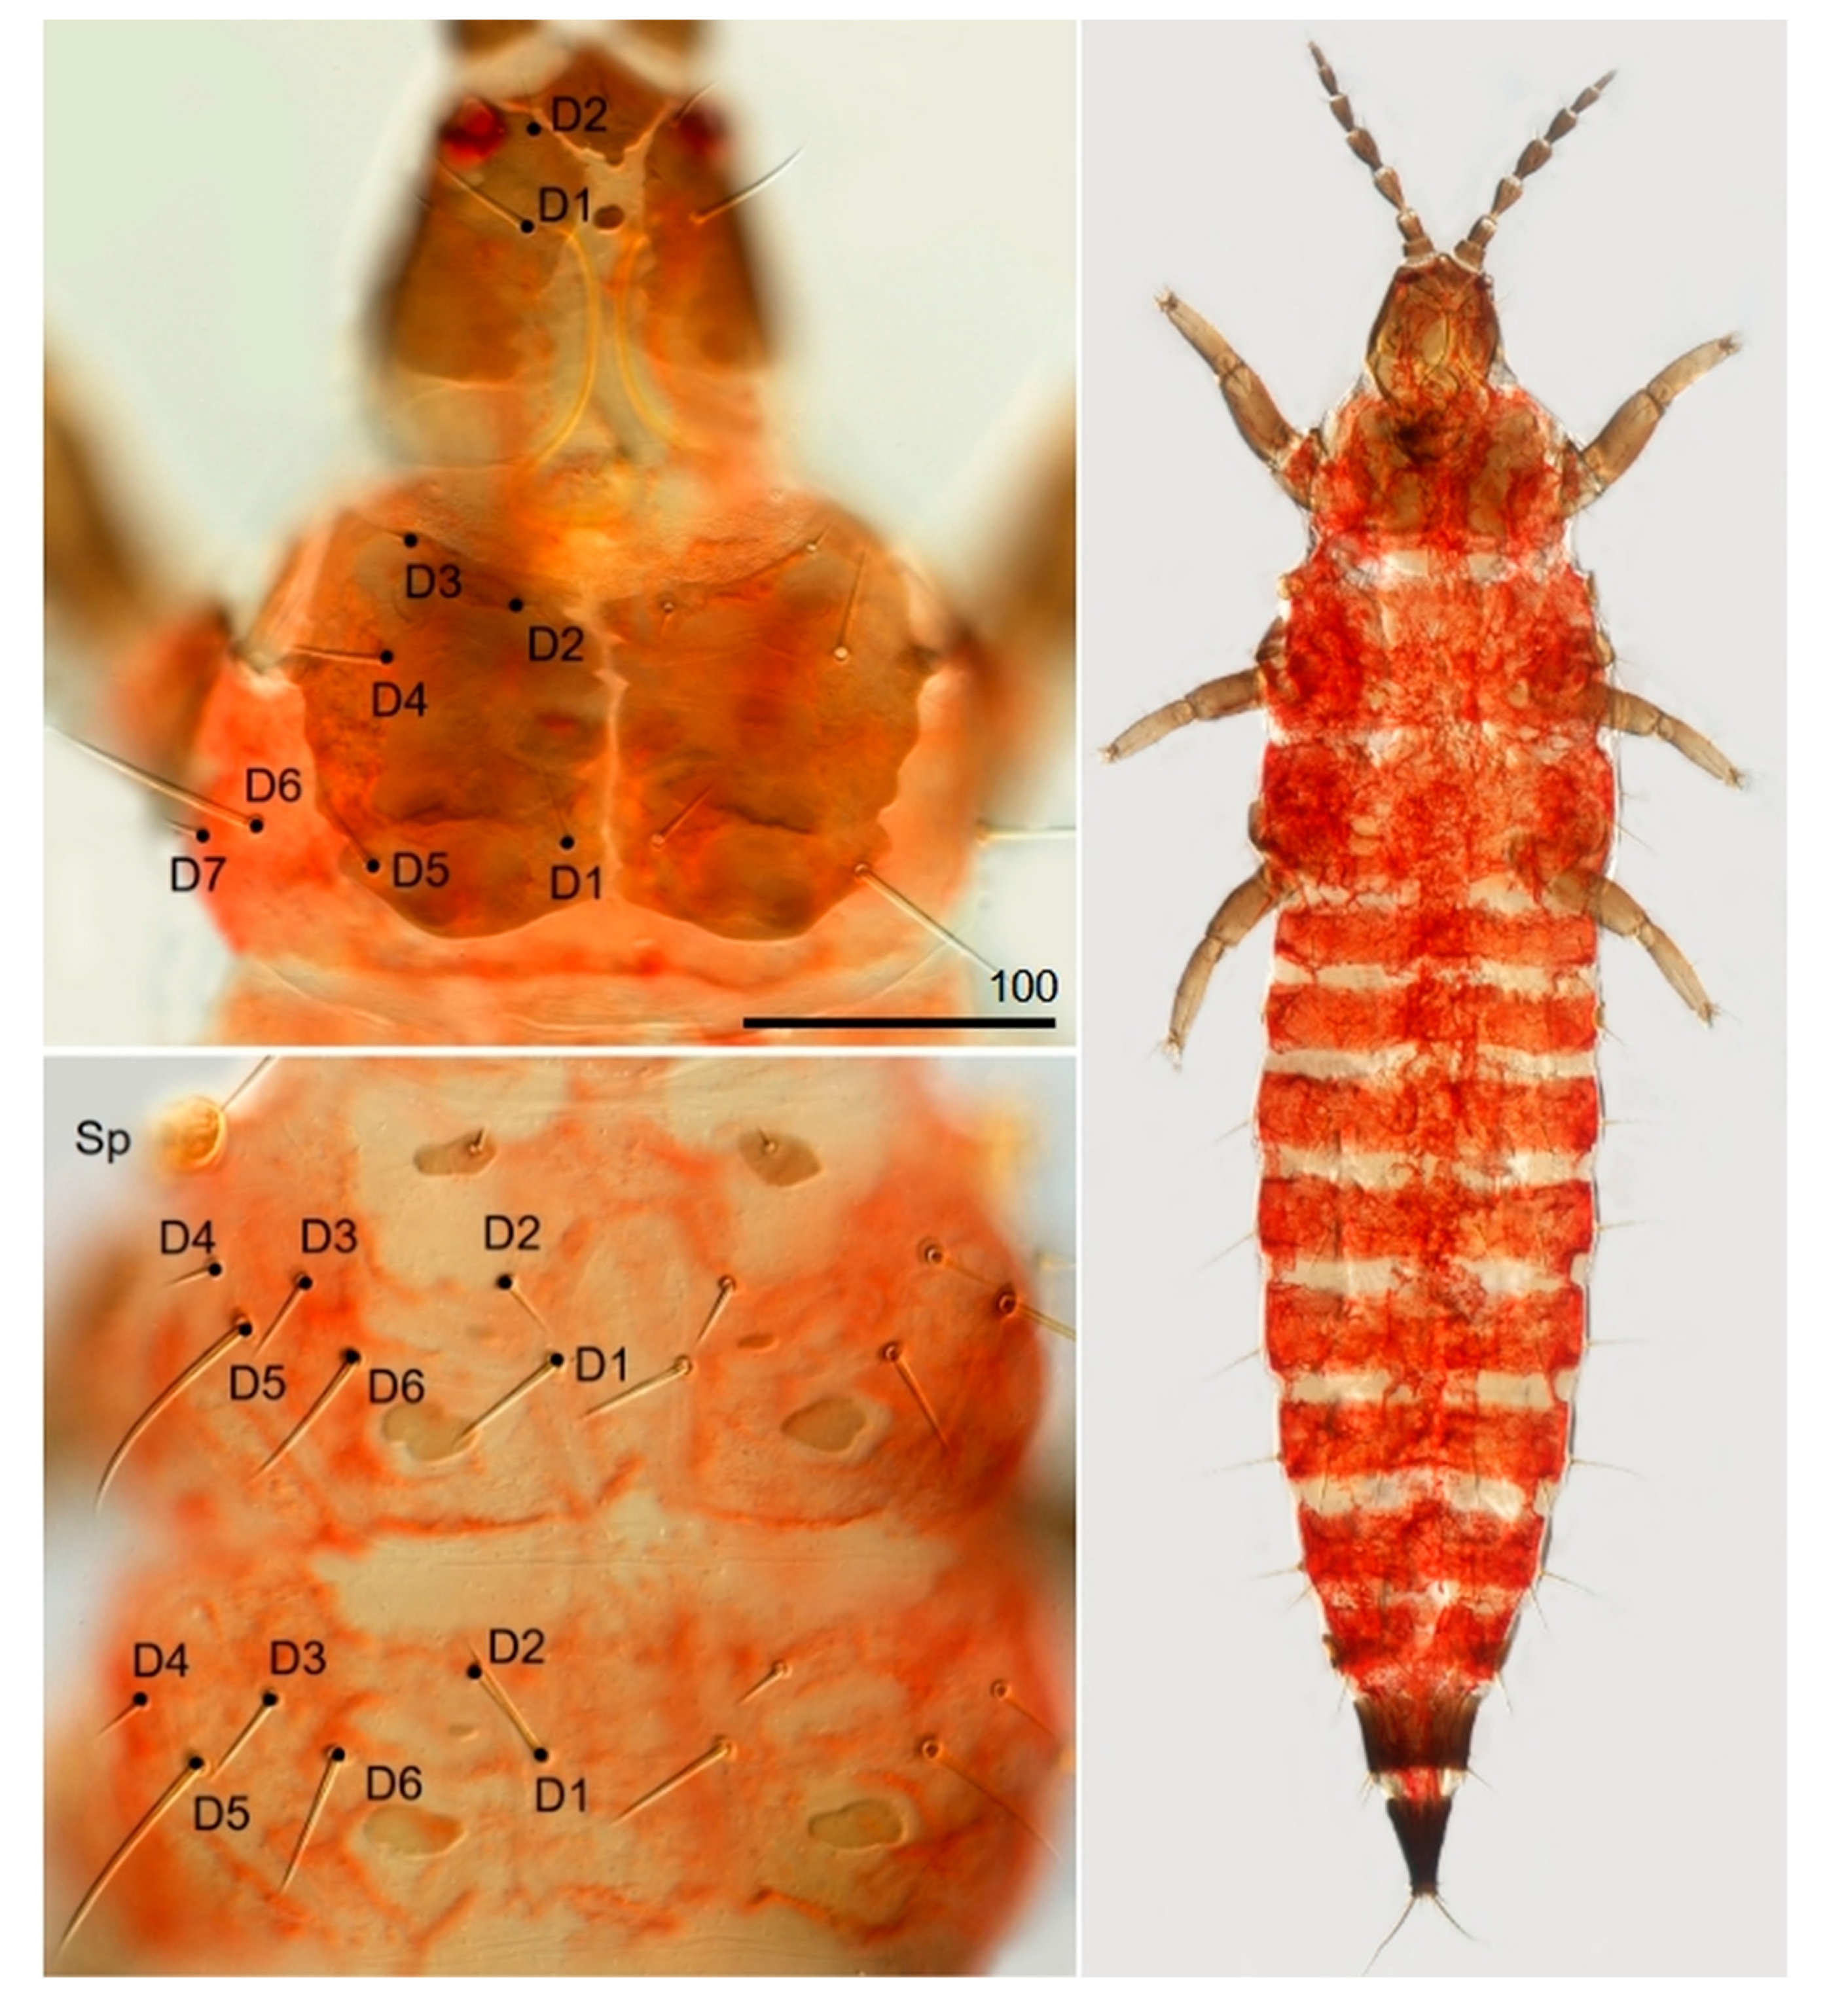
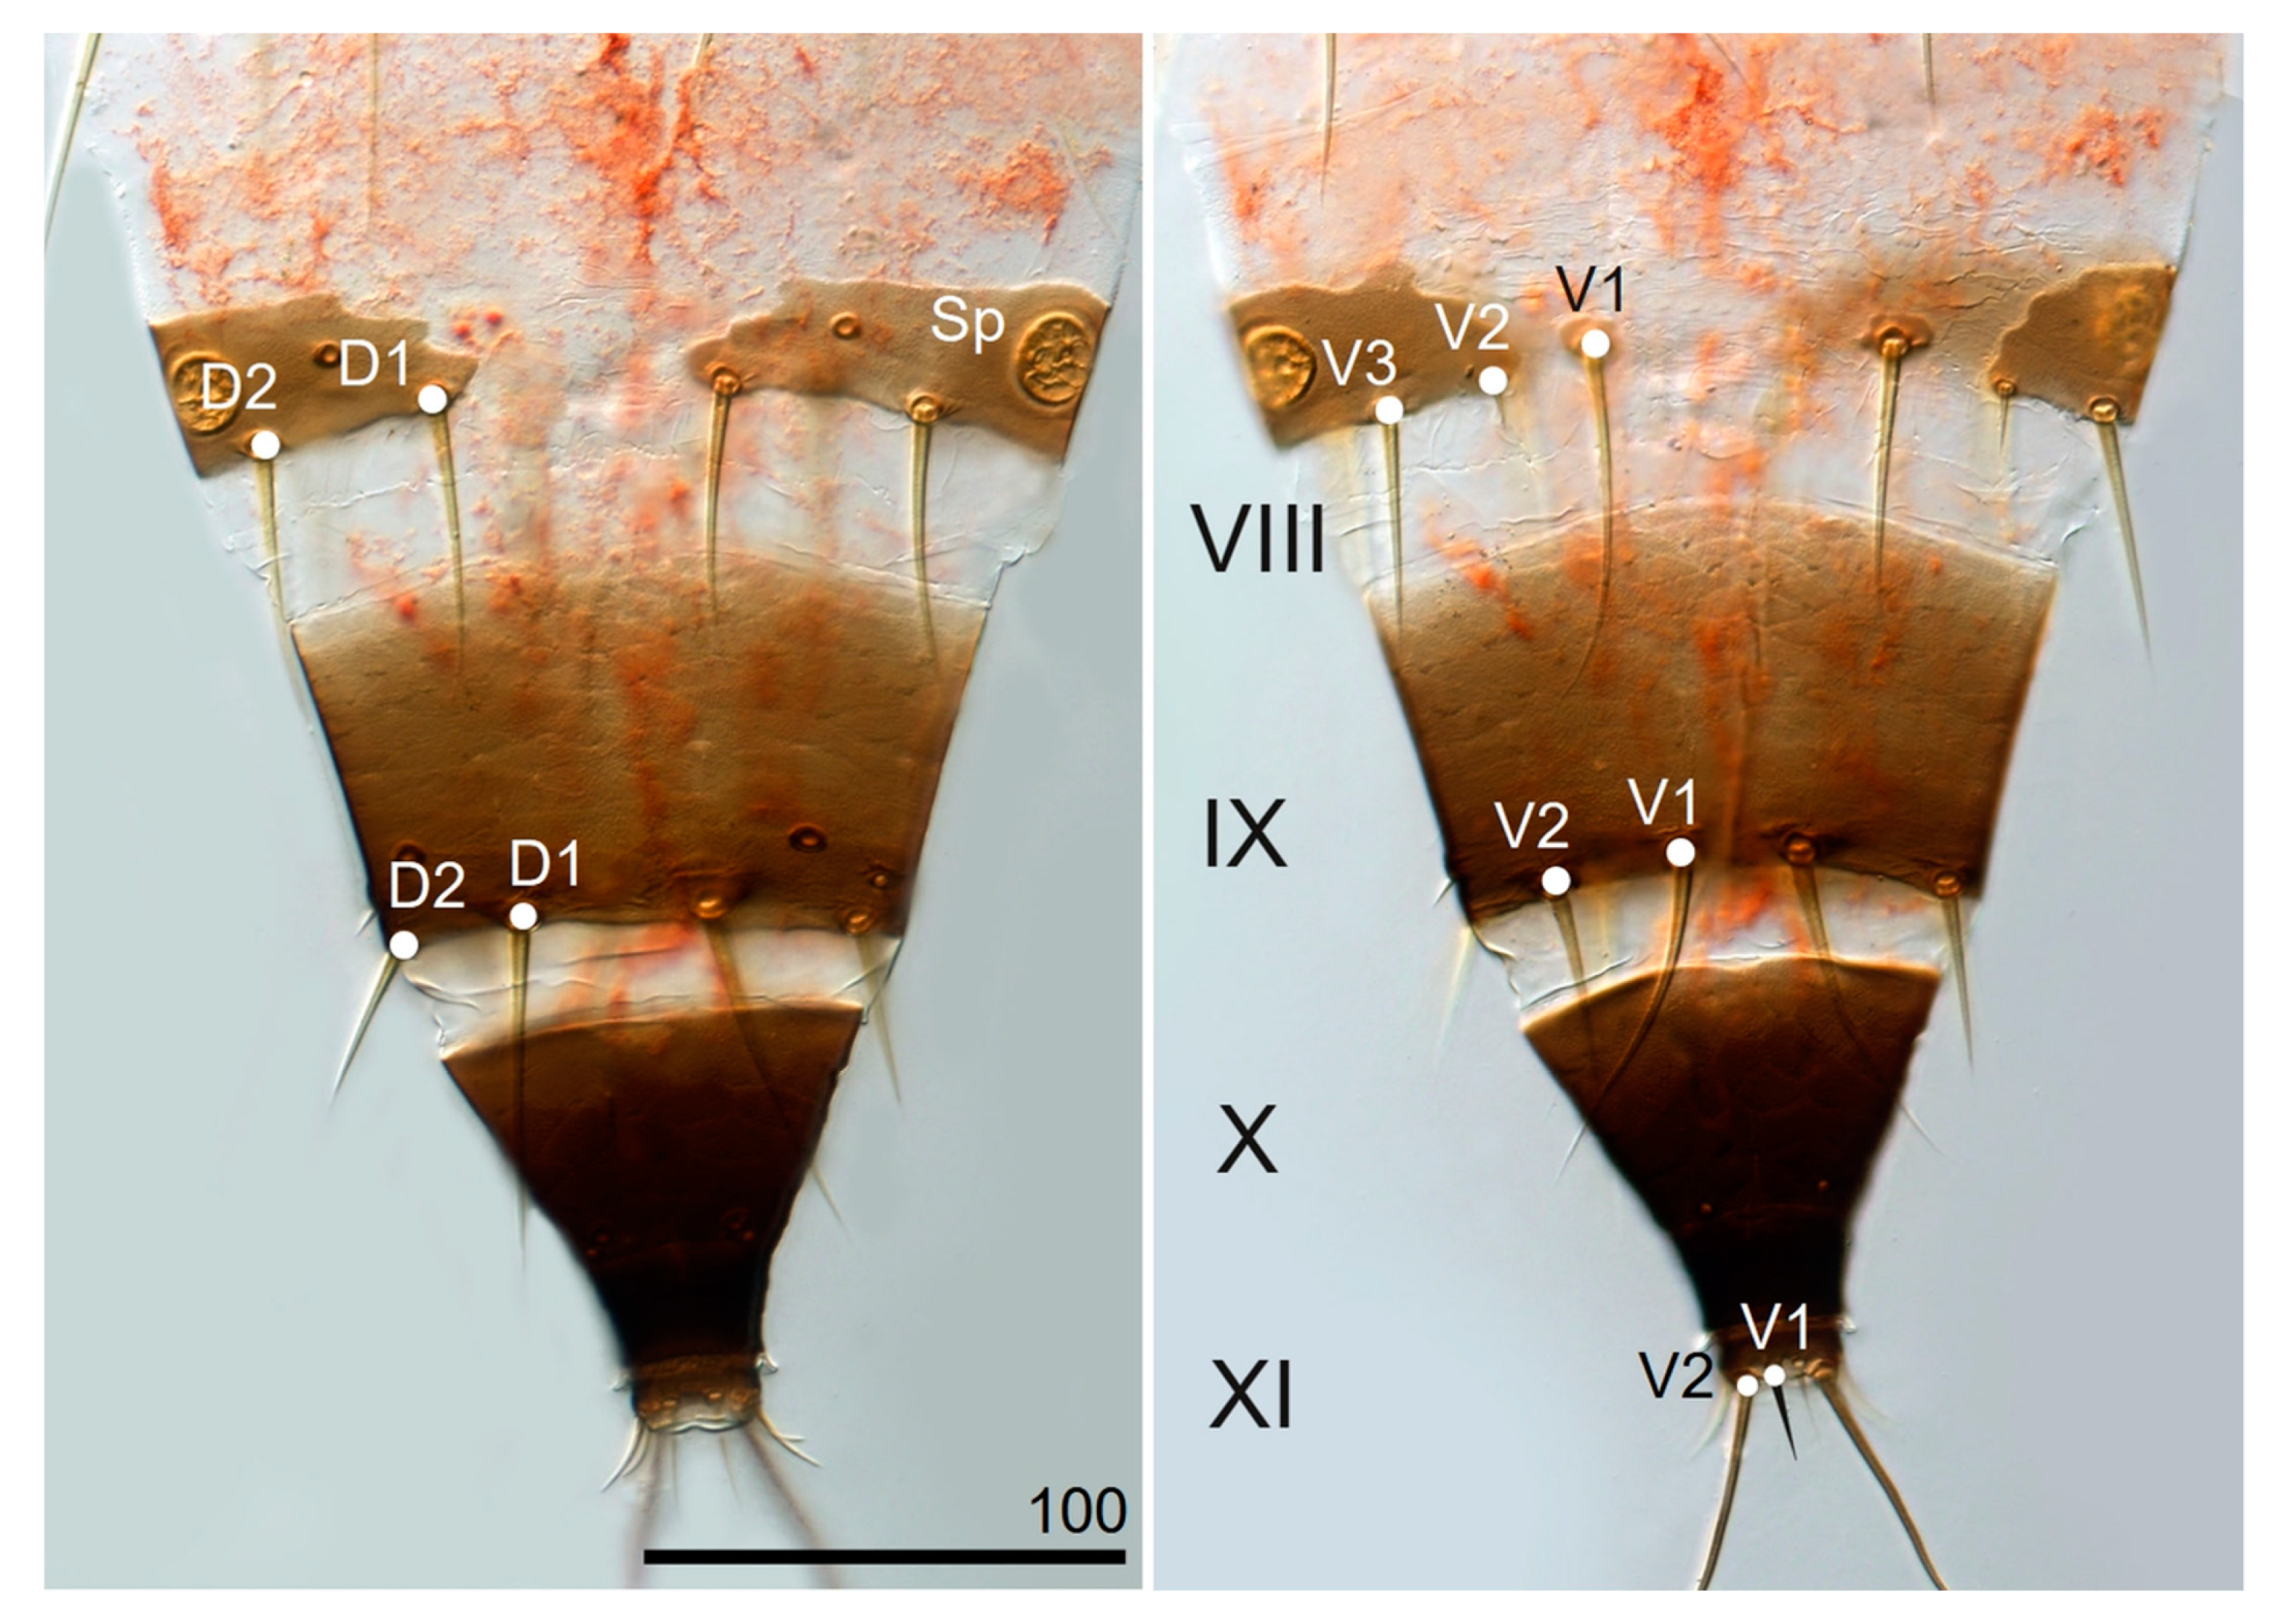
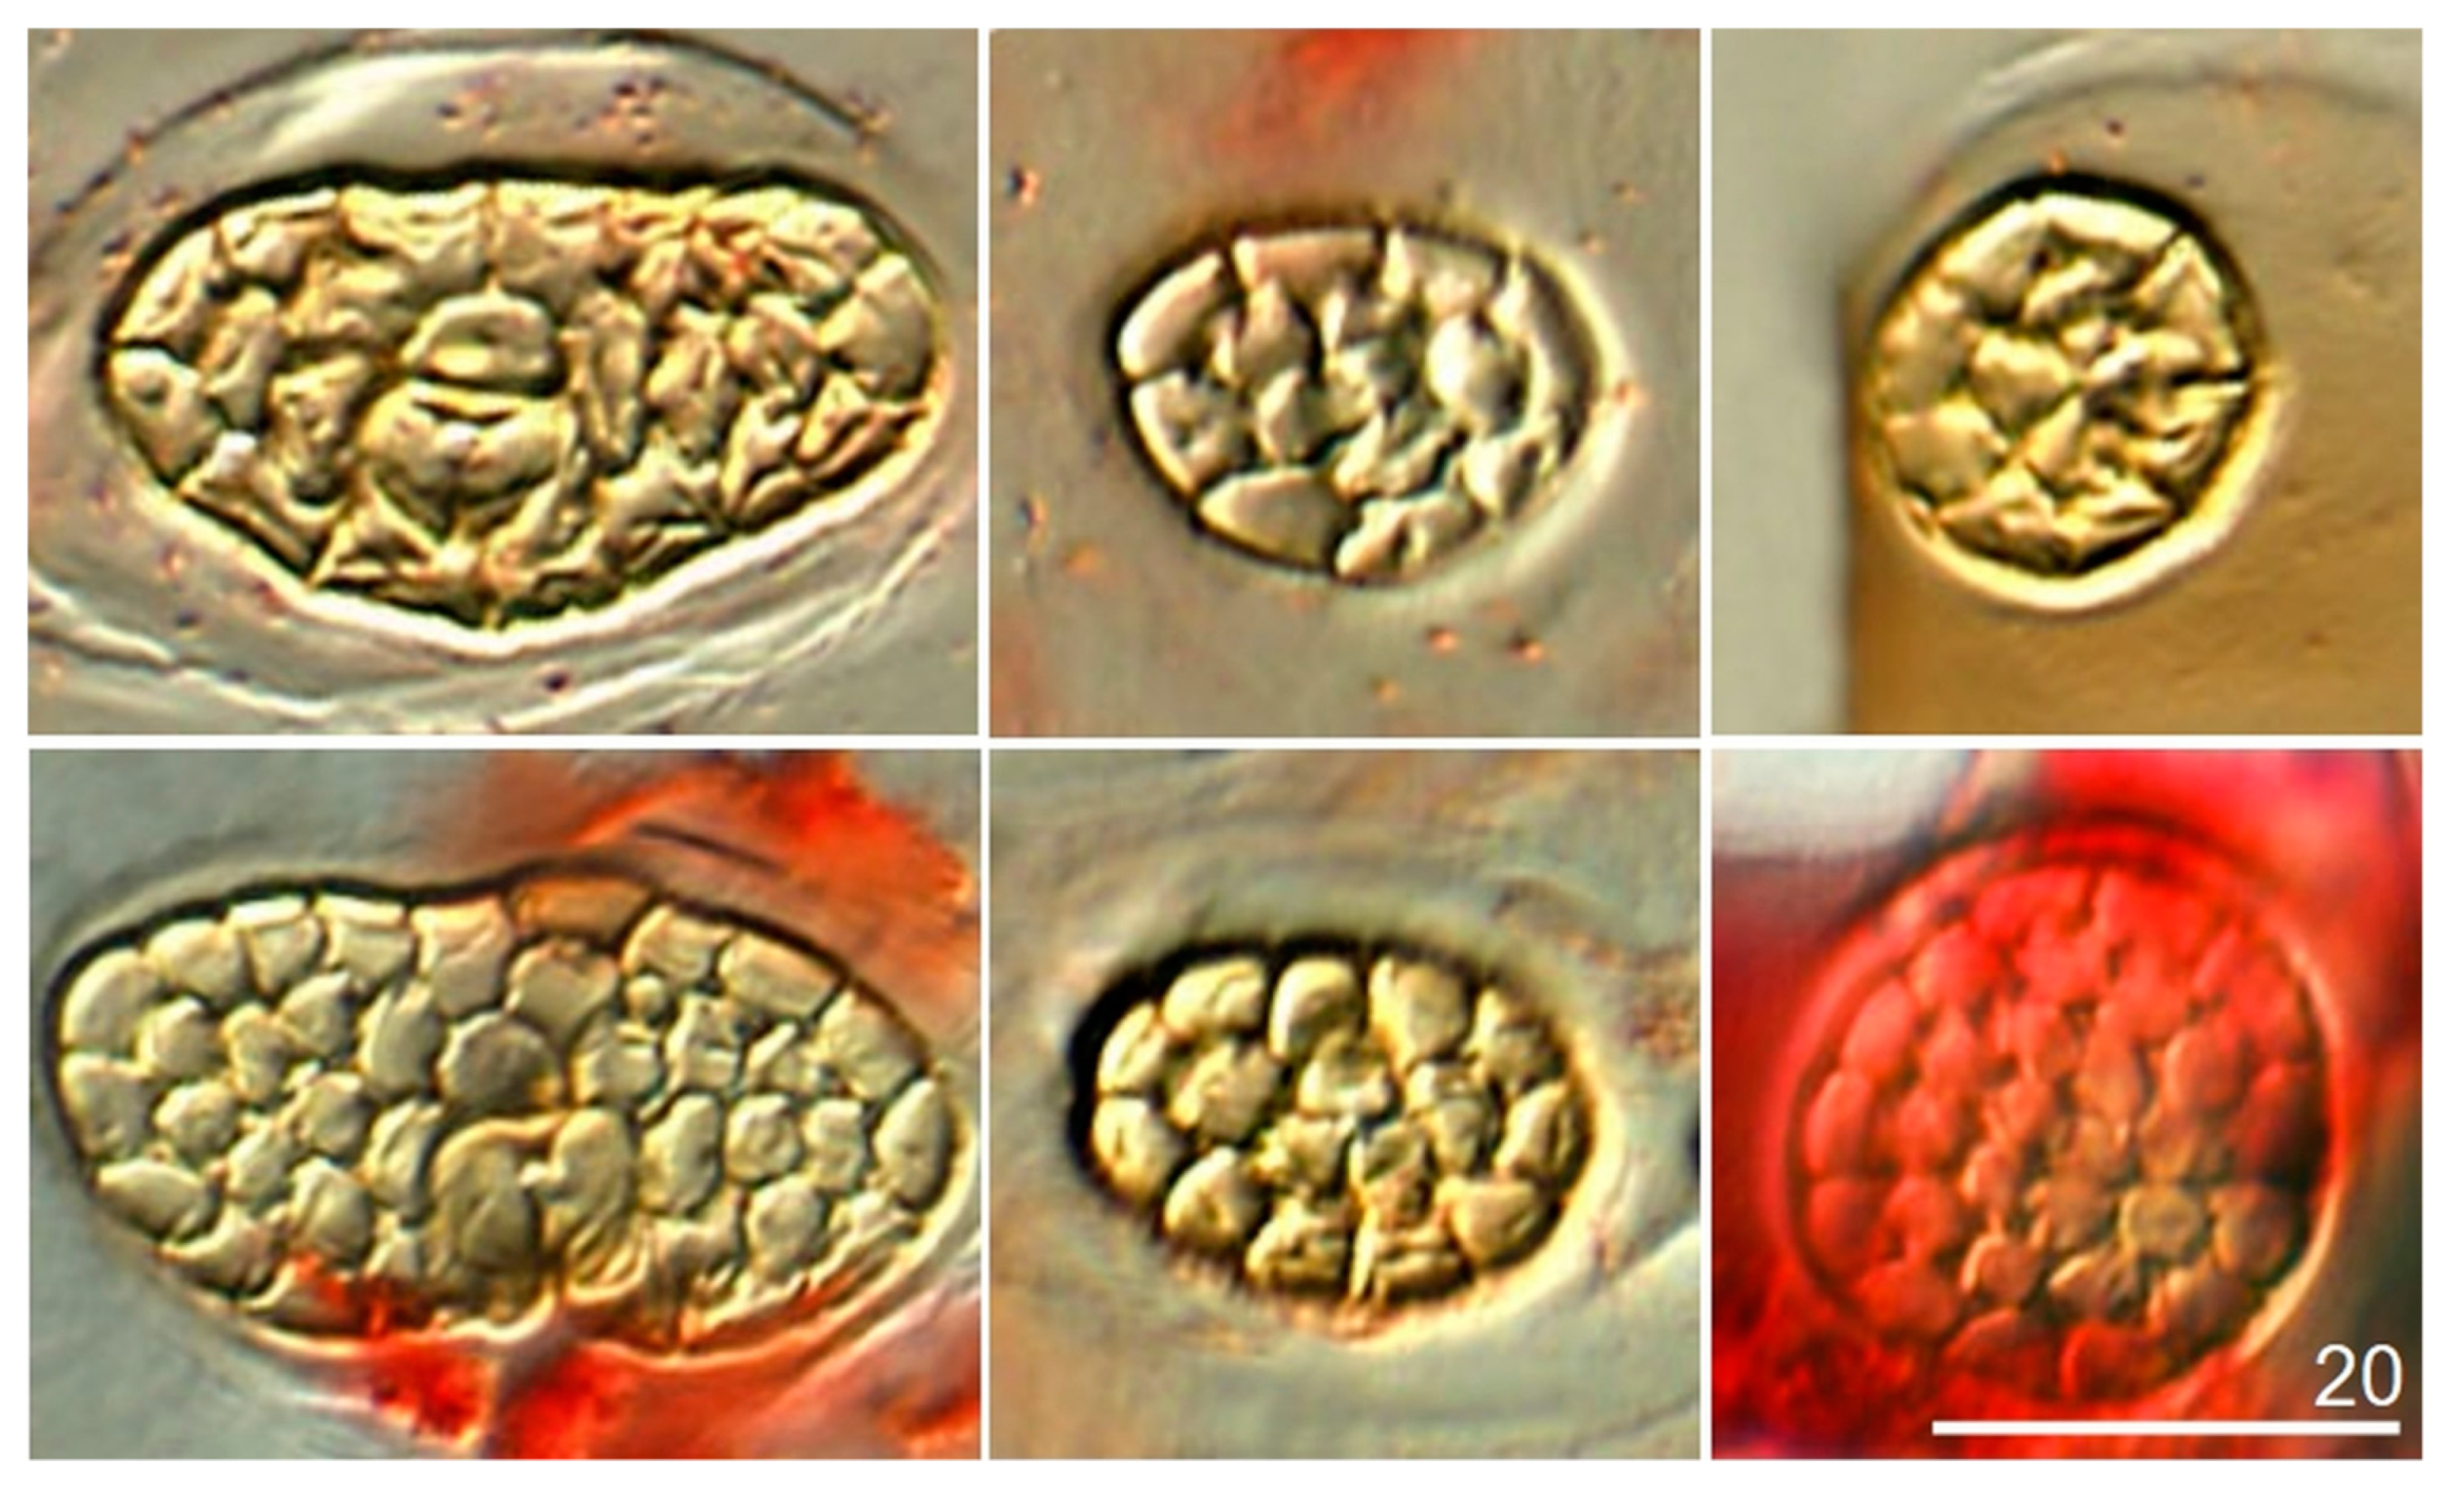
  • Morphological Comparison
Both adults and larvae of H. leucanthemi and H. niger have been collected in different regions of Poland (Table A1). The adults differed in a few characteristics such as the length of prothorax and abdominal segment IX, which are longer in H. leucanthemi, and prothorax epimeral setae which in turn are longer in H. niger. Moreover, the postocular setae are pointed at the apex of the former and blunt in the latter species. Our observations confirmed data included in the keys of Schliephake and Klimt [14]. The new feature observed by the authors in collected adult specimens of both species was the size of spiracle on VIII abdominal segment. The spiracle is round and its’ diameter is larger (15–20, most often 17,5 µm) in H. leucanthemi than in H. niger (10 µm).
Measurements of the body and chaetotaxy of the head, thorax and dorsal and ventral side of abdomen are given for second instar larvae of both species. Analysis of the morphological characteristics shows some differences in the body length, antennae length, length of prothorax setae D1, D4, D5 and D6. These values are higher in H. niger while both the length and width of spiracles on mesothorax and abdomen (segments II and VIII), and the numbers of cells in spiracles are higher in H. leucanthemi larvae (Table A2, Figure A1, Figure A2 and Figure A3).
Table A1. Detailed information about sampling sites of archival specimens of both Haplothrips leucanthemi and H. niger used for further morphometric analyses.
SpeciesLocality/CoordinatesHost PlantDevelopmental StageDate and Author of Collected Materials
Haplothrips leucanthemiRowokół near. Smołdzino
N 54.66 E 17.21
Chrysanthemum leucanthemumSecond larval instar19.07.2000
I. Zawirska
Urszulin
N 51.40 E 23.20
07.06.2010
K. Stanisławek
Zawoja
N 49.67 E 19.57
19.07.2010
A. Dembicka
Zastawie
N 51.39 E 23.27
15.06.2010
K. Stanisławek
Białka (near Łęczna)
N 51.54 E 23.01
23.05.2011
K. Stanisławek
Ciechanki Łańcuchowskie
N 51.28 E 22.95
23.05.2011
K. Stanisławek
Jaszczów Kolonia
N 51.21 E 22.95
23.05.2011
K. Stanisławek
Werbkowice
N 50.75 E 23.78
30.05.2011
M. Kucharczyk
Udrycze (near Zamość)
N 50.80 E 23.28
20.05.2011
K. Stanisławek
Wojtkowa (Bieszczady Mts.)
N 49.57 E 22.55
13.08.2011
K. Stanisławek
Dziewięcierz
N 50.31 E 23.42
25.06.2011
K. Stanisławek
Mała Rawka (Bieszczady Mts.)
N 49.11 E 22.57
04.08.2011
H. Kucharczyk
Haplothrips nigerUrsynów (Warszawa)
N 52.15 E 21.03
Trifolium pratenseSecond larval instar22.10.1984
I. Zawirska
Warszawa, Huta
N 52.30 E 20.91
27.06.1995
I. Zawirska
Jakubowice Konińskie
N 51.31 E 22.55
13.06.2010
K. Stanisławek
Lublin
N 51.25 E 22.57
25.05.2011
20.06.2011
22.06.2011
K. Stanisławek
Białka (near Łęczna)
N 51.54 E 23.01
23.05.2011
K. Stanisławek
Rudnik (near Lublin)
N 51.28 E 22.60
20.06.2011
K. Stanisławek
Ciechanki Łańcuchowskie
N 51.28 E 22.95
23.05.2011
K. Stanisławek
Polanka Horyniecka (Roztocze)
N 51.25 E 22.57
25.06.2011
K. Stanisławek
Bandrów Narodowy (Bieszczady Mts.)
N 49.39 E 22.70
13.08.2011
K. Stanisławek
Muczne (Bieszczady Mts.)
N 49.13 E 22.74
Trifolium repensSecond larval instar14.08.2011
K. Stanisławek
Table A2. Character states used in morphological analyses of Haplothrips leucanthemi and H. niger second larval instar with the range of obtained measurements. Values are given in µm. The mean or the modal values (number of facets) are given in brackets.
CharacterH. leucanthemiH. niger
Body length1200–1780 (1422)1317–1933 (1636)
Head—length/width190–219 (206.5)/110–153 (133.0)185–211 (197.0)/109–134 (120.5)
Head—length/width proportion1.5–1.9 (1.65)1.4–1.8 (1.63)
Head—length of dorsal setae D1, D2D1 37.5–51.0 (43.2)
D2 14.0–22.5 (17.1)
D1 36.0–51.0 (44.2)
D2 12.0–20.0 (16.9)
Length of antennae206–250 (223.5)214–272 (248.0)
Prothorax—length of dorsal setae D1, D4, D5, D6D1 22.0–32.0 (27.2)
D4 28.0–43.0 (35.2)
D5 53.0–69.0 (60.5)
D6 60.5–77.0 (68.7)
D1 24.0–38.0 (31.3)
D4 30.0–44.0 (37.5)
D5 51.0–74.0 (65.3)
D6 61.5–85.0 (73.3)
Mesothrax—length of dorsal setae D1, D2, D3, D5, D6D1 26.0–38.0 (31.8)
D2 16.0–22.5 (18.4)
D3 19.0–30.0 (22.8)
D5 55.0–77.0 (64.0)
D6 35.0–50.0 (42.1)
D1 29.0–41.0 (35.6)
D2 17.0–26.0 (22.5)
D3 18.0–29.0 (25.7)
D5 62.0–81.0 (72.5)
D6 36.0–49.0 (42.7)
Metathorax—length of dorsal setae D1, D2, D3, D5, D6D1 27.0–40.5 (33.6)
D2 16.0–24.0 (19.8)
D3 17.5–37.5 (27.1)
D5 59.0–75.0 (66.6)
D6 32.5–52.0 (41.8)
D1 31.0–44.0 (38.1)
D2 18.0–25.0 (21.7)
D3 19.0–35.0 (27.3)
D5 64.0–80.0 (73.2)
D6 38.0–50.0 (44.7)
Abdominal tergite VIII—length of dorsal setae D1, D2D1 45.0–62.5 (53.1)
D2 55.0–70.0 (61.0)
D1—52.0–72.0 (62.5)
D2—52.0–72.0 (63.1)
Abdominal tergite IX—length of dorsal setae D1, D2D1 72.5–90.0 (81.1)
D2 39.0–53.5 (45.2)
D1 72.0–91.0 (82.5)
D2 32.0–51.0 (42.7)
Abdominal sternite VIII—length of ventral setae V1, V2, V3V1 57.0–88.0 (72.0)
V2 12.0–21.0 (16.1)
V3 46.0–68.5 (56.3)
V1 61.0–90.0 (75.1)
V2 11.0–20.0 (16.0)
V3 52.0–67.0 (59.9)
Abdominal sternite IX—length of ventral setae V1, V2V1 73.0–102.0 (86.1)
V2 42.5–60.0 (50.1)
V1 70.0–99.0 (85.5)
V2 32.0–56.0 (46.3)
Abdominal segment X—length69.0–89.0 (78.6)67.0–84.0 (77.1)
Abdominal segment X—proportion of anterior and posteriori rand width2.1–3.3 (2.8)2.1–2.6 (2.4)
Abdominal segment XI, length of setae D1, V1, V2D1 17.5–28.0 (22.4)
V1 10.5–20.0 (14.2)
V2 122.0–160.0 (138.0)
D1 18.0–28.0 (23.8)
V1 9.0–18.0 (14.1)
V2 118.0–170.0 (147.0)
Meso- and metanotum—sclerotization at basis of setaeweak or absent, may be stronger around setae D3, D5, D6weak or absent
Abdomen—sclerotization at basis of dorsal setaeweak or absent, may be stronger around setae on segments VI-VIIIweak or absent
Spiracle on mesonotum—length/width20–28 (23.8)/37–47 (42.1)19–21 (20.2)/35–38 (36.3)
Spiracle on mesonotum—number of facets (cells).
Mean number of cells
27–46 (35)
>30
20–27 (23)
<30
Spiracles on abdominal tergite II—length/width14–26 (18)/17–27 (22)14–16 (15)/16–21 (19)
Spiracles on abdominal tergite II—number of facets (cells)7–22 (15)6–17 (11)
Spiracles on abdominal tergite VIII—diameter17–27 (22)16–23 (18)
Spiracles on abdominal tergite VIII—number of facets (cells)
Mean number of cells
20–30 (24)
>15
10–15 (12)
<15
Figure A1. H. leucanthemi—second larval instar: body view (right), head and pronotum (left, above), meso- and metanotum (left, below), Sp—spiracle, D1–D7—dorsal setae on head and thorax included in morphometric measurements (Table 2).
Insects 13 00279 g0a1
Figure A2. H. leucanthemi—second larval instar; abdominal segments VIII-XI: dorsal (left) and ventral (right) sites, Sp—spiracle, D1, D2, V1–V3—dorsal and ventral setae on abdomen included in morphometric measurements (Table 2).
Insects 13 00279 g0a2
Figure A3. Structure of spiracles on mesothorax (left), second abdominal segment (middle) and eighth abdominal segment (right) in H. niger (above) and H. leucanthemi (below) second larval instar (Table 2).
Insects 13 00279 g0a3

References

  1. Mound, L.A.; Hastenpflug-Vesmanis, A. All genera of the world: Order Thysanoptera (Animalia: Arthropoda: Insecta). Megataxa 2021, 6, 2–69. [Google Scholar] [CrossRef]
  2. Minaei, K.; Mound, L.A. Character-state evaluation when discriminating Thysanoptera taxa (Insecta). Zootaxa 2021, 5061, 377–382. [Google Scholar] [CrossRef] [PubMed]
  3. Mound, L.A. Fighting, flight and fecundity: Behavioural determinants of thysanoptera structural diversity. In Insects and Phenotypic Plasticity; Ananthakrishnan, T.N., Whitman, D., Eds.; Science Publishers Inc.: Enfield, NH, USA, 2005; pp. 81–105. [Google Scholar]
  4. Mound, L.A.; Matsunaga, J.N. The species of Haplothrips (Thysanoptera, Phlaeothripinae) and related genera recorded from the Hawaiian Islands. Zookeys 2017, 2017, 79–92. [Google Scholar] [CrossRef] [PubMed] [Green Version]
  5. Minaei, K.; Mound, L. The Thysanoptera Haplothripini (Insecta: Phlaeothripidae) of Iran. J. Nat. Hist. 2008, 42, 2617–2658. [Google Scholar] [CrossRef]
  6. Minaei, K.; Mound, L. New synonymy in the wheat thrips, Haplothrips tritici (Thysanoptera: Phlaeothripidae). Zootaxa 2014, 3802, 596–599. [Google Scholar] [CrossRef] [Green Version]
  7. Timm, A.E.; Stiller, M.; Frey, J.E. A molecular identification key for economically important thrips species (Thysanoptera: Thripidae) in southern Africa Article. Afr. Entomol. 2008, 16, 68–75. [Google Scholar] [CrossRef]
  8. Tyagi, K.; Kumar, V.; Singha, D.; Chandra, K.; Laskar, B.A.; Kundu, S.; Chakraborty, R.; Chatterjee, S. DNA barcoding studies on thrips in India: Cryptic species and species complexes. Sci. Rep. 2017, 7, 4898. [Google Scholar] [CrossRef] [Green Version]
  9. Mound, L.A.; Minaei, K. Australian thrips of the Haplothrips lineage (Insecta: Thysanoptera). J. Nat. Hist. 2007, 41, 2919–2978. [Google Scholar] [CrossRef]
  10. Loan, C.; Holdaway, F.G. Biology of the red clover thrips, Haplothrips niger (Osborn) (Thysanoptera: Phloeothripidae). Can. Entomol. 1955, 87, 210–219. [Google Scholar] [CrossRef]
  11. Bournier, A. Les Thrips: Biologie, Importance, Agronomique; Institut National de la Recherche Agronomique: Paris, France, 1983; ISBN 2853404641. [Google Scholar]
  12. Mound, L.A.; Walker, A.K. Tubulifera (Insecta: Thysanoptera). Fauna N. Z. 1986, 10, 53–54. [Google Scholar] [CrossRef]
  13. Priesner, H. Ordnung Thysanoptera (Fransenflügler Thripse), 2nd ed.; Bestimmungsbücher zur Bodenfauna Europas: Berlin, Germany, 1964. [Google Scholar]
  14. Schliephake, G.; Klimt, K. Thysanoptera, Franseflügler; Fischer, G., Ed.; Die Tierwelt Deutschlands: Bonn, Germany, 1979; pp. 5–477. [Google Scholar]
  15. Moritz, G. Thripse: Fransenflügler, Thysanoptera. Die Neue Brehm-Bücherei Bd. 663; Westarp Wissenschaften: Hohenwarsleben, Germany, 2006. [Google Scholar]
  16. Kucharczyk, H.; Stanisławek, K. Haplothrips second instar larvae (Thysanoptera: Phlaeothripidae); character states and key to Central European species. Zootaxa 2020, 4845, 375–392. [Google Scholar] [CrossRef] [PubMed]
  17. Folmer, O.; Black, M.; Hoeh, W.; Lutz, R.; Vrijenhoek, R. DNA primers for amplification of mitochondrial cytochrome c oxidase subunit I from diverse metazoan invertebrates. Mol. Mar. Biol. Biotechnol. 1994, 3, 294–299. [Google Scholar] [PubMed]
  18. Whiting, M.F. Mecoptera is paraphyletic: Multiple genes and phylogeny of Mecoptera and Siphonaptera. Zool. Scr. 2002, 31, 93–104. [Google Scholar] [CrossRef] [Green Version]
  19. Buckman, R.S.; Mound, L.A.; Whiting, M.F. Phylogeny of thrips (Insecta: Thysanoptera) based on five molecular loci. Syst. Entomol. 2013, 38, 123–133. [Google Scholar] [CrossRef]
  20. Kumar, V.; Dickey, A.M.; Seal, D.R.; Shatters, R.G.; Osborne, L.S.; McKenzie, C.L. Unexpected high intragenomic variation in two of three major pest thrips species does not affect ribosomal internal transcribed spacer 2 (ITS2) utility for thrips identification. Int. J. Mol. Sci. 2017, 18, 2100. [Google Scholar] [CrossRef] [PubMed] [Green Version]
  21. Klindworth, A.; Pruesse, E.; Schweer, T.; Peplies, J.; Quast, C.; Horn, M.; Glöckner, F.O. Evaluation of general 16S ribosomal RNA gene PCR primers for classical and next-generation sequencing-based diversity studies. Nucleic Acids Res. 2013, 41, e1. [Google Scholar] [CrossRef]
  22. Altschul, S.F.; Gish, W.; Miller, W.; Myers, E.W.; Lipman, D.J. Basic local alignment search tool. J. Mol. Biol. 1990, 215, 403–410. [Google Scholar] [CrossRef]
  23. Hall, T.A. BioEdit: A user-friendly biological sequence alignment editor and analysis program for Windows 95/98/NT. Nucleic Acids Symp. Ser. 1999, 41, 95–98. [Google Scholar]
  24. Sievers, F.; Wilm, A.; Dineen, D.; Gibson, T.J.; Karplus, K.; Li, W.; Lopez, R.; McWilliam, H.; Remmert, M.; Soding, J.; et al. Fast, scalable generation of high-quality protein multiple sequence alignments using Clustal Omega. Mol. Syst. Biol. 2011, 7, 539. [Google Scholar] [CrossRef]
  25. Rice, P.; Longden, I.; Bleasby, A. EMBOSS: The European molecular biology open software suite. Trends Genet. 2000, 16, 276–277. [Google Scholar] [CrossRef]
  26. Goujon, M.; McWilliam, H.; Li, W.; Valentin, F.; Squizzato, S.; Paern, J.; Lopez, R. A new bioinformatics analysis tools framework at EMBL-EBI. Nucleic Acids Res. 2010, 38, W695–W699. [Google Scholar] [CrossRef] [PubMed]
  27. Librado, P.; Rozas, J. DnaSP v5: A software for comprehensive analysis of DNA polymorphism data. Bioinformatics 2009, 25, 1451–1452. [Google Scholar] [CrossRef] [PubMed] [Green Version]
  28. Kumar, S.; Stecher, G.; Li, M.; Knyaz, C.; Tamura, K. MEGA X: Molecular evolutionary genetics analysis across computing platforms. Mol. Biol. Evol. 2018, 35, 1547–1549. [Google Scholar] [CrossRef] [PubMed]
  29. Darriba, D.; Taboada, G.L.; Doallo, R.; Posada, D. jModelTest 2: More models, new heuristics and parallel computing. Nat. Methods 2012, 9, 772. [Google Scholar] [CrossRef] [PubMed] [Green Version]
  30. Huelsenbeck, J.P.; Ronquist, F. MRBAYES: Bayesian inference of phylogenetic trees. Bioinformatics 2001, 17, 754–755. [Google Scholar] [CrossRef] [PubMed] [Green Version]
  31. Templeton, A.R.; Crandall, K.A.; Sing, C.F. A cladistic analysis of phenotypic associations with haplotypes inferred from restriction endonuclease mapping and DNA sequence data. III. Cladogram estimation. Genetics 1992, 132, 619–633. [Google Scholar] [CrossRef]
  32. Leigh, J.W.; Bryant, D. PopART: Full-feature software for haplotype network construction. Methods Ecol. Evol. 2015, 6, 1110–1116. [Google Scholar] [CrossRef]
  33. Bolyen, E.; Rideout, J.R.; Dillon, M.R.; Bokulich, N.A.; Abnet, C.C.; Al-Ghalith, G.A.; Alexander, H.; Alm, E.J.; Arumugam, M.; Asnicar, F.; et al. Reproducible, interactive, scalable and extensible microbiome data science using QIIME 2. Nat. Biotechnol. 2019, 37, 852–857. [Google Scholar] [CrossRef]
  34. Callahan, B.J.; McMurdie, P.J.; Rosen, M.J.; Han, A.W.; Johnson, A.J.A.; Holmes, S.P. DADA2: High resolution sample inference from Illumina amplicon data. Nat. Methods 2016, 13, 581–583. [Google Scholar] [CrossRef] [Green Version]
  35. Quast, C.; Pruesse, E.; Yilmaz, P.; Gerken, J.; Schweer, T.; Yarza, P.; Peplies, J.; Glöckner, F.O. The SILVA ribosomal RNA gene database project: Improved data processing and web-based tools. Nucleic Accids Res. 2013, 41, D590–D596. [Google Scholar] [CrossRef]
  36. Clarke, K.R.; Gorley, R. PRIMER Version 7: User Manual/Tutorial; Prime Data Centre (Plymouth) Limited: Plymouth, UK, 2015. [Google Scholar]
  37. Hammer, Ø.; Harper, D.A.T.; Ryan, P.D. PAST: Paleontological statistics software package for education and data analysis Palaeontol. Electron. 2001, 4, 1–9. [Google Scholar]
  38. Clarke, K.R.; Somerfield, P.J.; Gorley, R.N. Testing of null hypotheses in exploratory community analyses: Similarity profiles and biota-environment linkage. J. Exp. Mar. Bio. Ecol. 2008, 366, 56–69. [Google Scholar] [CrossRef]
  39. Murai, T.; Toda, S. Variation on Thrips tabaci in colour and size. In Proceedings of the 7th International Symposium on Thysanoptera, Reggio Calabria, Italy, 1–8 July 2001; pp. 377–378. [Google Scholar]
  40. Mound, L.A.; Wheeler, G.; Williams, D. Zootaxa, resolving cryptic species with morphology and DNA: Thrips as a potential biocontrol agent of Brazilian peppetree, with a new species and overview of Pseudophilothrips (Thysanoptera). Zootaxa 2010, 2432, 59–68. [Google Scholar] [CrossRef]
  41. Brunner, P.C.; Chatzivassiliou, E.K.; Katis, N.I.; Frey, J.E. Host-associated genetic differentiation in Thrips tabaci (Insecta; Thysanoptera), as determined from mtDNA sequence data. Heredity 2004, 93, 364–370. [Google Scholar] [CrossRef] [PubMed] [Green Version]
  42. Iftikhar, R.; Ashfaq, M.; Rasool, A.; Hebert, P.D.N. DNA barcode analysis of Thrips (Thysanoptera) diversity in Pakistan Reveals cryptic species complexes. PLoS ONE 2016, 11, e0146014. [Google Scholar] [CrossRef]
  43. Kadirvel, P.; Srinivasan, R.; Hsu, Y.C.; Su, F.C.; Del La Peña, R. Application of cytochrome oxidase i sequences for phylogenetic analysis and identification of thrips species occurring on vegetable crops. J. Econ. Entomol. 2013, 106, 408–418. [Google Scholar] [CrossRef]
  44. Chakraborty, R.; Singha, D.; Kumar, V.; Pakrashi, A.; Kundu, S.; Chandra, K.; Patnaik, S.; Tyagi, K. DNA barcoding of selected Scirtothrips species (Thysanoptera) from India. Mitochondrial DNA Part B Resour. 2019, 4, 2710–2714. [Google Scholar] [CrossRef] [Green Version]
  45. Cubillos-Salamanca, Y.P.; Rodríguez-Maciel, J.C.; Pineda-Guillermo, S.; Silva-Rojas, H.V.; Berzosa, J.; Tejeda-Reyes, M.A.; Rebollar-Alviter, Á. Identification of Thrips species and resistance of Frankliniella occidentalis (Thysanoptera: Thripidae) to malathion, spinosad, and bifenthrin in blackberry crops. Fla. Entomol. 2019, 102, 738–746. [Google Scholar] [CrossRef] [Green Version]
  46. Karimi, J.; Hassani-Kakhki, M.; Modarres Awal, M. Identifying thrips (Insecta: Thysanoptera) using DNA barcodes. J. Cell Mol. Res. 2011, 2, 35–41. [Google Scholar] [CrossRef]
  47. Brunner, P.C.; Fleming, C.; Frey, J.E. A molecular identification key for economically important thrips species (Thysanoptera: Thripidae) using direct sequencing and a PCR-RFLP-based approach. Agric. For. Entomol. 2002, 4, 127–136. [Google Scholar] [CrossRef]
  48. Asokan, R.; Krishna Kumar, N.K.; Kumar, V.; Ranganath, H.R. Molecular differences in the mitochondrial cytochrome oxidase I (mtCOI) gene and development of a species-specific marker for onion thrips, Thrips tabaci Lindeman, and melon thrips, T. palmi Karny (Thysanoptera: Thripidae), vectors of tospoviruses bunyav. Bull. Entomol. Res. 2007, 97, 461–470. [Google Scholar] [CrossRef] [PubMed]
  49. Kobayashi, K.; Hasegawa, E. Discrimination of reproductive forms of Thrips tabaci (Thysanoptera: Thripidae) by PCR with sequence specific primers. J. Econ. Entomol. 2012, 105, 555–559. [Google Scholar] [CrossRef] [PubMed]
  50. Marullo, R.; Mercati, F.; Vono, G. DNA barcoding: A reliable method for the identification of thrips species (Thysanoptera, Thripidae) collected on sticky traps in onion fields. Insects 2020, 11, 489. [Google Scholar] [CrossRef] [PubMed]
  51. Hebert, P.D.N.; Cywinska, A.; Ball, S.L.; DeWaard, J.R. Biological identifications through DNA barcodes. Proc. R. Soc. B Biol. Sci. 2003, 270, 313–321. [Google Scholar] [CrossRef] [Green Version]
  52. Hebert, P.D.N.; Ratnasingham, S.; DeWaard, J.R. Barcoding animal life: Cytochrome c oxidase subunit 1 divergences among closely related species. Proc. R. Soc. B Biol. Sci. 2003, 270, 96–99. [Google Scholar] [CrossRef] [Green Version]
  53. Ghosh, A.; Jangra, S.; Dietzgen, R.G.; Yeh, W. Bin frontiers approaches to the diagnosis of thrips (Thysanoptera): How effective are the molecular and electronic detection platforms? Insects 2021, 12, 920. [Google Scholar] [CrossRef]
  54. Kim, J.M.; Choi, M.-Y.; Kim, J.-W.; Lee, S.A.; Ahn, J.-H.; Song, J.; Kim, S.-H.; Weon, H.-Y. Effects of diet type, developmental stage, and gut compartment in the gut bacterial communities of two Cerambycidae species (Coleoptera). J. Microbiol. 2017, 55, 21–30. [Google Scholar] [CrossRef]
  55. Colman, D.R.; Toolson, E.C.; Takacs-Vesbach, C.D. Do diet and taxonomy influence insect gut bacterial communities? Mol. Ecol. 2012, 21, 5124–5137. [Google Scholar] [CrossRef]
  56. Yun, J.-H.; Roh, S.W.; Whon, T.W.; Jung, M.-J.; Kim, M.-S.; Park, D.-S.; Yoon, C.; Nam, Y.-D.; Kim, Y.-J.; Choi, J.-H.; et al. Insect gut bacterial diversity determined by environmental habitat, diet, developmental stage, and phylogeny of host. Appl. Environ. Microbiol. 2014, 80, 5254–5264. [Google Scholar] [CrossRef] [Green Version]
  57. Kaczmarczyk, A.; Kucharczyk, H.; Kucharczyk, M.; Kapusta, P.; Sell, J.; Zielińska, S. First insight into microbiome profile of fungivorous thrips Hoplothrips carpathicus (Insecta: Thysanoptera) at different developmental stages: Molecular evidence of Wolbachia endosymbiosis. Sci. Rep. 2018, 8, 14376. [Google Scholar] [CrossRef]
  58. Dickey, A.M.; Trease, A.J.; Jara-Cavieres, A.; Kumar, V.; Christenson, M.K.; Potluri, L.-P.; Morgan, J.K.; Shatters, R.G.; Mckenzie, C.L.; Davis, P.H.; et al. Estimating bacterial diversity in Scirtothrips dorsalis (Thysanoptera: Thripidae) via Next Generation Sequencing. Fla. Entomol. 2014, 97, 362–366. [Google Scholar] [CrossRef] [PubMed]
  59. Gawande, S.J.; Anandhan, S.; Ingle, A.; Roylawar, P.; Khandagale, K.; Gawai, T.; Jacobson, A.; Asokan, R.; Singh, M. Microbiome profiling of the onion thrips, Thrips tabaci Lindeman (Thysanoptera: Thripidae). PLoS ONE 2019, 14, e0223281. [Google Scholar] [CrossRef] [PubMed]
  60. Zhao, X.; Zhang, X.; Chen, Z.; Wang, Z.; Lu, Y.; Cheng, D. The divergence in bacterial components associated with Bactrocera dorsalis across developmental stages. Front. Microbiol. 2018, 9, 114. [Google Scholar] [CrossRef] [PubMed] [Green Version]
  61. Majumder, R.; Sutcliffe, B.; Taylor, P.W.; Chapman, T.A. Microbiome of the queensland fruit fly through metamorphosis. Microorganisms 2020, 8, 795. [Google Scholar] [CrossRef] [PubMed]
  62. Wang, M.; Xiang, X.; Wan, X. Divergence in gut bacterial community among life stages of the rainbow stag beetle Phalacrognathus muelleri (Coleptera: Lucanidae). Insects 2020, 11, 719. [Google Scholar] [CrossRef]
  63. Kaczmarczyk-Ziemba, A.; Wagner, G.K.; Grzywnowicz, K.; Kucharczyk, M.; Zielińska, S. The microbiome profiling of fungivorous black tinder fungus beetle Bolitophagus reticulatus reveals the insight into bacterial communities associated with larvae and adults. PeerJ 2019, 7, e6852. [Google Scholar] [CrossRef]
  64. Ma, W.J.; Schwander, T. Patterns and mechanisms in instances of endosymbiont-induced parthenogenesis. J. Evol. Biol. 2017, 30, 868–888. [Google Scholar] [CrossRef] [Green Version]
  65. Kumm, S.; Moritz, G. First detection of Wolbachia in arrhenotokous populations of Thrips species (Thysanoptera: Thripidae and Phlaeothripidae) and its role in reproduction. Environ. Entomol. 2008, 37, 1422–1428. [Google Scholar] [CrossRef]
  66. Arakaki, N.; Miyoshi, T.; Noda, H. Wolbachia-mediated parthenogenesis in the predatory thrips Franklinothrips vespiformis (Thysanoptera: Insecta). Proc. R. Soc. B. Biol. Sci. 2001, 268, 1011–1016. [Google Scholar] [CrossRef] [Green Version]
  67. Mound, L.A.; Kibby, G. Thysanoptera: An Identification Guide, 2nd ed.; CAB International: Wallingford, UK, 1998. [Google Scholar]
Figure 1. TCS networks resolving relationships among haplotypes identified in tested samples of Haplothrips leucanthemi and H. niger. Colored circles represent unique haplotypes encountered in analyses and lines connecting circles represent base-pair differences between haplotypes (values above 1 are shown). White circles represent intermediate haplotypes that were not encountered in the sampling. Size of the circle represents the frequency of the haplotype.
Insects 13 00279 g001
Figure 2. Bayesian dendrogram showing relationships among COI haplotypes identified in tested samples of Haplothrips leucanthemi and H. niger, and haplotypes determined for congeneric species. Posterior probability (PP) values are shown at nodes.
Insects 13 00279 g002
Figure 3. Phyla identified in profiles of microbial communities associated with tested Haplothrips leucanthemi and H. niger individuals.
Insects 13 00279 g003
Figure 4. Similarity at the family level among tested microbiota profiles grouped according to the host taxonomy. (A)—non-metric multidimensional scaling (nMDS) ordination of Haplothrips leucanthemi and H. niger microbial communities; (B)—principal-coordinate analysis (PCoA) showing a two-dimensional ordination of tested microbiota profiles.
Insects 13 00279 g004
Figure 5. The heatmap showing relationships among tested profiles of bacterial communities associated with Haplothrips leucanthemi and H. niger. Only those families which were primarily responsible for the observed differences among samples were considered.
Insects 13 00279 g005
Table 1. Detailed information about specimens of both Haplothrips leucanthemi and H. niger collected from selected sampling sites for further molecular analyses.
SpeciesSample CodeLocality/CoordinatesHost PlantCollected Developmental Stages
Haplothrips leucanthemiHL-POLKol. Wola Wereszczyńska
51.45° N, 23.15° E
Leucanthemum vulgare (diploid)HL-POL.1—adult
HL-B2Brzeźno
51.17° N, 23.62° E
HL-B2.1—larva
HL-B2.2—larva
HL-B2.3—larva
HL-B2.4—larva
HL-B5Brzeźno
51.17° N, 23.62° E
Leucanthemum ircutianum (tetraploid)HL-B5.1—adult
HL-B5.2—adult
HL-B5.3—adult
HL-B5.4—adult
HL-B5.5—adult
HL-B9Strzyżów
50.85° N, 24.02° E
HL-B9.1—adult
HL-B9.2—adult
HL-B9.3—adult
Haplothrips nigerHN-BBrzeźno
51.17° N 23.62° E
Trifolium montanumHN-B.2—larva
HN-B.2—larva
HN-B.5—larva
HN-CCiechanki Łańcuchowskie
51.28° N, 22.95° E
Trifolium pratenseHN-C.1—larva
HN-C.2—adult
HN-ZZarzecze near San River
50.53° N, 22.20° E
HN-Z.1—adult
HN-Z.3—larva
Table 2. Distribution of mitochondrial and nuclear haplotypes identified among sequences obtained for tested H. leucanthemi and H. niger individuals. Numbers in brackets indicate numbers of sequences identified as particular haplotypes.
SampleCOI28SITS2
H. leucanthemi
Kol. Wola Wereszczyńska (HL-POL)H-C1 (1)H-S6 (1)H-I12 (1)
Brzeźno—diploid host plant (HL-B2)H-C3 (2), H-C4 (1)H-S1 (1)H-I2 (1)
Brzeźno—tetraploid host plant (HL-B5)H-C1 (1)H-S2 (1), H-S3 (1), H-S4 (1)H-I3 (1), H-I4 (1)
Strzyżów (HL-B9)H-C1 (1), H-C2 (1)H-S2 (1), H-S5 (1)H-I10 (1), H-I11 (1)
H. niger
Brzeźno (HN-B)H-C5 (4)H-S7 (1), H-S8 (1), H-S9 (1)H-I1 (1), H-I5 (1), H-I6 (1)
Ciechanki Łańcuchowskie (HN-C)H-C5 (2)H-S10 (1), H-S11 (1)H-I7 (1), H-I8 (1)
Zarzecze near San River (HN-Z)H-C6 (1), H-C7 (1)H-S12 (1)H-I9 (1)
Publisher’s Note: MDPI stays neutral with regard to jurisdictional claims in published maps and institutional affiliations.

