
Response of Common and Rare Beetle Species to Tree Species and Vertical Stratification in a Floodplain Forest

 , , , ,
  and
and
Abstract
:Simple Summary
Abstract
1. Introduction
2. Material and Methods
2.1. Sampling Location and Design
2.2. Species Determination and Composition
2.3. Rarity Definitions
2.4. Statistical Analyses
2.4.1. Alpha Diversity
2.4.2. Beta Diversity
Trapwise Community Dissimilarity
Replacement versus Richness Differences
Assessment of Stochastic and Deterministic Processes
3. Results
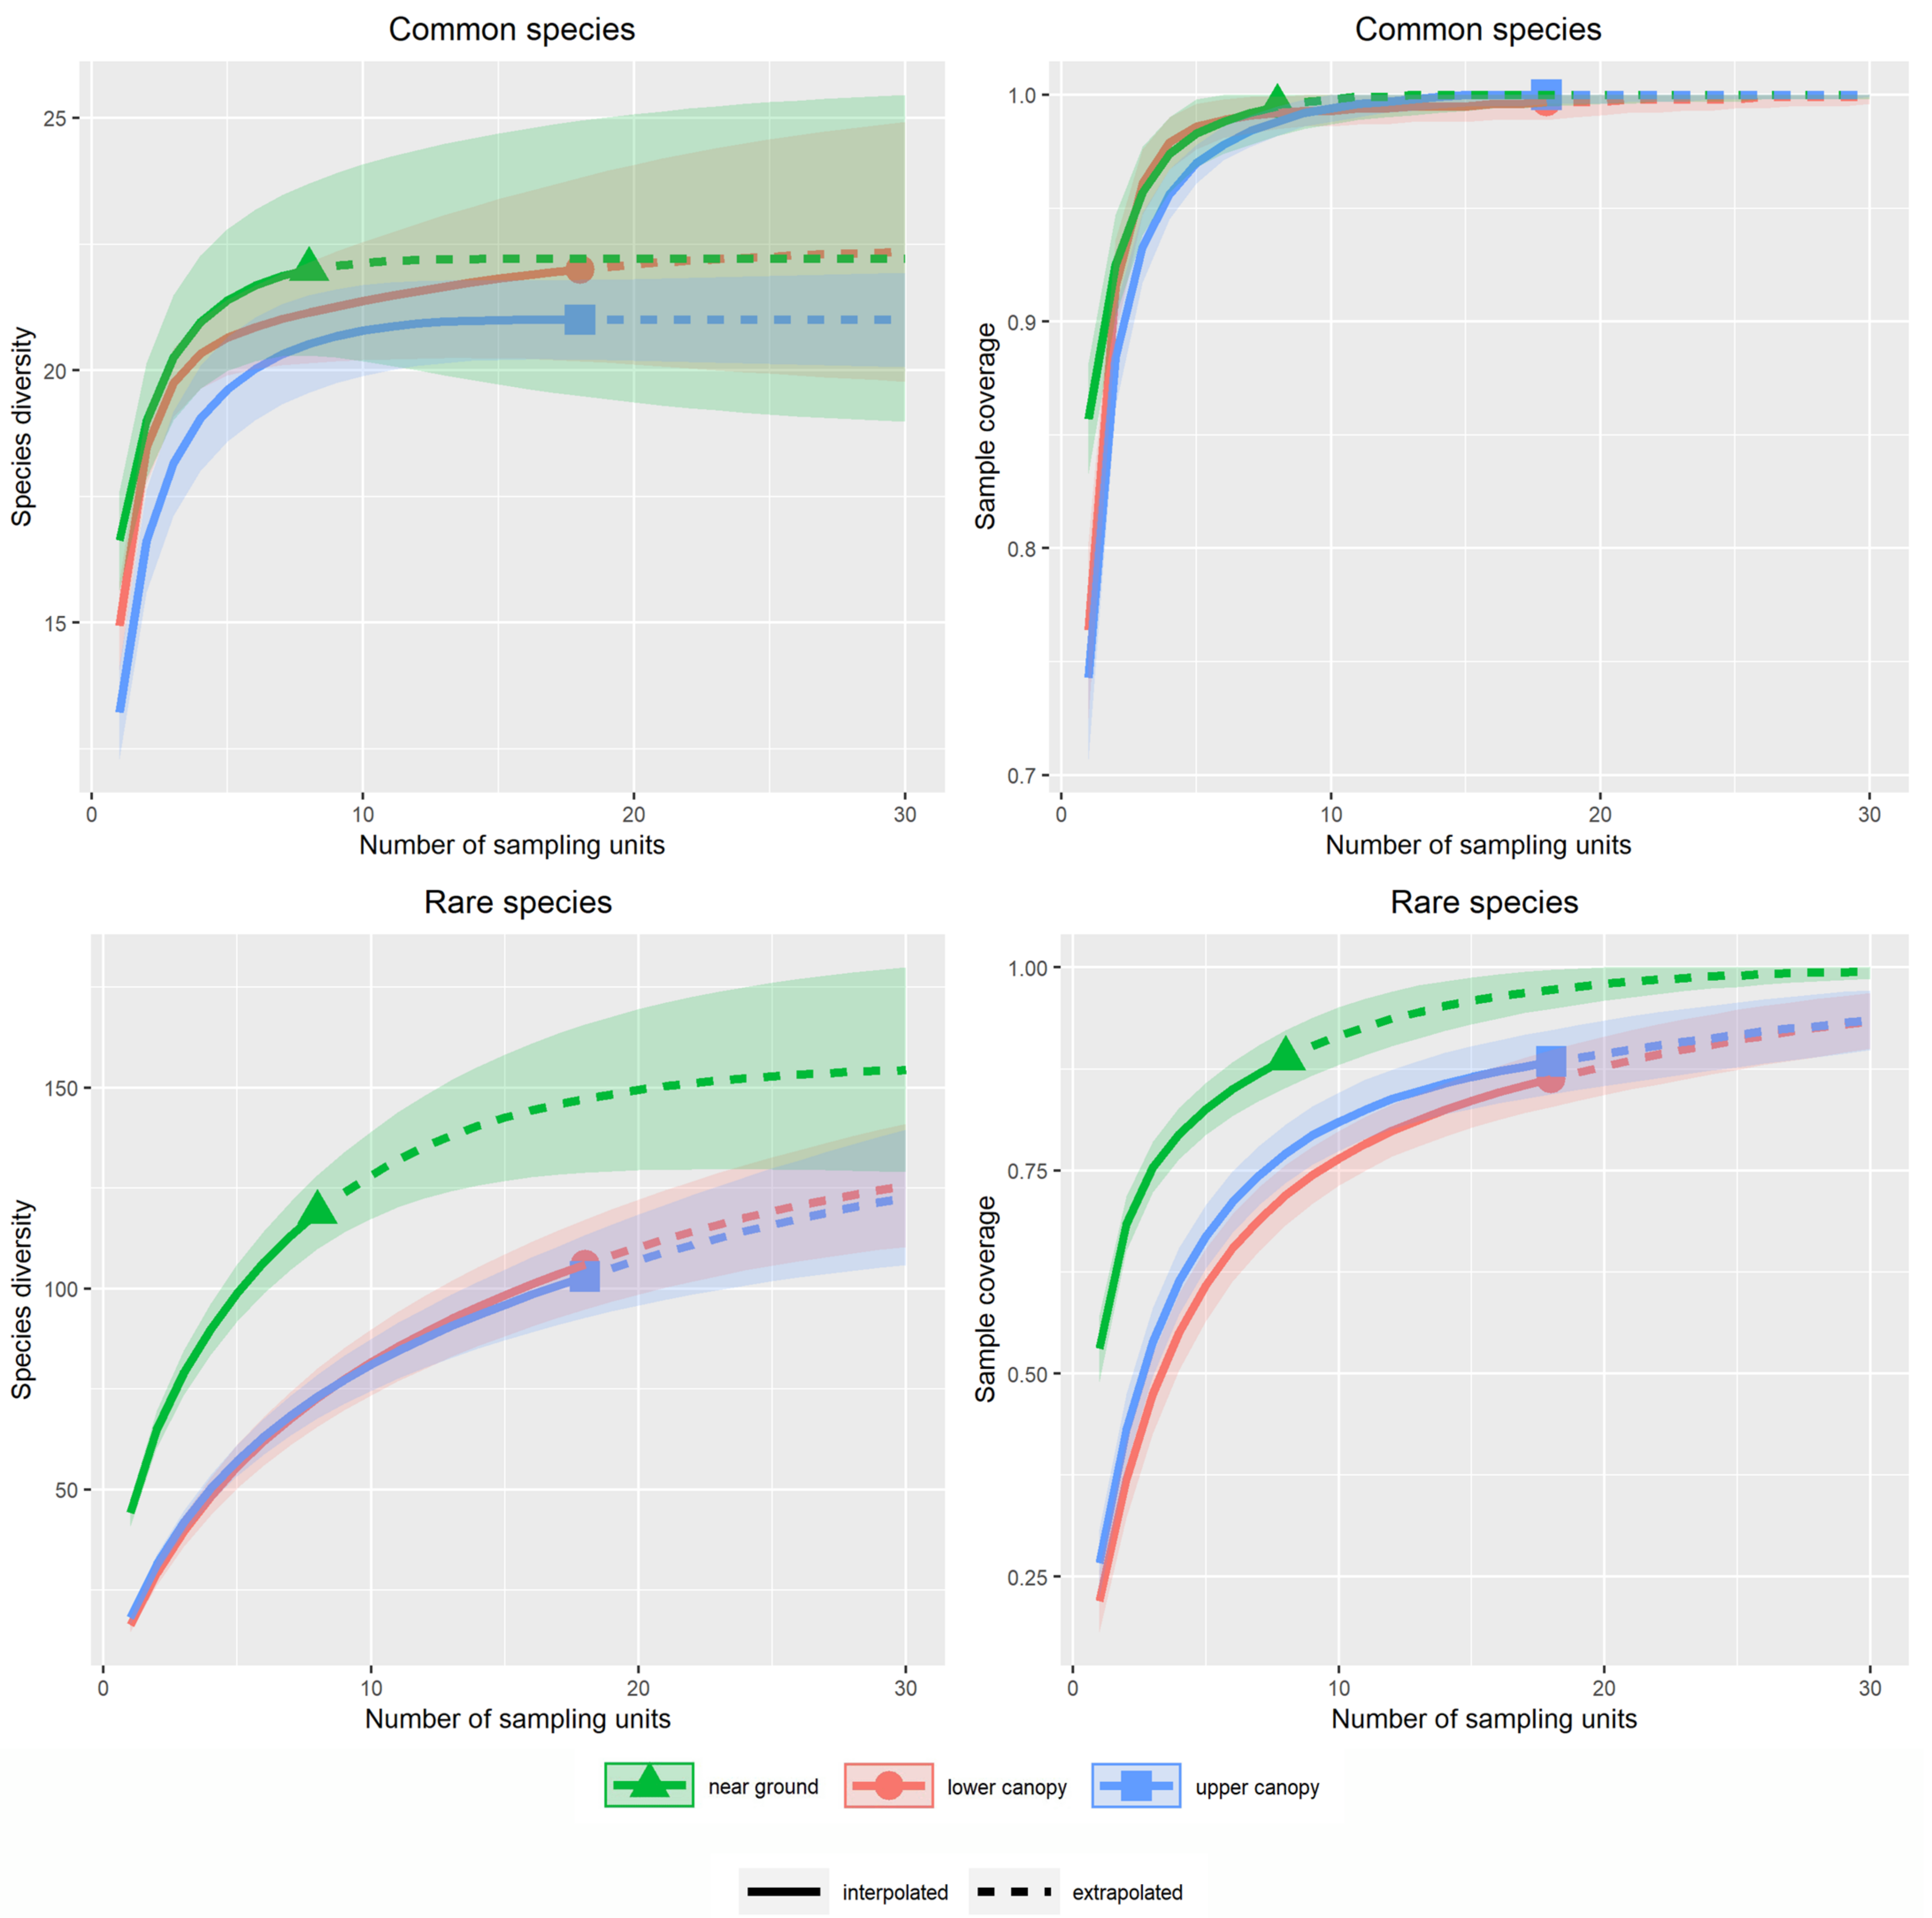
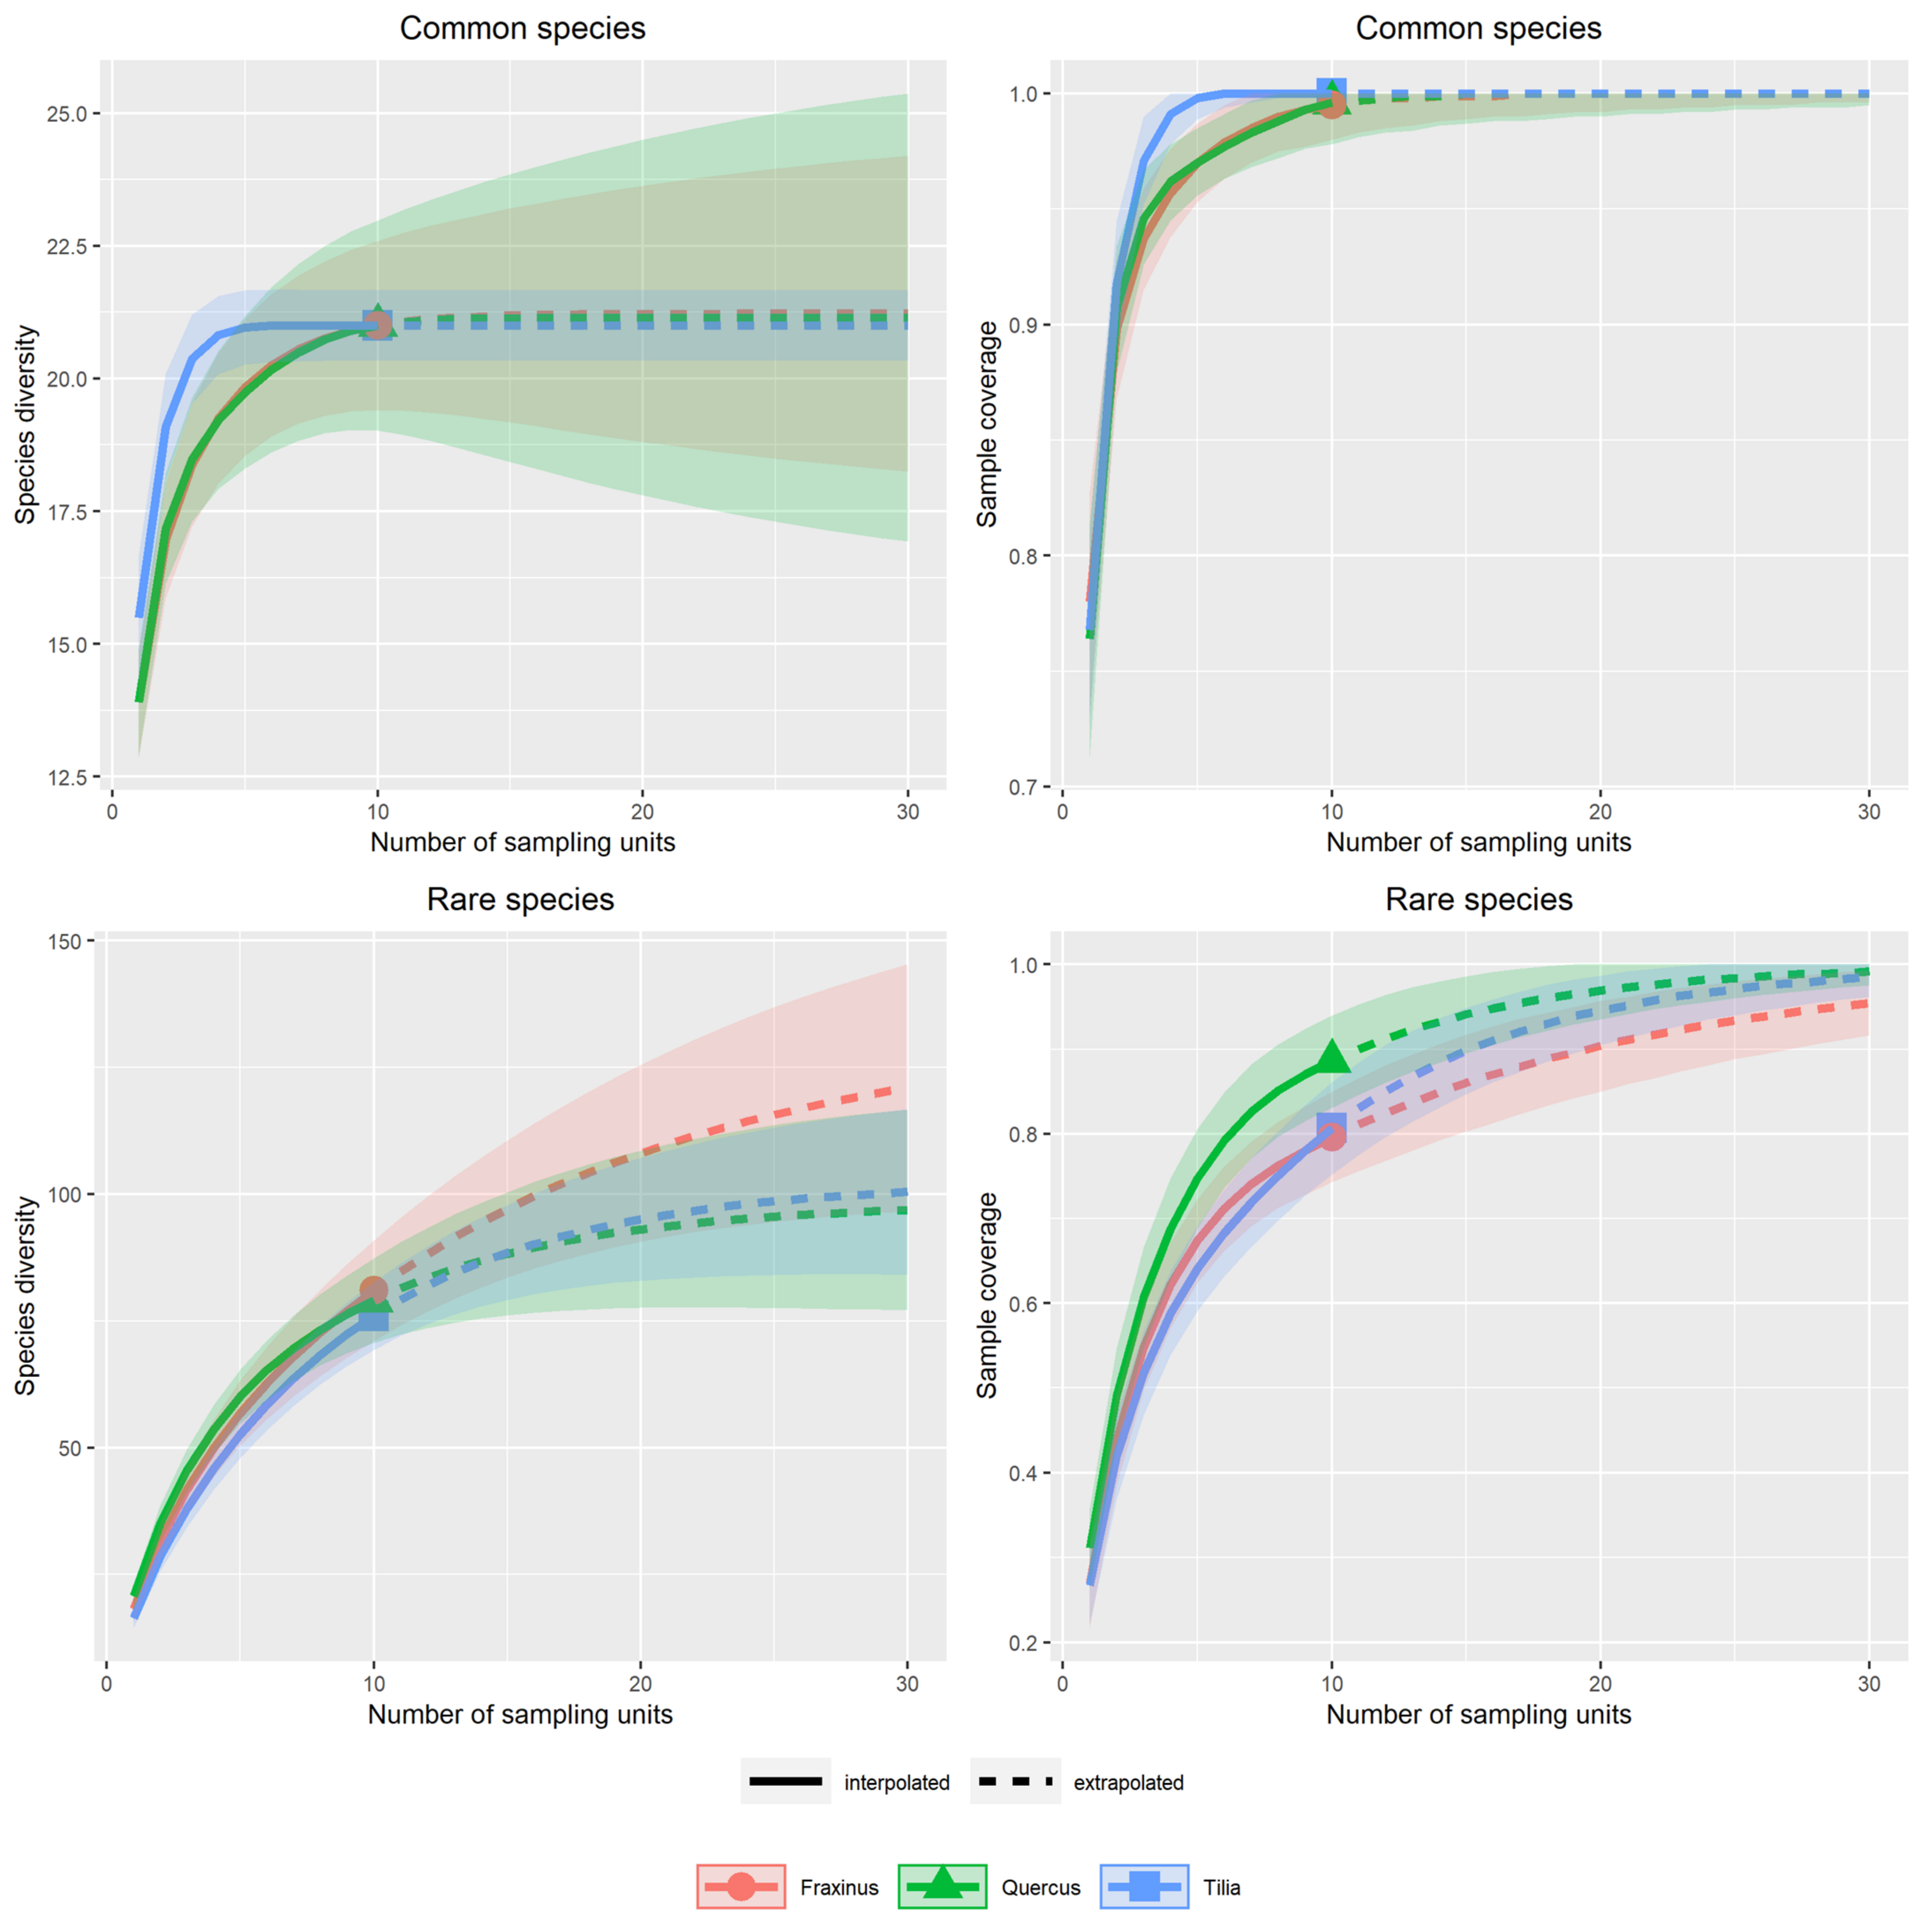
3.1. Alpha Diversity of Xylobiont Beetle Communities
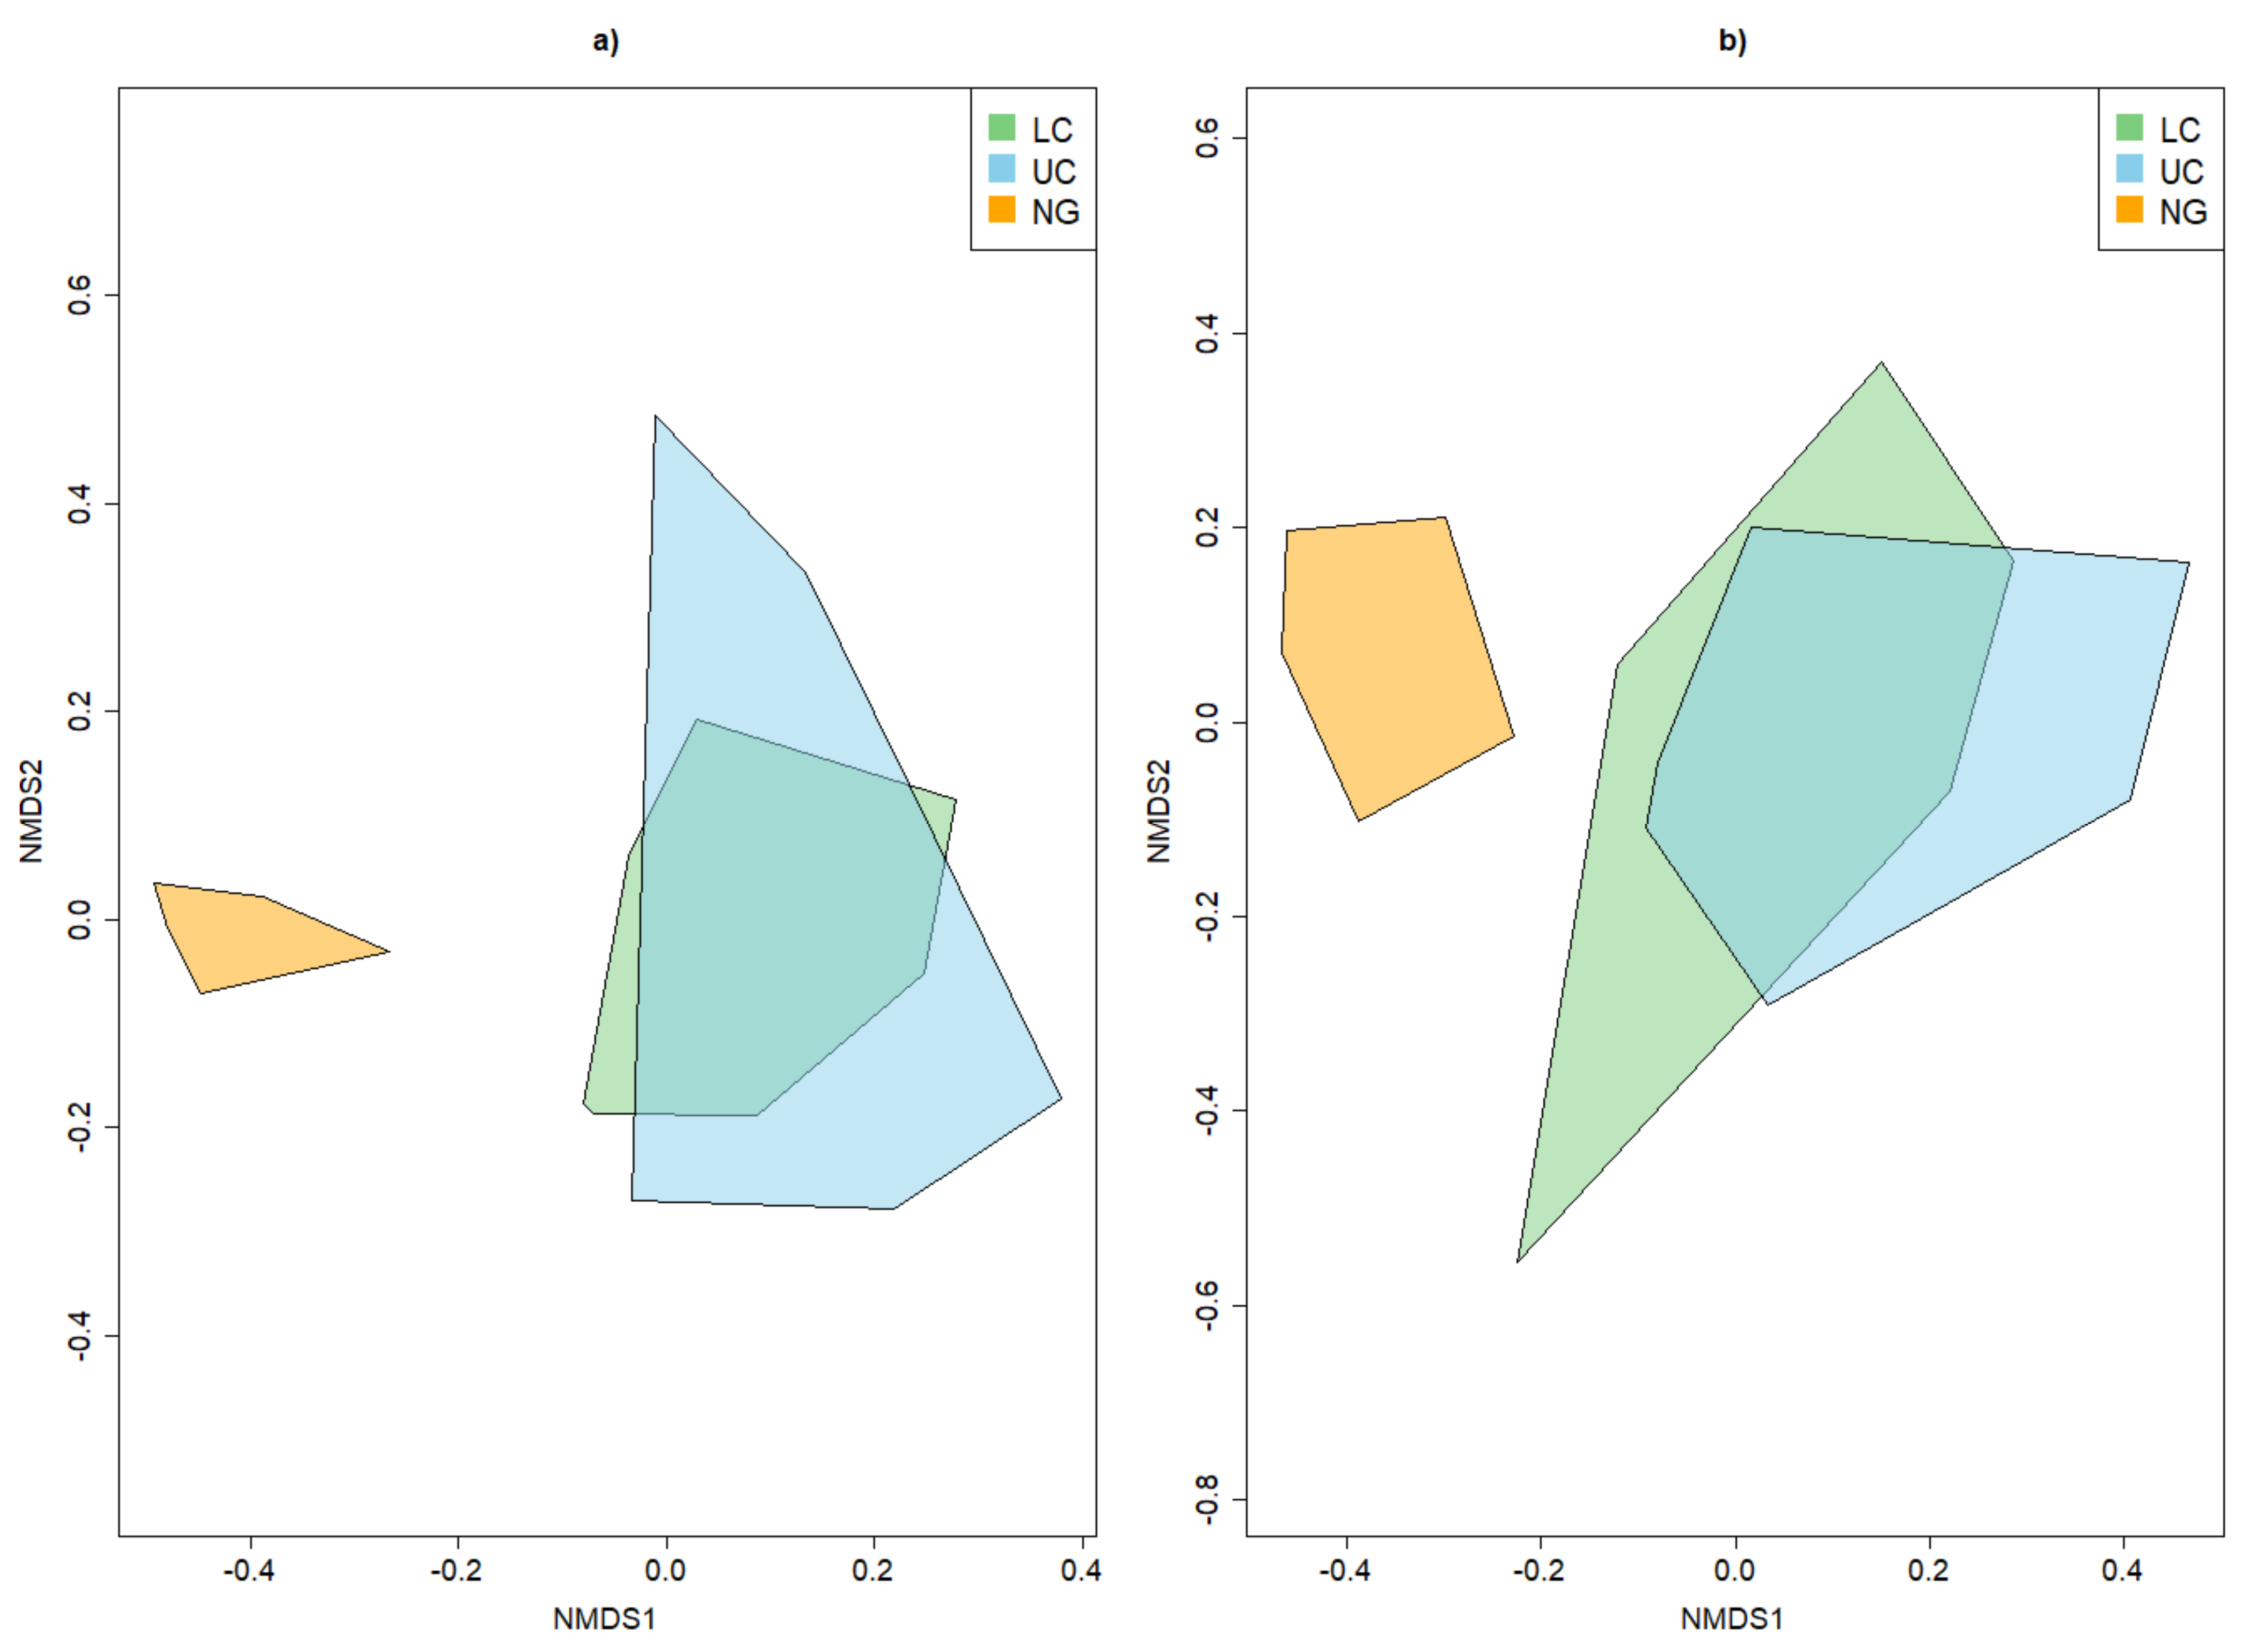
3.2. Beta Diversity of Xylobiont Beetle Communities
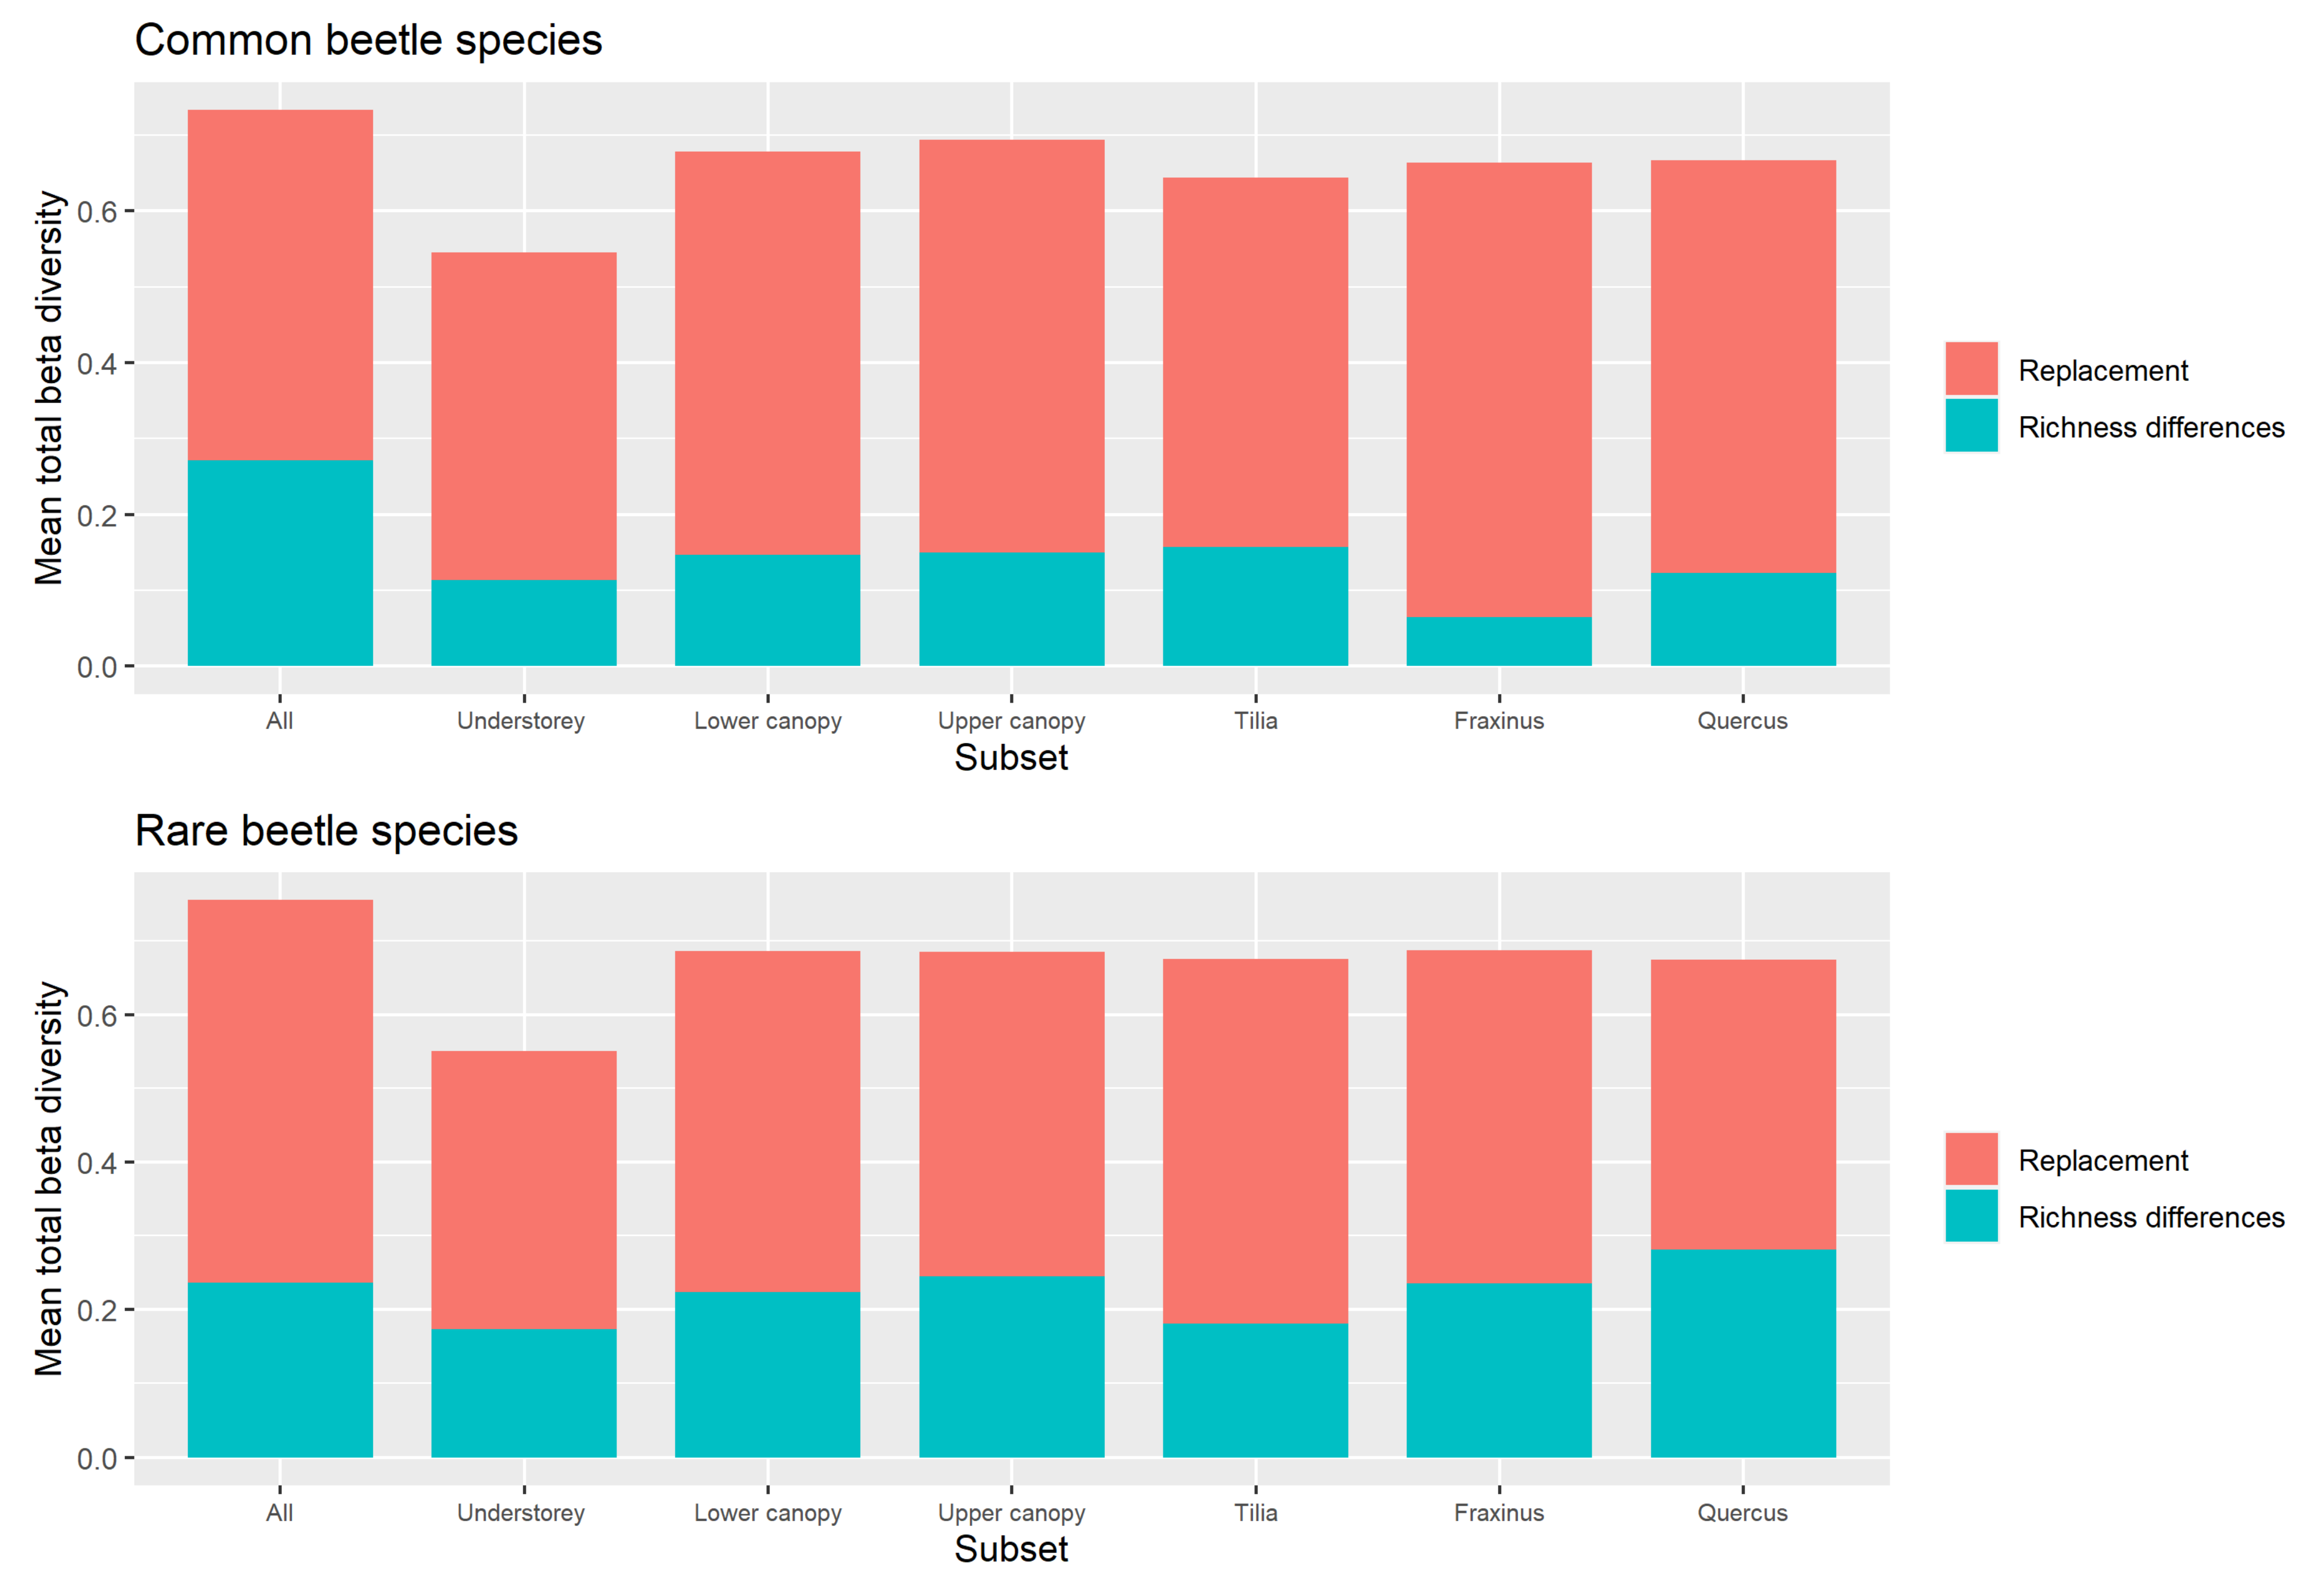
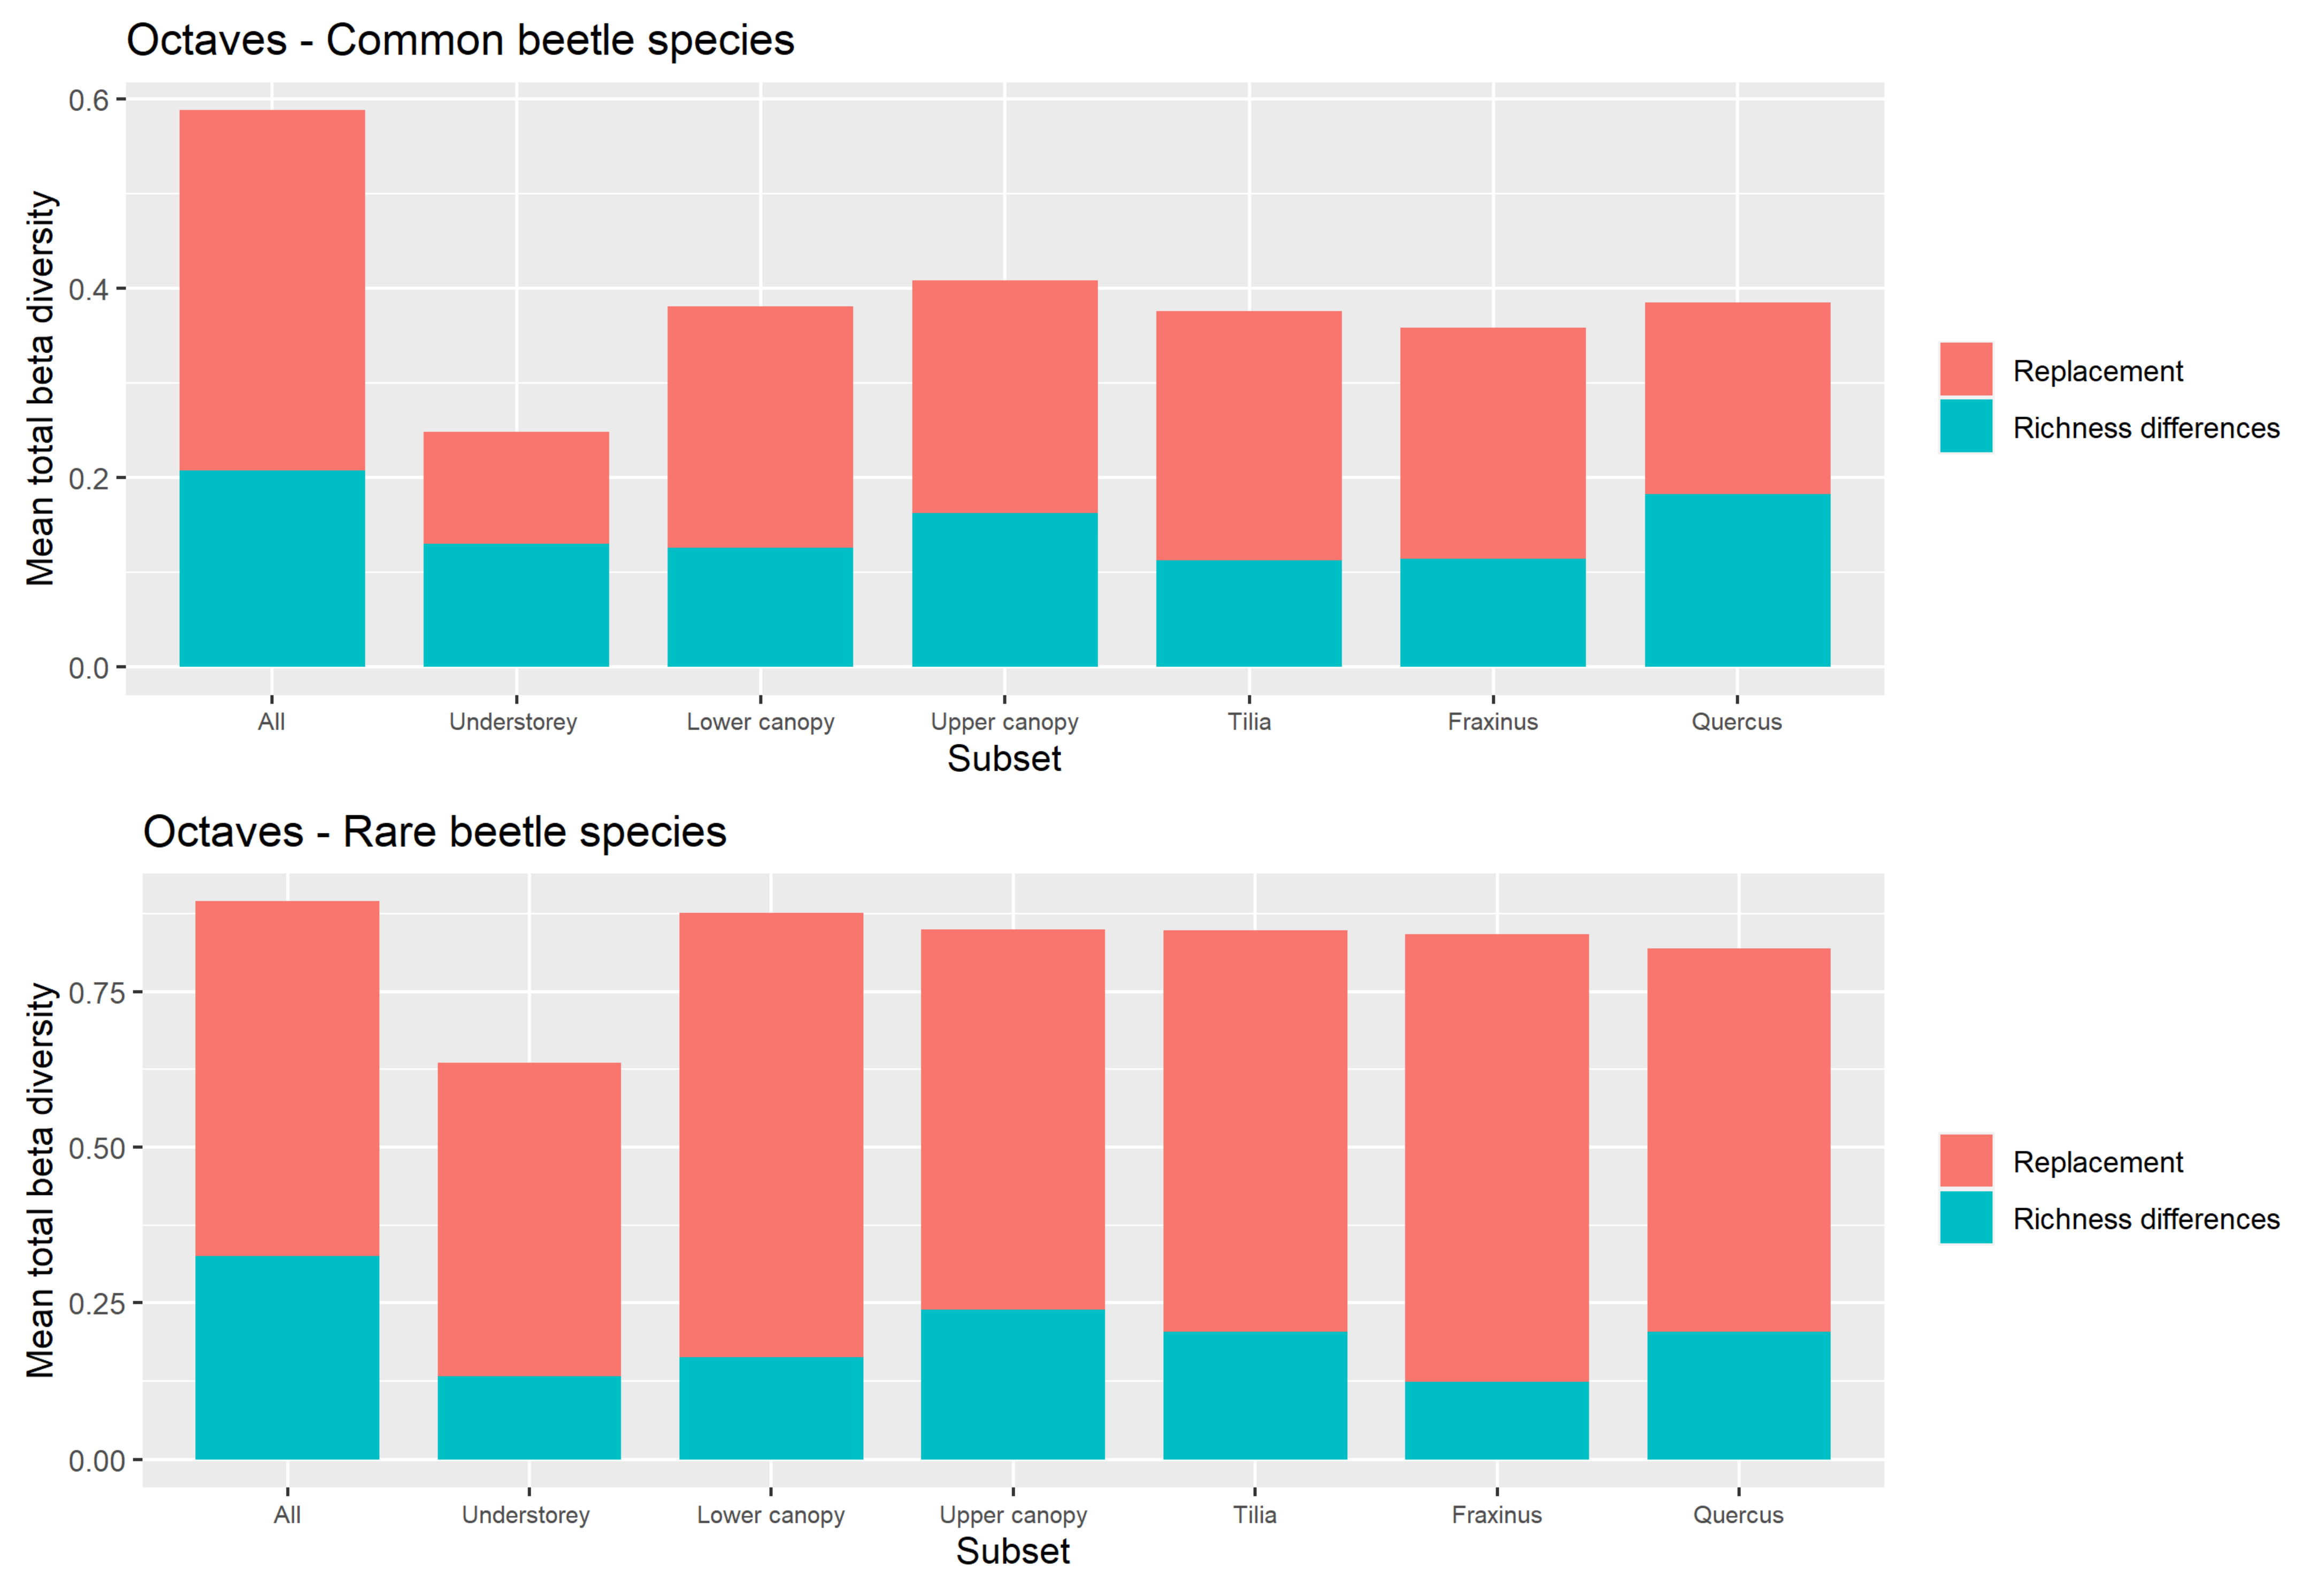
Replacement versus Richness Differences
3.3. Environmental Influences
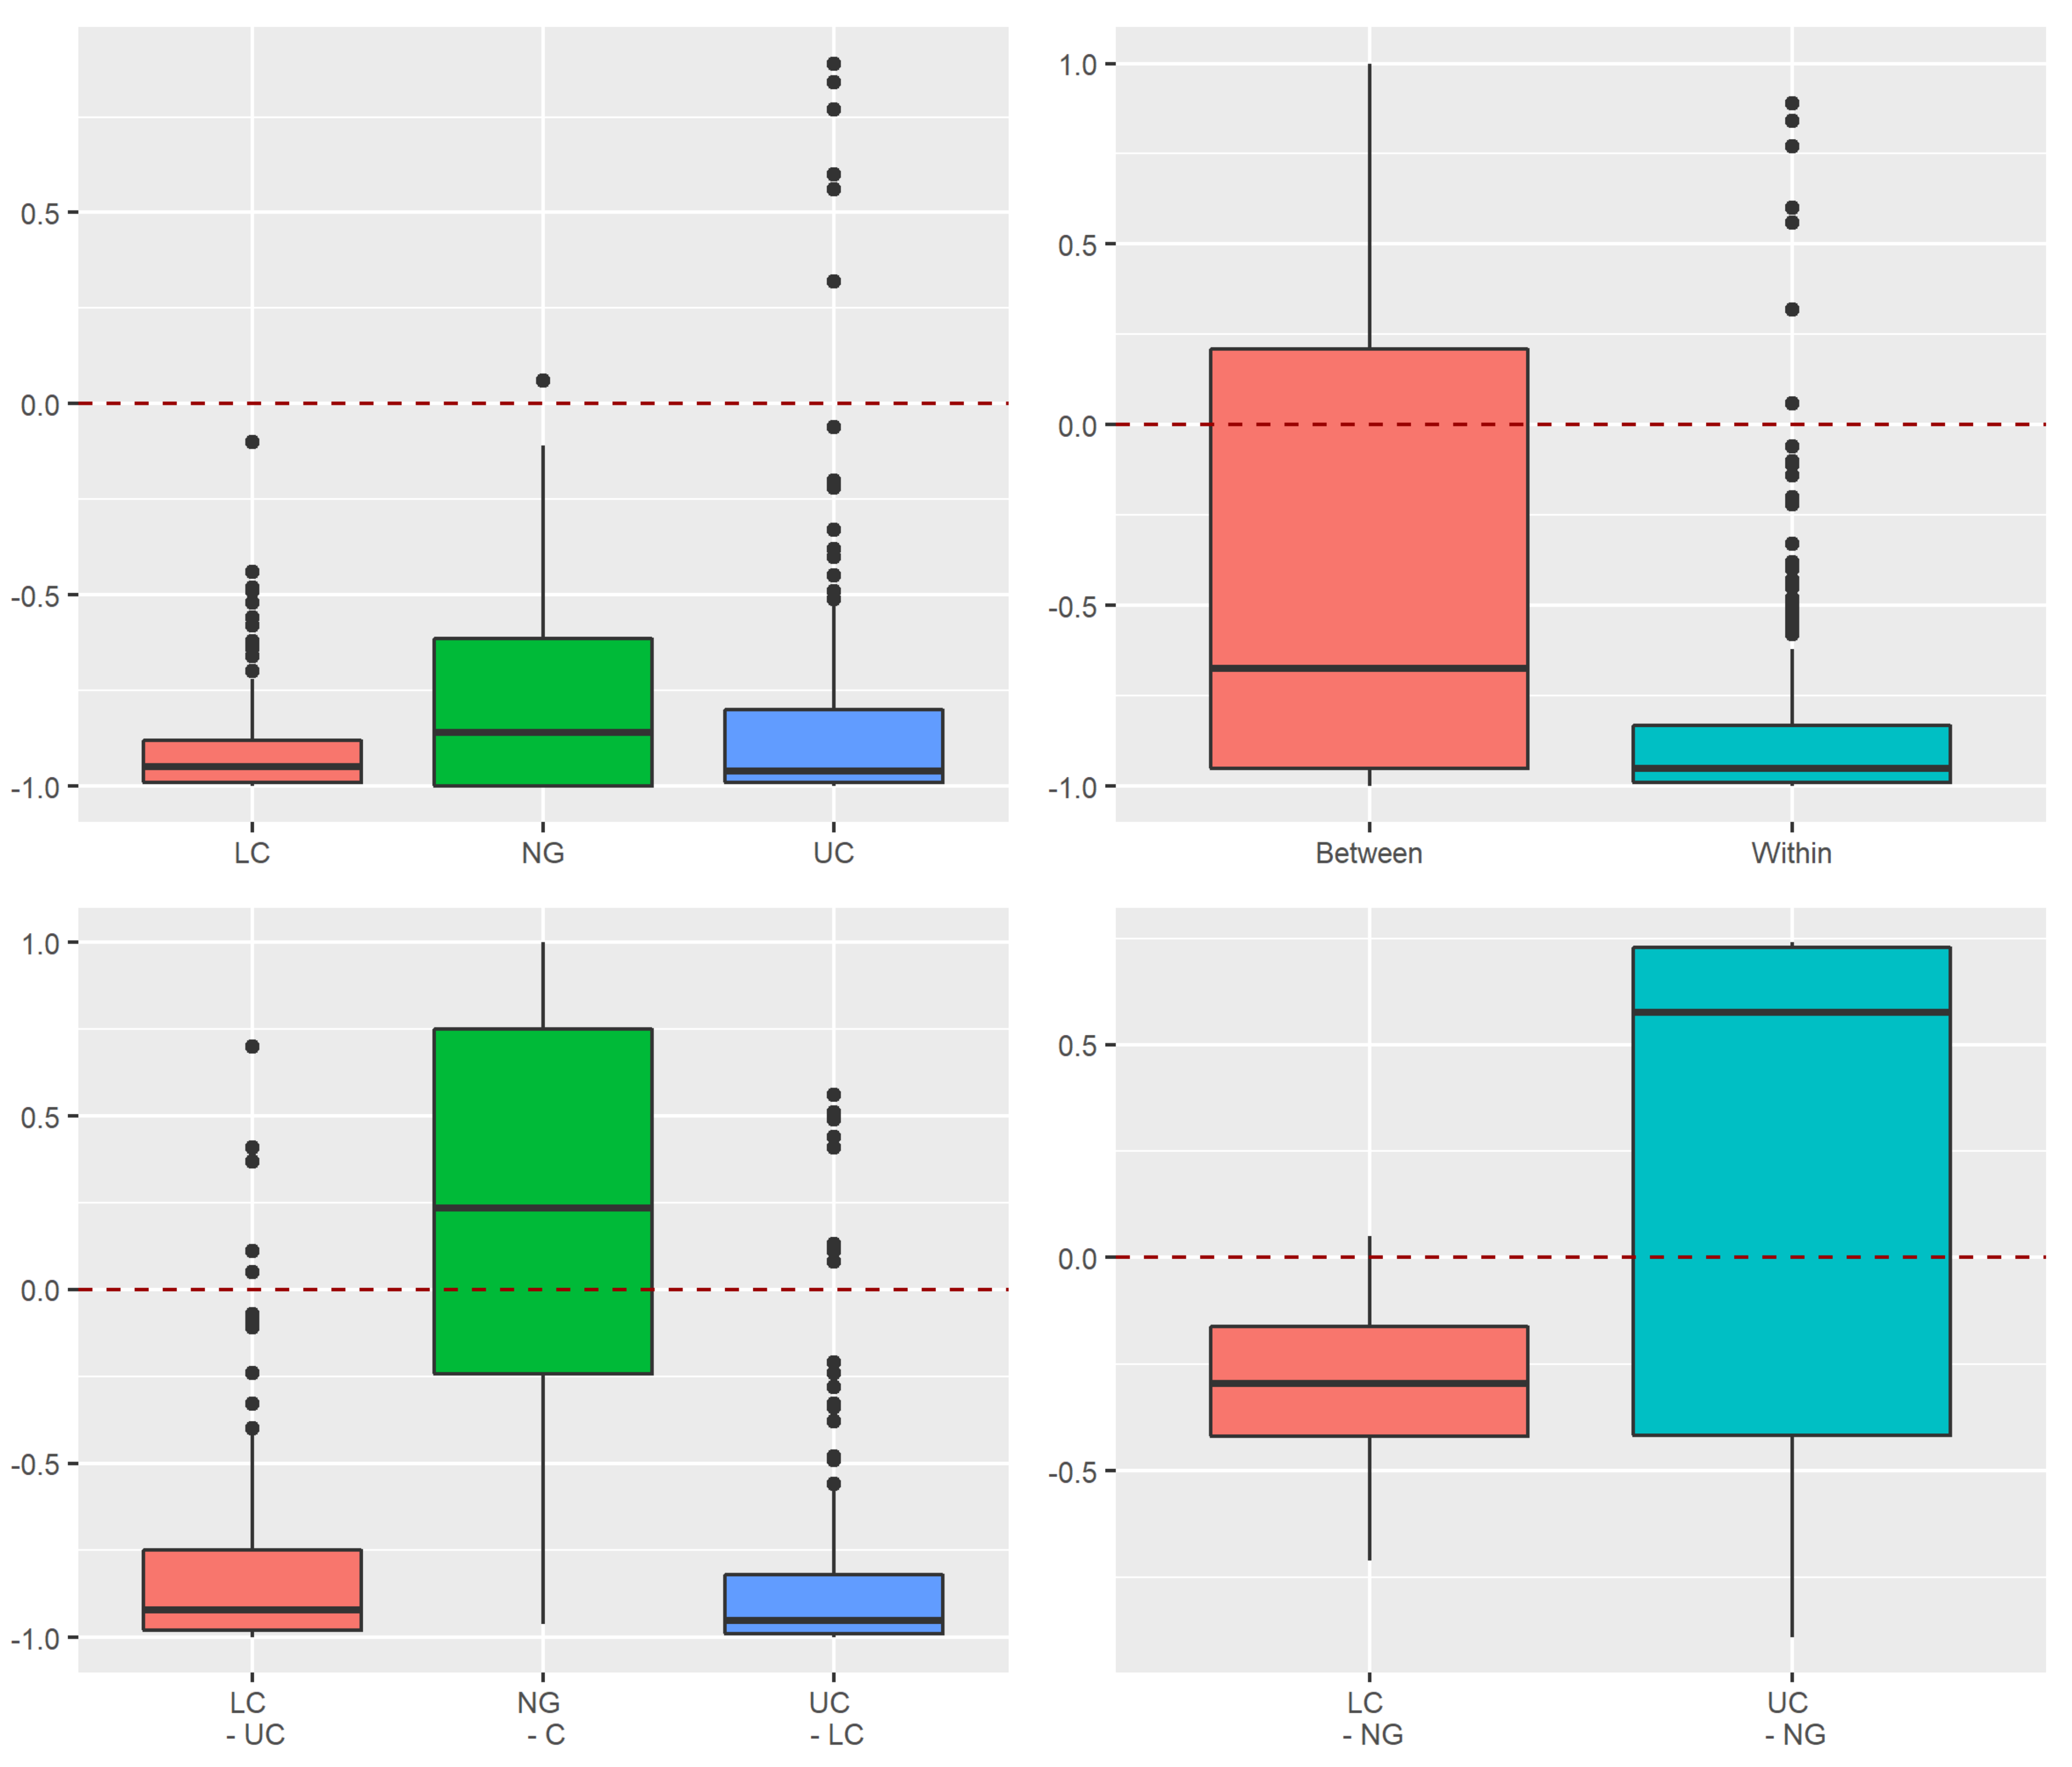
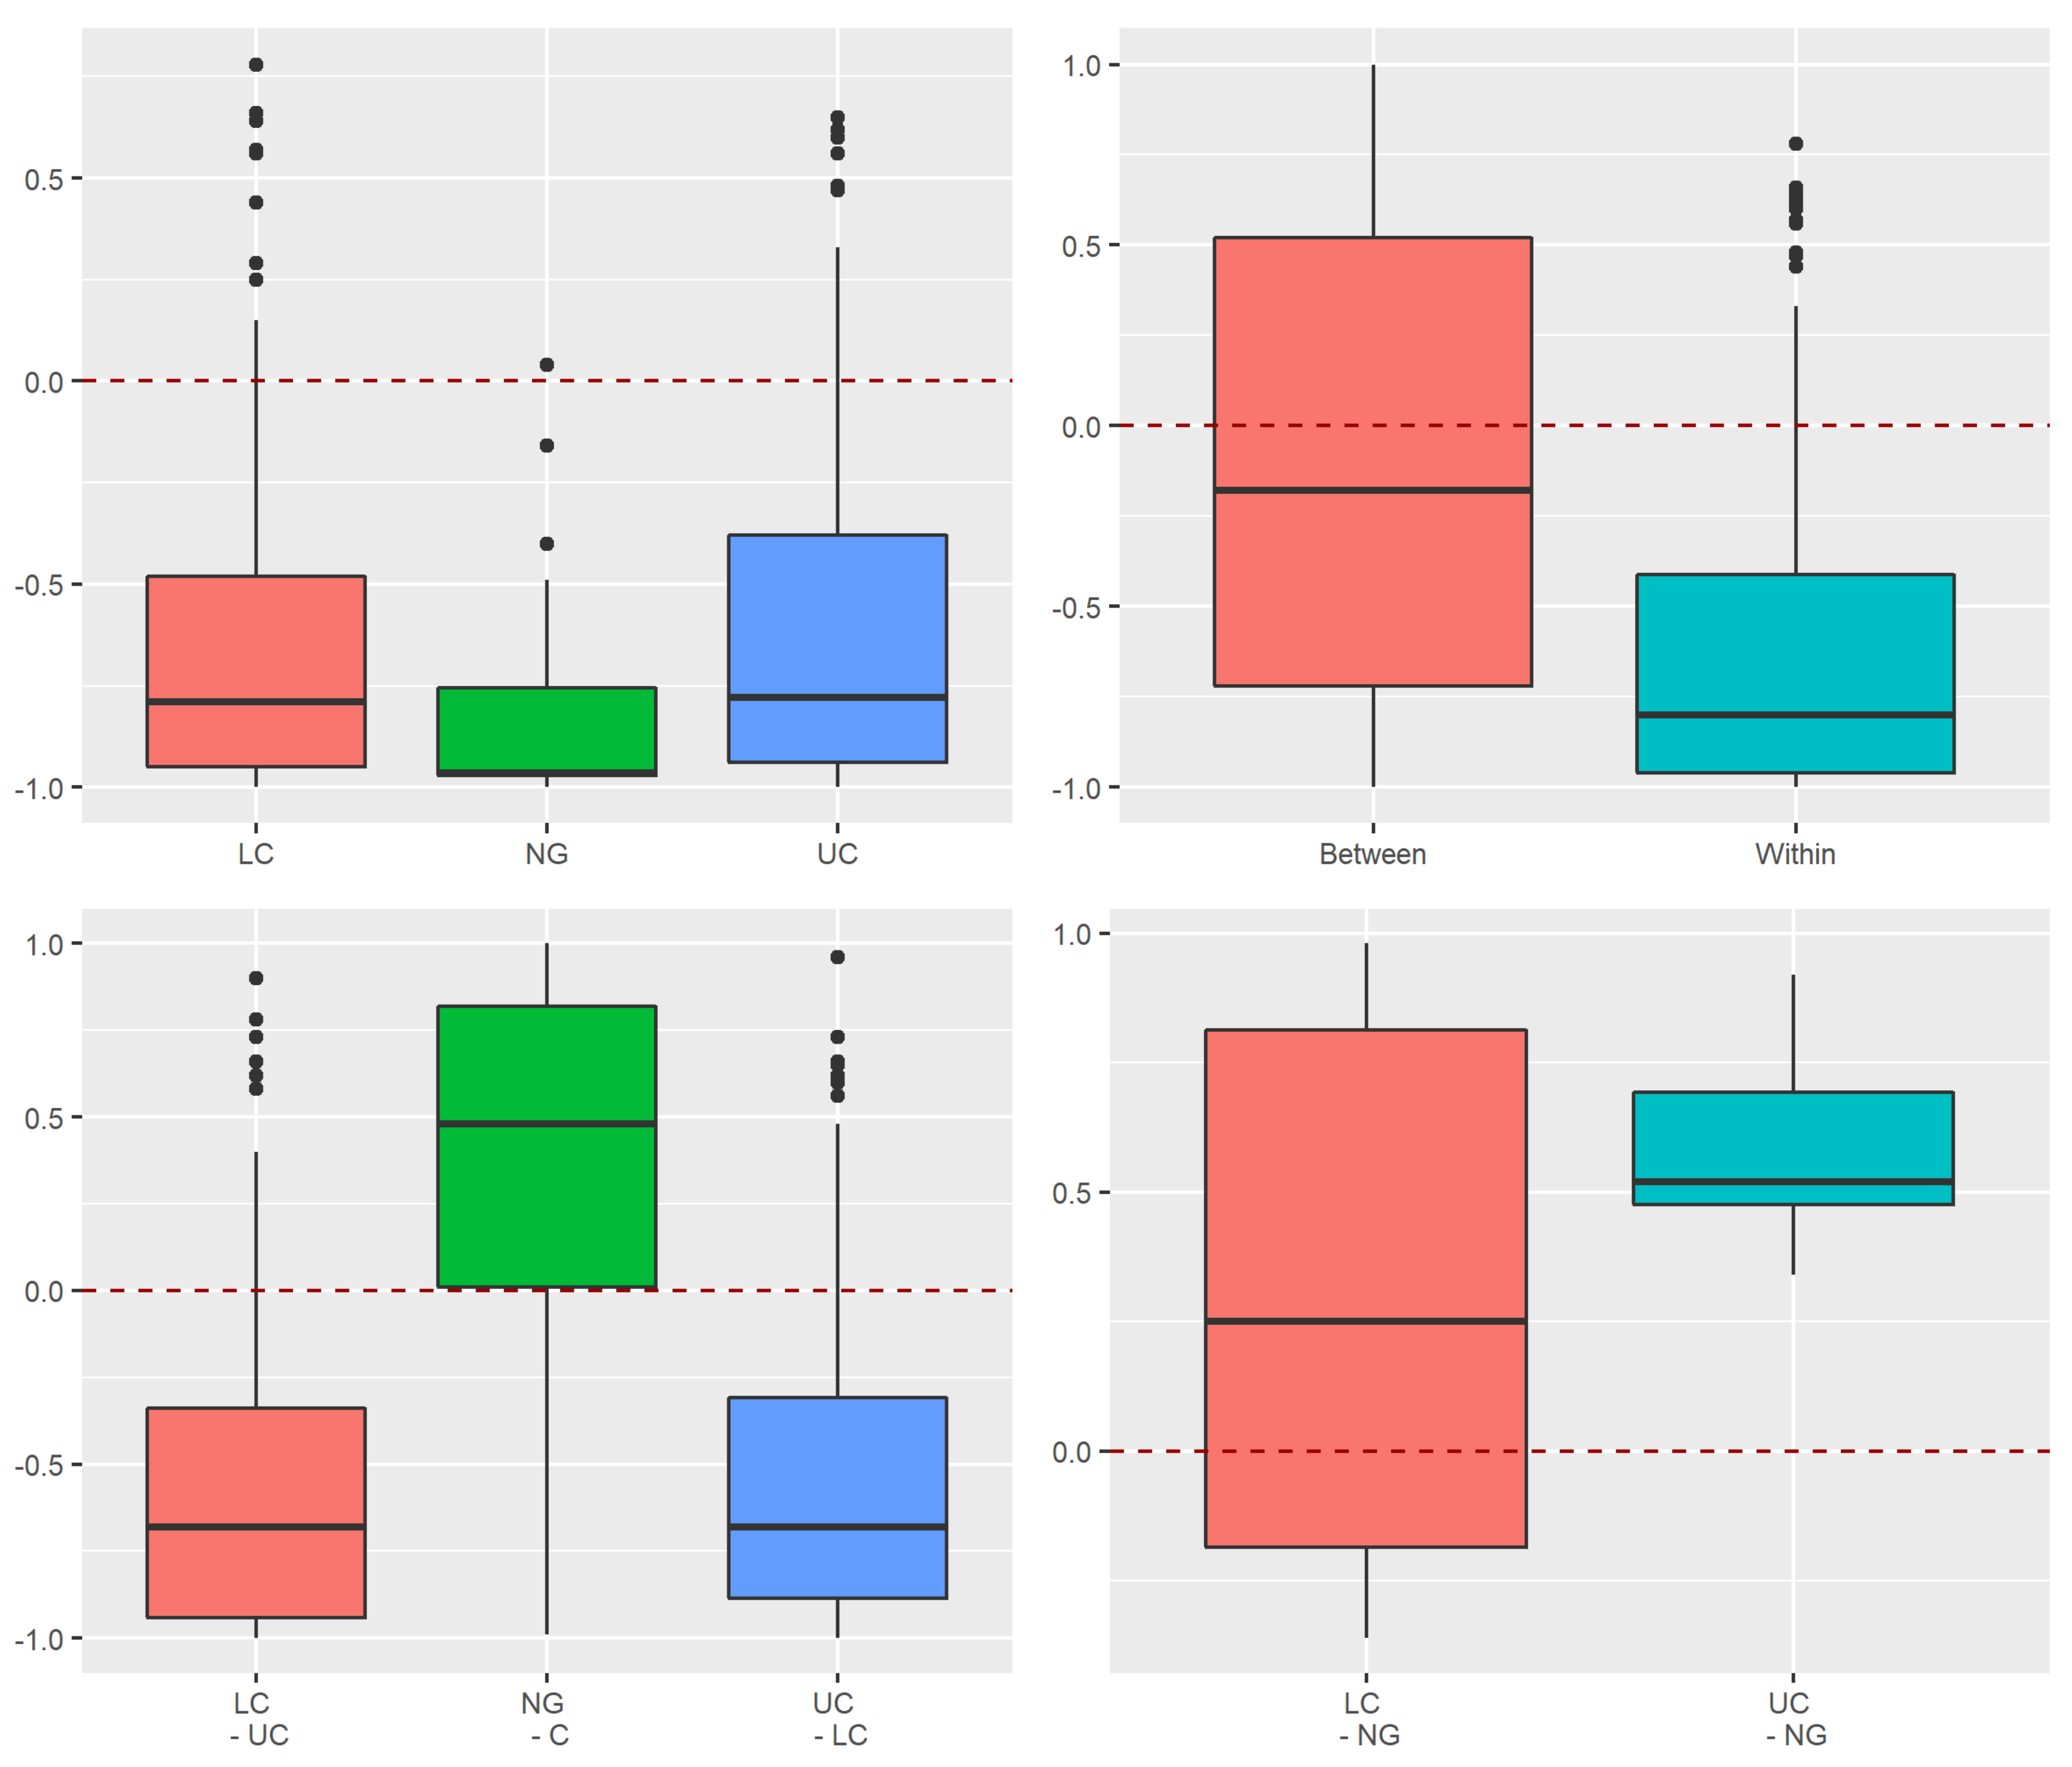
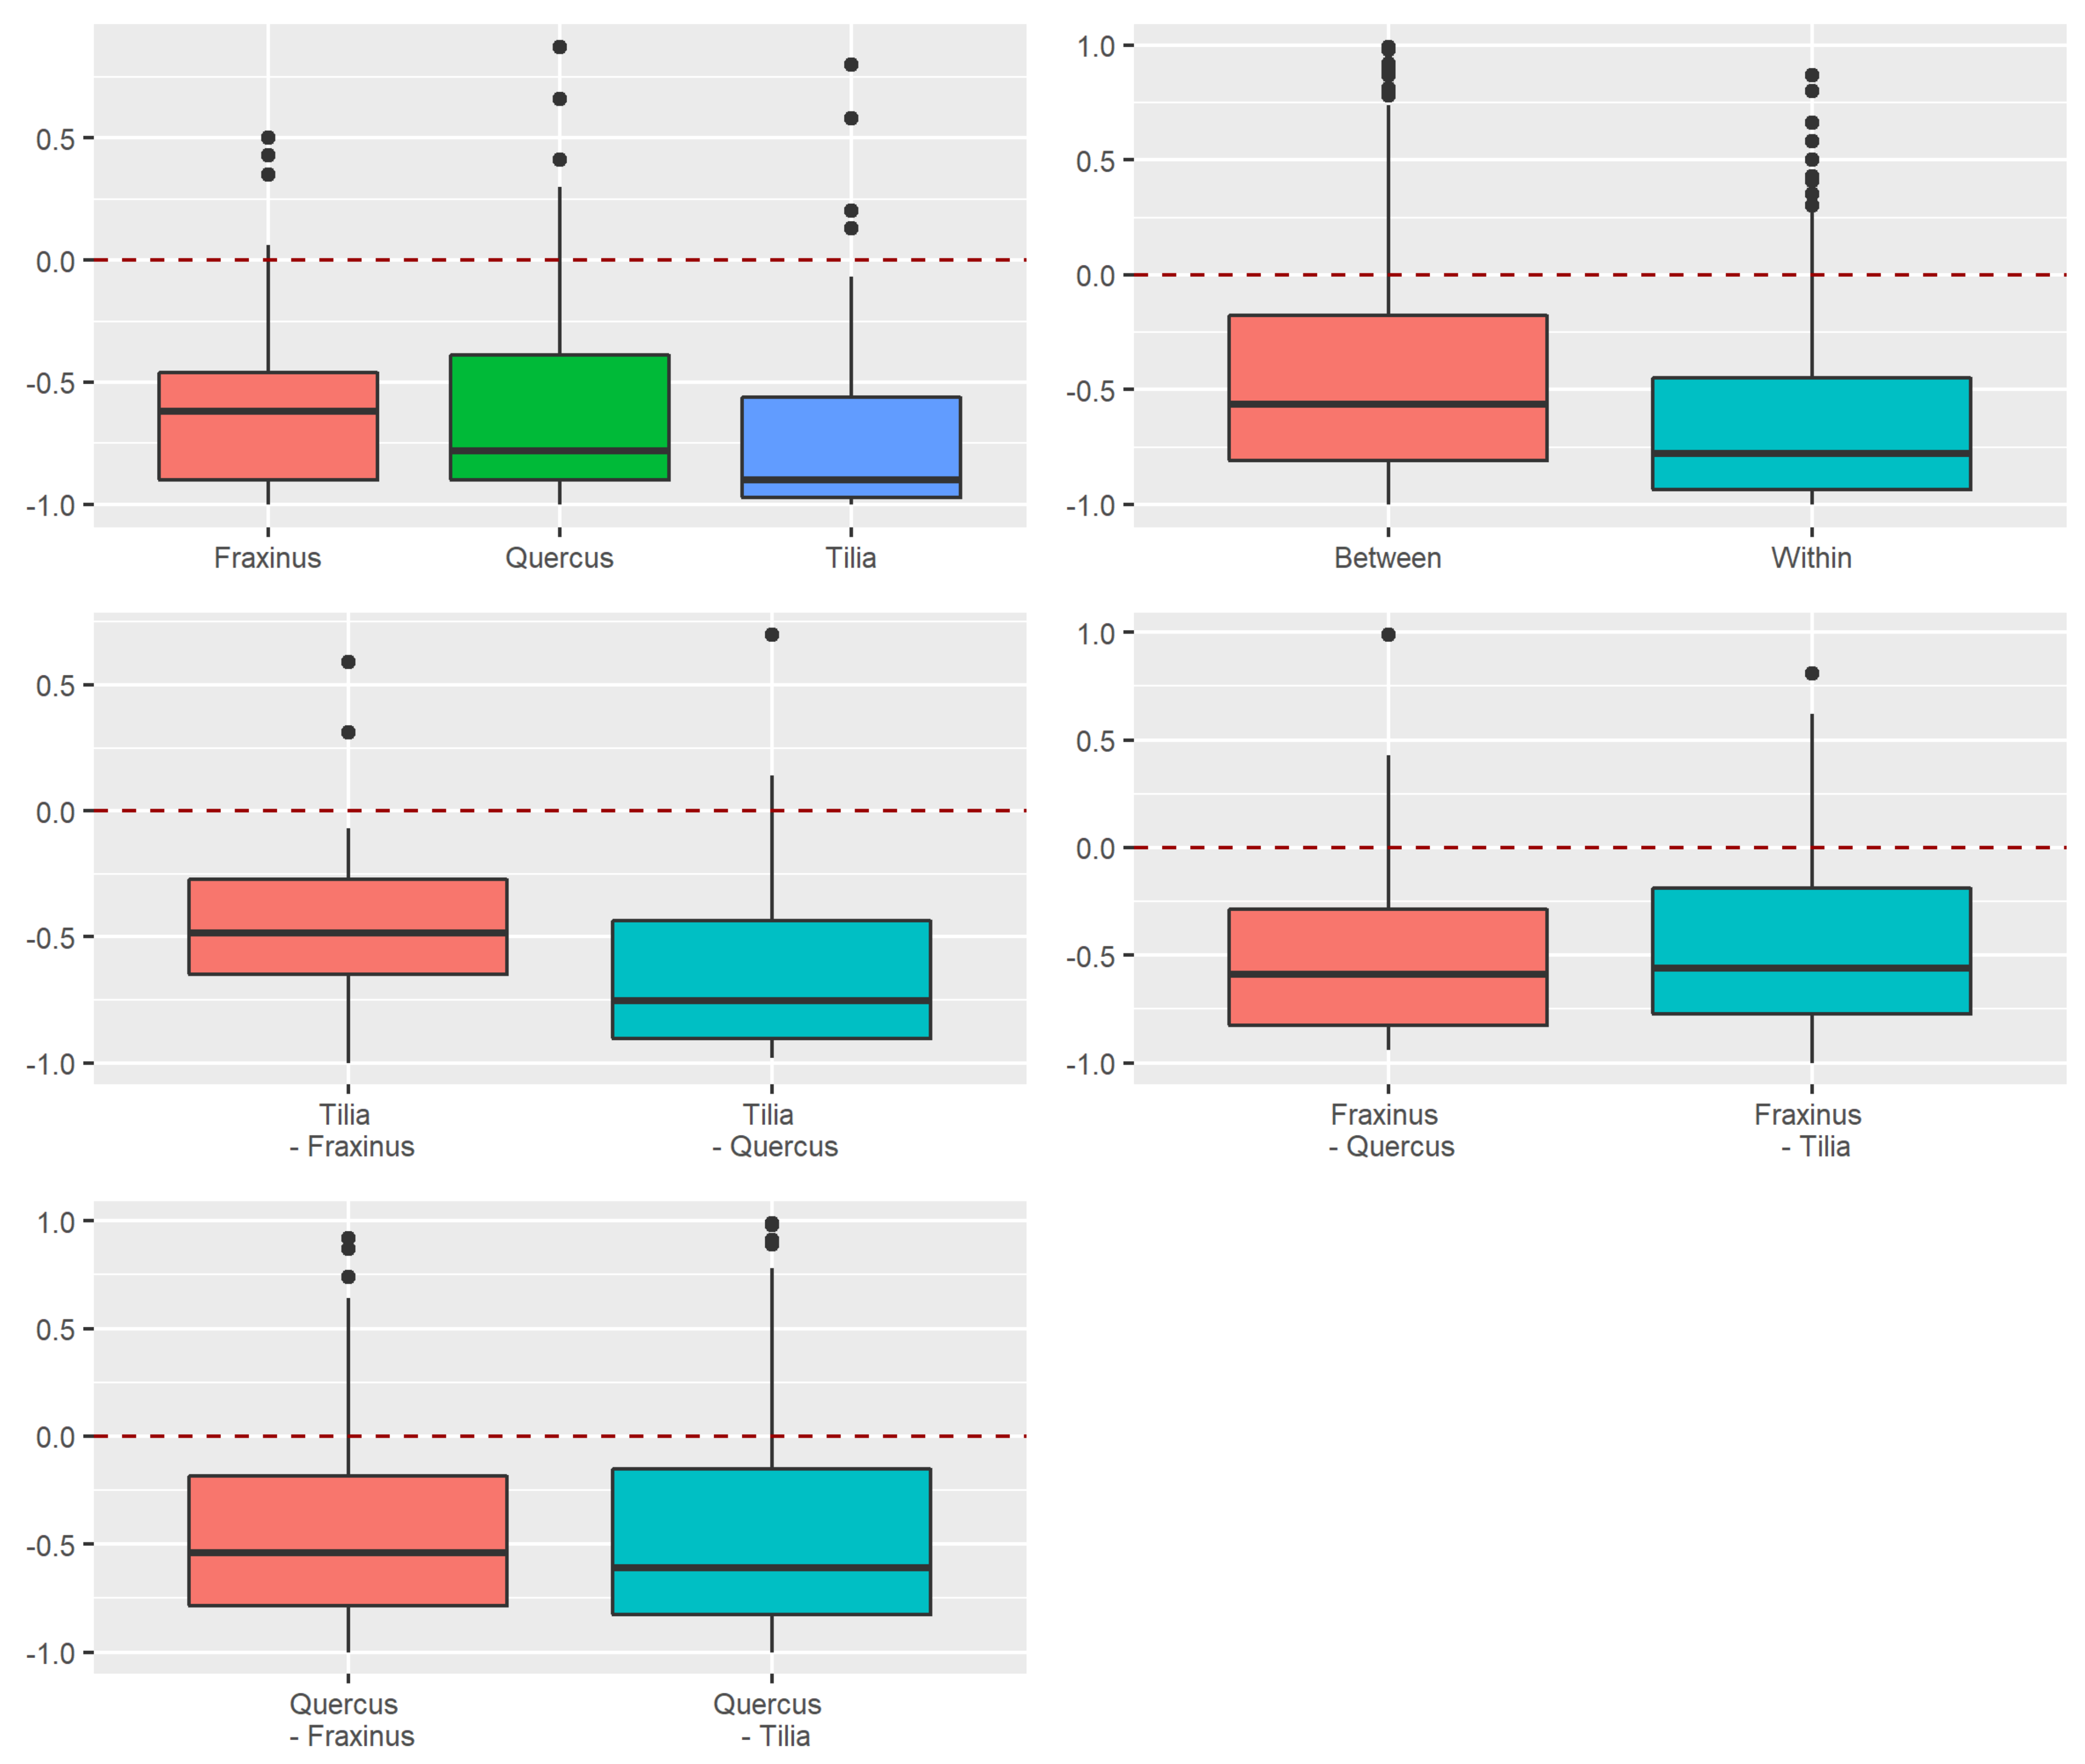
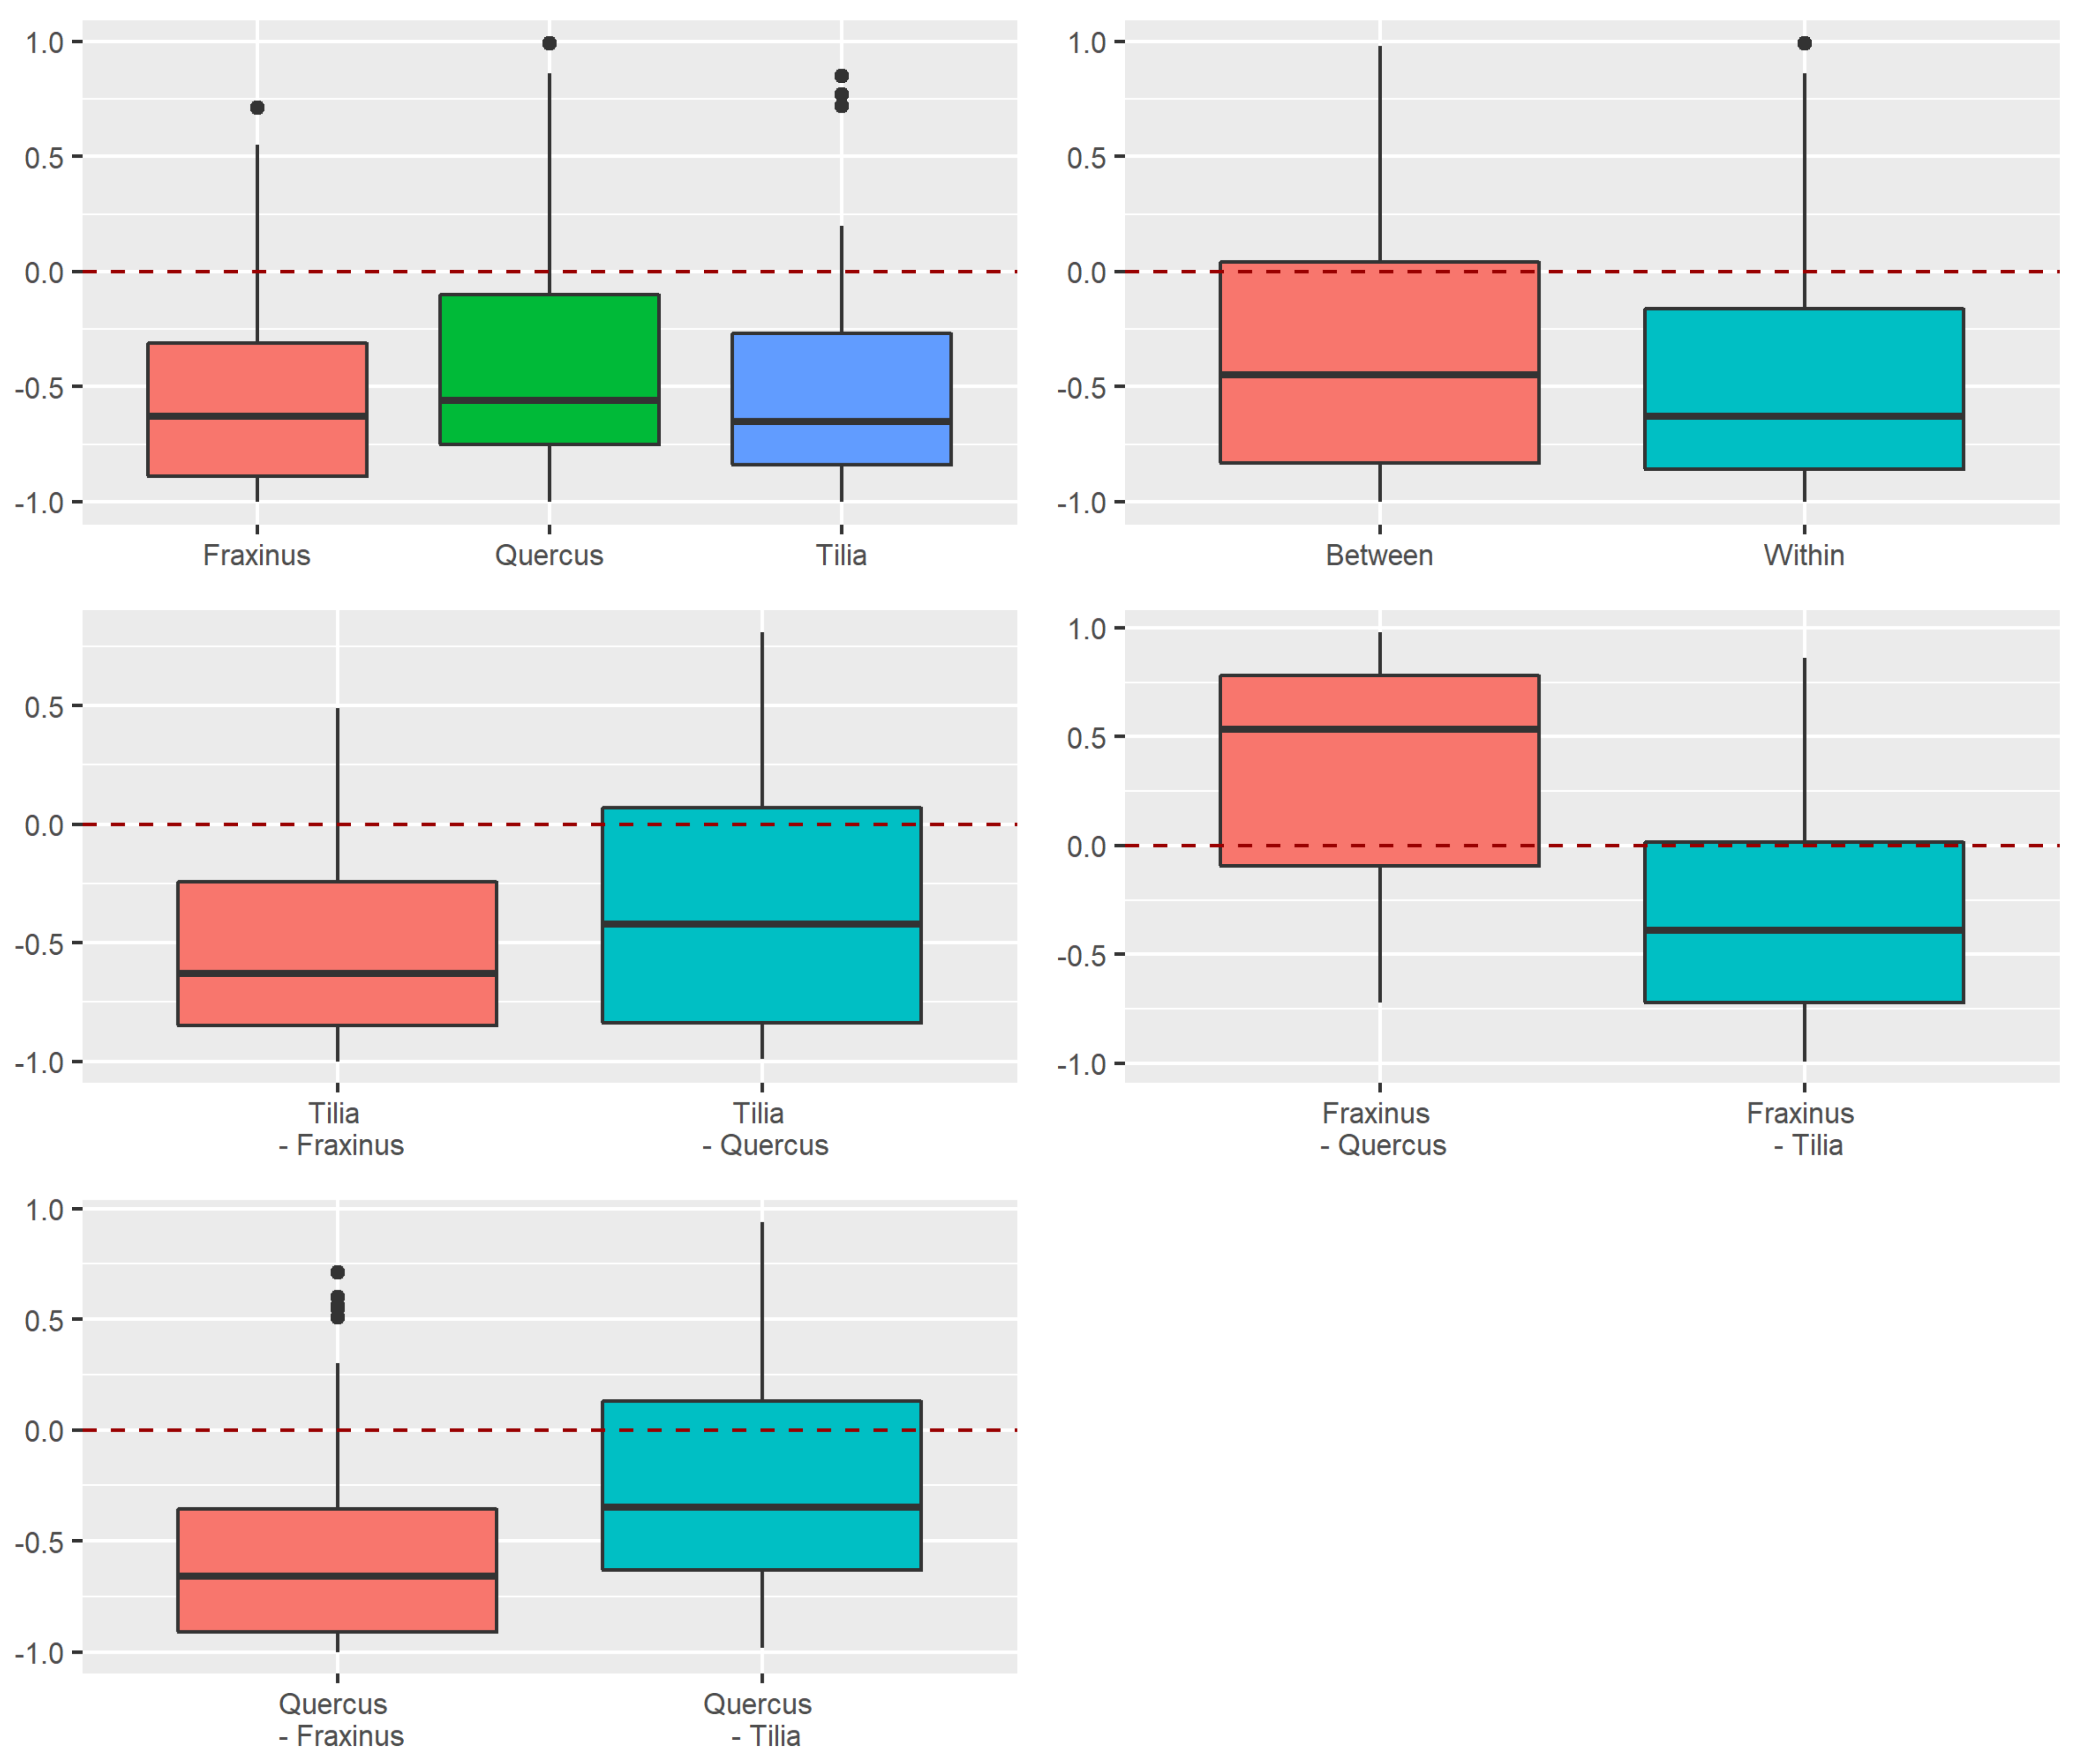
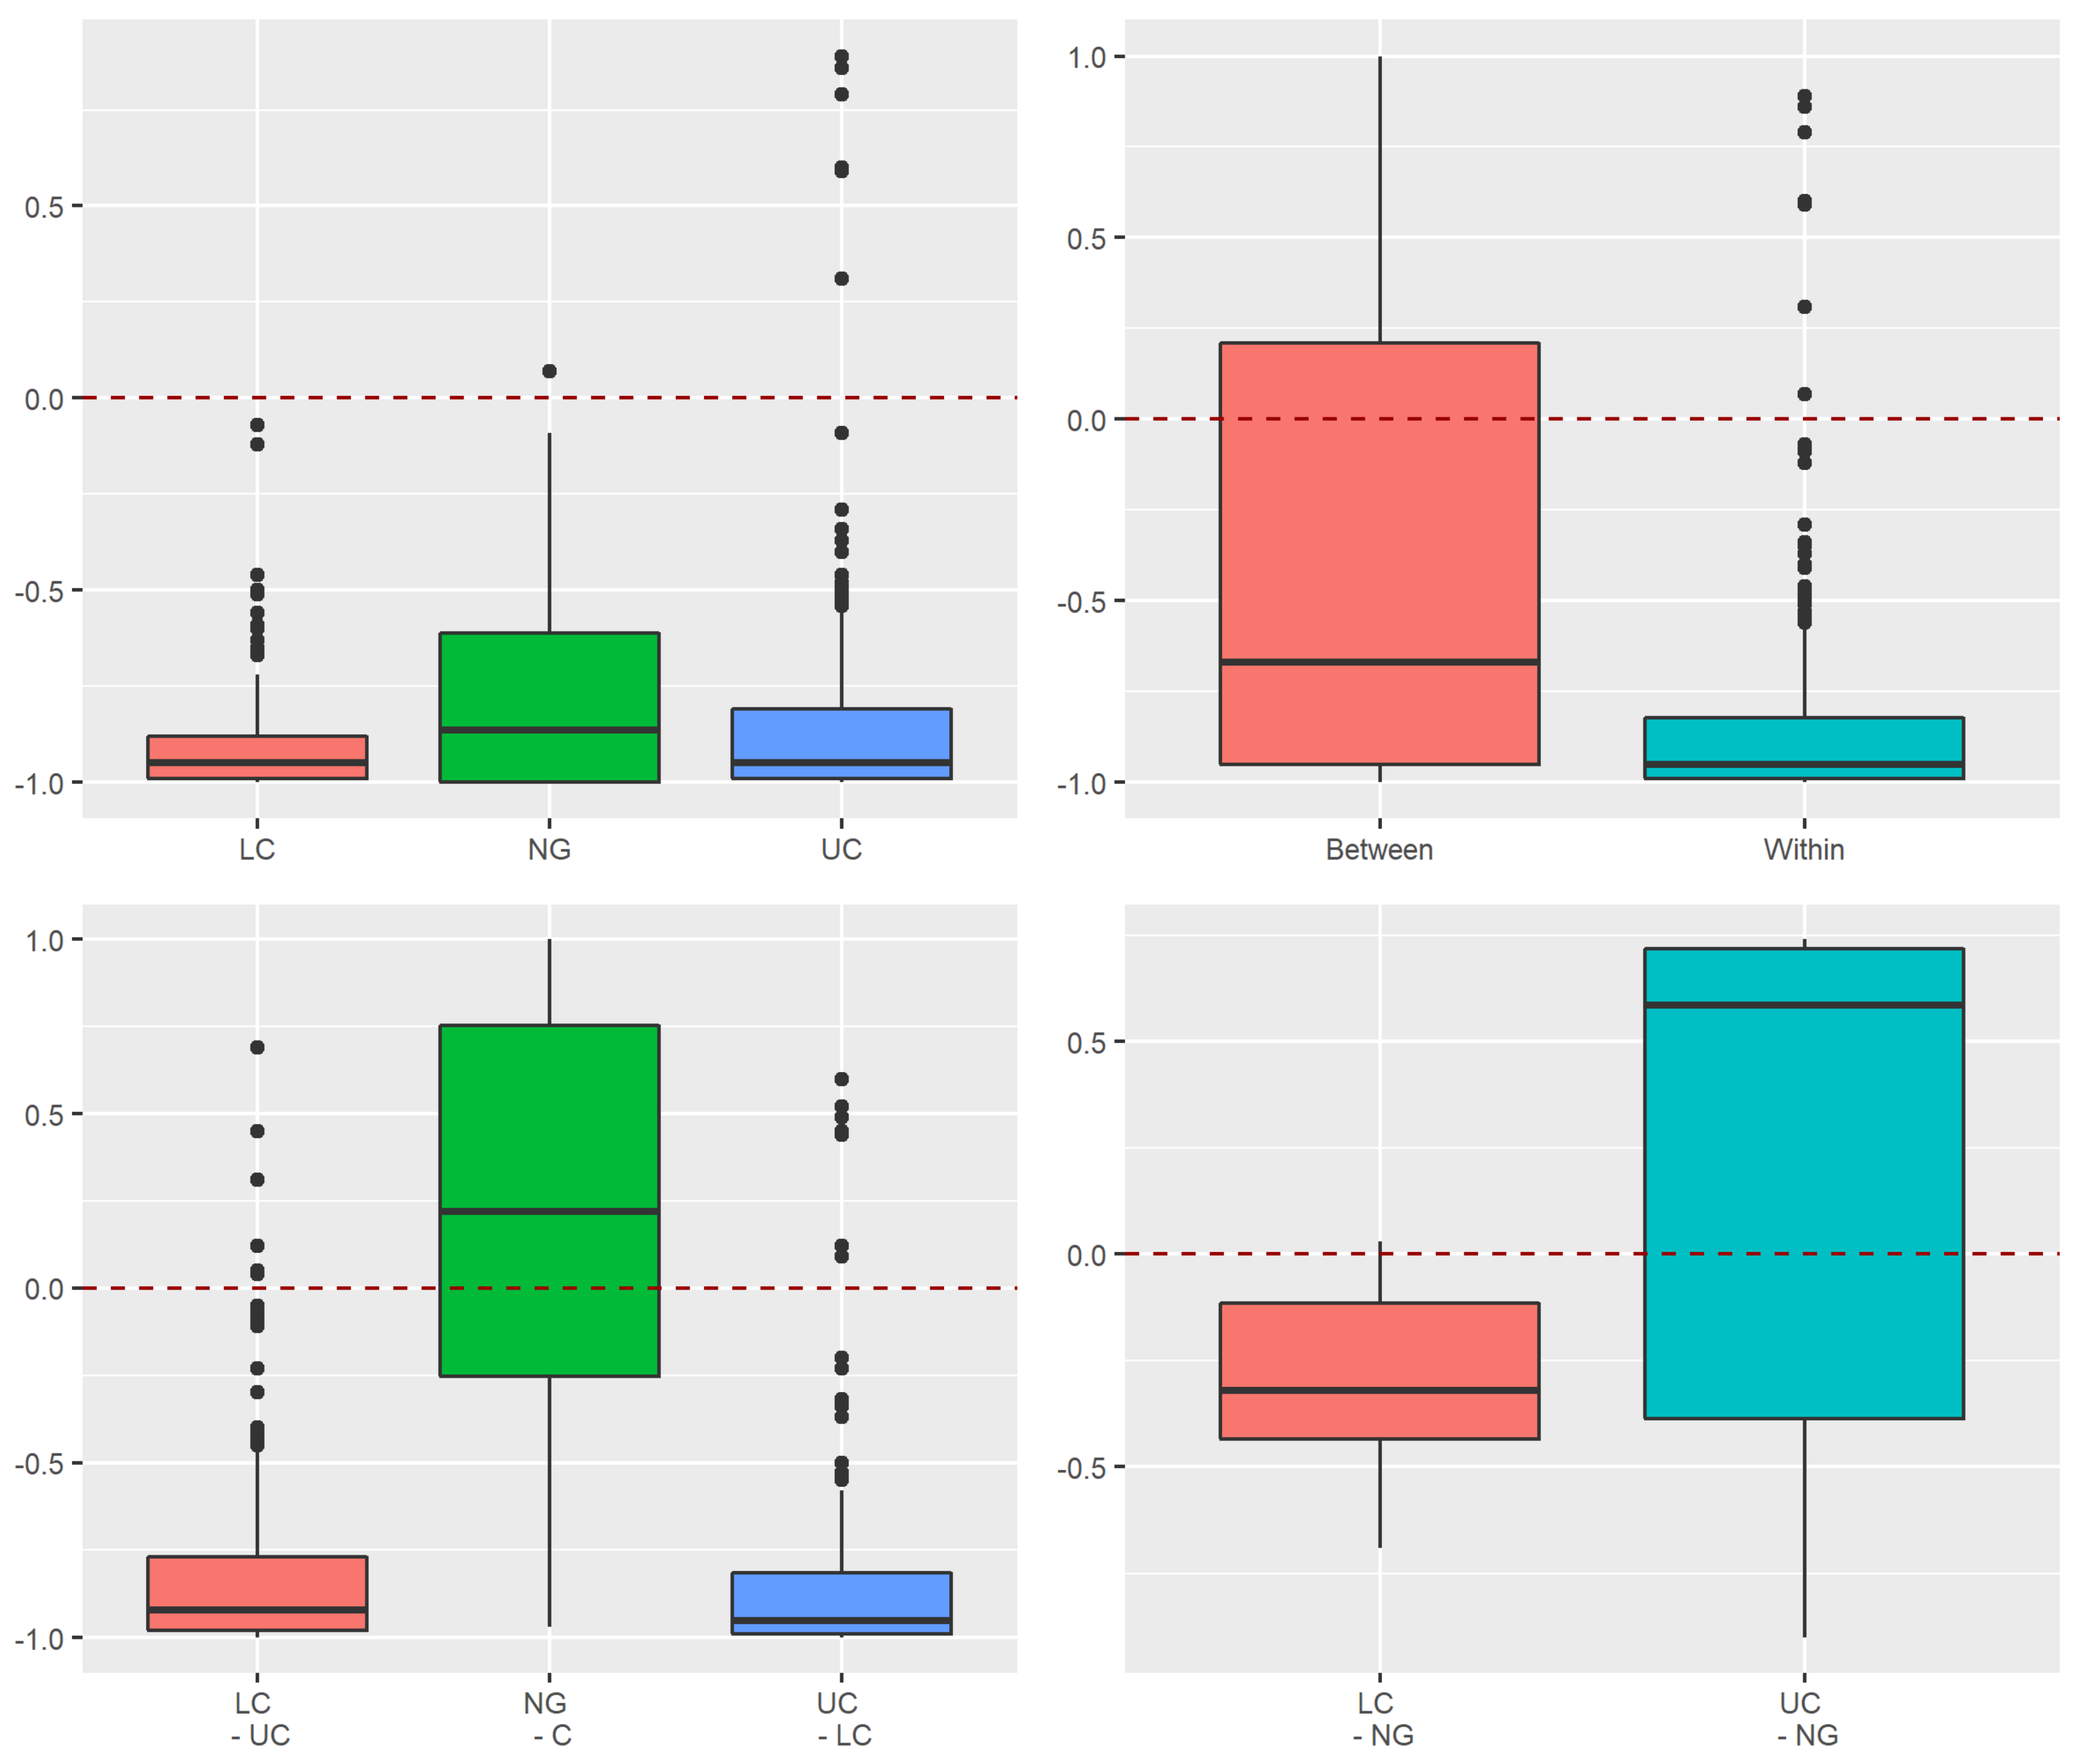
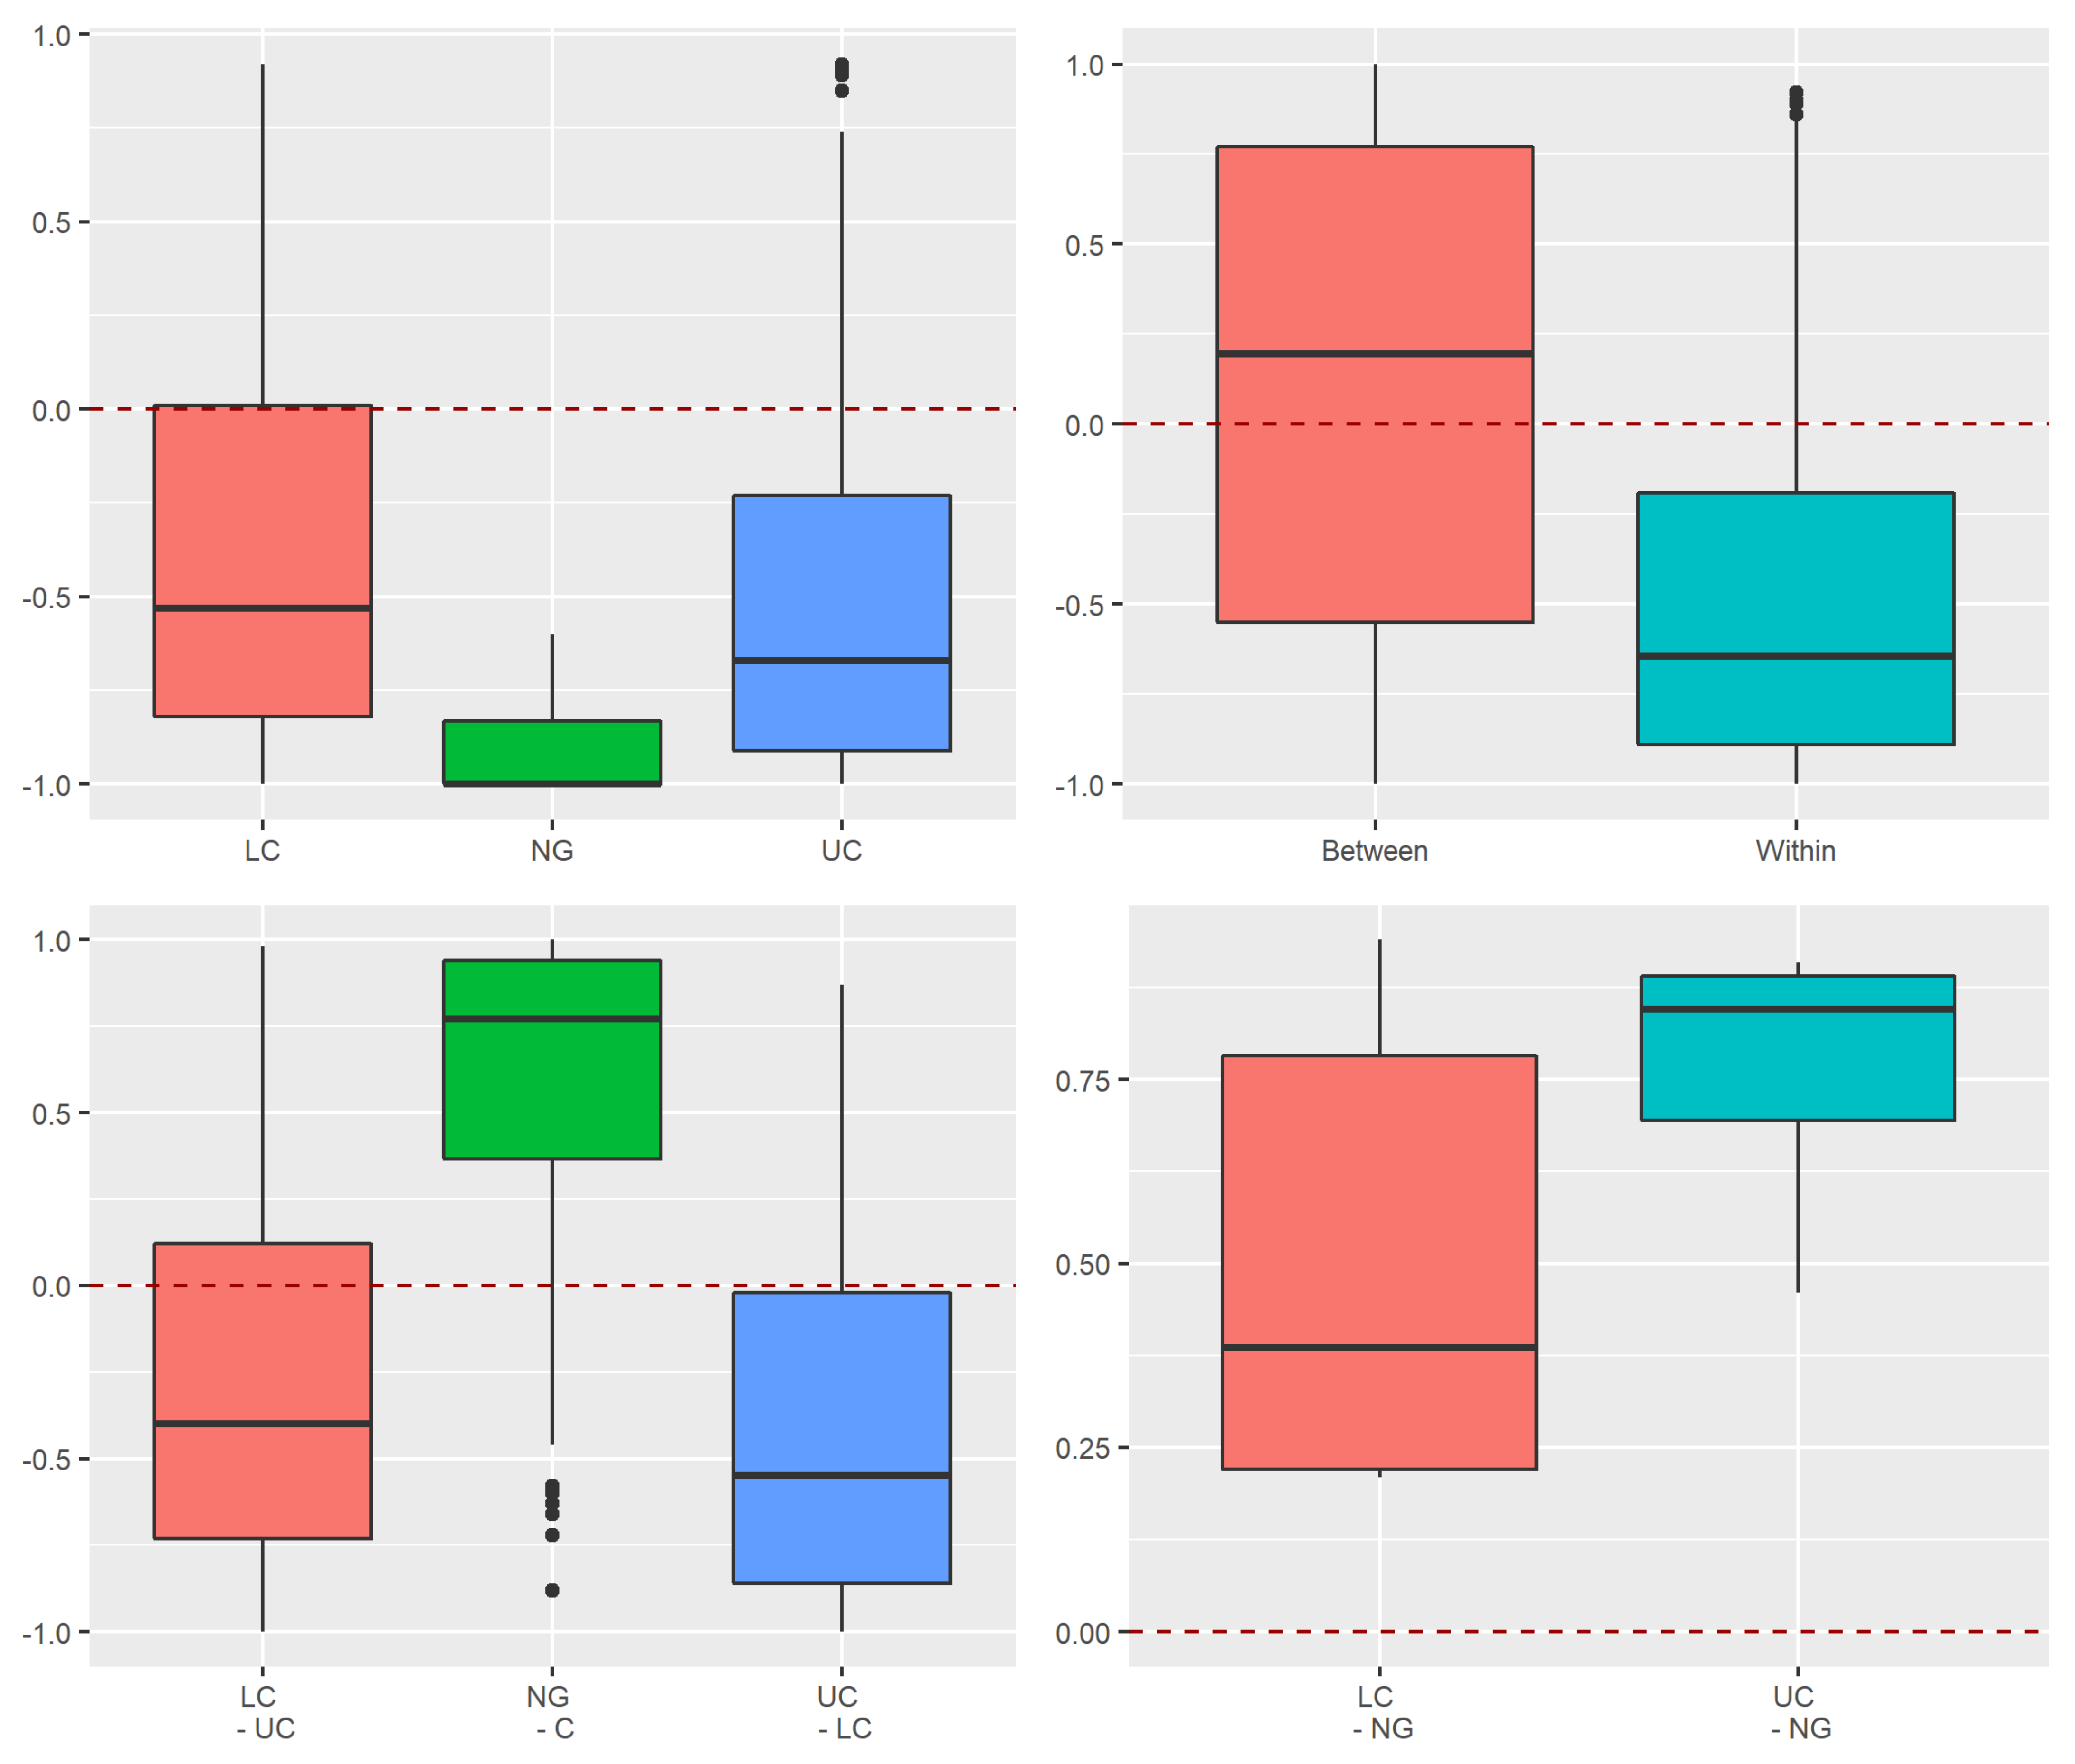
3.3.1. Assessment of Stochastic and Deterministic Processes of Trapwise Dissimilarity Using Raup–Crick Models
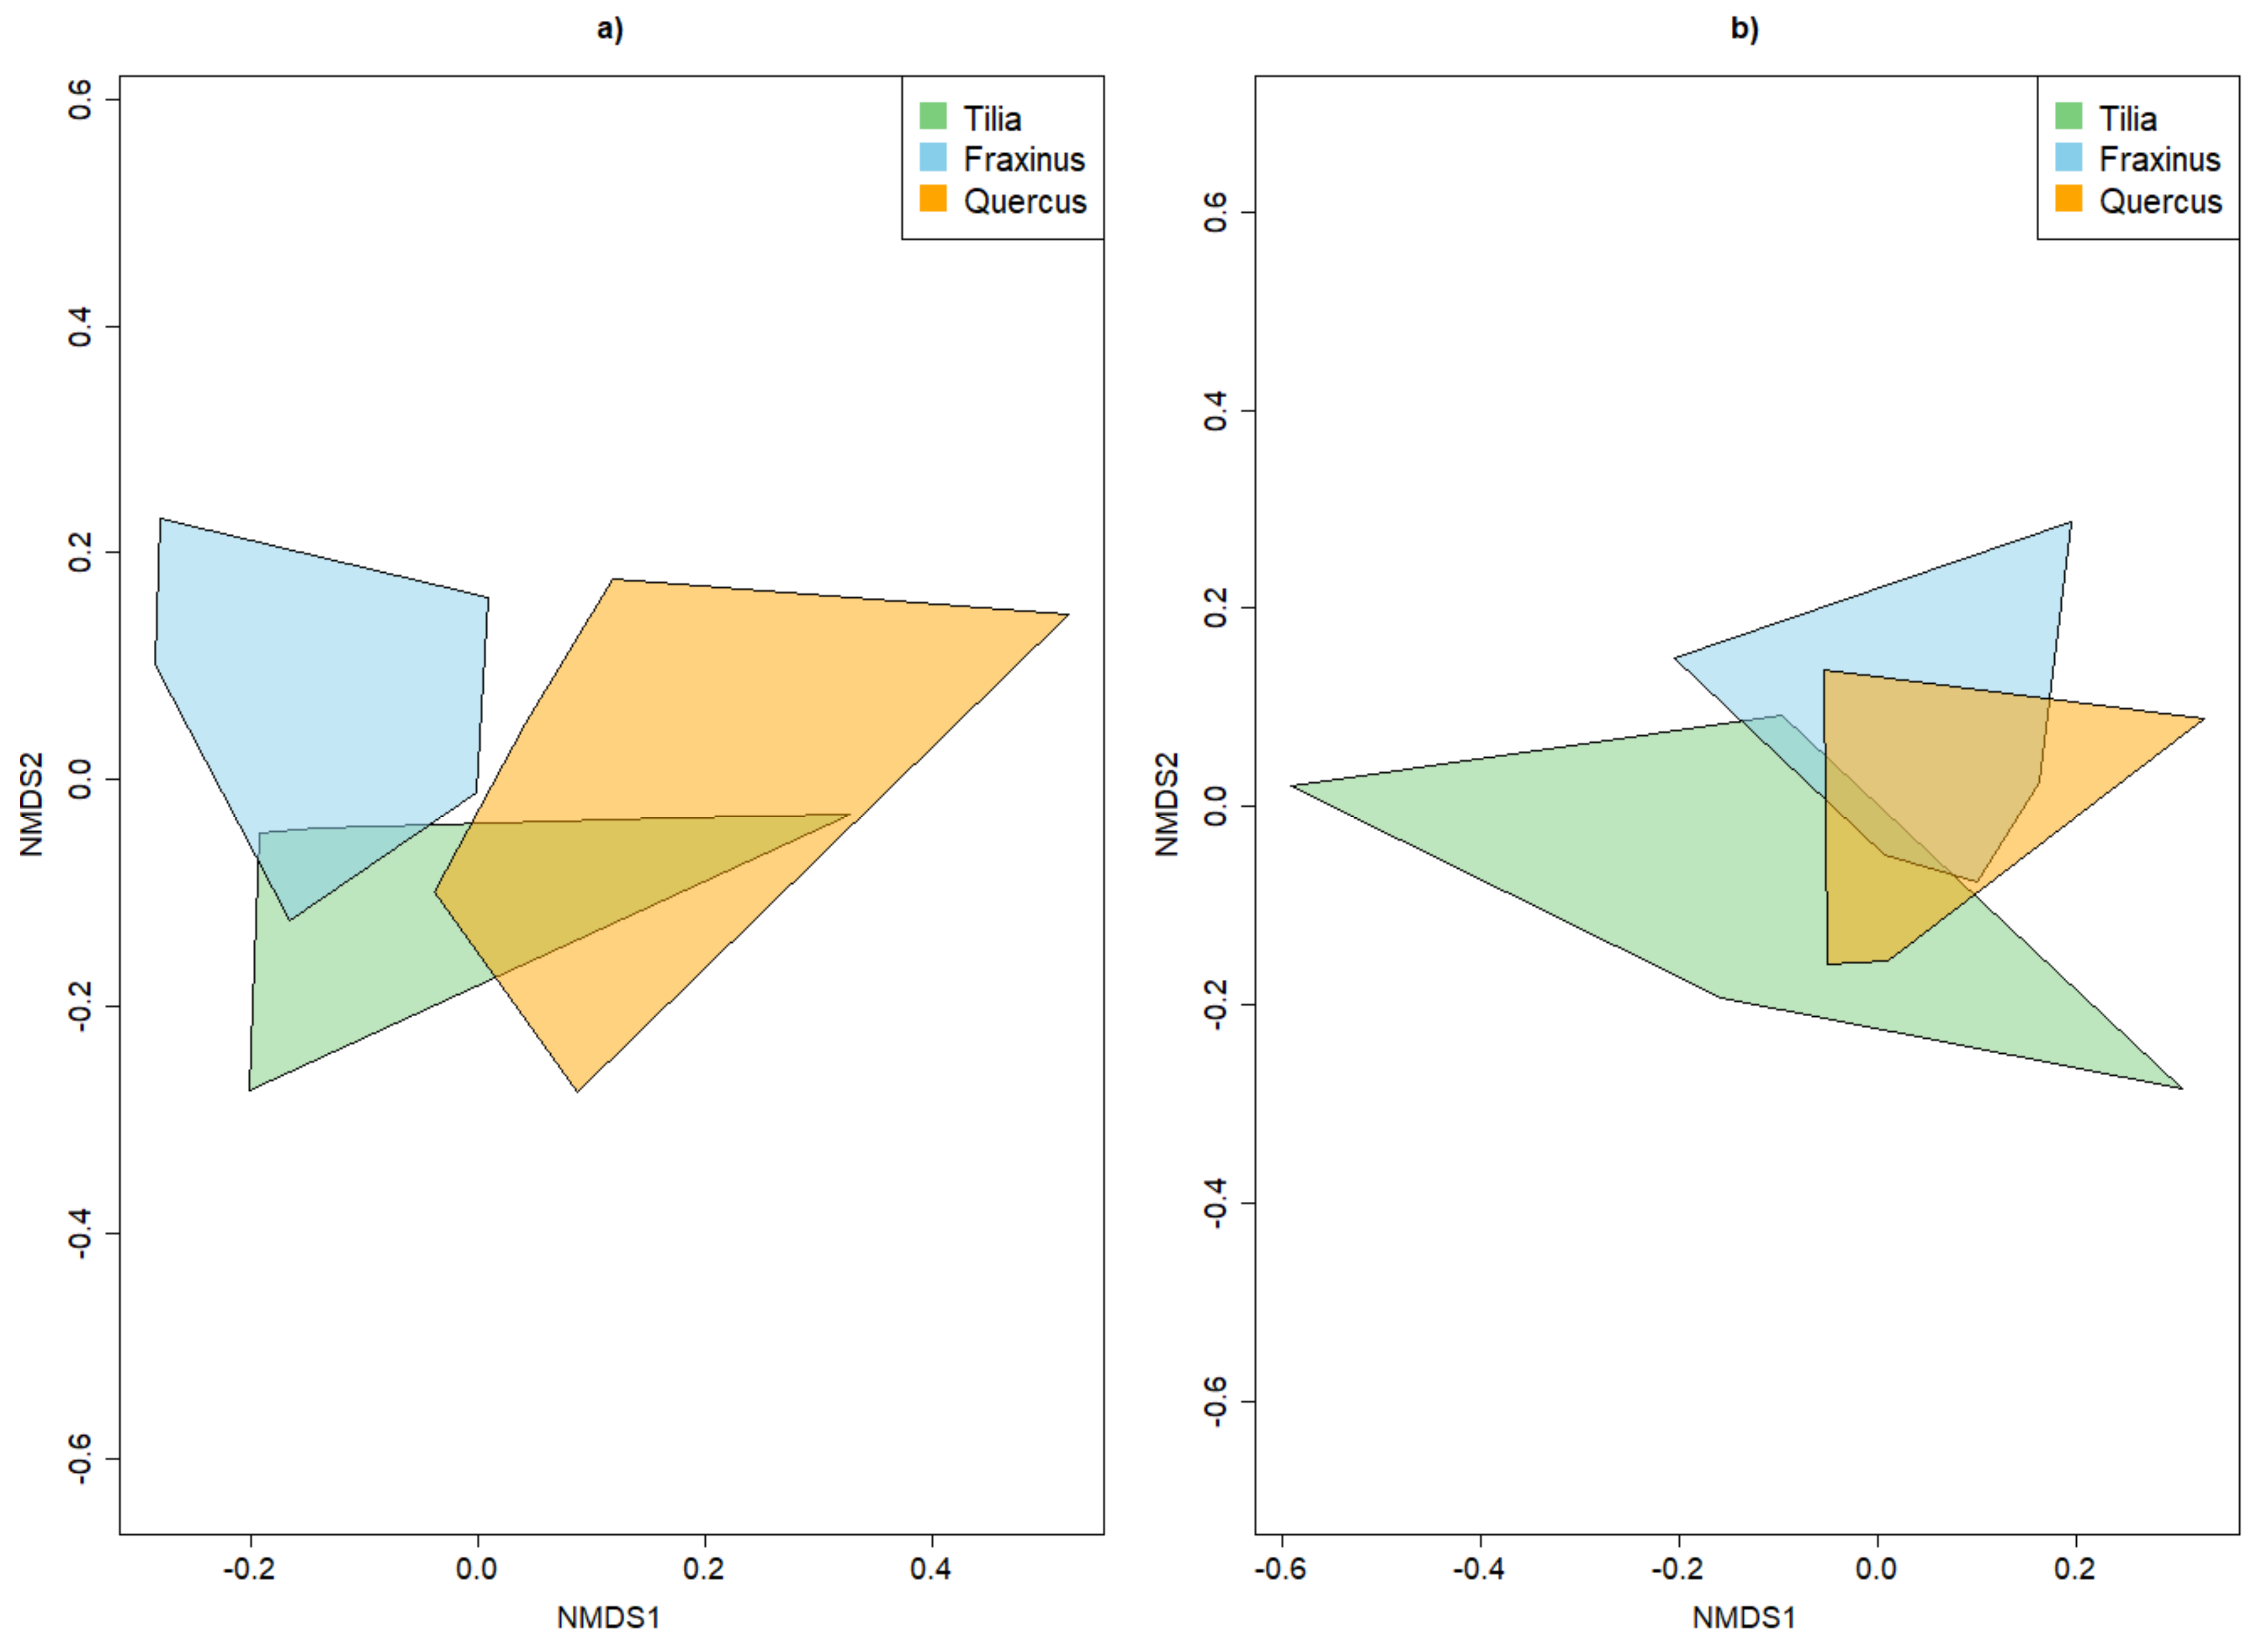
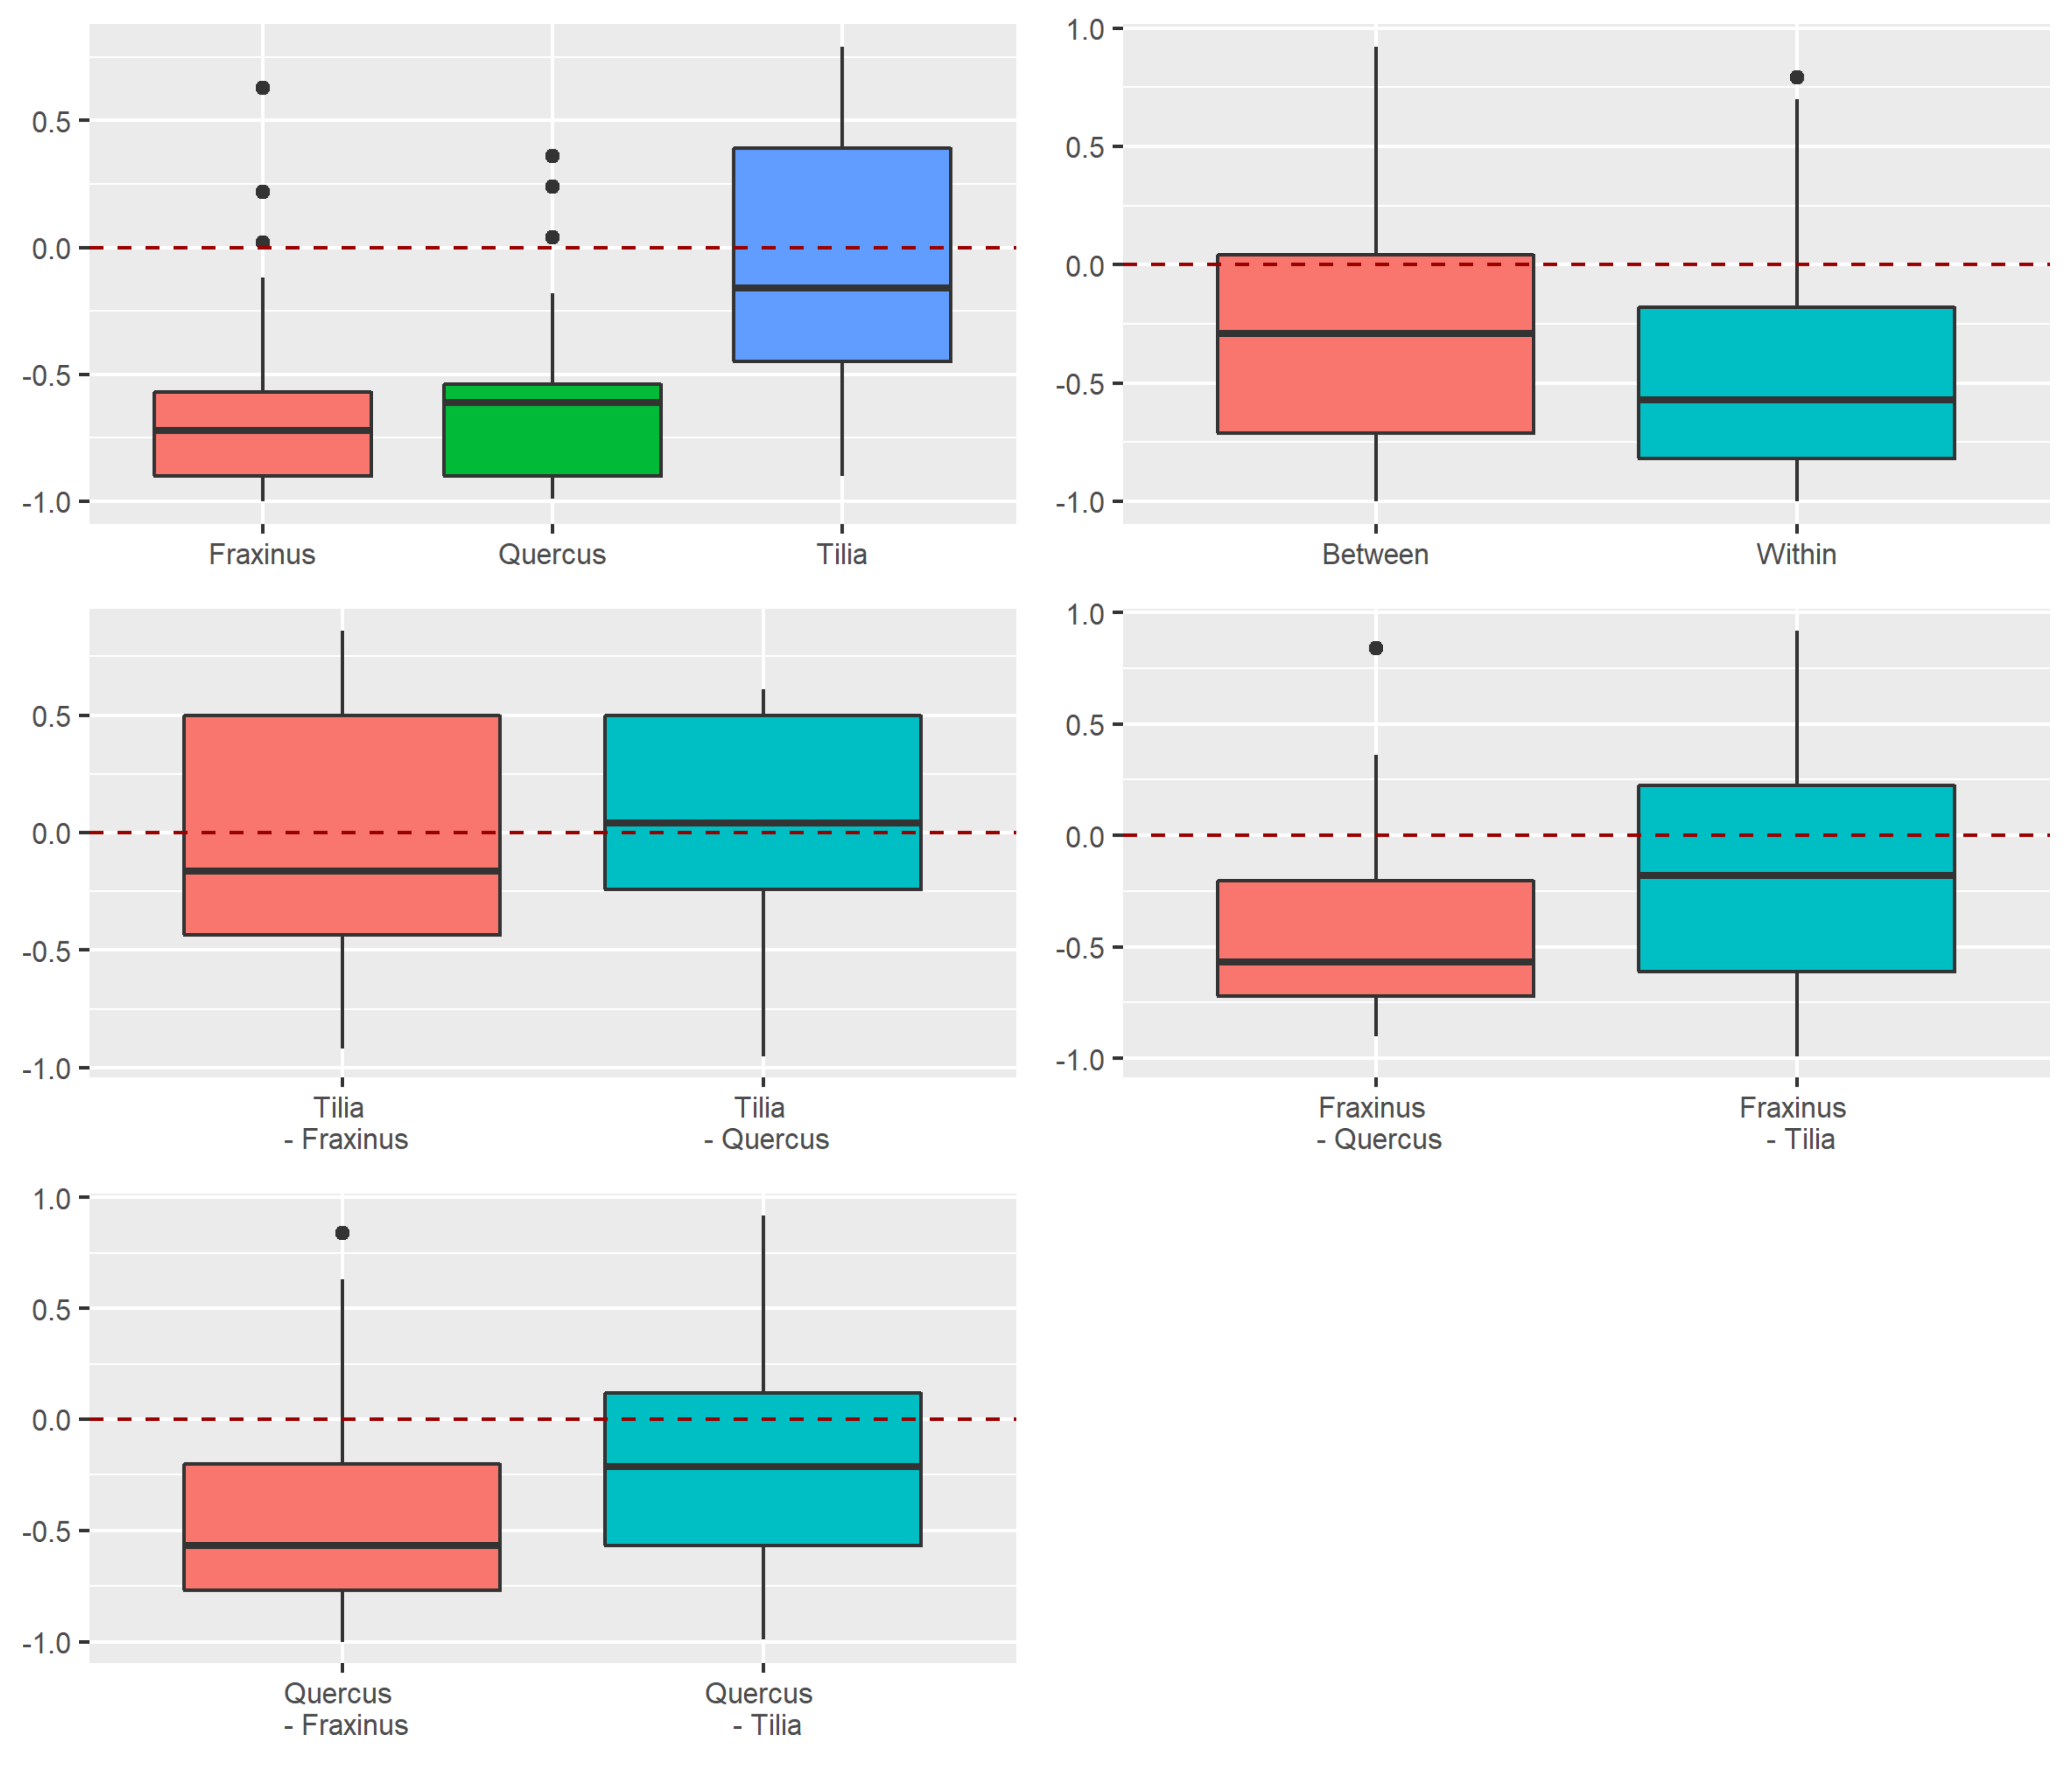
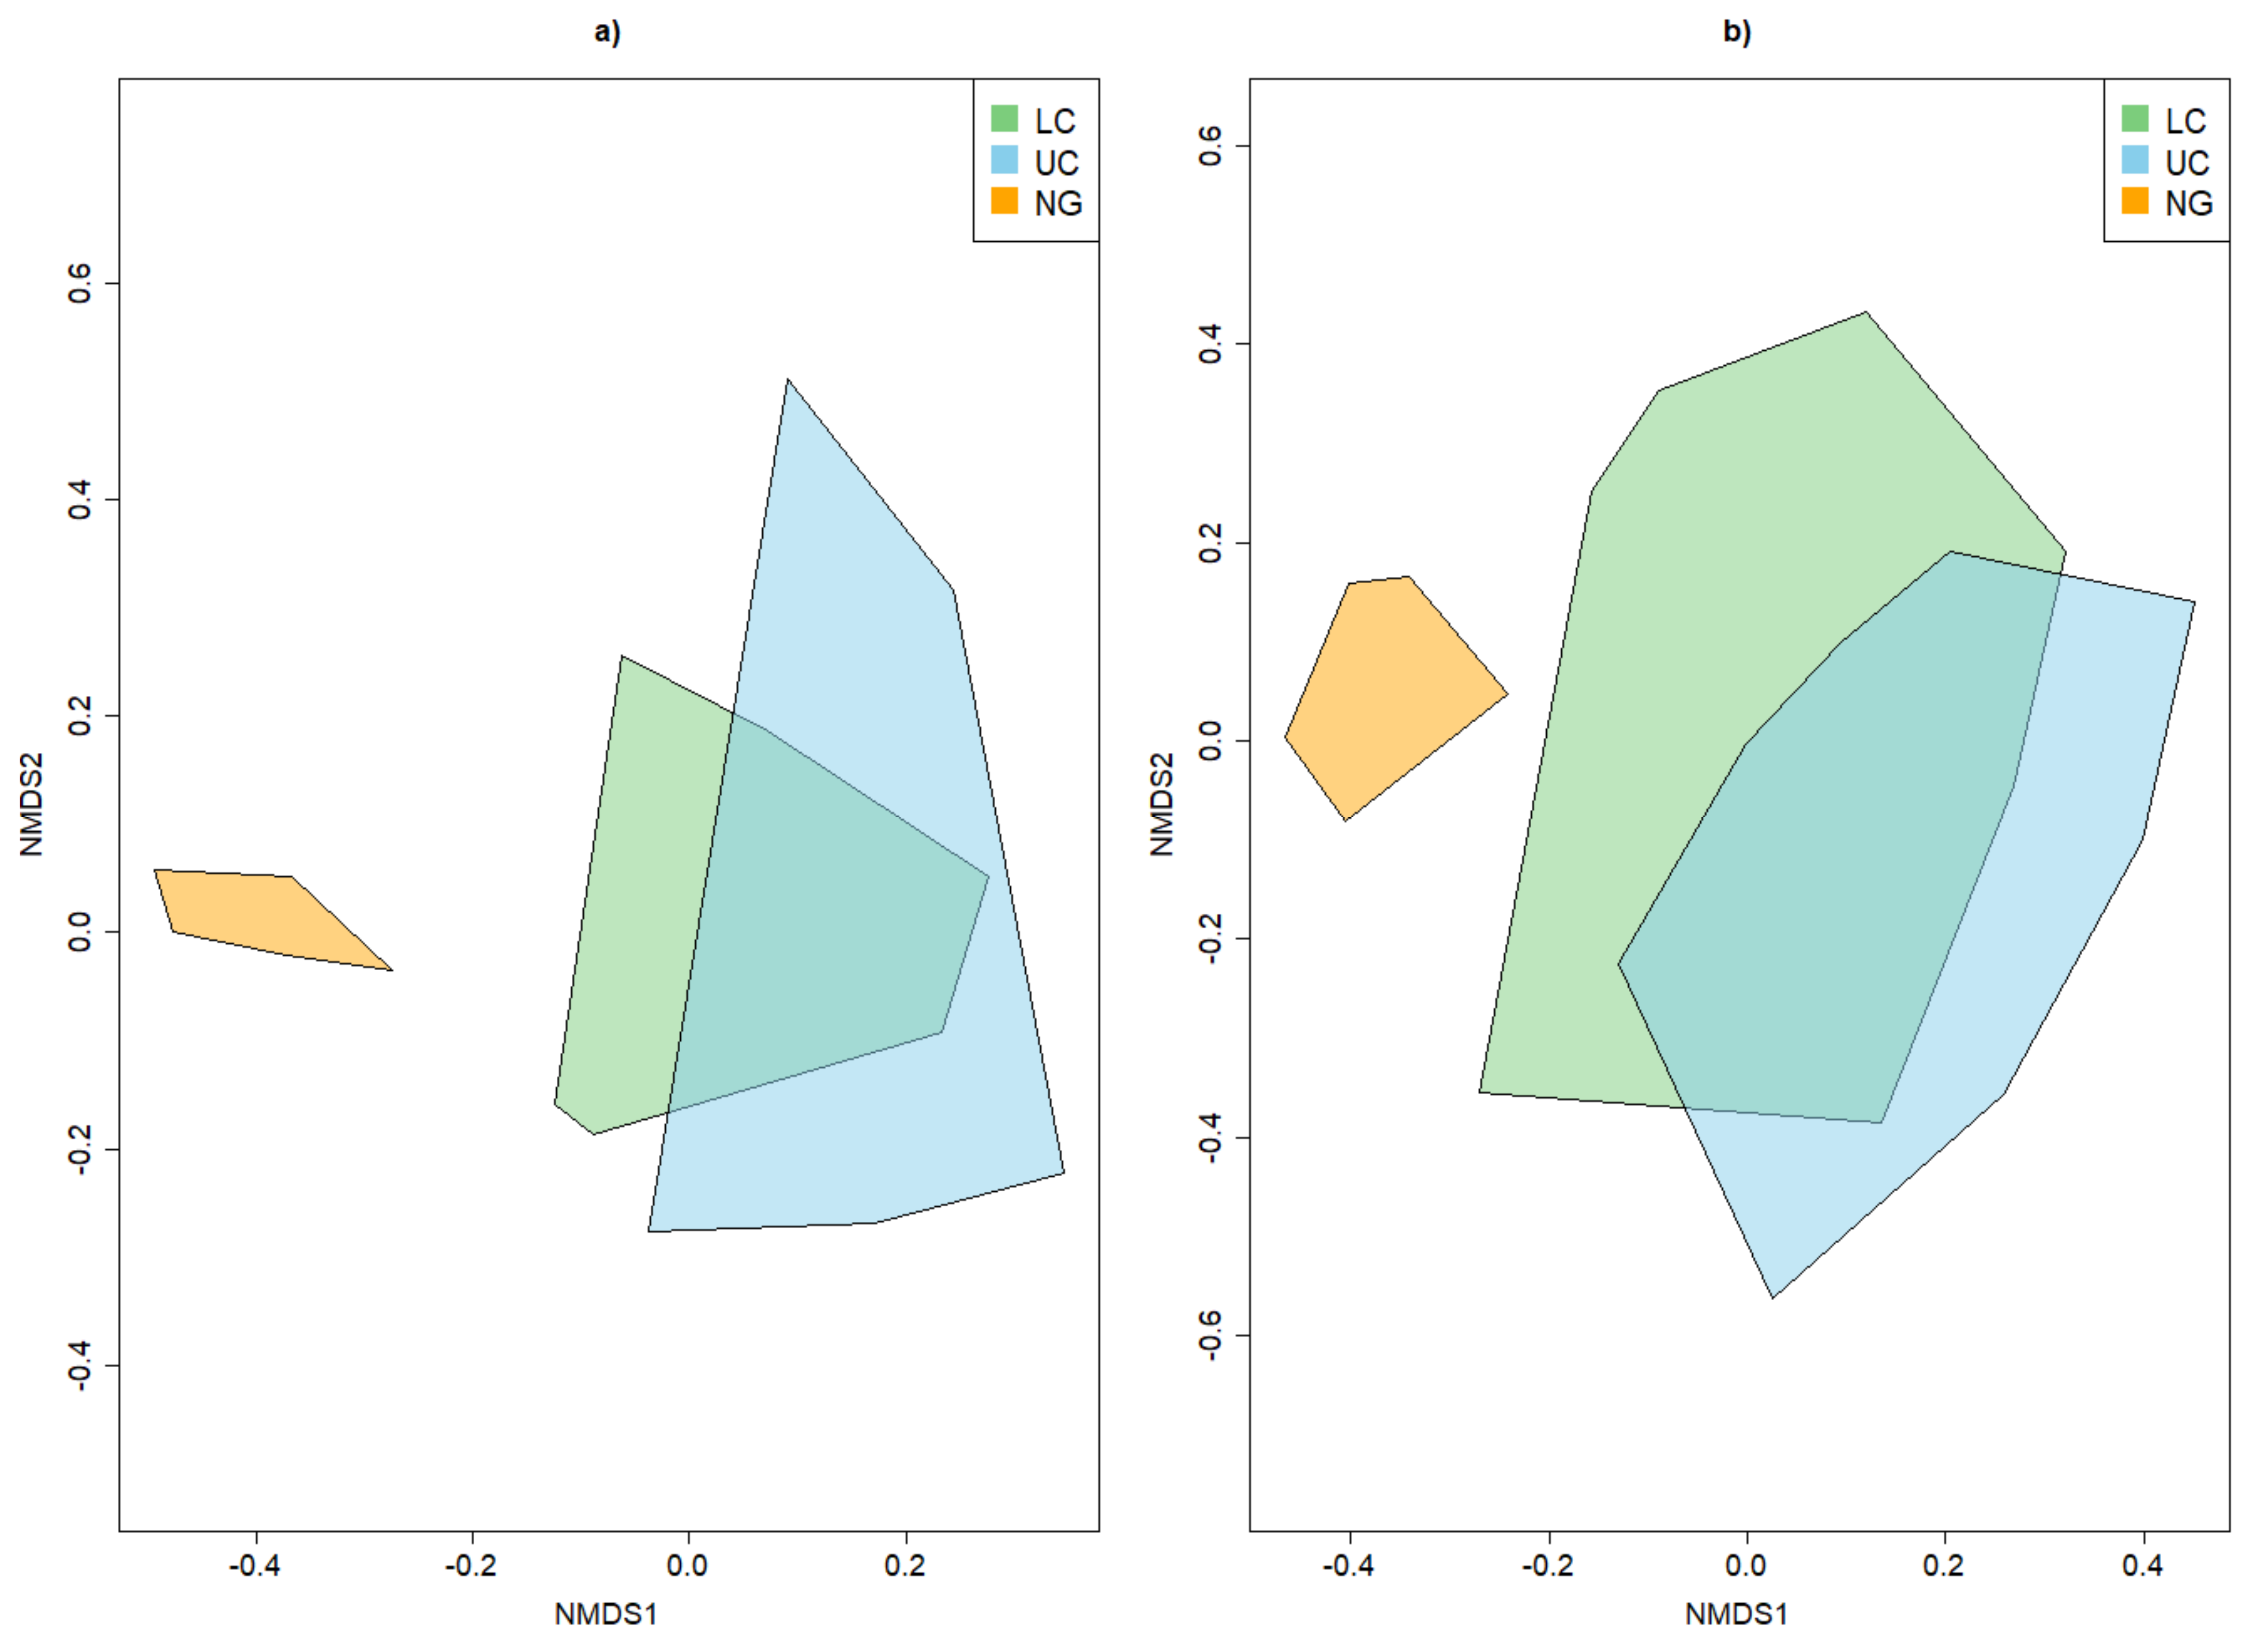
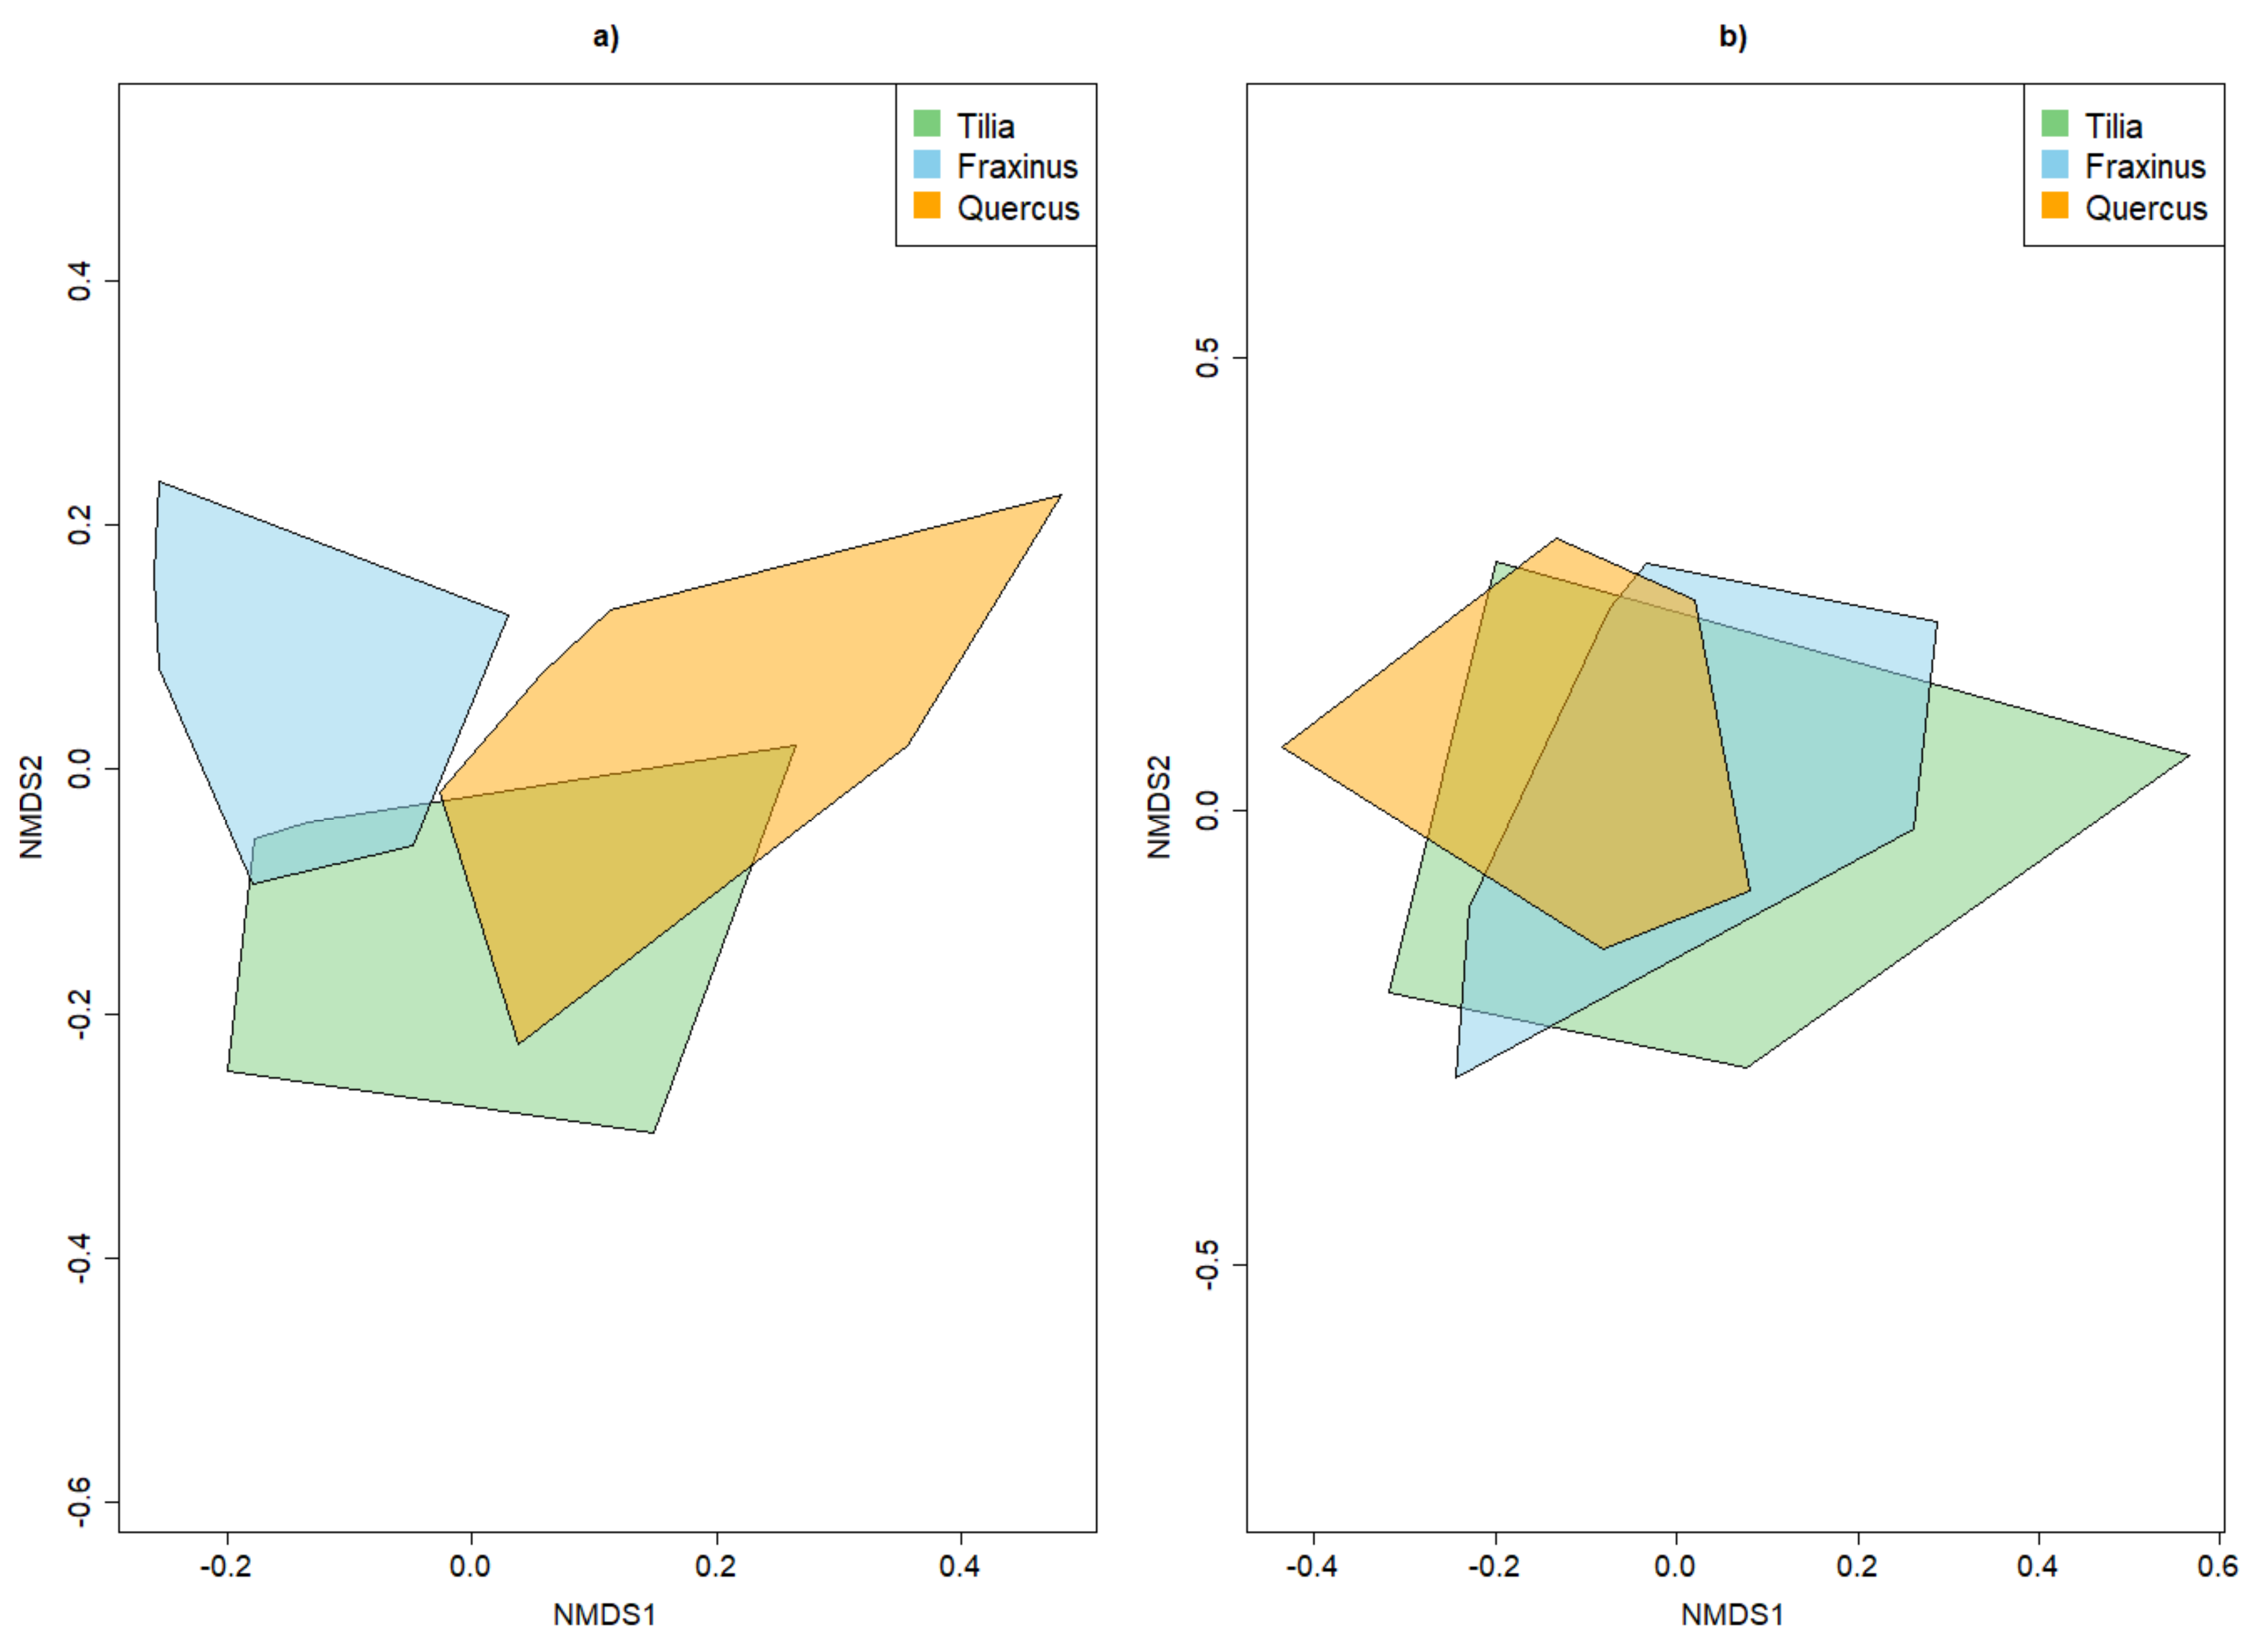
3.3.2. Dissimilarity between Strata and Tree Species
4. Discussion
4.1. Alpha and Beta Diversity between the Strata
4.2. Alpha and Beta Diversity between Tree Species
4.3. Beta Diversity Partitioning into Richness Differences and Replacement
5. Conclusions
Author Contributions
Funding
Institutional Review Board Statement
Informed Consent Statement
Data Availability Statement
Acknowledgments
Conflicts of Interest
Appendix A
Appendix A.1. Supplementary Graphs for the Use of Red Lists for the Definition of Rarity
Appendix A.1.1. Categories of the Red List Used for the Present Analyses

| Category | Significance |
|---|---|
| 0 | Extinct |
| 1 | Threatened with extinction |
| 2 | Highly endangered |
| 3 | Endangered |
Appendix A.1.2. Replacement versus Richness Differences

Appendix A.1.3. Raup–Crick Analyses of Beta Diversity Differences


Appendix A.2. Supplementary Figures for the Use of Octaves as Definition of Rarity
Appendix A.2.1. Alpha Diversity


Appendix A.2.2. Replacement versus Richness Differences

Appendix A.2.3. Raup–Crick Analyses of Beta Diversity Differences


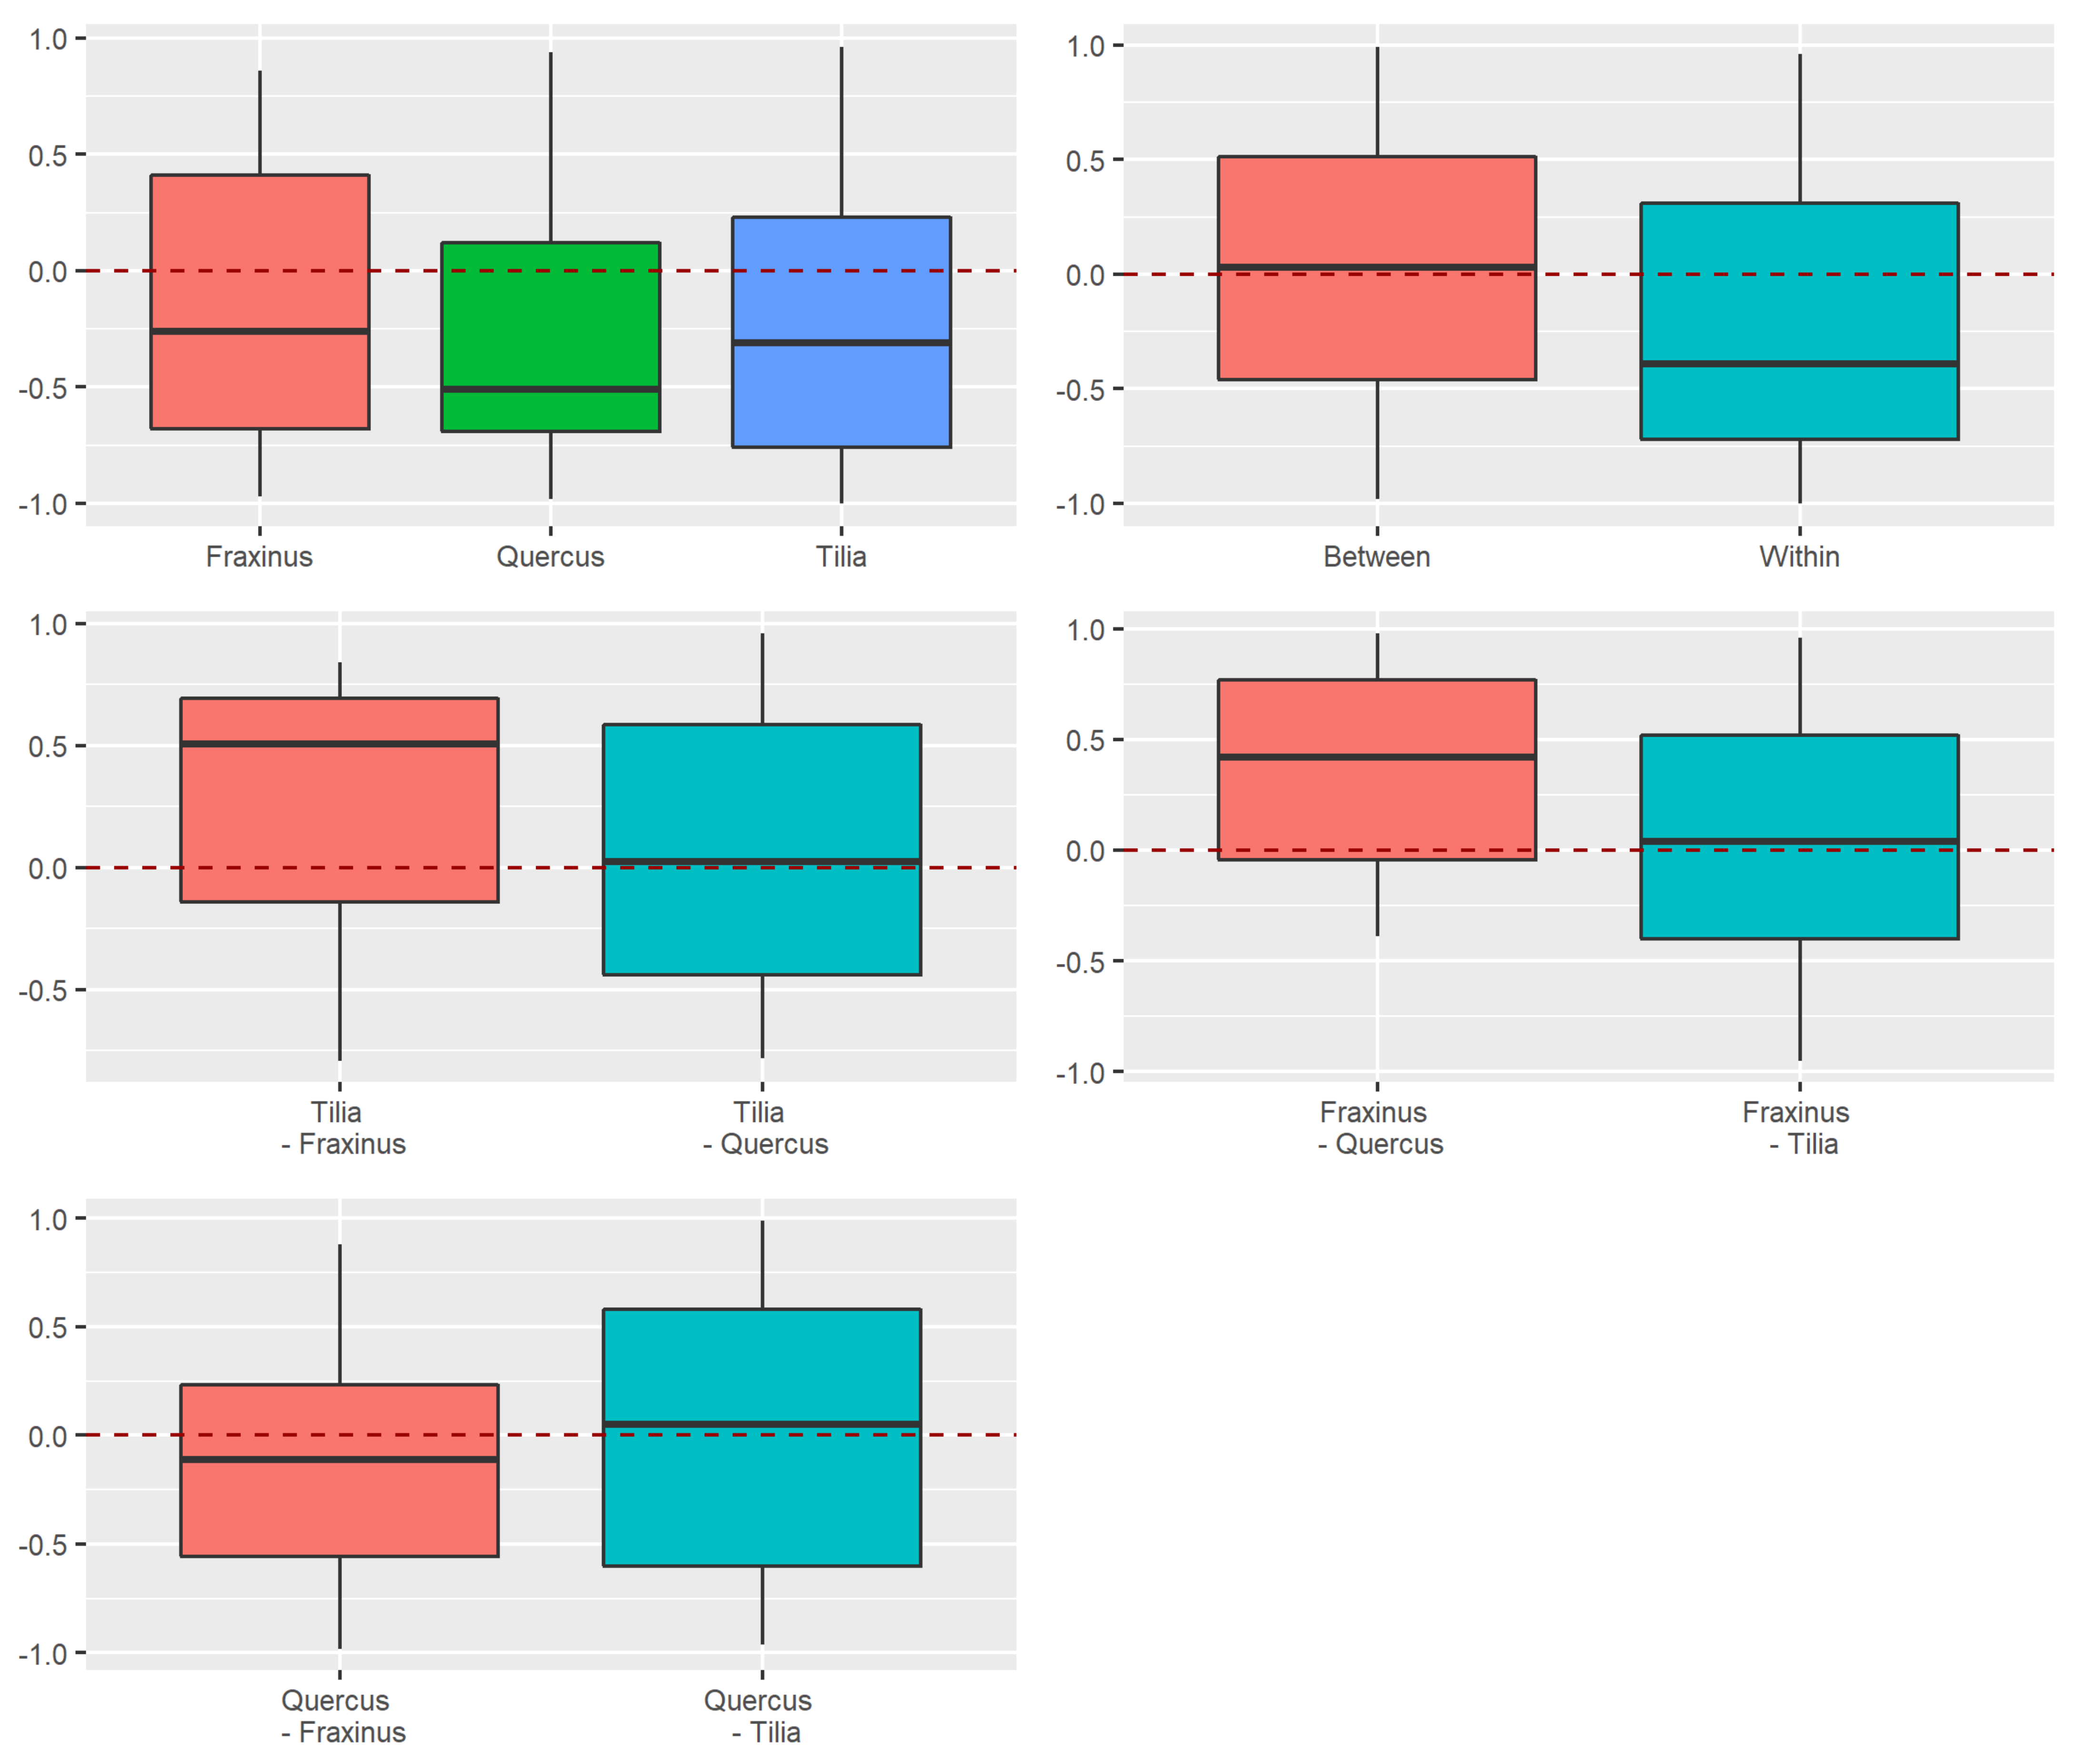
Appendix A.2.4. Dissimilarity between Strata and Tree Species


References
- Socolar, J.B.; Gilroy, J.J.; Kunin, W.E.; Edwards, D.P. How Should Beta-Diversity Inform Biodiversity Conservation? Trends Ecol. Evol. 2016, 31, 67–80. [Google Scholar] [CrossRef] [PubMed] [Green Version]
- Wiersma, Y.F.; Urban, D.L. Beta Diversity and Nature Reserve System Design in the Yukon, Canada. Conserv. Biol. 2005, 19, 1262–1272. [Google Scholar] [CrossRef] [Green Version]
- Hewitt, J.E.; Thrush, S.F.; Halliday, J.; Duffy, C. The Importance of Small-Scale Habitat Structure for Maintaining Beta Diversity. Ecology 2005, 86, 1619–1626. [Google Scholar] [CrossRef]
- Overton, J.M.; Barker, G.M.; Price, R. Estimating and conserving patterns of invertebrate diversity: A test case of New Zealand land snails. Divers. Distrib. 2009, 15, 731–741. [Google Scholar] [CrossRef]
- Ferrier, S. Mapping Spatial Pattern in Biodiversity for Regional Conservation Planning: Where to from Here? Syst. Biol. 2002, 51, 331–363. [Google Scholar] [CrossRef]
- Baskent, E.Z.; Jordan, G.A. Characterizing spatial structure of forest landscapes. Can. J. For. Res. 1995, 25, 1830–1849. [Google Scholar] [CrossRef]
- Gadow, K.V.; Zhang, C.Y.; Wehenkel, C.; Pommerening, A.; Corral-Rivas, J.; Korol, M.; Myklush, S.; Hui, G.Y.; Kiviste, A.; Zhao, X.H. Forest Structure and Diversity. In Continuous Cover Forestry, Managing Forest Ecosystems; Pukkala, T., von Gadow, K., Eds.; Springer Netherlands: Dordrecht, The Netherlands, 2012; Volume 23, pp. 29–83. ISBN 978-94-007-2201-9. [Google Scholar]
- Führer, E. Forest functions, ecosystem stability and management. For. Ecol. Manag. 2000, 132, 29–38. [Google Scholar] [CrossRef]
- Francis, C.M. Vertical stratification of fruit bats (Pteropodidae) in lowland dipterocarp rainforest in Malaysia. J. Trop. Ecol. 1994, 10, 523–530. [Google Scholar] [CrossRef]
- Gregorin, R.; Bernard, E.; Lobão, K.W.; Oliveira, L.F.; Machado, F.S.; Gil, B.B.; Tavares, V.D.C. Vertical stratification in bat assemblages of the Atlantic Forest of south-eastern Brazil. J. Trop. Ecol. 2017, 33, 299–308. [Google Scholar] [CrossRef]
- Pearson, D.L. Vertical Stratification of Birds in a Tropical Dry Forest. Ornithol. Appl. 1971, 73, 46–55. [Google Scholar] [CrossRef] [Green Version]
- Chmel, K.; Riegert, J.; Paul, L.; Novotny, V. Vertical stratification of an avian community in New Guinean tropical rainforest. Popul. Ecol. 2016, 58, 535–547. [Google Scholar] [CrossRef]
- Ulyshen, M.D.; Soon, V.; Hanula, J.L. On the vertical distribution of bees in a temperate deciduous forest. Insect Conserv. Divers. 2010, 3, 222–228. [Google Scholar] [CrossRef]
- Sobek, S.; Tscharntke, T.; Scherber, C.; Schiele, S.; Steffan-Dewenter, I. Canopy vs. understory: Does tree diversity affect bee and wasp communities and their natural enemies across forest strata? For. Ecol. Manag. 2009, 258, 609–615. [Google Scholar] [CrossRef]
- Aikens, K.R.; Buddle, C.M. Small-scale heterogeneity in temperate forest canopy arthropods: Stratification of spider and beetle assemblages. Can. Èntomol. 2012, 144, 526–537. [Google Scholar] [CrossRef]
- Stenchly, K.; Clough, Y.; Tscharntke, T. Spider species richness in cocoa agroforestry systems, comparing vertical strata, local management and distance to forest. Agric. Ecosyst. Environ. 2012, 149, 189–194. [Google Scholar] [CrossRef]
- Oguri, H.; Yoshida, T.; Nakamura, A.; Soga, M.; Hijii, N. Vertical stratification of spider assemblages in two conifer plantations in central Japan. J. Arachnol. 2014, 42, 34–43. [Google Scholar] [CrossRef]
- Grimbacher, P.S.; Stork, N.E. Vertical stratification of feeding guilds and body size in beetle assemblages from an Australian tropical rainforest. Austral. Ecol. 2007, 32, 77–85. [Google Scholar] [CrossRef]
- Maguire, D.Y.; Robert, K.; Brochu, K.; Larrivée, M.; Buddle, C.M.; Wheeler, T.A. Vertical Stratification of Beetles (Coleoptera) and Flies (Diptera) in Temperate Forest Canopies. Environ. Èntomol. 2014, 43, 9–17. [Google Scholar] [CrossRef]
- Weiss, M.; Procházka, J.; Schlaghamerský, J.; Cizek, L. Fine-Scale Vertical Stratification and Guild Composition of Saproxylic Beetles in Lowland and Montane Forests: Similar Patterns despite Low Faunal Overlap. PLoS ONE 2016, 11, e0149506. [Google Scholar] [CrossRef] [PubMed] [Green Version]
- Haack, N.; Grimm-Seyfarth, A.; Schlegel, M.; Wirth, C.; Bernhard, D.; Brunk, I.; Henle, K. Patterns of richness across forest beetle communities—A methodological comparison of observed and estimated species numbers. Ecol. Evol. 2020, 11, 626–635. [Google Scholar] [CrossRef]
- Ulyshen, M.D. Arthropod vertical stratification in temperate deciduous forests: Implications for conservation-oriented management. For. Ecol. Manag. 2011, 261, 1479–1489. [Google Scholar] [CrossRef]
- Vodka, Š.; Cizek, L. The effects of edge-interior and understorey-canopy gradients on the distribution of saproxylic beetles in a temperate lowland forest. For. Ecol. Manag. 2013, 304, 33–41. [Google Scholar] [CrossRef]
- Carbiener, R. Un exemple de type forestier exceptionnel pour l'Europe Occidentale: La forêt du lit majeur du Rhin au niveau du fossé Rhénan. (Fraxino-UlmetumOberd. 53) Intérêt écologique et Biogéographique. Comparaison à d'autres forêts thermophiles. Plant Ecol. 1970, 20, 97–148. [Google Scholar] [CrossRef]
- Schnitzler, A. European Alluvial Hardwood Forests of Large Floodplains. J. Biogeogr. 1994, 21, 605. [Google Scholar] [CrossRef]
- Schnitzler, A.; Hale, B.W.; Alsum, E. Biodiversity of floodplain forests in Europe and eastern North America: A comparative study of the Rhine and Mississippi Valleys. Biodivers. Conserv. 2005, 14, 97–117. [Google Scholar] [CrossRef]
- Horchler, P.J.; Morawetz, W. Canopy structure and its effect on canopy organisms: A general introduction and some first findings of the Leipzig Canopy Crane Project with special reference to vertical stratification. In Canopy Arthropod Research in Europe: Basic and Applied Studies from the High Frontier; Floren, A., Ed.; Bioform: Nürnberg, Germany, 2008; ISBN 9783935654012. [Google Scholar]
- Richter, R.; Hutengs, C.; Wirth, C.; Bannehr, L.; Vohland, M. Detecting Tree Species Effects on Forest Canopy Temperatures with Thermal Remote Sensing: The Role of Spatial Resolution. Remote Sens. 2021, 13, 135. [Google Scholar] [CrossRef]
- Otto, S.; Floren, A. The canopy spiders (Araneae) of the floodplain forest in Leipzig. Arachnol. Mitt. Arachnol. Lett. 2010, 39, 25–38. [Google Scholar] [CrossRef]
- Grove, S.J.; Stork, N.E. An inordinate fondness for beetles. Invertebr. Syst. 2000, 14, 733–739. [Google Scholar] [CrossRef] [Green Version]
- Stokland, J.N.; Siitonen, J.; Jonsson, B.G. Biodiversity in Dead Wood; Ecology, Biodiversity and Conservation; Cambridge University Press: Cambridge, NY, USA, 2012. [Google Scholar]
- Köhler, F. Nature Forests and Managed Forests. Comparative Studies of the Beetle Fauna (Coleoptera) in the Forest Reserve Kermeter (North Rhine Westfalia, Germany). 1996, 6. Available online: http://www.koehleroptera.de/publikationen/buecher/kermeter-summary.html (accessed on 15 December 2021).
- Borden, J.H.; Bennett, R.B. A Continously Recording Flight Mill for Investigating the Effect of Volatile Substances on the Flight of Tethered Insects. J. Econ. Èntomol. 1969, 62, 782–785. [Google Scholar] [CrossRef]
- Solbreck, C. Dispersal Distances of Migrating Pine Weevils, Hylobius Abietis, Coleoptera: Curculionidae. Èntomol. Exp. Et Appl. 1980, 28, 123–131. [Google Scholar] [CrossRef]
- Jonsell, M.; Schroeder, M.; Larsson, T. The saproxylic beetleBolitophagus reticulatus: Its frequency in managed forests, attraction to volatiles and flight period. Ecography 2003, 26, 421–428. [Google Scholar] [CrossRef]
- David, G.; Giffard, B.; Piou, D.; Jactel, H. Dispersal capacity of Monochamus galloprovincialis, the European vector of the pine wood nematode, on flight mills. J. Appl. Èntomol. 2014, 138, 566–576. [Google Scholar] [CrossRef]
- Jonsson, M.; Johannesen, J.; Seitz, A. Comparative Genetic Structure of the Threatened Tenebrionid Beetle Oplocephala haemorrhoidalis and its Common Relative Bolitophagus reticulatus. J. Insect Conserv. 2003, 7, 111–124. [Google Scholar] [CrossRef]
- Drag, L.; Hauck, D.; Bérces, S.; Michalcewicz, J.; Jelaska, L.Š.; Aurenhammer, S.; Cizek, L. Genetic differentiation of populations of the threatened saproxylic beetle Rosalia longicorn, Rosalia alpina (Coleoptera: Cerambycidae) in Central and South-east Europe. Biol. J. Linn. Soc. 2015, 116, 911–925. [Google Scholar] [CrossRef] [Green Version]
- Irmler, U.; Arp, H.; Nötzold, R. Species richness of saproxylic beetles in woodlands is affected by dispersion ability of species, age and stand size. J. Insect Conserv. 2010, 14, 227–235. [Google Scholar] [CrossRef]
- Müller, J.; Wende, B.; Strobl, C.; Eugster, M.; Gallenberger, I.; Floren, A.; Steffan-Dewenter, I.; Linsenmair, K.E.; Weisser, W.W.; Gossner, M.M. Forest management and regional tree composition drive the host preference of saproxylic beetle communities. J. Appl. Ecol. 2015, 52, 753–762. [Google Scholar] [CrossRef] [Green Version]
- Hulcr, J.; Mogia, M.; Isua, B.; Novotny, V. Host specificity of ambrosia and bark beetles (Col., Curculionidae: Scolytinae and Platypodinae) in a New Guinea rainforest. Ecol. Èntomol. 2007, 32, 762–772. [Google Scholar] [CrossRef]
- Lennon, J.J.; Beale, C.M.; Reid, C.L.; Kent, M.; Pakeman, R.J. Are richness patterns of common and rare species equally well explained by environmental variables? Ecography 2011, 34, 529–539. [Google Scholar] [CrossRef]
- Deane, D.C.; Fordham, D.A.; He, F.; Bradshaw, C.J.A. Diversity patterns of seasonal wetland plant communities mainly driven by rare terrestrial species. Biodivers. Conserv. 2016, 25, 1569–1585. [Google Scholar] [CrossRef]
- Liu, Y.; Shen, Z.; Wang, Q.; Su, X.; Zhang, W.; Shrestha, N.; Xu, X.; Wang, Z. Determinants of richness patterns differ between rare and common species: Implications for Gesneriaceae conservation in China. Divers. Distrib. 2017, 23, 235–246. [Google Scholar] [CrossRef]
- Bregović, P.; Fišer, C.; Zagmajster, M. Contribution of rare and common species to subterranean species richness patterns. Ecol. Evol. 2019, 9, 11606–11618. [Google Scholar] [CrossRef] [PubMed] [Green Version]
- Gaston, K.J. Valuing Common Species. Science 2010, 327, 154–155. [Google Scholar] [CrossRef] [PubMed]
- Rabinowitz, D. Seven forms of rarity. In The Biological Aspects of Rare Plant Conservation; Synge, H., Ed.; Wiley: Chichester, UK, 1981. [Google Scholar]
- Gaston, K.J. What is rarity. In The Biology of Rarity; Kunin, W.E., Gaston, K.J., Eds.; Chapman & Hall: London, UK, 1997. [Google Scholar]
- Kondratyeva, G.A. Reconciling the Concepts and Measures of Diversity, Rarity and Originality in Ecology and Evolution. Biol. Rev. 2019, 94, 1317–1337. [Google Scholar] [CrossRef] [Green Version]
- Unterseher, M.; Morawetz, W.; Klotz, S.; Arndt, E. The Canopy of a Temperate Floodplain Forest. Results from Five Years of Research at the Leipzig Canopy Crane; Unterseher, M., Morawetz, W., Klotz, S., Arndt, E., Eds.; Merkur Druck: Leipzig, Germany, 2007. [Google Scholar]
- Scholz, M.; Seele, C.; Engelmann, R.A.; Hartmann, T.; Heinrich, J.; Henle, K.; Herkelrath, A.; Kasperidus, H.D.; Kirsten, F.; Löffler, F.; et al. Das Projekt Lebendige Luppe—Ein Beitrag zur Renaturierung der Leipziger Nord-West-Aue. Auenmagazin 2018, 14, 14–21. [Google Scholar]
- Wilkening, A.J.; Foltz, J.L.; Atkinson, T.H.; Connor, M.D. An Omnidirectional Flight Trap for Ascending and Descending Insects. Can. Èntomol. 1981, 113, 453–455. [Google Scholar] [CrossRef] [Green Version]
- Monterrosa, A.; Acebes, A.L.; Blaauw, B.; Joseph, S.V. Effects of Trap, and Ethanol Lure Type and Age on Attraction of Ambrosia Beetles (Coleoptera: Curculionidae). J. Econ. Èntomol. 2021, 114, 1647–1654. [Google Scholar] [CrossRef]
- Geiser, R. Rote Liste der Käfer (Coleoptera). In Rote Liste Gefährdeter Tiere Deutschlands; Binot, M., Bless, R., Boye, P., Gruttke, H., Pretscher, P., Eds.; Schr.R. f. Landschaftspfl. u. Natursch: Bonn, Germany, 1998; pp. 168–230. [Google Scholar]
- Preston, F.W. The Commonness, and Rarity, of Species. Ecology 1948, 29, 254–283. [Google Scholar] [CrossRef]
- Gray, J.S.; Bjorgesaeter, A.; Ugland, K.I.; Bjørgesæter, A. On plotting species abundance distributions. J. Anim. Ecol. 2006, 75, 752–756. [Google Scholar] [CrossRef]
- Matthews, T.J.; Borregaard, M.K.; Ugland, K.I.; Borges, P.A.V.; Rigal, F.; Cardoso, P.; Whittaker, R.J. The gambin model provides a superior fit to species abundance distributions with a single free parameter: Evidence, implementation and interpretation. Ecography 2014, 37, 1002–1011. [Google Scholar] [CrossRef]
- Chao, A.; Gotelli, N.J.; Hsieh, T.C.; Sander, E.L.; Ma, K.H.; Colwell, R.K.; Ellison, A.M. Rarefaction and extrapolation with Hill numbers: A framework for sampling and estimation in species diversity studies. Ecol. Monogr. 2014, 84, 45–67. [Google Scholar] [CrossRef] [Green Version]
- Hsieh, T.C.; Ma, K.H.; Chao, A. iNEXT: Interpolation and Extrapolation for Species Diversity; 2020. Available online: https://cran.r-project.org/web/packages/iNEXT/iNEXT.pdf (accessed on 15 December 2021).
- Chao, A.; Ma, K.H.; Hsieh, T.C.; Chiu, C.H. SpadeR (Species-Richness Prediction and Diversity Estimation in R): An R Package in CRAN. Program and User’s Guide. Available online: http://chao.stat.nthu.edu.tw/blog/software-download2016 (accessed on 15 December 2021).
- Chao, A.; Chiu, C.-H. Bridging the variance and diversity decomposition approaches to beta diversity via similarity and differentiation measures. Methods Ecol. Evol. 2016, 7, 919–928. [Google Scholar] [CrossRef]
- Cardoso, P.; Rigal, F.; Carvalho, J.C. BAT—Biodiversity Assessment Tools, an R package for the measurement and estimation of alpha and beta taxon, phylogenetic and functional diversity. Methods Ecol. Evol. 2015, 6, 232–236. [Google Scholar] [CrossRef]
- Carvalho, J.C.; Cardoso, P.; Gomes, P. Determining the relative roles of species replacement and species richness differences in generating beta-diversity patterns. Glob. Ecol. Biogeogr. 2012, 21, 760–771. [Google Scholar] [CrossRef]
- Baselga, A. Partitioning the turnover and nestedness components of beta diversity. Glob. Ecol. Biogeogr. 2010, 19, 134–143. [Google Scholar] [CrossRef]
- Tonial, M.L.S.; Silva, H.L.R.; Tonial, L.J.; Costa, M.C.; Silva Júnior, N.J.; Diniz-Filho, J.A.F. Geographical patterns and partition of turnover and richness components of beta-diversity in faunas from Tocantins river valley. Braz. J. Biol. 2012, 72, 497–504. [Google Scholar] [CrossRef] [Green Version]
- Chase, J.M.; Kraft, N.J.B.; Smith, K.G.; Vellend, M.; Inouye, B.D. Using null models to disentangle variation in community dissimilarity from variation in α-diversity. Ecosphere 2011, 2, art24. [Google Scholar] [CrossRef]
- R Core Team R. A Language and Environment for Statistical Computing 2020. R Core Team R: Vienna, Austria, 2020. [Google Scholar]
- Antos, J.A. Understory plants in temperate forests. In Forests and Forest Plants; European Forest Institute research report; EOLSS Publications: Paris, France, 2009; Volume I, ISBN 1905839383. [Google Scholar]
- Preisser, E.; Smith, D.C.; Lowman, M.D. Canopy and ground level insect distribution in a temperate forest. Selbyana 1998, 19, 141–146. [Google Scholar]
- Kasperidus, H.D.; Klimo, E.; Müller, G.K.; Richter, W.; Sickert, A. The urban floodplain forest ecosystem of Leipzig. In The Floodplain Forests in Europe; Klimo, E., Hager, H., Eds.; European Forest Institute research report; Brill: Leiden, The Netherlands, 2001; ISBN 9004119582. [Google Scholar]
- Tanabe, S.-I. Between-forest variation in vertical stratification of drosophilid populations. Ecol. Èntomol. 2002, 27, 720–731. [Google Scholar] [CrossRef]
- Brändle, M.; Brandl, R. Species richness of insects and mites on trees: Expanding Southwood. J. Anim. Ecol. 2001, 70, 491–504. [Google Scholar] [CrossRef]
- Valencia-Cuevas, L.; Tovar-Sánchez, E. Oak canopy arthropod communities: Which factors shape its structure? Rev. Chil. De Hist. Nat. 2015, 88, 15. [Google Scholar] [CrossRef]
- Irmler, U.; Heller, K.; Warning, J. Age and Tree Species as Factors Influencing the Populations of Insects Living in Dead Wood (Coleoptera, Diptera: Sciaridae, Mycetophilidae). Pedobiologia 1996, 40, 134–148. [Google Scholar]
- Milberg, P.; Bergman, K.-O.; Johansson, H.; Jansson, N. Low host-tree preferences among saproxylic beetles: A comparison of four deciduous species. Insect Conserv. Divers. 2014, 7, 508–522. [Google Scholar] [CrossRef] [Green Version]
- Vogel, S.; Bussler, H.; Finnberg, S.; Müller, J.; Stengel, E.; Thorn, S. Diversity and conservation of saproxylic beetles in 42 European tree species: An experimental approach using early successional stages of branches. Insect Conserv. Divers. 2020, 14, 132–143. [Google Scholar] [CrossRef]
- Jonsell, M.; Weslien, J.; Ehnström, B. Substrate requirements of red-listed saproxylic invertebrates in Sweden. Biodivers. Conserv. 1998, 7, 749–764. [Google Scholar] [CrossRef]
- Weiss, M.; Didham, R.K.; Procházka, J.; Schlaghamerský, J.; Basset, Y.; Odegaard, F.; Tichechkin, A.; Schmidl, J.; Floren, A.; Curletti, G.; et al. Saproxylic beetles in tropical and temperate forests—A standardized comparison of vertical stratification patterns. For. Ecol. Manag. 2019, 444, 50–58. [Google Scholar] [CrossRef]
- Lennon, J.J.; Koleff, P.; Greenwood, J.J.D.; Gaston, K.J. Contribution of rarity and commonness to patterns of species richness. Ecol. Lett. 2004, 7, 81–87. [Google Scholar] [CrossRef]


| Rarity | Factor | Degree of Freedom | Sum of Squares | R-Squared | F Statistics | p-Value |
|---|---|---|---|---|---|---|
| Common | Stratum | 2 | 2.40 | 0.48 | 19.10 | 0.001 |
| Residual | 41 | 2.58 | 0.52 | |||
| Total | 43 | 4.99 | 1.00 | |||
| Rare | Stratum | 2 | 2.32 | 0.42 | 15.07 | 0.001 |
| Residual | 41 | 3.16 | 0.58 | |||
| Total | 43 | 5.49 | 1.00 | |||
| Common | TreeSp | 2 | 0.72 | 0.36 | 7.51 | 0.001 |
| Residual | 27 | 1.30 | 0.64 | |||
| Total | 29 | 2.02 | 1.00 | |||
| Rare | TreeSp | 2 | 0.51 | 0.19 | 3.25 | 0.003 |
| Residual | 27 | 2.13 | 0.81 | |||
| Total | 29 | 3.00 | 1.00 |
Publisher’s Note: MDPI stays neutral with regard to jurisdictional claims in published maps and institutional affiliations. |
© 2022 by the authors. Licensee MDPI, Basel, Switzerland. This article is an open access article distributed under the terms and conditions of the Creative Commons Attribution (CC BY) license (https://creativecommons.org/licenses/by/4.0/).
Share and Cite
Haack, N.; Borges, P.A.V.; Grimm-Seyfarth, A.; Schlegel, M.; Wirth, C.; Bernhard, D.; Brunk, I.; Henle, K.; Pereira, H.M. Response of Common and Rare Beetle Species to Tree Species and Vertical Stratification in a Floodplain Forest. Insects 2022, 13, 161. https://doi.org/10.3390/insects13020161
Haack N, Borges PAV, Grimm-Seyfarth A, Schlegel M, Wirth C, Bernhard D, Brunk I, Henle K, Pereira HM. Response of Common and Rare Beetle Species to Tree Species and Vertical Stratification in a Floodplain Forest. Insects. 2022; 13(2):161. https://doi.org/10.3390/insects13020161
Chicago/Turabian StyleHaack, Nora, Paulo A. V. Borges, Annegret Grimm-Seyfarth, Martin Schlegel, Christian Wirth, Detlef Bernhard, Ingo Brunk, Klaus Henle, and Henrique M. Pereira. 2022. "Response of Common and Rare Beetle Species to Tree Species and Vertical Stratification in a Floodplain Forest" Insects 13, no. 2: 161. https://doi.org/10.3390/insects13020161