
Within-Plant Distribution of Two-Spotted Spider Mites, Tetranychus urticae Koch (Acari: Tetranychidae), on Strawberries: Decision of an Optimal Sampling Unit

Abstract
:Simple Summary
Abstract
1. Introduction
2. Materials and Methods
2.1. Study Sites
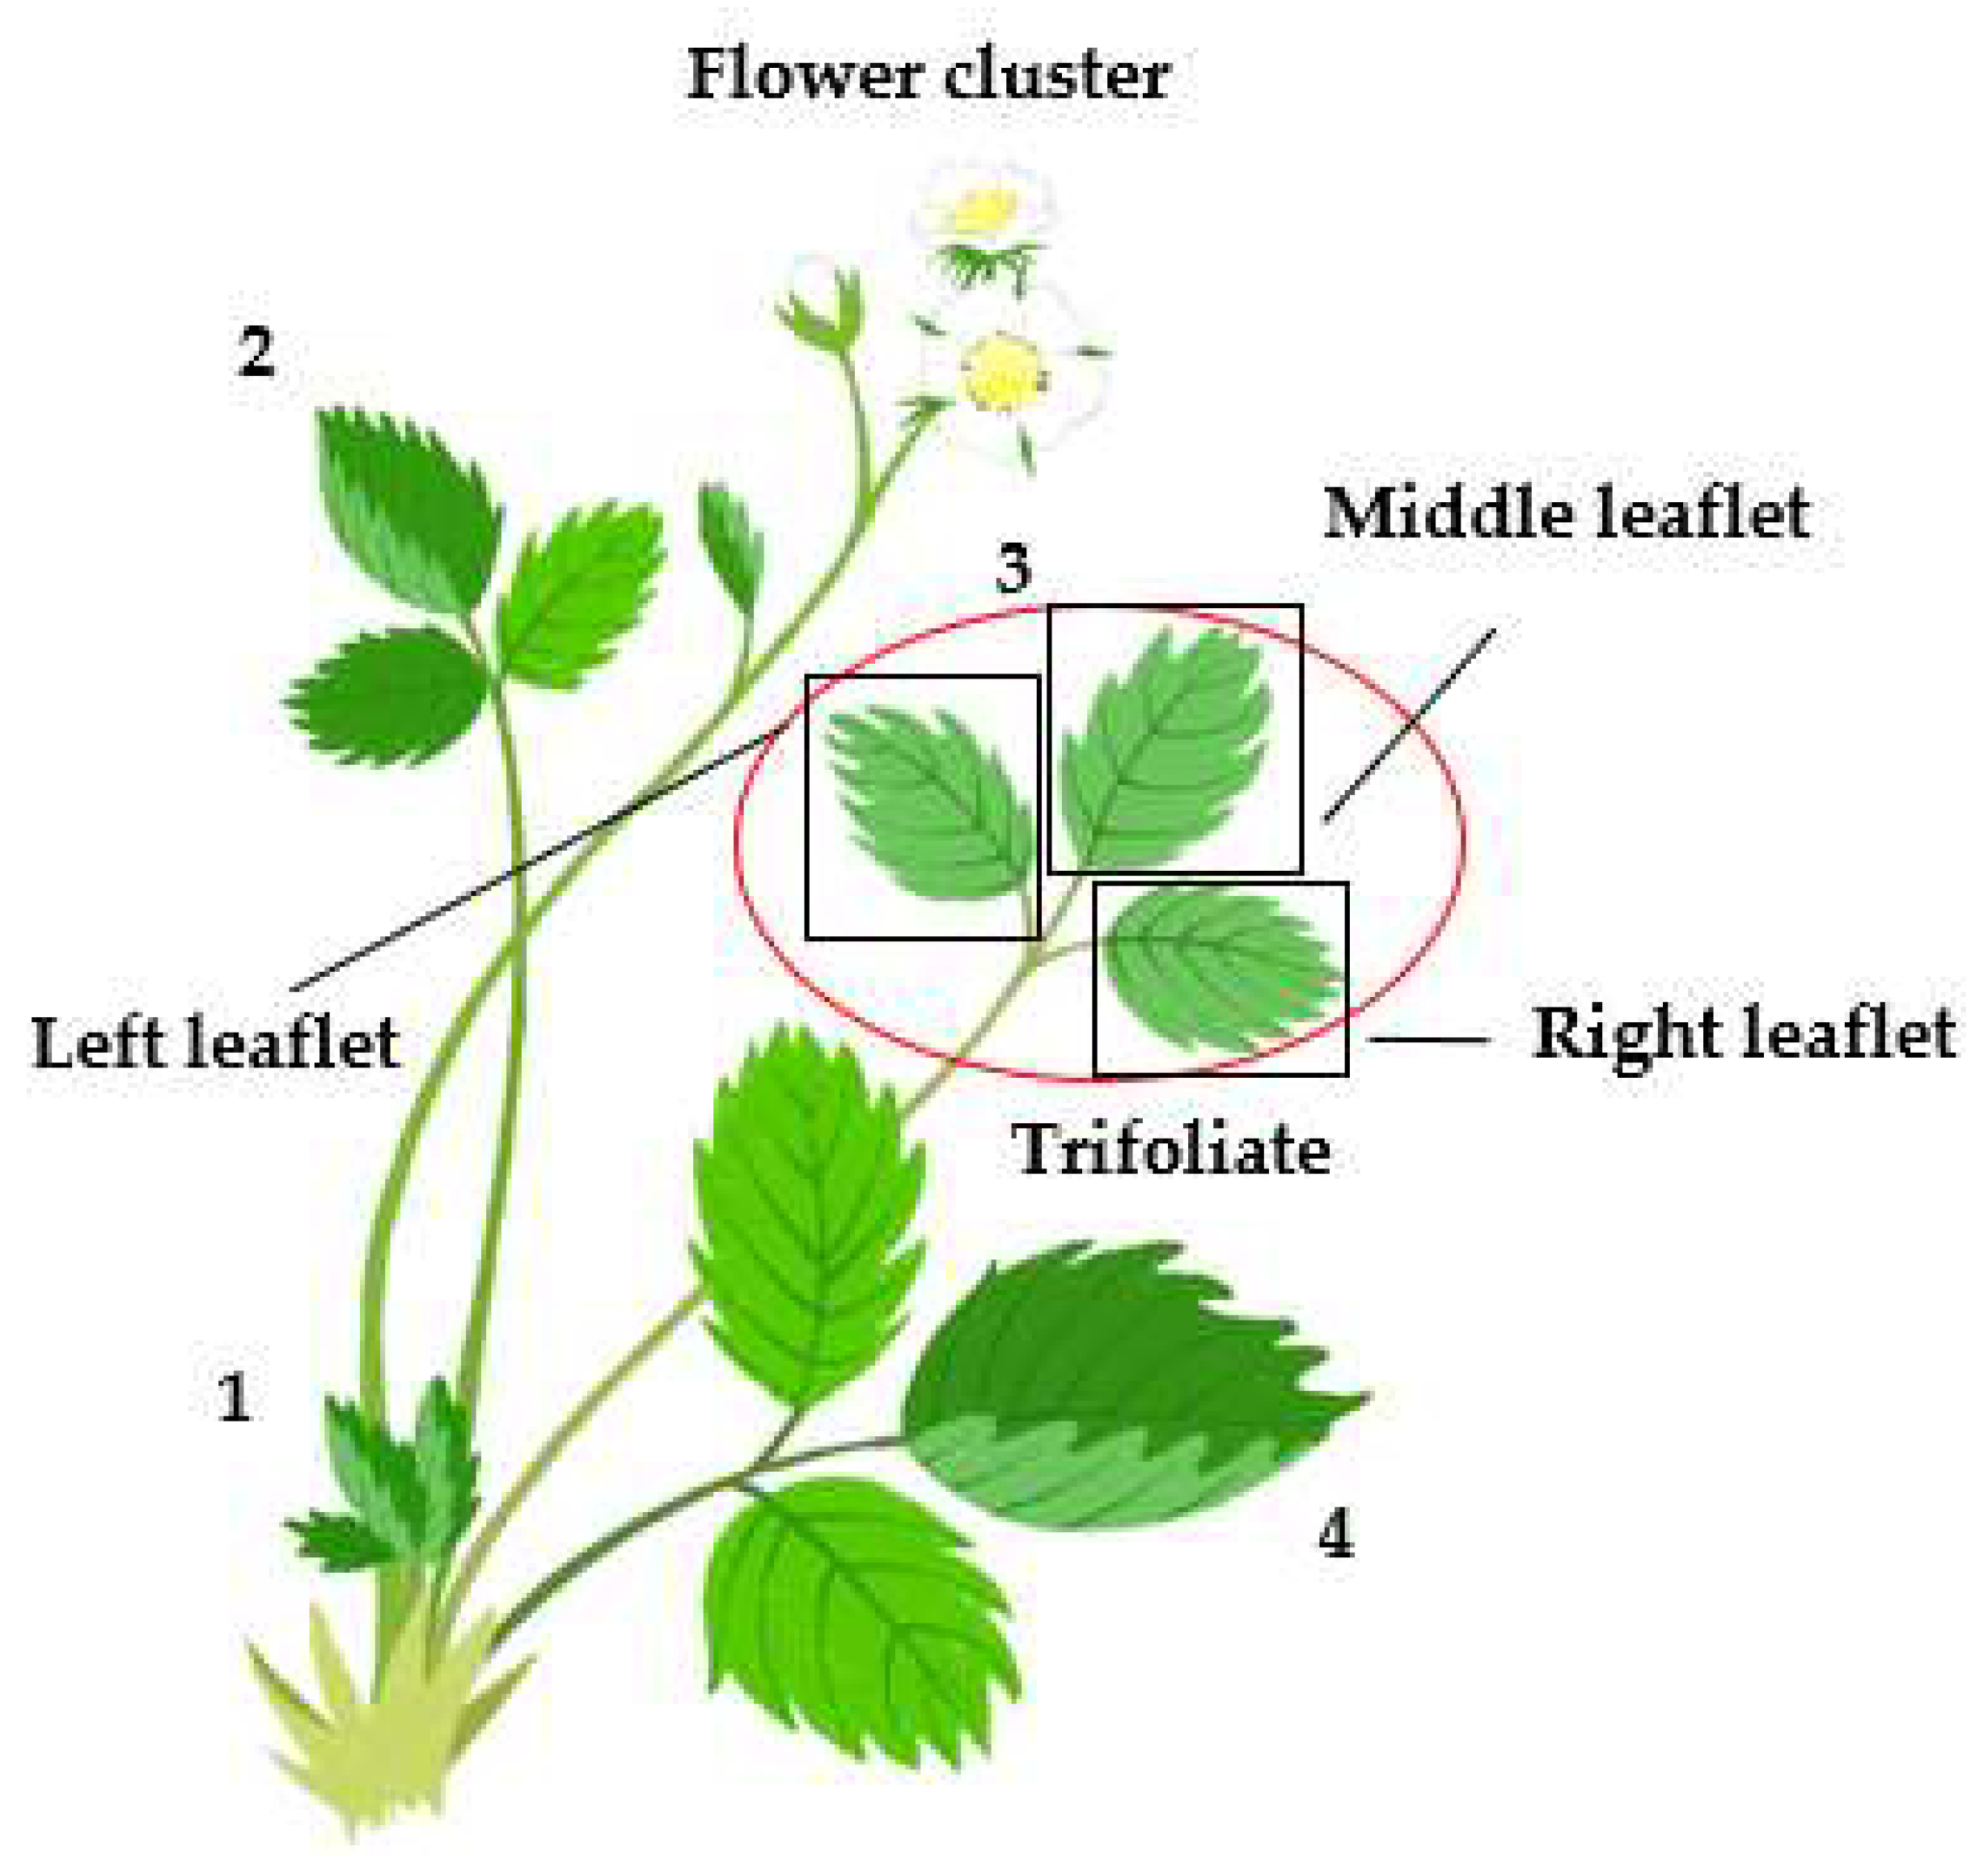
2.2. Sampling
2.3. Within-Plant Distribution
2.4. Sampling Unit
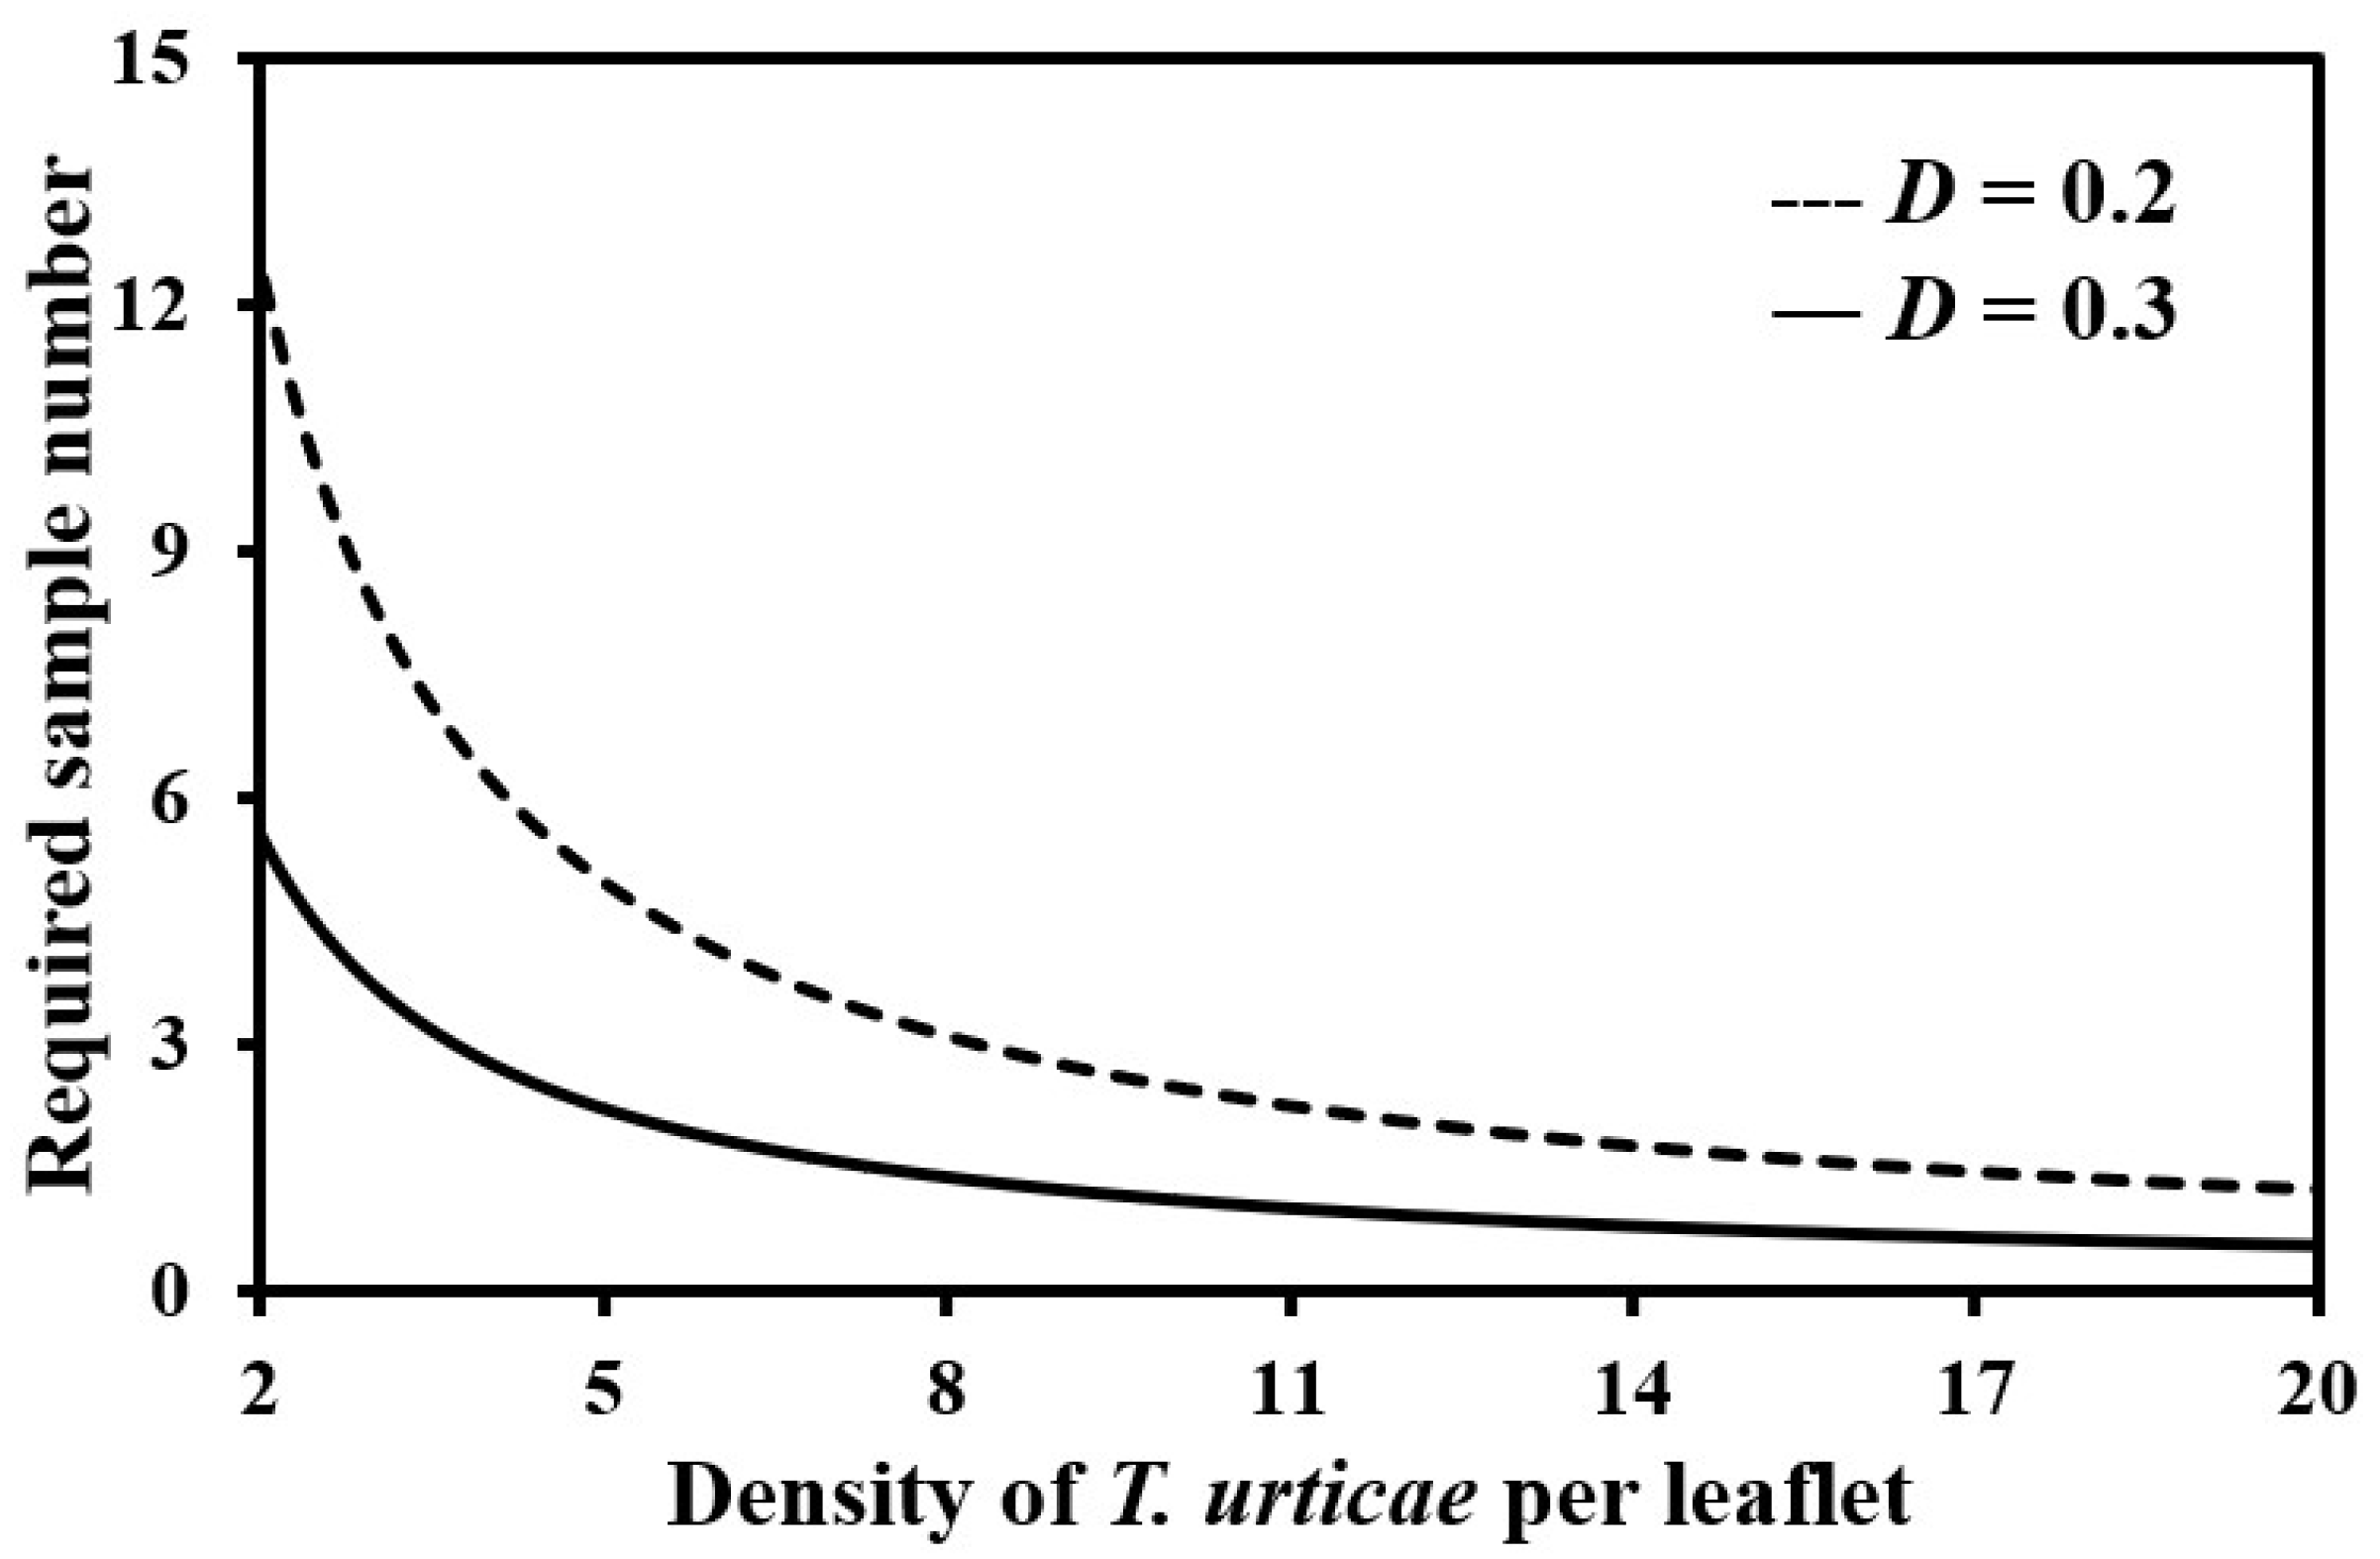
2.5. Required Sample Number
3. Results
3.1. Characteristics of Within-Plant Distribution
3.2. Optimal Sampling Unit
3.3. Required Sample Number
4. Discussion
Author Contributions
Funding
Institutional Review Board Statement
Data Availability Statement
Acknowledgments
Conflicts of Interest
References
- Manganaris, G.A.; Goulas, V.; Vicente, A.R.; Terry, L.A. Berry antioxidants: Small fruits providing large benefits. J. Sci. Food Agri. 2014, 94, 825–833. [Google Scholar] [CrossRef] [PubMed] [Green Version]
- Park, Y.-G.; Baek, S.; Im, J.S.; Kim, M.-J.; Lee, J.-H. Present status of smart greenhouses growing fruit vegetables in Korea: Focusing management of environmental conditions and pests in greenhouses. Korean J. Appl. Entomol. 2020, 59, 55–64. [Google Scholar] [CrossRef]
- Cho, J.R.; Kim, Y.J.; Ahn, Y.J.; Yoo, J.K.; Lee, J.O. Monitoring of acaricide resistance in field-collected populations of Tetranychus urticae (Acari: Tetranychidae) in Korea. Korean J. Appl. Entomol. 1995, 34, 40–45. [Google Scholar]
- Song, C.G.; Kim, H.; Ahn, S.J.; Park, N.J.; Cho, K.Y. Acaricide susceptibilities of field-collected populations of two-spotted spider mite, Tetranychus urticae (Acari: Tetranychidae), from apple orchards. Korean J. Appl. Entomol. 1995, 34, 328–334. [Google Scholar]
- So, P.-M. Distribution patterns of and sampling plans for Tetranychus urticae Koch (Acarina: Tetranychidae). Res. Popul. Ecol. 1991, 33, 229–243. [Google Scholar] [CrossRef]
- Jung, C.; Kim, D.-S.; Park, Y.-S.; Lee, J.-H. Simulation modeling of two spotted spider mite population dynamics in apple and pear orchards in Korea. J. Asia-Pac. Entomol. 2005, 8, 285–290. [Google Scholar] [CrossRef]
- Helle, W.; Sabelis, M.W. Spider Mites: Their Biology, Natural Enemies and Control; Elsvier: Amsterdam, The Netherlands, 1985; Volume 1. [Google Scholar]
- Nachman, G. Estimates of mean population density and spatial distribution of Tetranychus urticae (Acarina: Tetranychidae) and Phytoseiulus persimilis (Acarina: Phytoseiidae) based upon the proportion of empty sampling units. J. Appl. Ecol. 1984, 21, 903–913. [Google Scholar] [CrossRef]
- Opit, G.P.; Margolies, D.C.; Nechols, J.R. Within-plant distribution of two spotted spider mite, Tetranychus urticae Koch (Acari: Tetranychidae), on ivy geranium: Development of a presence-absence sampling plan. J. Econ. Entomol. 2003, 96, 482–488. [Google Scholar] [CrossRef] [PubMed]
- Tollerup, K.E.; Marcum, D.; Wilson, R.; Godfrey, L. Binomial and enumerative sampling of Tetranychus urticae (Acari: Tetranychidae) on peppermint in California. J. Econ. Entomol. 2013, 106, 1707–1715. [Google Scholar] [CrossRef] [PubMed]
- Greco, N.M.; Tetzlaff, G.T.; Liljestthrom, G.G. Presence-absence sampling for Tetranychus urticae and its predator Neoseiulus californicus (Acari: Tetranychidae; Phytoseiidae) on strawberries. Int. J. Pest Manag. 2004, 50, 23–27. [Google Scholar] [CrossRef]
- Choe, H.; Kang, J.; Jung, H.; Choi, S.; Park, J.-J. Development of sequential sampling plans for Tetranychus urticae in strawberry greenhouses. Korean J. Environ. Biol. 2017, 35, 427–436. [Google Scholar] [CrossRef]
- Mollet, J.A.; Trumble, J.T.; Walker, G.P.; Sevacherian, V. Sampling scheme for determining population intensity of Tetranychus cinnabarinus (Boisdual) (Acarina: Tetranychidae) in cotton. Environ. Entomol. 1984, 13, 1015–1017. [Google Scholar] [CrossRef]
- Baek, S.; Lee, J.-H.; Park, D.-K.; Park, Y.; Kim, M.-J.; Kim, K.; Seo, H.-Y.; Choi, Y.S. Within-tree distribution of Ricania shantungensis (Hemiptera: Ricaniidae) eggs on chestnuts. J. Asia Pac. Entomol. 2020, 23, 536–539. [Google Scholar] [CrossRef]
- Pedigo, L.P.; Buntin, G.D. Handbook of Sampling Methods for Arthropods in Agriculture; CRC Press: Boca Raton, FL, USA, 1994; pp. 127–129. [Google Scholar]
- Connor, E.F.; Hosfield, E.; Meeter, D.A.; Niu, X. Tests for aggregation and size-based sample-unit selection when sample units vary in size. Ecology 1997, 78, 1238–1249. [Google Scholar] [CrossRef]
- Rossi, J.P.; Nuutinen, V. The effect of sampling unit size on the perception of the spatial pattern of earthworm (Lumbricus terrestris L.) middens. Appl. Soil Ecol. 2004, 27, 189–196. [Google Scholar] [CrossRef]
- Morris, R.F. The development of sampling techniques for forest insect defoliators with particular reference to the spruce budworm. Can. J. Zool. 1955, 33, 225–294. [Google Scholar] [CrossRef]
- SAS Institute. SAS/STAT User’s Guide, Version 9.3; SAS Institute: Cary, NC, USA, 2011. [Google Scholar]
- Naranjo, S.E.; Ellsworth, P.C. Fifty years of the integrated control concept: Moving the model and implementation forward in Arizona. Pest Manag Sci. 2009, 65, 1267–1286. [Google Scholar] [CrossRef] [Green Version]
- Reusink, W.G. Introduction to Sampling Theory; Kogan, M., Herzong, D.C., Eds.; Springer: New York, NY, USA, 1980; pp. 61–78. [Google Scholar]


| Leaf Age 1 | Observed Number | Average Density 2 (Mean ± SE) | CV 3 | r2,4 |
|---|---|---|---|---|
| 1 | 65 | 11.4 ± 6.23 c 5 | 4.44 | 0.09 |
| 2 | 65 | 10.5 ± 2.67 c | 2.04 | 0.66 |
| 3 | 65 | 33.1 ± 10.31 bc | 2.51 | 0.24 |
| 4 | 65 | 69.5 ± 20.08 abc | 2.33 | 0.57 |
| 5 | 65 | 91.5 ± 20.65 ab | 1.82 | 0.52 |
| 6 | 64 | 139.0 ± 30.32 a | 1.74 | 0.71 |
| 7 | 59 | 71.2 ± 17.09 abc | 1.84 | 0.55 |
| 8 | 45 | 85.5 ± 22.28 abc | 1.75 | 0.27 |
| 9 | 20 | 111.1 ± 38.24 abc | 1.54 | 0.53 |
| 10 | 8 | 34.6 ± 20.34 abc | 1.66 | 0.60 |
| 11 | 4 | 28.5 ± 22.62 abc | 1.59 | 0.41 |
| 12 | 1 | 69 | - 6 | - |
| Flower cluster | 65 | 13.9 ± 3.42 c | 1.98 | 0.17 |
| Leaf Age 1 | Observed Number | Average Density 2 (Mean ± SE) | CV 3 | r2,4 |
|---|---|---|---|---|
| 1 | 32 | 3.7 ± 1.56 b 5 | 2.42 | 0.54 |
| 2 | 32 | 10.9 ± 4.06 b | 2.10 | 0.73 |
| 3 | 32 | 22.8 ± 10.52 ab | 2.61 | 0.23 |
| 4 | 32 | 35.7 ± 15.12 ab | 2.39 | 0.76 |
| 5 | 32 | 92.4 ± 26.64 ab | 1.63 | 0.66 |
| 6 | 31 | 83.1 ± 28.96 ab | 1.94 | 0.40 |
| 7 | 29 | 88.9 ± 35.07ab | 2.12 | 0.69 |
| 8 | 25 | 111.9 ± 36.54 a | 1.63 | 0.37 |
| 9 | 11 | 93.2 ± 40.63 ab | 1.45 | 0.69 |
| 10 | 4 | 24.3 ± 17.89 ab | 1.48 | 0.82 |
| 11 | 1 | 118 | - 6 | - |
| Flower cluster | 32 | 10.3 ± 5.78 b | 3.17 | 0.42 |
| Leaf Age 1 | Observed Number | Average Density 2 (Mean ± SE) | CV 3 | r2,4 |
|---|---|---|---|---|
| 1 | 33 | 1.7 ± 1.08 b 5 | 3.71 | 0.05 |
| 2 | 33 | 2.4 ± 1.23 b | 2.92 | 0.40 |
| 3 | 33 | 7.1 ± 2.48 ab | 2.02 | 0.44 |
| 4 | 33 | 21.1 ± 7.54 ab | 2.06 | 0.68 |
| 5 | 33 | 25.6 ± 9.83 ab | 2.21 | 0.36 |
| 6 | 33 | 51.2 ± 19.96 a | 2.24 | 0.58 |
| 7 | 30 | 24.1 ± 12.09 ab | 2.75 | 0.32 |
| 8 | 20 | 37.4 ± 24.34 ab | 2.91 | 0.20 |
| 9 | 9 | 24.2 ± 15.25 ab | 1.89 | 0.24 |
| 10 | 4 | 1.8 ± 0.85 ab | 0.98 | 0.01 |
| 11 | 3 | 1.7 ± 1.67 ab | 1.73 | 0.90 |
| 12 | 1 | 3 | - 6 | - |
| Flower cluster | 33 | 6.7 ± 2.52 ab | 2.17 | 0.02 |
| Leaf Age 1 | Observed Number | Average Density 2 (Mean ± SE) | CV 3 | r2,4 |
|---|---|---|---|---|
| 1 | 65 | 14.1 ± 6.97 c 5 | 3.99 | 0.09 |
| 2 | 65 | 17.2 ± 4.41 c | 2.07 | 0.71 |
| 3 | 65 | 47.9 ± 15.4 bc | 2.59 | 0.25 |
| 4 | 65 | 97.8 ± 25.95 abc | 2.14 | 0.59 |
| 5 | 65 | 149.9 ± 33.22 ab | 1.79 | 0.60 |
| 6 | 64 | 205.6 ± 46.21 a | 1.80 | 0.61 |
| 7 | 59 | 127.1 ± 34.15 abc | 2.06 | 0.61 |
| 8 | 45 | 164.3 ± 44.36 ab | 1.81 | 0.31 |
| 9 | 20 | 173.3 ± 61.92 abc | 1.60 | 0.61 |
| 10 | 8 | 47.6 ± 29.30 abc | 1.74 | 0.65 |
| 11 | 4 | 59.3 ± 51.56 abc | 1.74 | 0.46 |
| 12 | 1 | 72 | - 6 | - |
| Flower cluster | 65 | 22.39 ± 5.90 c | 2.13 | 0.23 |
| Developmental Stage | Site | Left | Middle | Right |
|---|---|---|---|---|
| Egg | Both farms | 153.6 ± 49.15 a 1 | 201.1 ± 65.62 a | 163.2 ± 53.73 a |
| Motile | First farm | 123.3 ± 57.01 a | 177.8 ± 81.97 a | 151.5 ± 75.65 a |
| Motile | Second farm | 49.2 ± 23.84 a | 68.1 ± 33.95 a | 43.3 ± 18.11 a |
| Both (Egg + Motile) | Both farms | 239.3 ± 83.11 a | 323.2 ± 111.49 a | 259.8 ± 94.53 a |
Publisher’s Note: MDPI stays neutral with regard to jurisdictional claims in published maps and institutional affiliations. |
© 2022 by the authors. Licensee MDPI, Basel, Switzerland. This article is an open access article distributed under the terms and conditions of the Creative Commons Attribution (CC BY) license (https://creativecommons.org/licenses/by/4.0/).
Share and Cite
Choi, Y.-S.; Kim, M.-J.; Baek, S. Within-Plant Distribution of Two-Spotted Spider Mites, Tetranychus urticae Koch (Acari: Tetranychidae), on Strawberries: Decision of an Optimal Sampling Unit. Insects 2022, 13, 55. https://doi.org/10.3390/insects13010055
Choi Y-S, Kim M-J, Baek S. Within-Plant Distribution of Two-Spotted Spider Mites, Tetranychus urticae Koch (Acari: Tetranychidae), on Strawberries: Decision of an Optimal Sampling Unit. Insects. 2022; 13(1):55. https://doi.org/10.3390/insects13010055
Chicago/Turabian StyleChoi, Yong-Seok, Min-Jung Kim, and Sunghoon Baek. 2022. "Within-Plant Distribution of Two-Spotted Spider Mites, Tetranychus urticae Koch (Acari: Tetranychidae), on Strawberries: Decision of an Optimal Sampling Unit" Insects 13, no. 1: 55. https://doi.org/10.3390/insects13010055