Article

Mountains as Islands: Species Delimitation and Evolutionary History of the Ant-Loving Beetle Genus Panabachia (Coleoptera, Staphylinidae) from the Northern Andes

by
Sofía I. Muñoz-Tobar
1,2,* and
Michael S. Caterino
1
1
Department of Plant and Environmental Sciences, Clemson University, Clemson, SC 29634, USA
2
Escuela de Ciencias Biológicas, Pontificia Universidad Católica del Ecuador, Quito 1700525, Ecuador
*
Author to whom correspondence should be addressed.
Insects 2020, 11(1), 64; https://doi.org/10.3390/insects11010064
Submission received: 16 December 2019 / Revised: 9 January 2020 / Accepted: 14 January 2020 / Published: 20 January 2020

Abstract

:
The ant-loving beetle genus Panabachia Park 1942 is a poorly studied beetle lineage from the new world tropics. We recently collected Panabachia from several previously unrecorded locations in the páramo biome of the high Ecuadorian Andes, with males exhibiting great morphological variation in the distribution of the foveae and depressions in the pronotum, as well as aspects of the male genitalia. Here, we employ phylogenetic and species delimitation methods with mitochondrial (COI) and nuclear protein-coding (wingless) gene sequences to examine the concordance of morphological characters and geography with hypothesized species boundaries. Three methods of species delimitation (bPTP, GMYC and Stacey) were used to estimate the number of species, and divergence times between putative species using molecular clock calibration. Phylogenetic analysis revealed two parallel radiations, and species delimitation analyses suggest there are between 17 and 22 putative species. Based on clade support and concordance across species delimitation methods we hypothesize 17 distinct clusters, with allopatric speciation consistent with most geographic patterns. Additionally, a widespread species appears to be present in northern páramo sites, and some sister species sympatry may indicate other diversification processes have operated on certain lineages of Panabachia. Divergence time estimates suggest that Panabachia originated in the Miocene, but most species analyzed diverged during the Pliocene and Pleistocene (5.3–0.11 Mya), contemporaneous with the evolution of páramo plant species.

1. Introduction

The Andes mountain chain along the South American spine has a dynamic geological and climatological history. A wide range of geological processes, such as plate subduction, volcanism, crustal shortening and terrain accretion, has shaped the topography and the distribution of the species in the tropical Andes [1,2,3,4,5]. The orogenic formation of the Andes started during the Mesozoic and peaked with a massive uplift over the past 30 Ma [6]. The increase in elevation affected the climatic patterns of the region, leading to Quaternary formation of glaciers on the mountain summits [7,8].
These geological and paleoclimatical events have influenced tropical alpine ecosystems, as well as the distributions and genetic diversity of multiple evolutionary lineages that inhabit the tropical Andes, leading to high numbers of endemic species [3,9,10]. During interglacial fluctuations many suitable habitats moved from the mountain slopes into the inter-Andean valleys [5,11,12,13], sometimes allowing species to exchange genetic material between populations that were usually separated by elevation [5,14], or, alternately, driving the fragmentation of species distributions [5,13,15,16].
In the present day, a tropical alpine ecosystem known as páramo is found in the northern Andes above 2800 m, comprising numerous isolated island patches [17,18]. Multiple factors, including isolation due to elevation and climatic oscillations, have played into shaping the current diversity in the páramo [9,18]. Most species from páramo possess adaptations to live at high elevation [9]. These include morphological, physiological and behavioral adaptations as results of experiencing harsh abiotic conditions, such as extreme temperatures, higher solar radiation, desiccation and reduced oxygen pressure [19,20,21].
The phylogeographic structure of few Andean species has been assessed, most focusing on vascular plants and vertebrate species in a larger phylogeographical context [9,15,22,23]. These studies have revealed that most páramo lineages are quite young (0.0025–5.33 Mya–Pliocene and Pleistocene; [5]), and that the orogeny of the Andes has played an important role shaping their phylogeographical patterns [5,15,21,22,23]. The few studies done on insect lineages from high elevations have also shown that allopatric speciation is a contributing factor to their diversity patterns [24,25,26,27,28]. However, the specific patterns have varied depending on the dispersal capability of each insect lineage [27,28]. These studies have revealed some lineages to exhibit high levels of gene flow among populations, while others show higher genetic structure across páramo patches [27,28]. Basic evolutionary processes are not well understood for most alpine lineages [29], and the discrepancies among high elevation lineages analyzed to date offer distinct hypotheses that may be tested with insect lineages occurring in páramo.
The rove beetles (Coleoptera: Staphylinidae) represent one of the most diverse families of beetles (61,300 spp.) [30]. Their diversity has been attributed to the variety of habitats they inhabit, their feeding behaviors, and ecological interactions [31]. Many representatives of this family are found in the Neotropical Region, a region that is thought to contain one of the most diverse faunas of rove beetles [31]. In Ecuador, a total of 908 species of rove beetles have been reported [32], mainly from lowland areas. The general diversity of rove beetles in this region is thought to be much greater than previously documented [30], and mid- and high-elevation areas that present unique Andean microhabitats [33,34] are severely understudied.
In this study, we focused on diversification patterns in páramo populations of the genus Panabachia Park 1942, a Neotropical genus of ant-loving beetles (Coleoptera, Pselaphinae) that can be identified by the presence of a large trilobed excavation in the pronotum [35]. So far, only two species have been described within this genus: P. vulnerata (Sharp, 1887) from Panama, and P. impressicollis (Sharp 1887) from Guatemala [36,37,38]. However, this genus occurs across the Neotropical Region, from Mexico to Bolivia. Specimens have been reported from leaf litter as well as from bromeliads [38]. During the summer of 2016, Panabachia was collected from leaf litter samples taken in Ecuadorian páramo. Preliminarily, we have identified multiple morphospecies based on the distribution of foveae and depressions on the pronotum of the males, as well as aspects of the male genitalia (Figures S1 and S2). Still, a more comprehensive assessment of the morphological characters is needed, including more samples, considering only males in this genus appear to present diagnostic characters. In this study, we aim to investigate simultaneously the evolutionary history and species diversity in the genus Panabachia from páramo, addressing four specific questions: (1) How many evolutionarily independent lineages of Panabachia are present in the sampled material from páramo? (2) Are genetically isolated clades restricted to specific sites? (3) Is the distribution of genetic diversity limited by major geographic features such as rivers, dry valleys, and other subdivisions within the Ecuadorian Andes, as observed for some ground beetle lineages from páramo? and (4) Is the timing of diversification of Panabachia across páramo contemporary with establishment of Páramo in the high Andes (Miocene–Pliocene), or did it precede the current distribution of this ecosystem, as is apparent in some ground beetle lineages (e.g., Pelmatellus columbianus, 11.9 Mya and Dyscolus alpinus, 6.32 Mya [27,28]. These questions will be addressed through a combination of methods including species delimitation, phylogenetics and divergence time estimation.

2. Materials and Methods

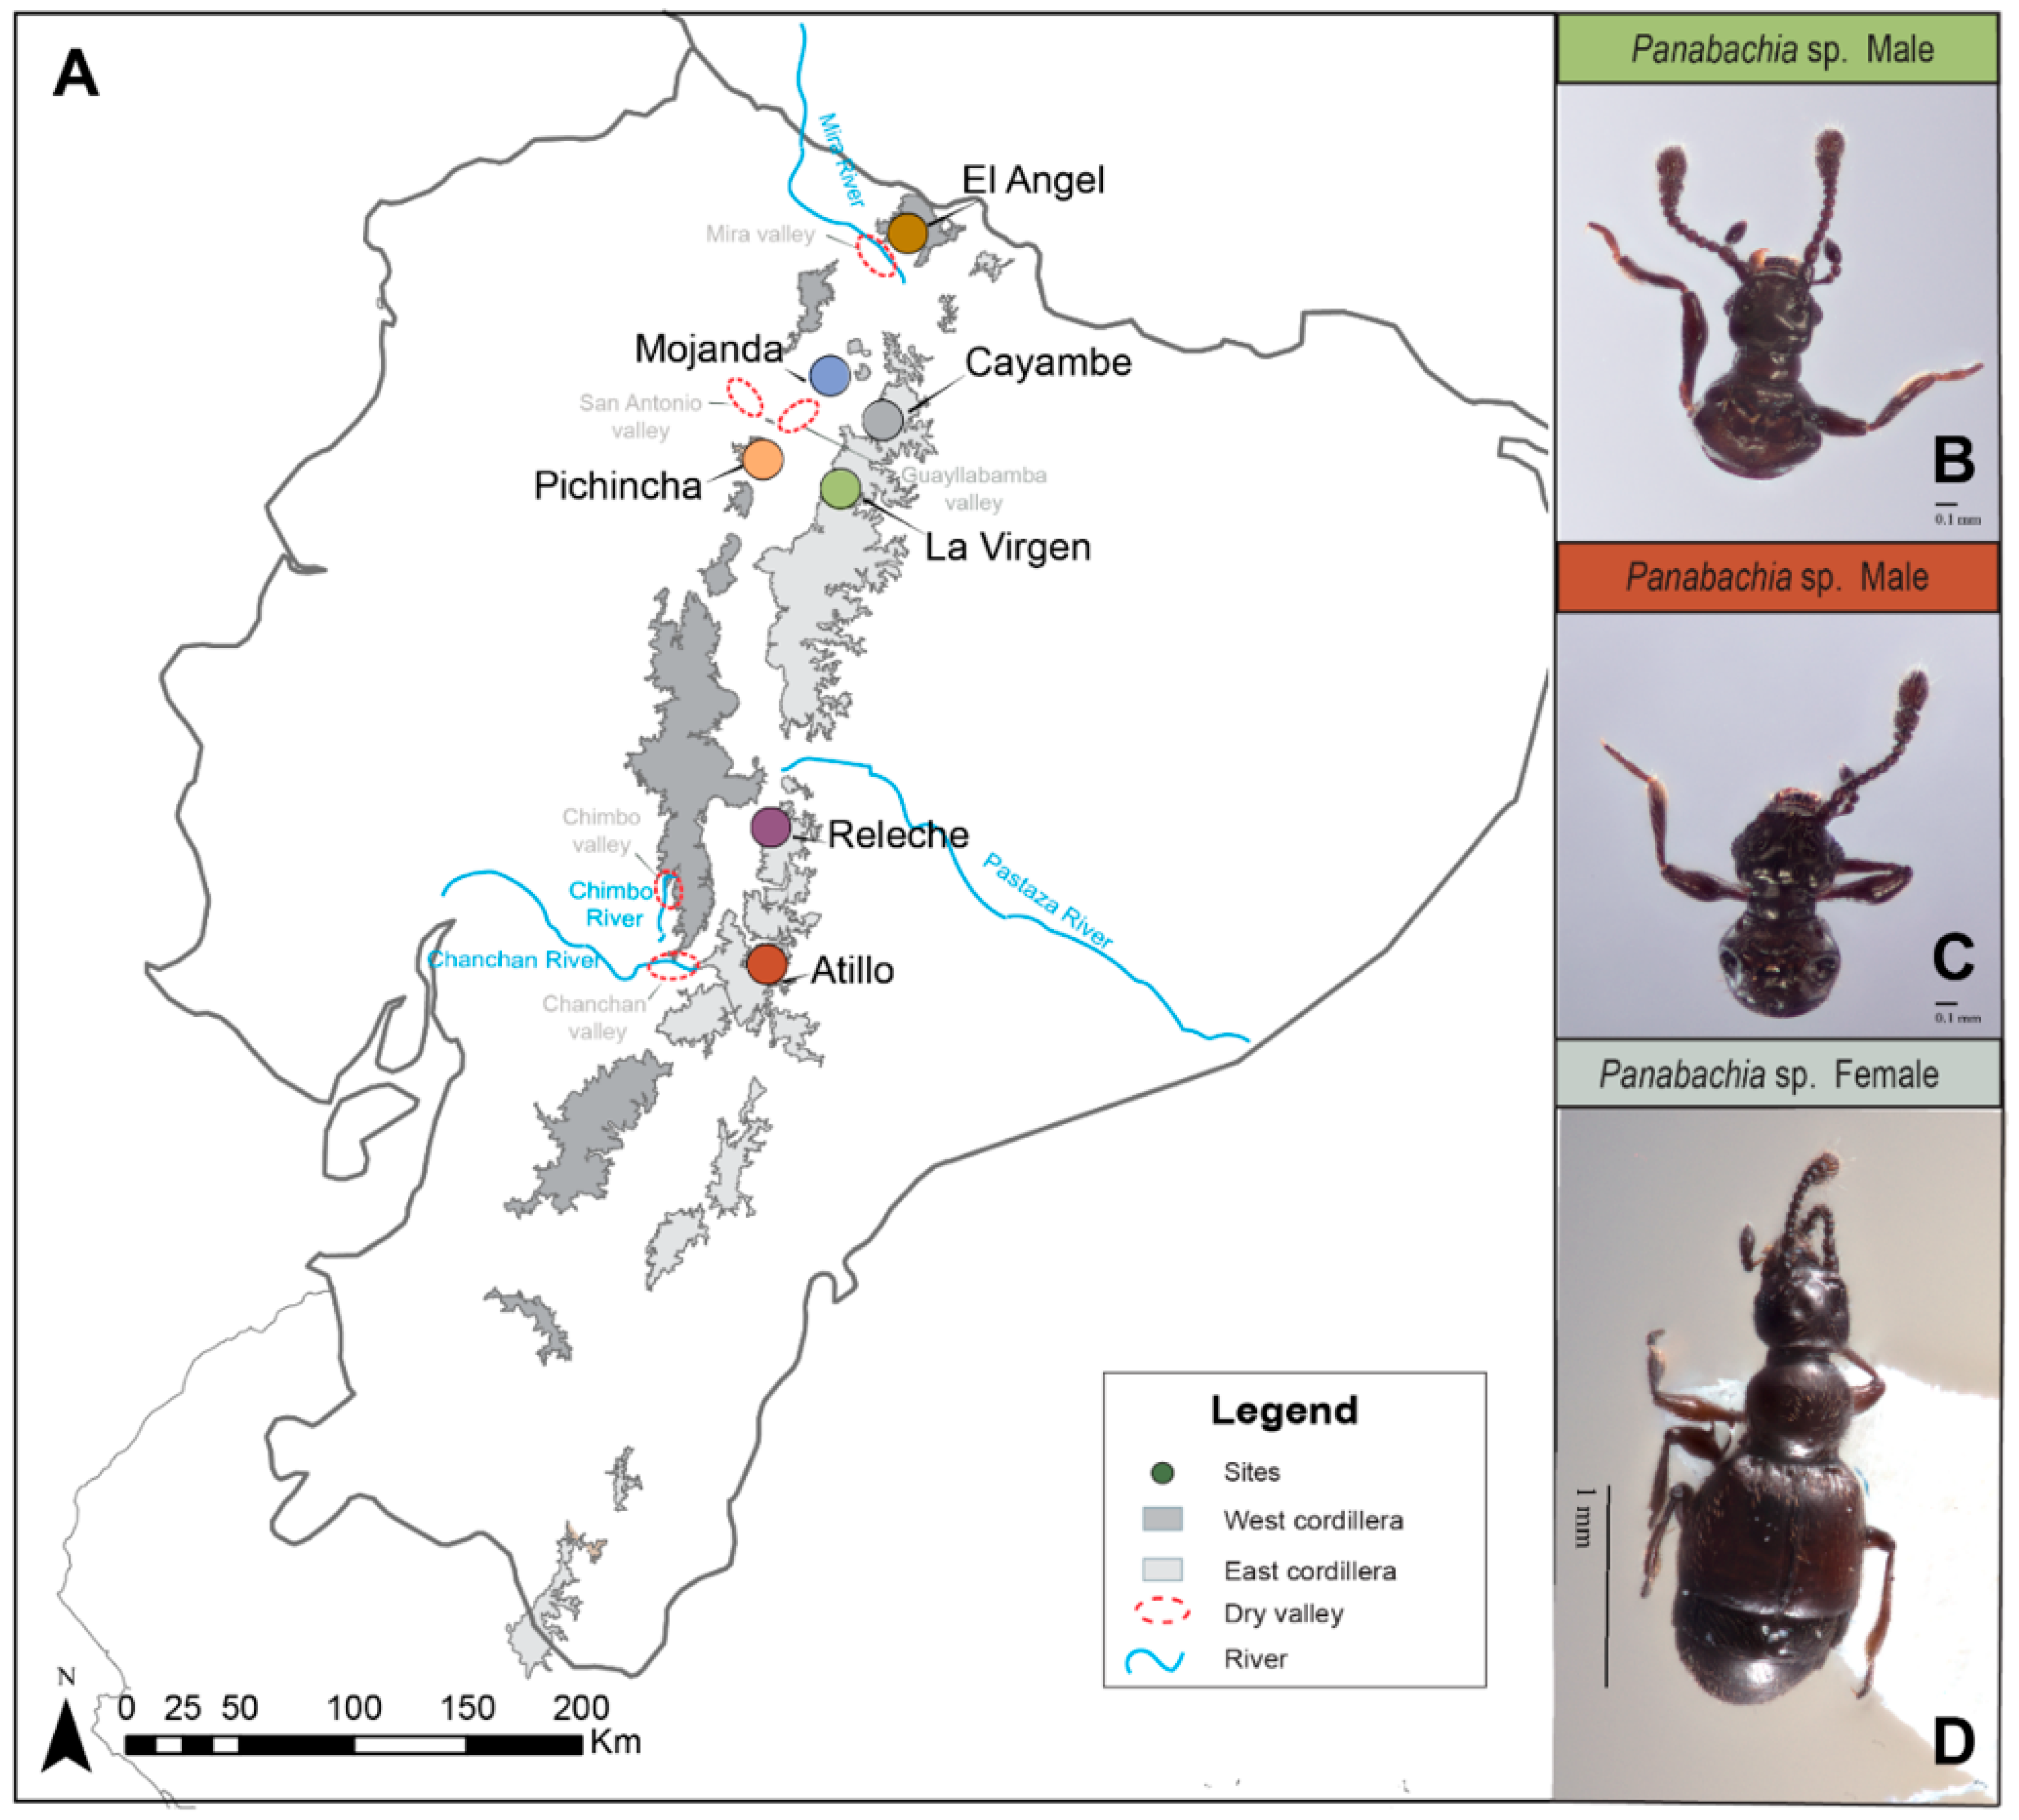
2.1. Field Collection

Samples for this study were obtained from leaf litter samples from 7 sites across the highlands of Ecuador (Figure 1, Table 1). Three leaf litter samples were extracted per site, from a variety of litter types (Polylepis forest, moss, shrubs and grass). The selection of sites was based on conservation status, since most of the collecting took place within the network of protected areas. Collecting permits for this study were previously obtained (MAE-DNG-ARGG-CM-2014-004). The sifted material was transported to the lab and processed using Berlese funnels into 100% ethanol. Collected beetles were separated into morphospecies, based on characters examined (Figures S1 and S2). Wing size was also recorded for each specimen to understand their flight ability. Voucher specimens of this study will be deposited in the Museo de Zoología de la Pontificia Universidad Católica del Ecuador (QCAZ) after the study is concluded.

2.2. DNA Extraction, Amplification and Sequencing

The entire body of each beetle was used to extract genomic DNA using the GeneJet Genomic DNA Purification Kit (Thermo Fisher Scientific, Vilnius, Lithuania). Polymerase chain reaction was used to amplify two molecular markers: COI and wingless. The mitochondrial gene COI was amplified using the primers C1-J-2183 (5′-CAACATTTATTTTGATTTTTTGG-3′) and TL2-N-3014 (5′-TCCAATGCACTAATCTGCCATATTA-3′, [39]) following the amplification profile described by Caterino and Tishechkin (2014) [40]. For the nuclear gene wingless, we used the primers wg550f (5′-ATGCGTCAGGARTGYAARTGYCAYGGYATGTC-3′) and wgAbRZ (5′-CACTTNACYTCRCARCACCARTG-3′, [41]) following the amplification profile described by Parker and Grimaldi (2014) [42]. PCR reactions of 25 µL generally contained 2–3 µL genomic DNA, 17.5 μL water, 2.5 μL 10× buffer, 0.5 μL dNTPs, 0.75 μL MgCl2, 0.1 μL AmpliTaq® DNA polymerase (Thermo Fisher Scientific, Waltham, MA, USA) and 1 μL of each primer (10 μm). Amplification cycles were performed in a Mastercycler® nexus (Eppendorf). PCR products were purified using ExoSAP-IT (USB/Affymetric, Santa Clara, CA, USA), and sequencing was done commercially by Macrogen USA, Inc. (Rockville, MD, USA). Sequences were manually verified and trimmed using Geneious R8 (Biomatters Ltd., Auckland, New Zealand), and aligned using MAFFT v.7 (http://mafft.cbrc.jp/alignment/server/).

2.3. Phylogenetic Analyses

Models of molecular evolution were assessed using JModeltest 2.0 [43] for each molecular marker, where the GTR+I+G model appeared to be in the 100% confidence interval for COI and wingless data. The method of Templeton, Crandall and Sing (TCS) v1.21 [44] was used to construct haplotype networks for each data set. DnaSP V6.12 [45] was used to phase the wingless data set. To reconstruct phylogenetic relationships among haplotypes RAxML version 8.2.8 [46] was launched from Mesquite’s Zephyr package [47], with 1000 bootstrap replicates. For Bayesian inference, we used Mr. Bayes 3.2 [48] through 20 million generations under default settings.
Divergence time estimates were generated in BEAST 2.0 [49] using a partitioned two-gene data set. Two points of calibration were used, all designating minimum node age within the Pselaphinae: the first was an undescribed Bythinini from Burmese amber (99 Mya) [42]; the second was Parker and Grimaldi’s (2014) estimate that higher Pselaphinae arose 150 Mya. We employed an uncorrelated relaxed clock, using a log-normal distribution, and ran the analysis for 20 million generations. Output trees were generated using TreeAnnotator 2.0.02 (http://beast.bio.ed.ac.uk), with maximum clade credibility (MCC) after a 10% burn-in.

2.4. Species Delimitation Analyses

The number of species within the genus Panabachia is unknown. Morphology-based species classification is a useful tool to determine species, yet the number of species can be masked by lack of species-diagnostic characters in one sex. Frequently in Pselaphinae, females do not exhibit diagnostic characters. Such is the case in Panabachia [36,50], and a high proportion of females were found among our samples collected. Therefore, we used three sequence-based species delimitation methods to hypothesize the number of reproductively isolated clades in Panabachia from páramo. The methods employed included: the Bayesian implementation of the Poisson tree processes (PTP) model, using the bPTP server (http://species.h–its.org/ptp/) [51]; a single threshold Generalized Mixed Yule Coalescent (GMYC) using the GMYC server (http://species.h–its.org/gmyc/; [52]; and a multi-species coalescent method, Species Tree And Classification Estimation Yarely (STACEY) v.1.2.4 [53], implemented in BEAST 2.0 [49]. Species delimitation analyses using these three models were performed using single locus and multilocus data sets.
For analyses in bPTP, trees generated in Mr. Bayes were used as input. Analyses were run through 100,000 MCMC generations, with a thinning of 100 and 10% burn-in. For GMYC, ultrametric trees were produced in BEAST 2.0 [49], using an uncorrelated relaxed clock, a constant coalescent speciation process prior, through 10,000,000 generations and 10% burn-in. Effective Sample Size (ESS) was evaluated in Tracer v1.5 [54], considering runs with ESS values above 200. Output trees were generated in TreeAnnotator 2.0.02 (http://beast.bio.ed.ac.uk), using maximum clade credibility (MCC) after a 10% burn-in and median heights for node heights. Resulting trees were used as input in the GMYC server, using a single threshold. Lastly, for the implementation of STACEY in BEAST 2.0 [49], files were generated in BEAUTI v.2.4.0 [49]. For the minimal number of clusters, two scenarios were analyzed from all taxa’s specimens divided as different species to clusters defined by site. The epsilon value was set to 1 × 10⁻⁴, following guidelines in the software documentation; nucleotide substitution models were estimated a priori using PAUP 4.0 [55]; a fossilized birth-death model was selected for speciation; and the uncorrelated lognormal model was used to describe the relaxed molecular clock. Input files were run for 500 million iterations, sampling every 10,000th generation. Two replicates were run for each set, ESS values were evaluated in Tracer v.1.6, and independent runs were combined using LogCombiner v.2.4.0 [49] after a 10% burn-in; output trees were summarized in TreeAnnotator [49].

3. Results

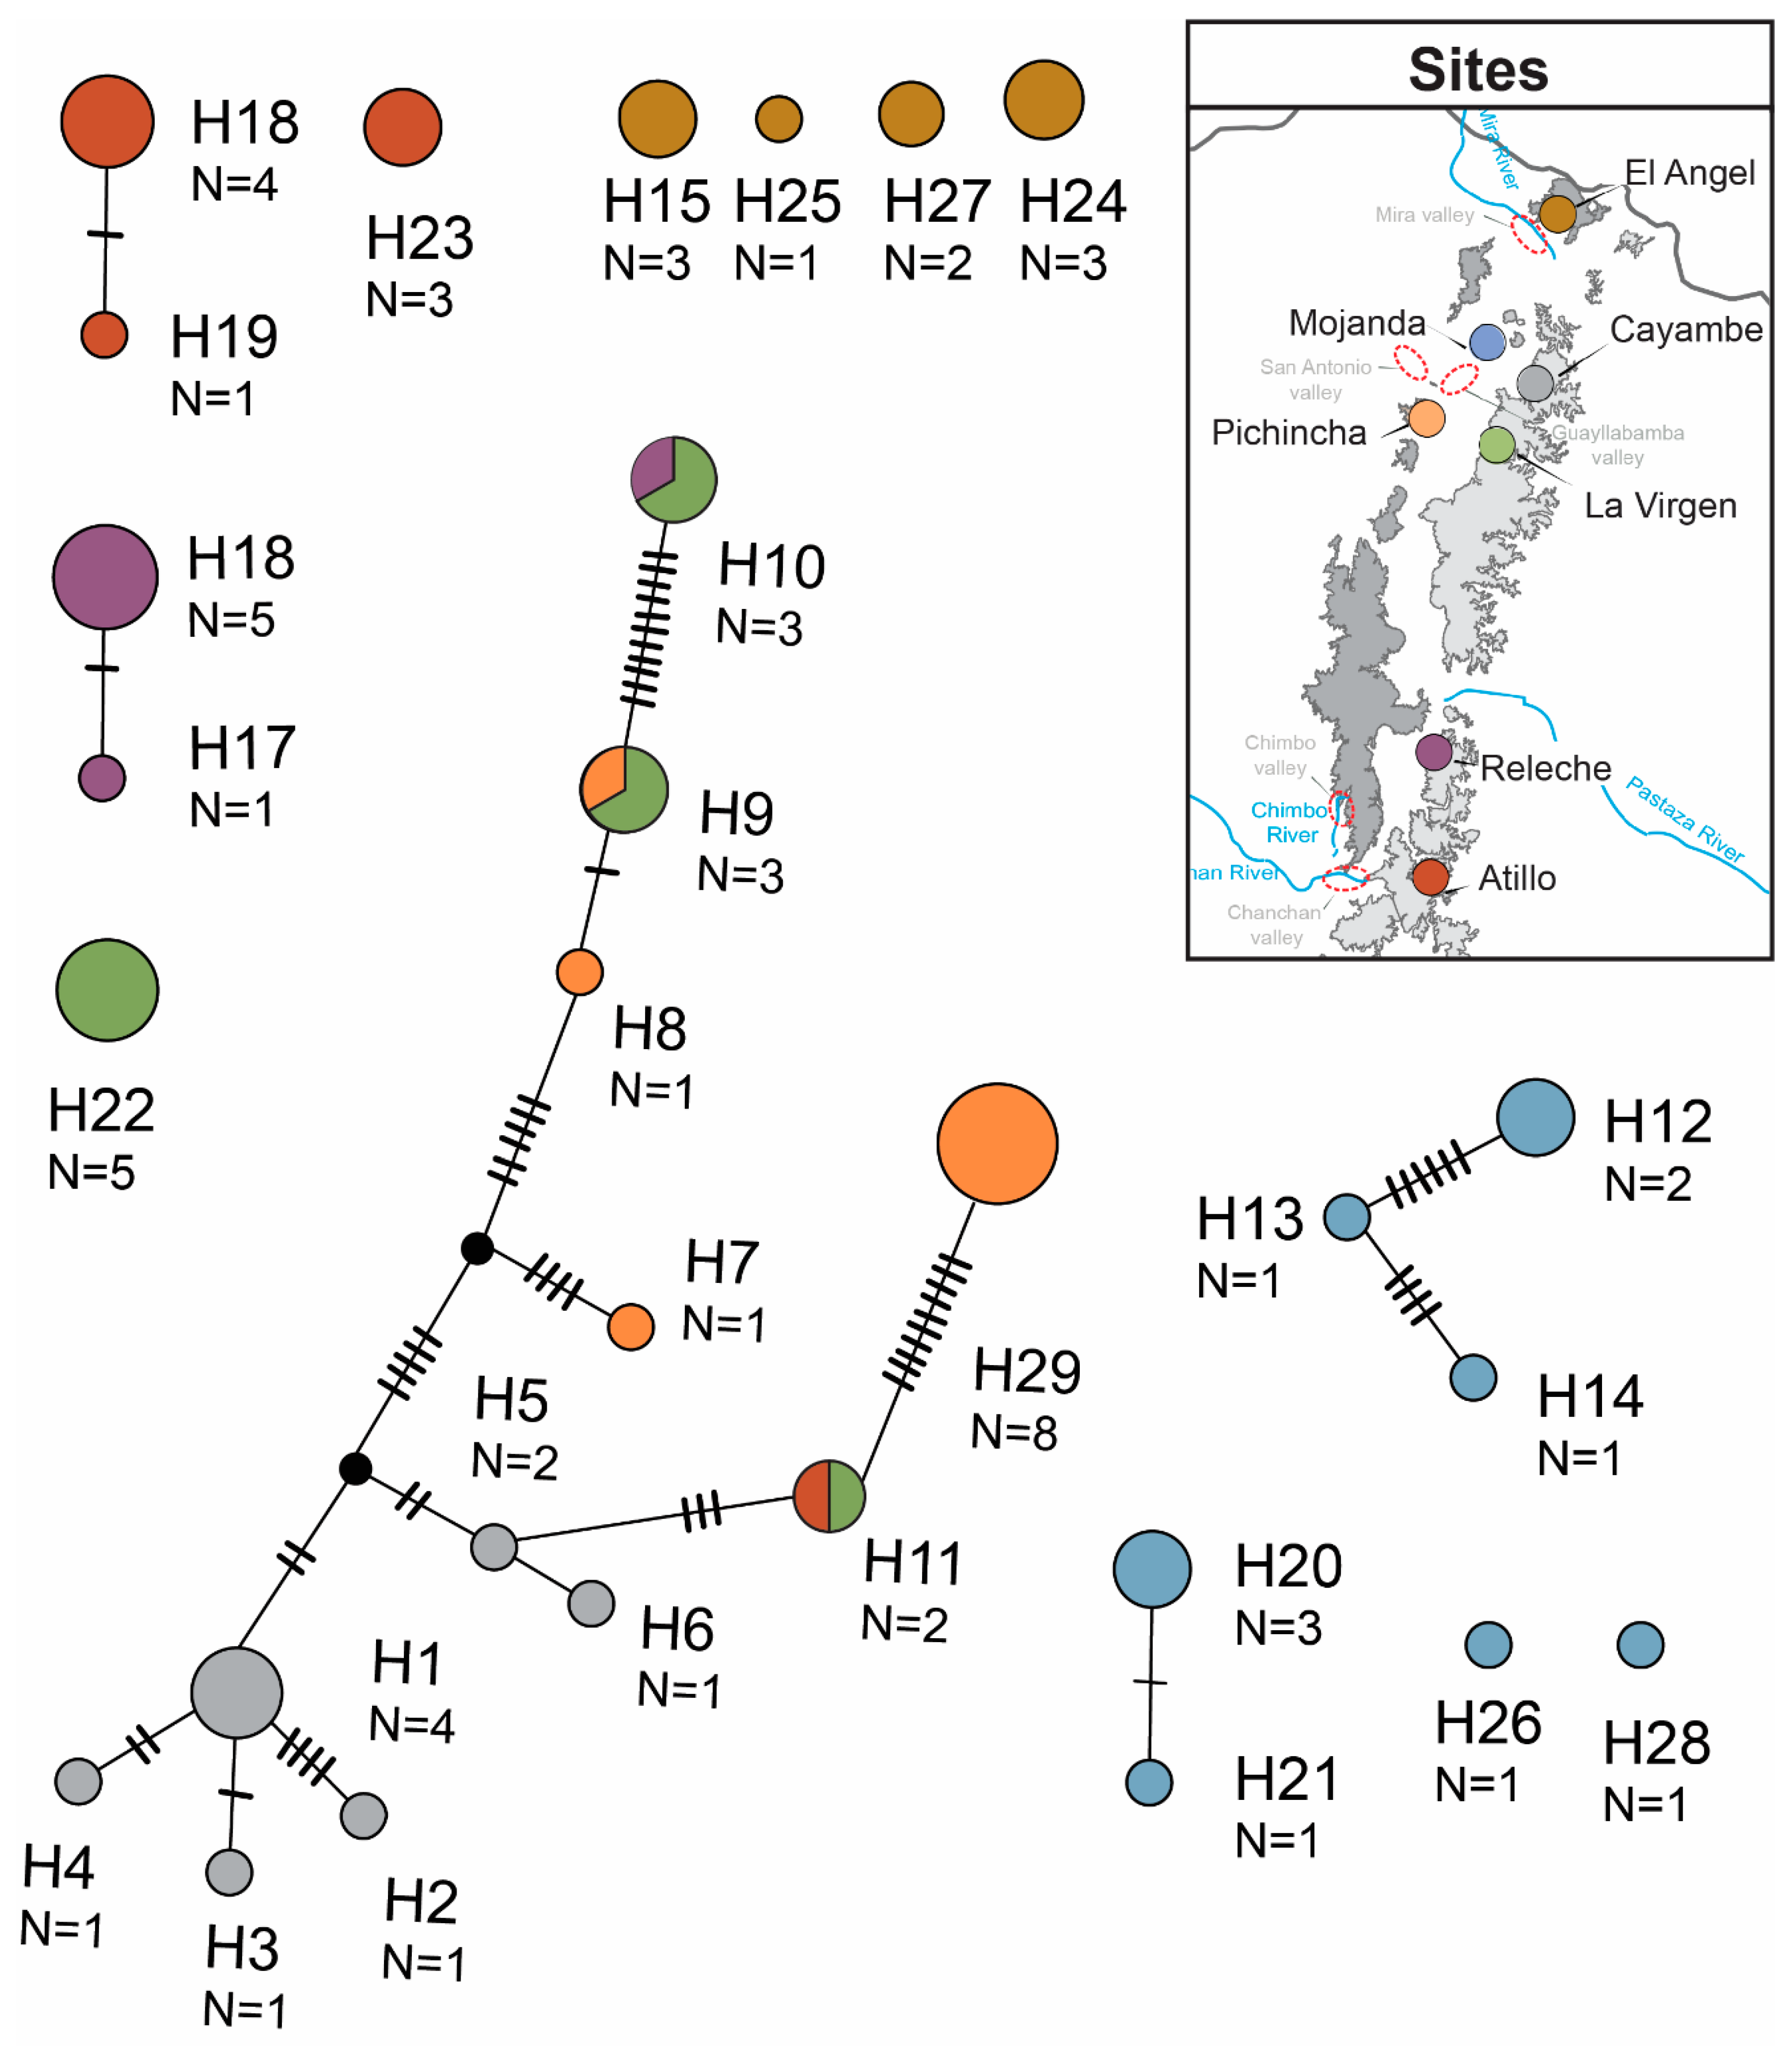
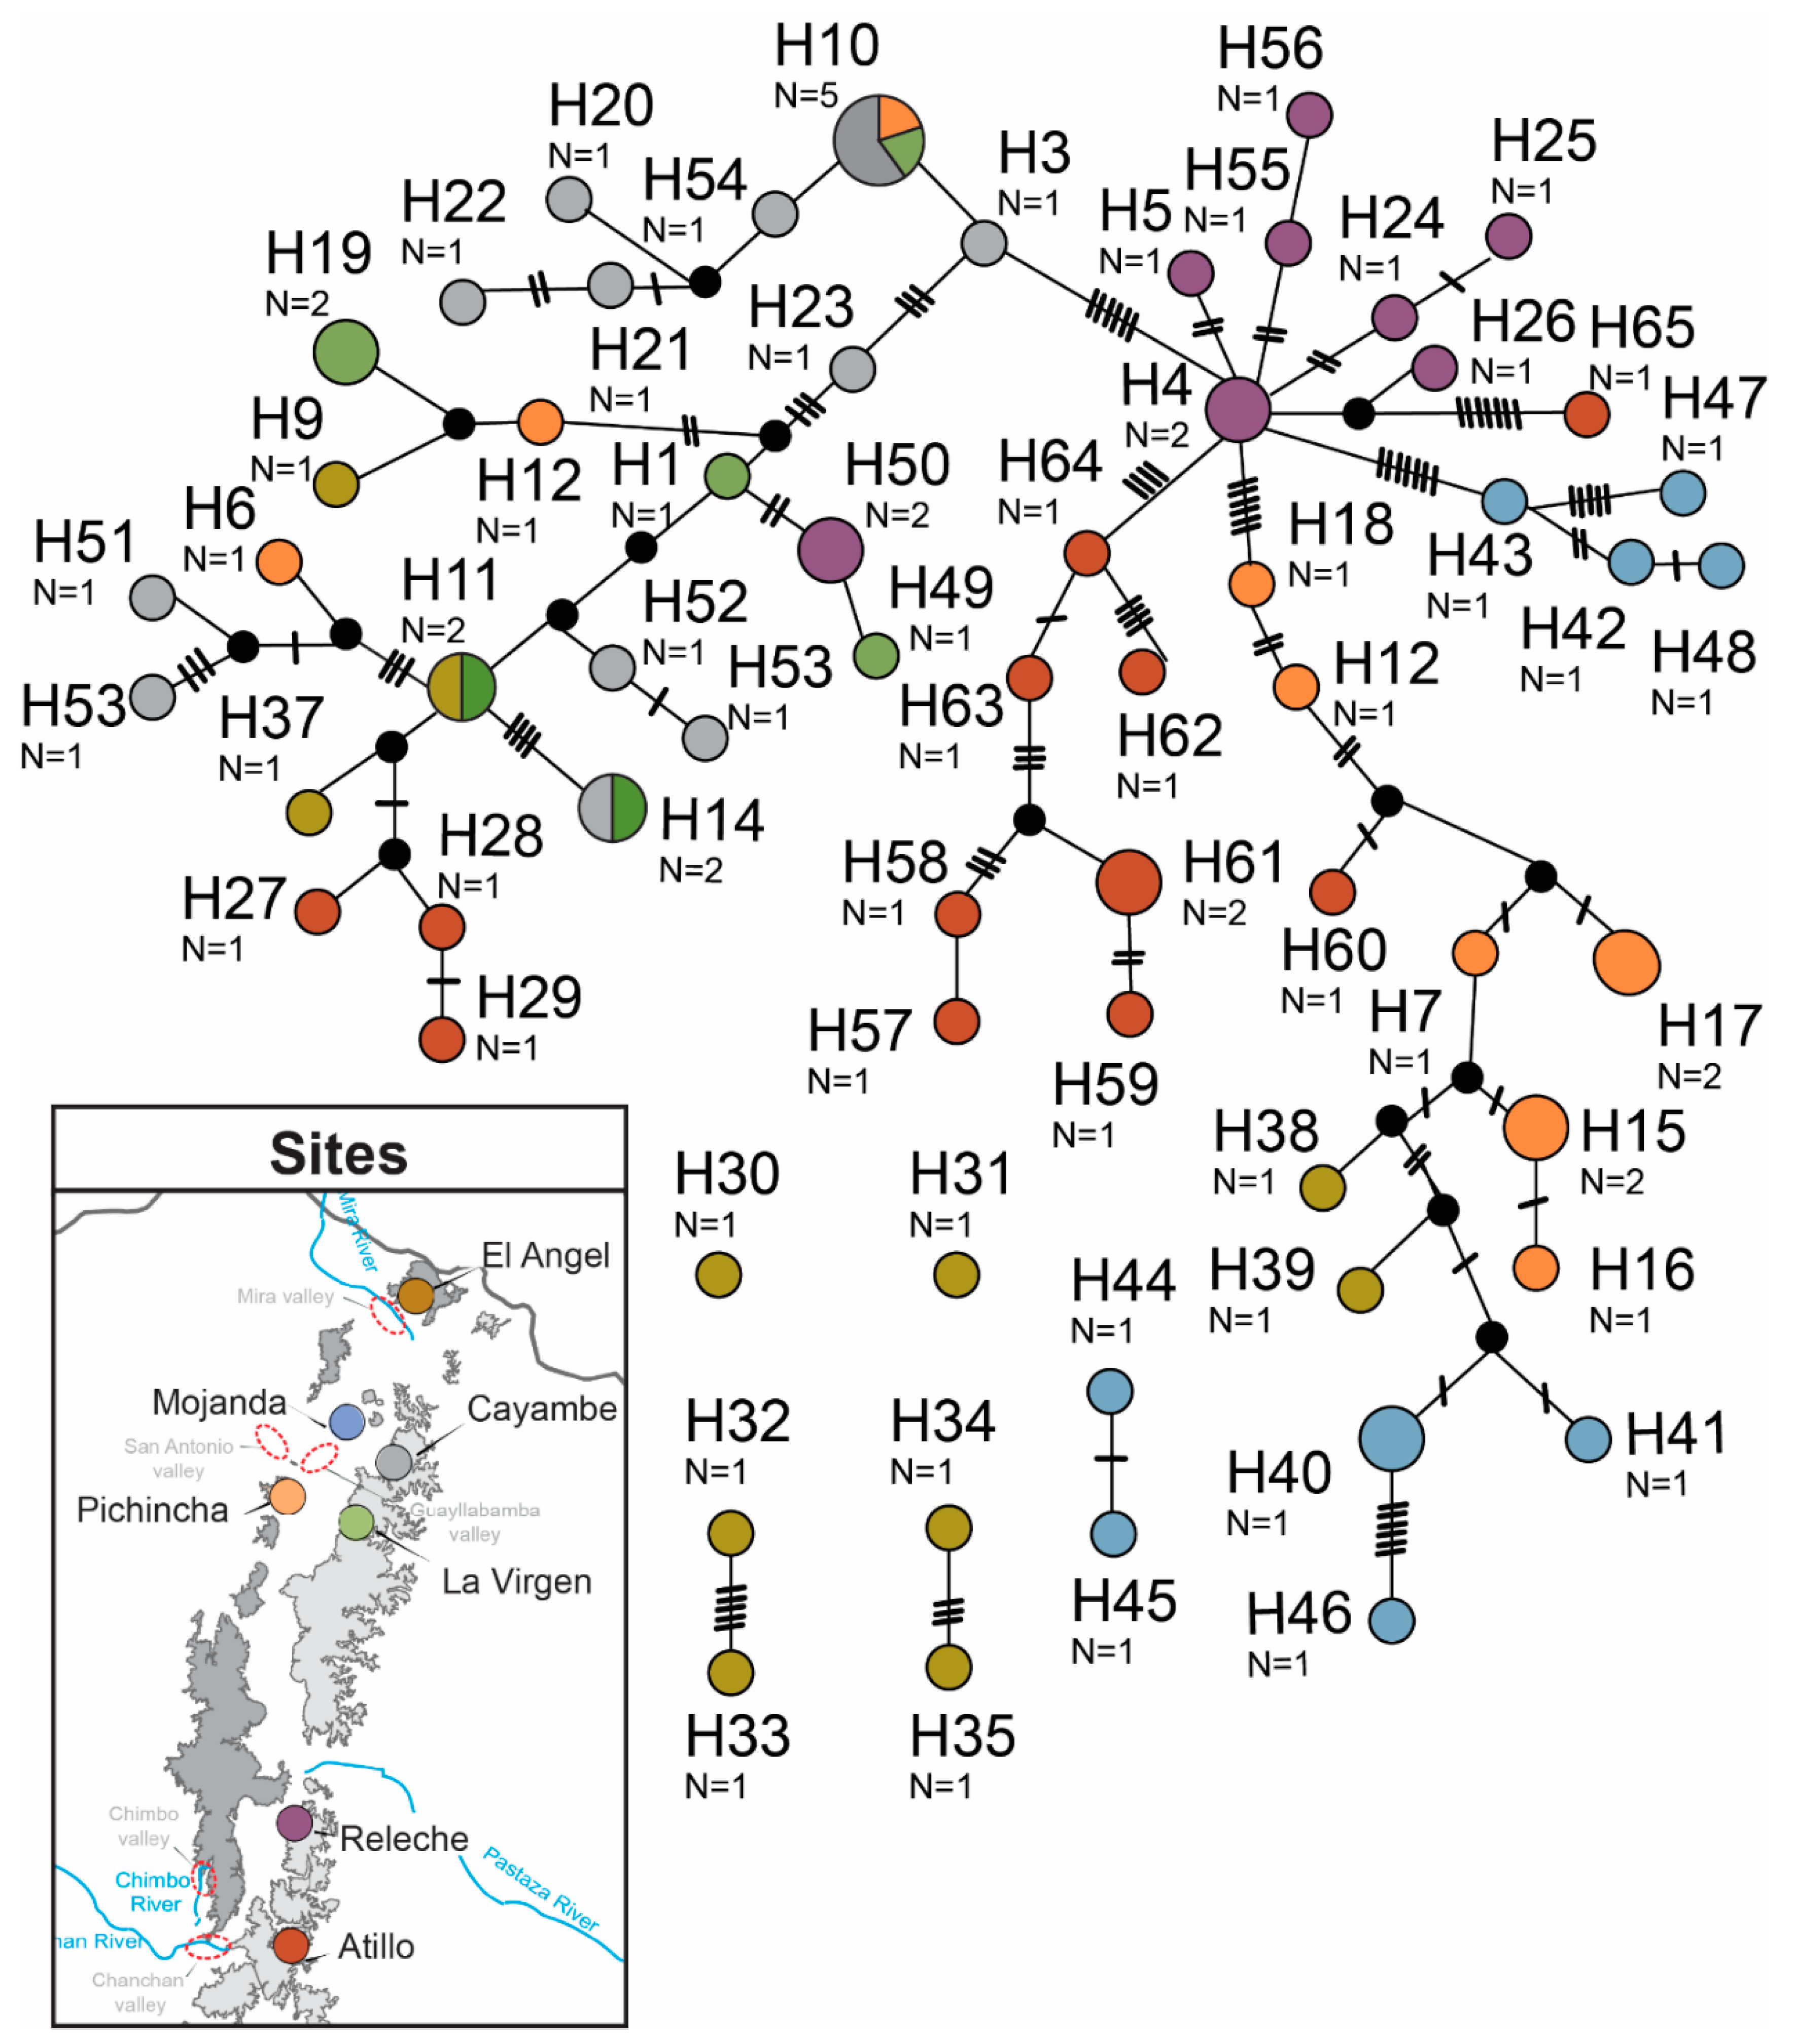
3.1. Sequence Data and Polymorphisms

Sampling from litter resulted in the collection of 68 adult Panabachia from seven localities (Figure 1). For phylogenetic analyses, we used 10 individuals per site where possible (Table 1), although Releche only yielded seven individuals. The COI gene was amplified from 67 samples (GenBank accessions MN536369 to MN536434, Table 2), and the alignment of this gene had a total of 765 base pairs. Of the 765 base pairs, 240 were variable, 66 were parsimony informative (Table 3), and 30 distinct haplotypes were identified using TCS (Figure 2). The wingless gene was amplified from 62 individuals (GenBank accessions MK674898 to MK674959, Table 2). The alignment for this gene had 445 base pairs with 108 segregating sites from which 105 were parsimony informative (Table 3). A total of 65 alleles were identified in the wingless data set (Figure 3). Phased data showed that most individuals are homozygotic, with only 16 heterozygotic individuals. Amongst the two data sets, only a few haplotypes/alleles were shared among sites. Individuals from La Virgen shared COI haplotypes with individuals from Pichincha (H9), Atillo (H11) and Releche (H10) (see Figure 2). For the wingless data set, three alleles are shared among sites. One allele is shared by the northern populations of La Virgen, Cayambe and Pichincha (H10), and La Virgen shares alleles with el Angel (H11) and Cayambe (H15; Figure 3). The overall nucleotide diversity for each data set was low (wingless: π = 0.047, COI: π = 0.113; Table 3).

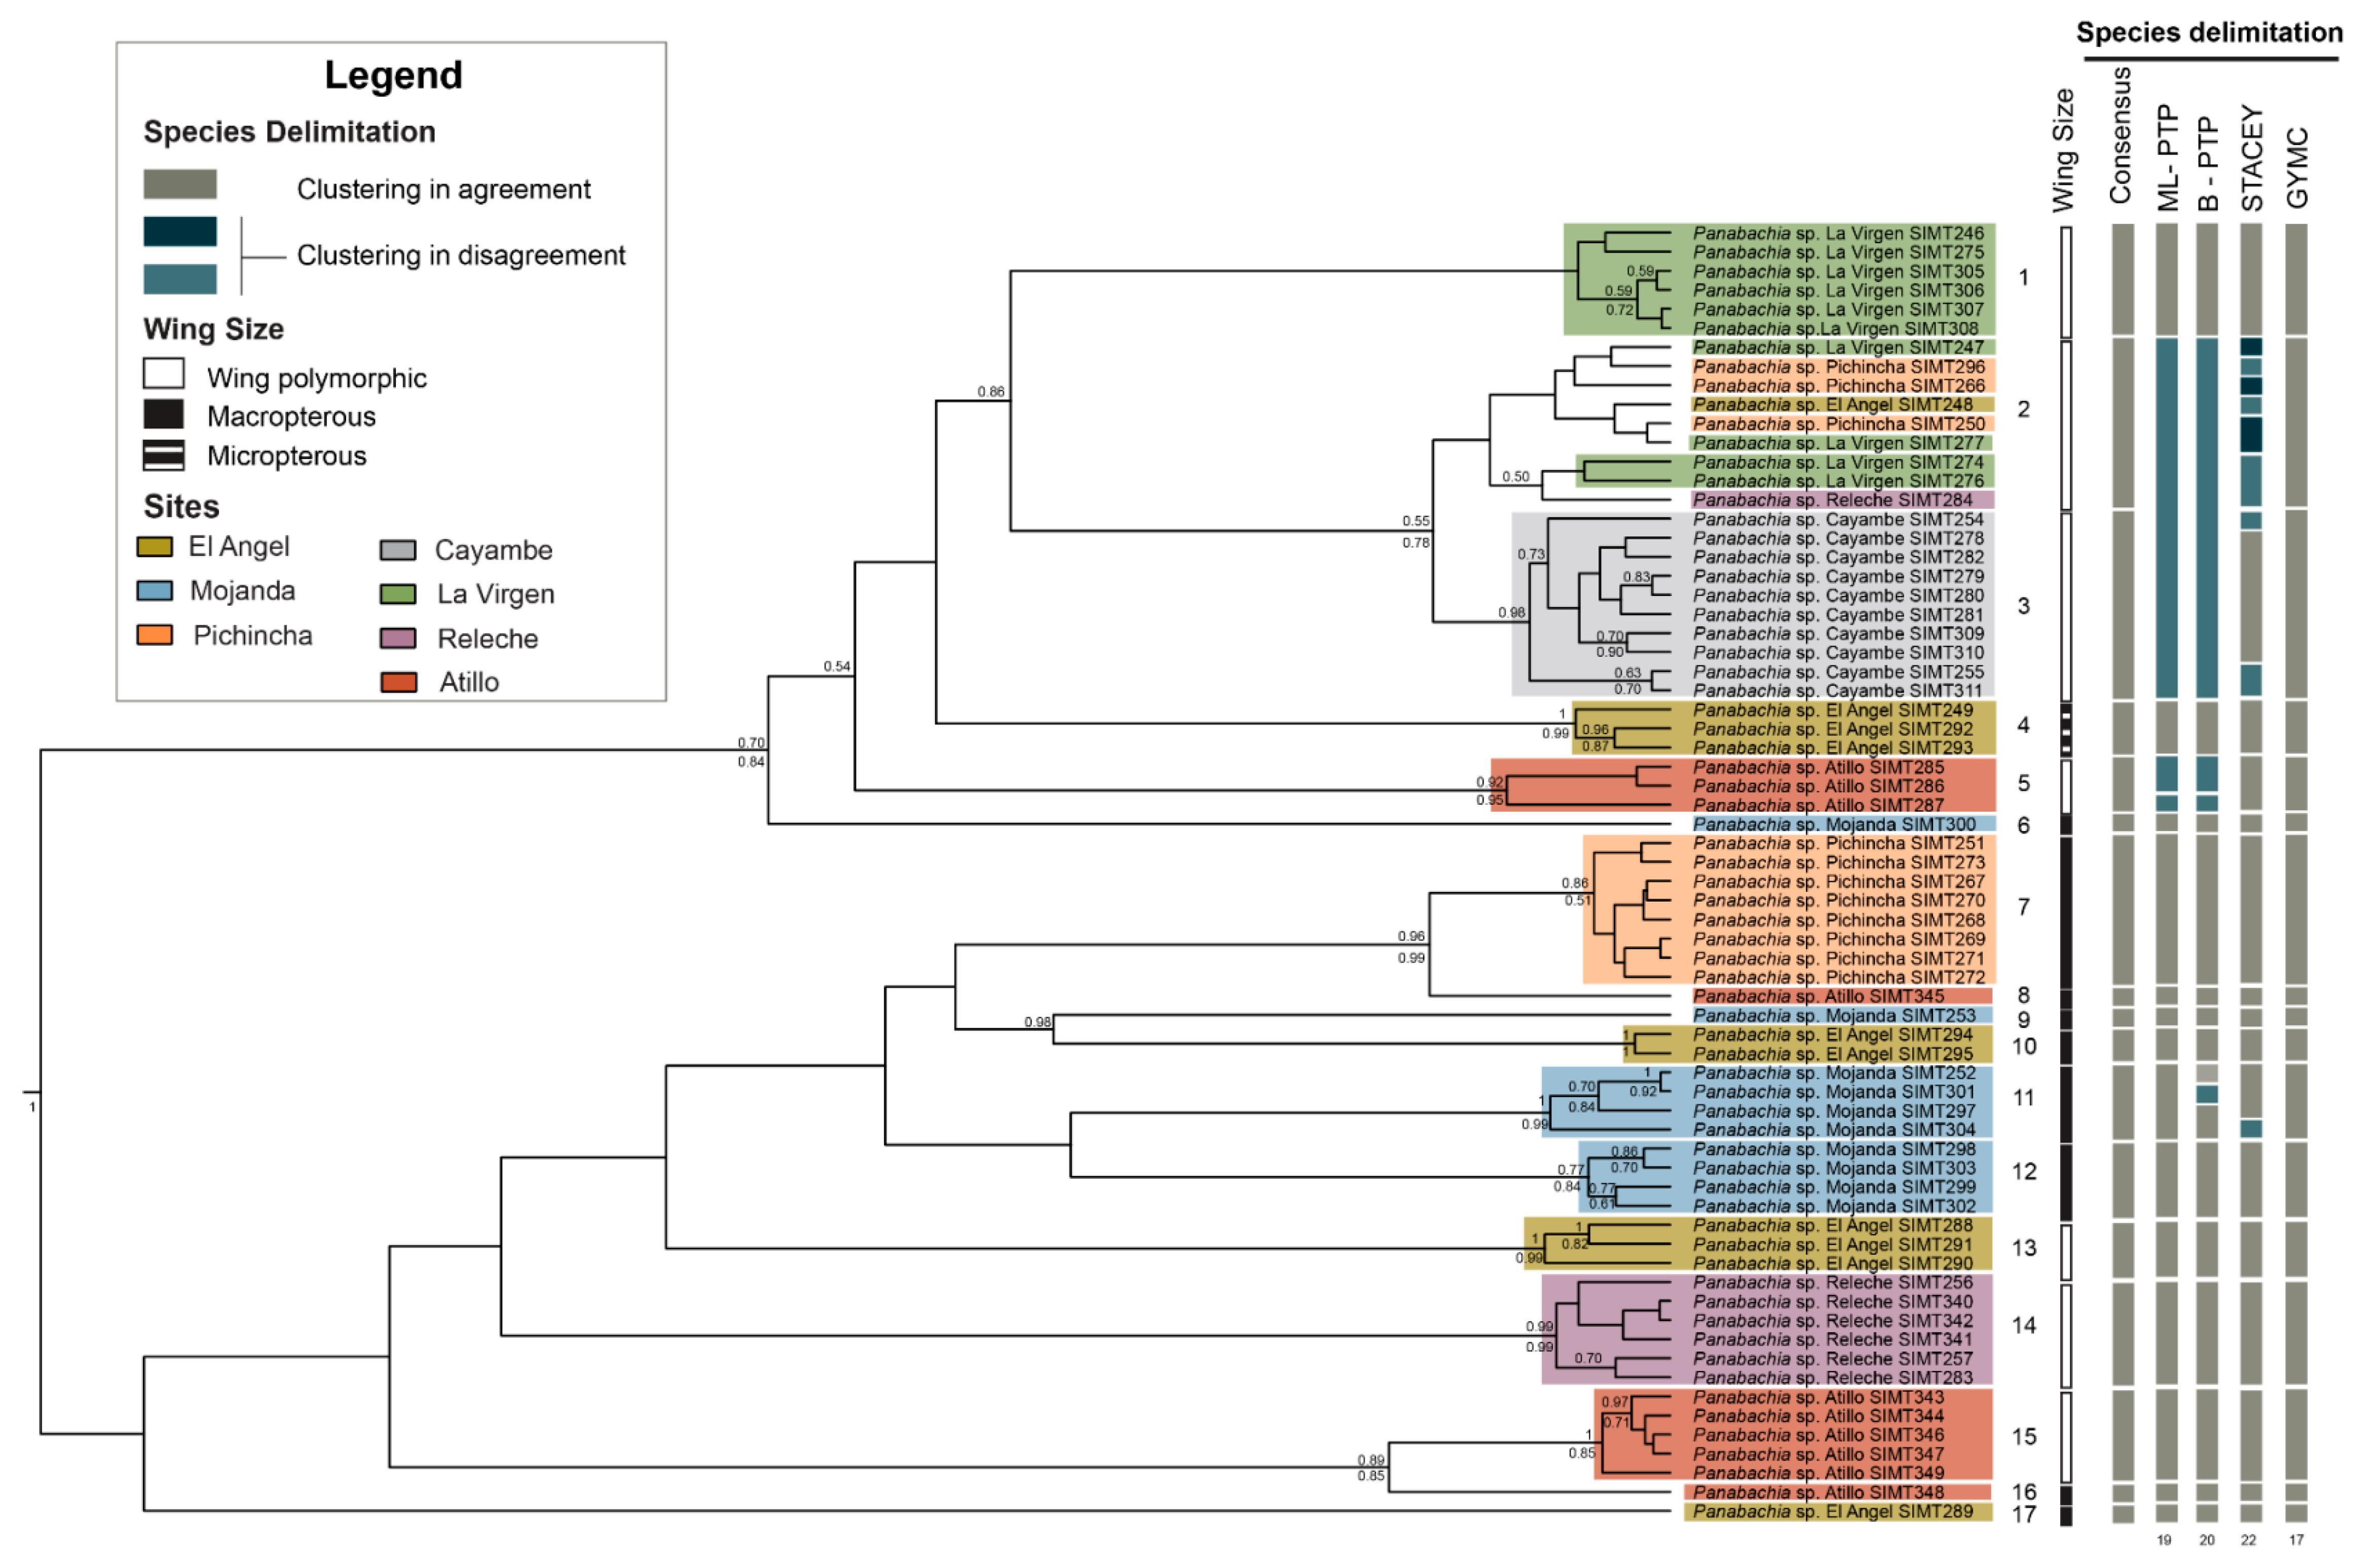
3.2. Species Delimitation Analyses

Results from single locus and multilocus analyses using three models of species delimitation are summarized in Figure 4. Multilocus analyses identified 17–22 putative species, with a high level of congruence for most groups. The single locus analyses, however, showed a high variation among outputs. Wingless showed a wide range of results depending on the method used: STACEY suggested 62 clades (out of 68 individuals); bPTP showed 51 clades but GMYC suggested only three species-level clusters (Figure S3). For the mitochondrial gene, results from bPTP and STACEY showed a higher level of correspondence with results from the multilocus analyses, with 20 clades identified in bPTP and 22 in STACEY. This was not seen in the GMYC analysis, where only four clades were observed (Figure S1).
For further interpretation of phylogenetic relationships and geographical distribution of genetic clusters, a conservative number of putative species (17) will be considered the most reasonable hypothesis (Figure 4). This hypothesis was based in part on the statistical support for each lineage in the phylogenetic inferences and the distribution of haplotypes in the TCS network analysis. We also assume that some splits observed in bPTP and STACEY multilocus analyses probably represent intraspecific variation; for example, for clade 11 from Mojanda (bPTP) and clade 3 from Cayambe (STACEY). This suggestion is based on the low number of mutations among these haplotypes in TCS analyses. This number of presumed species also corresponds well with preliminary morphological analyses: characters in the pronotum of the male, such distribution of the foveae and shape of the pronotum, show correspondence with the proposed groups (Figures S1 and S2). As of yet, not all putative species are represented by male specimens, so complete correspondence cannot be assessed. We were also able to trace the presence and absence of wings to assess potential dispersal ability for each proposed clade (Figure 4). We found that most clades are represented by macropterous specimens (clade 6–12 and 16–17). However, numerous wing polymorphic clades are found (clade 1–3, 5 and 13–15), where males are macropterous and females are micropterous. One clade was represented only by micropterous individuals (clade 4).

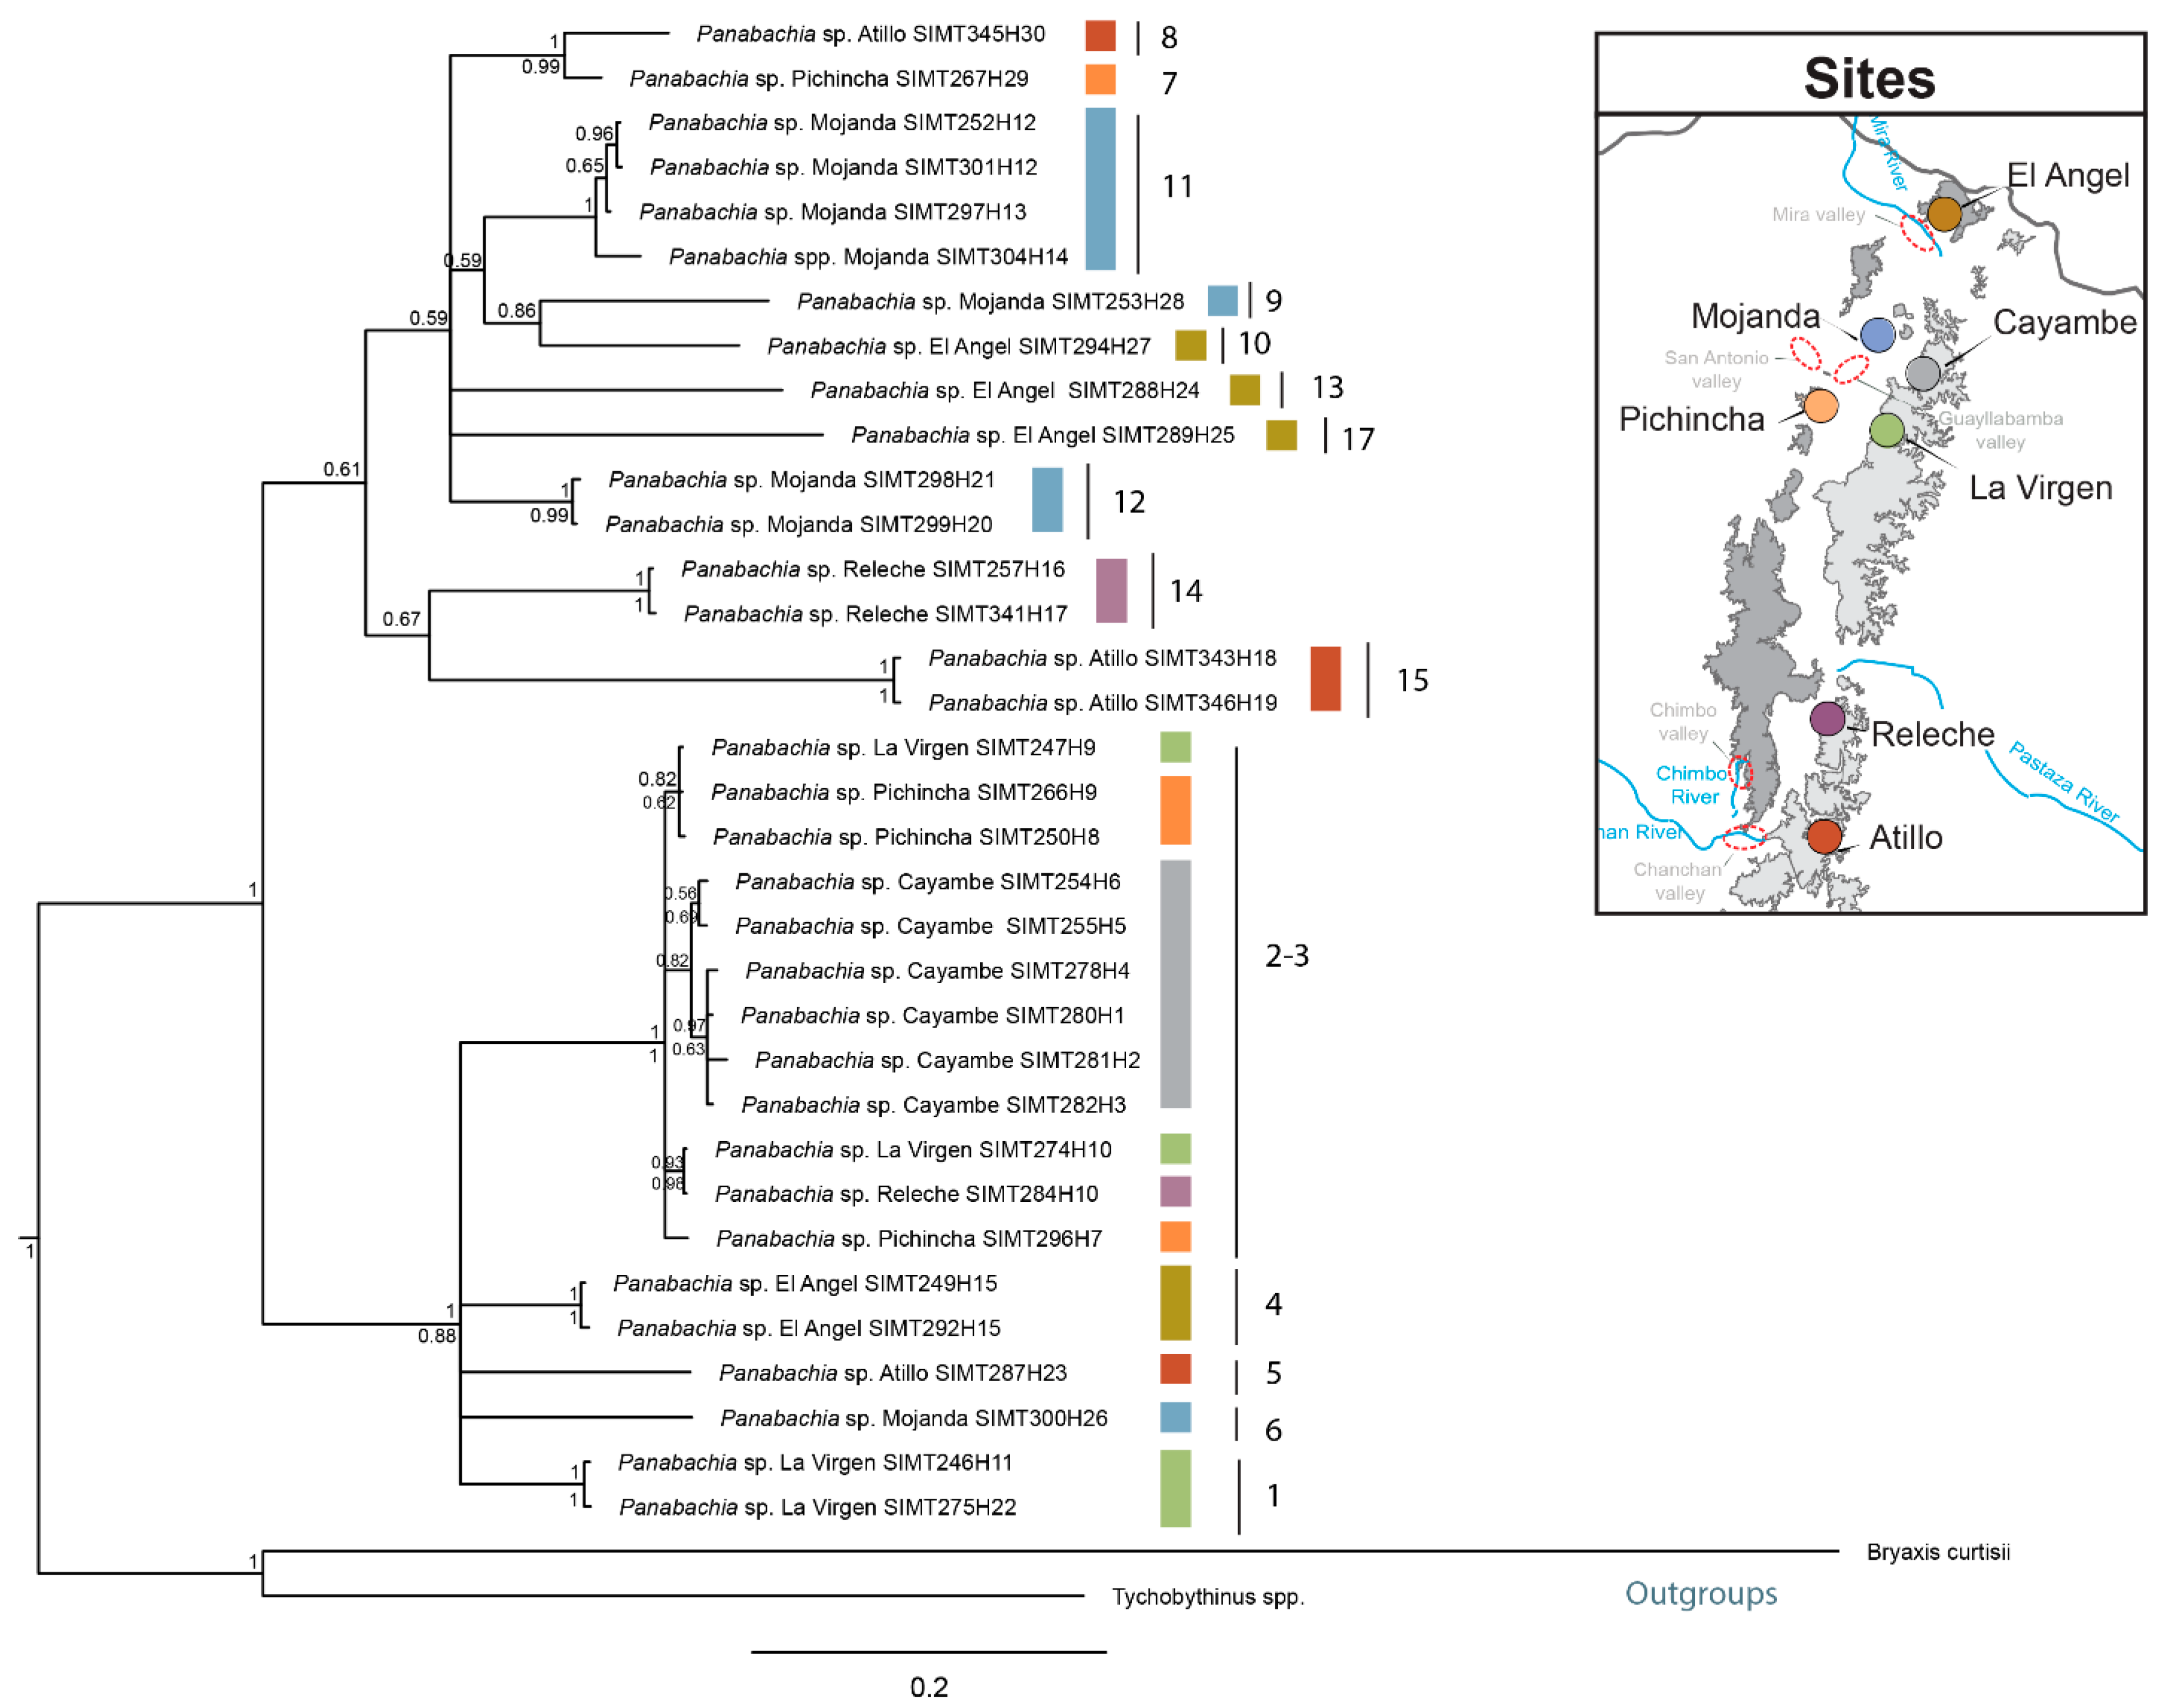
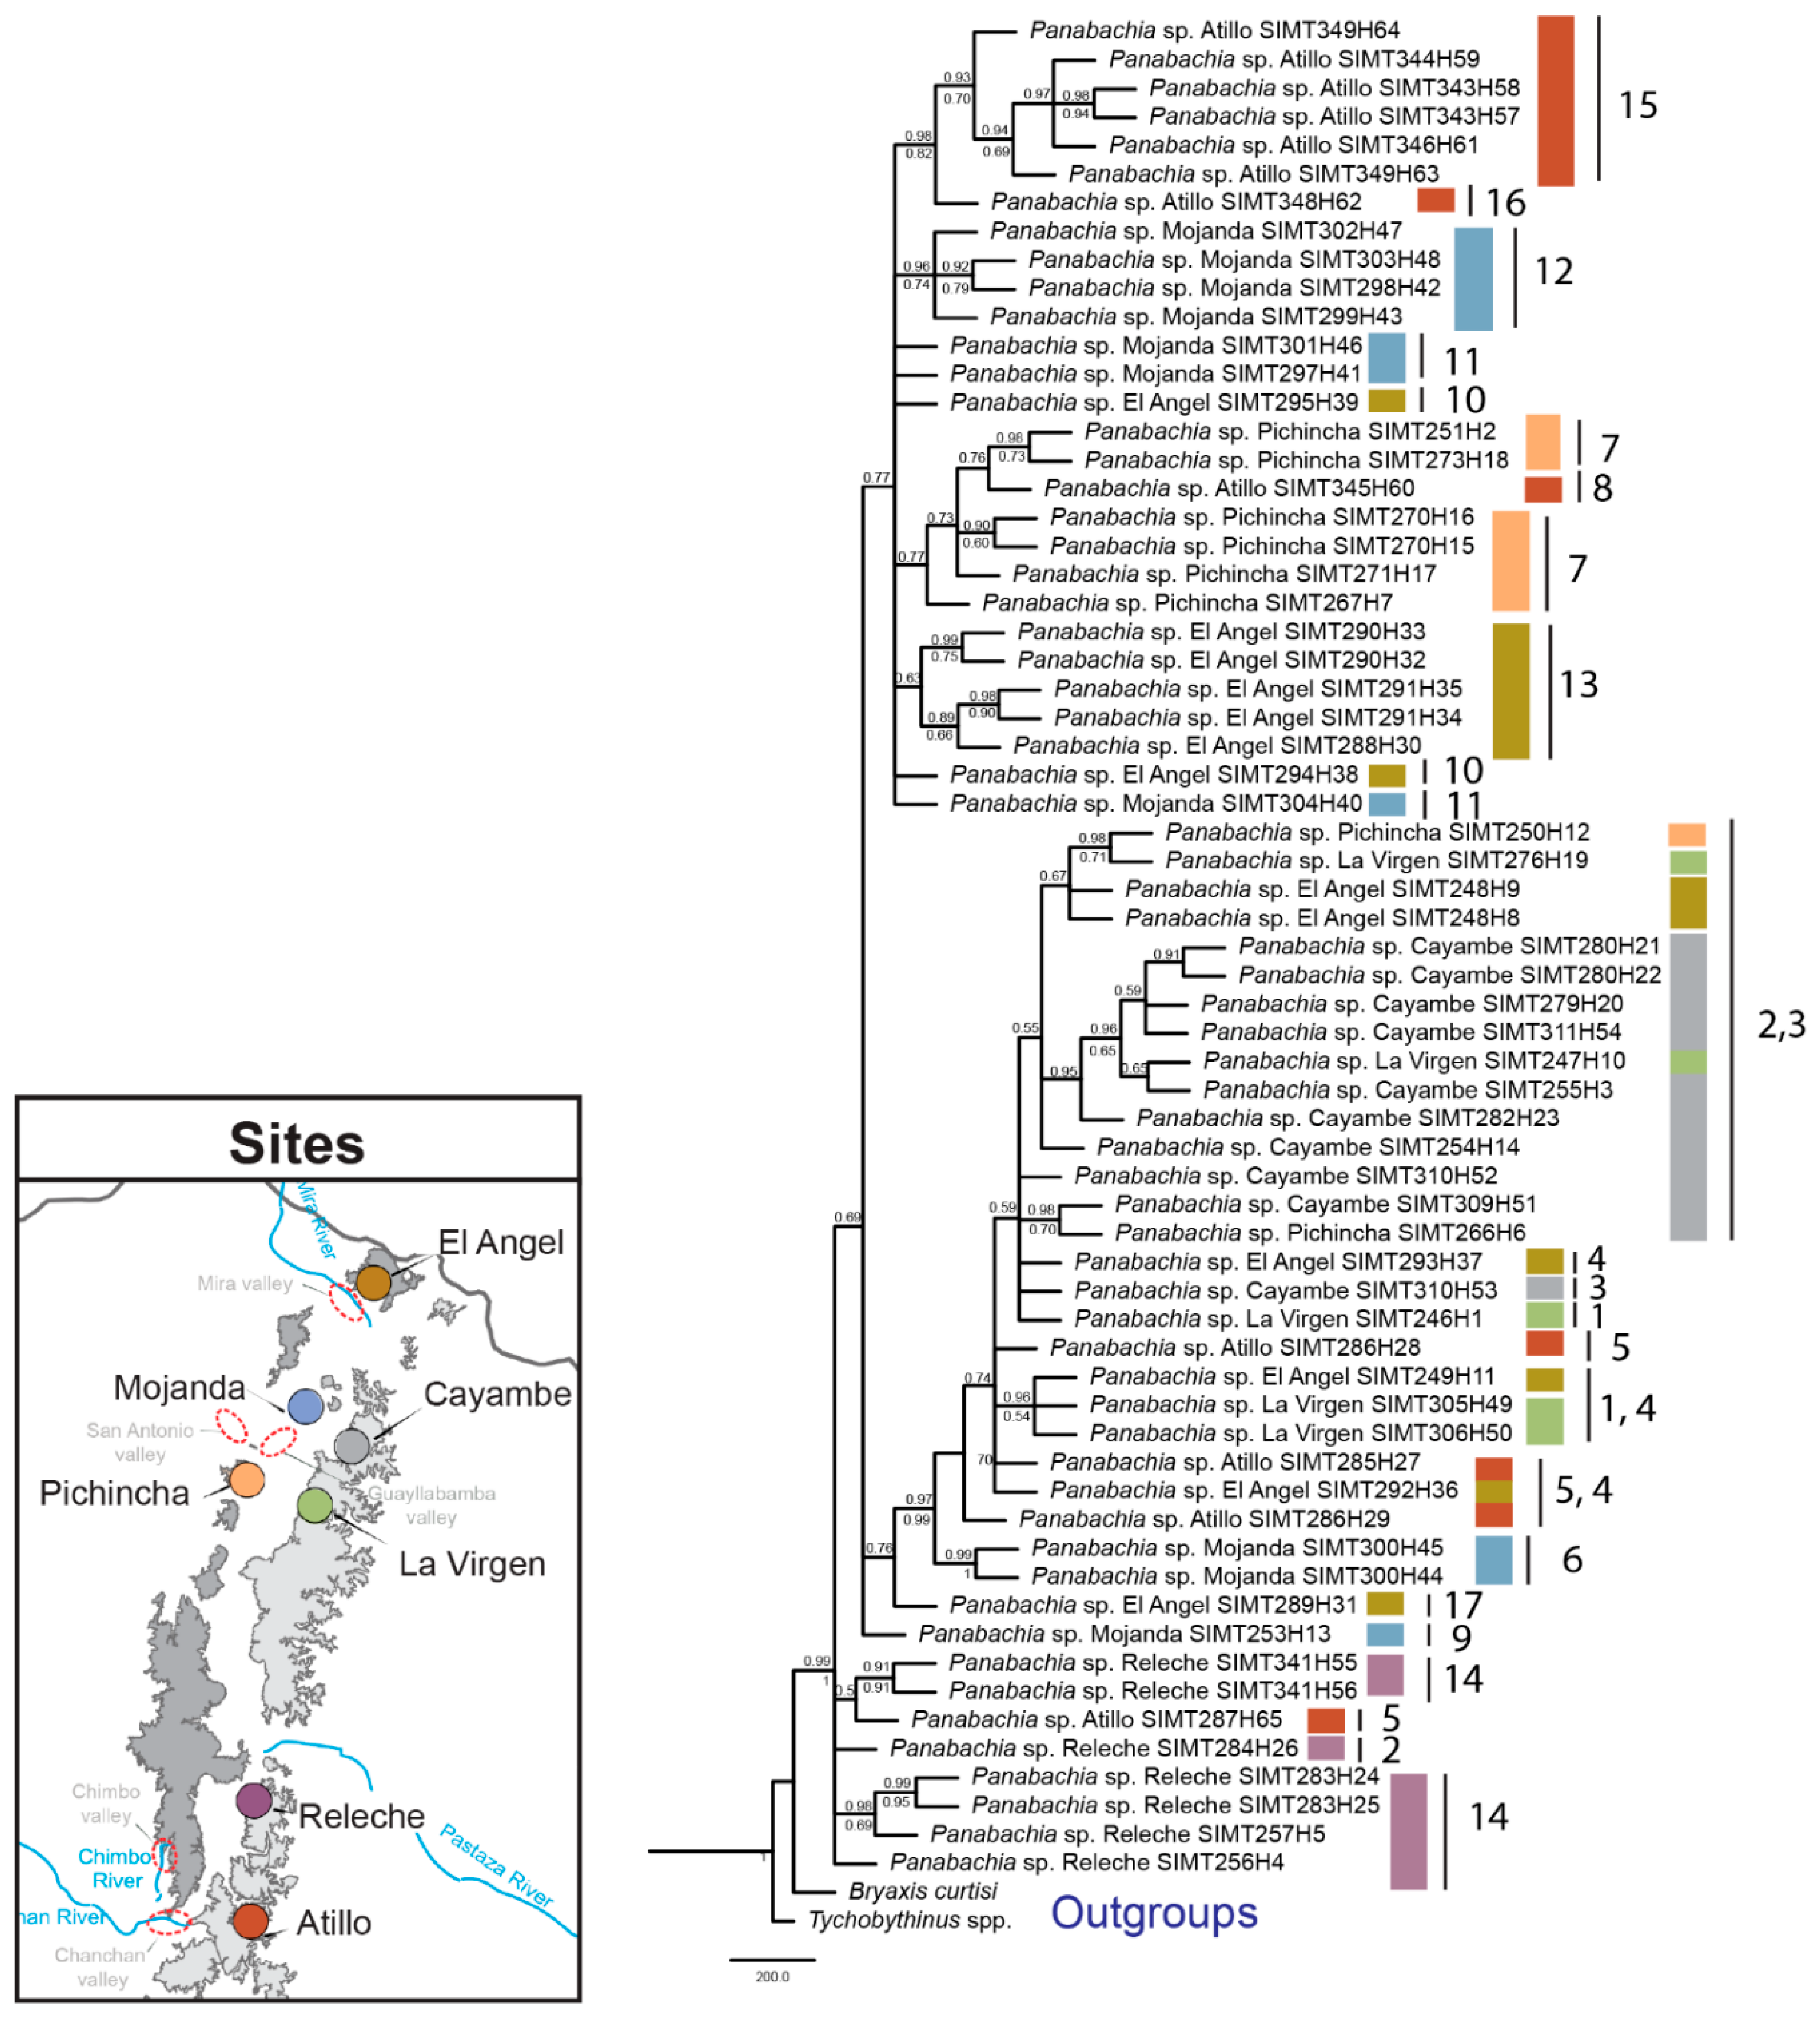
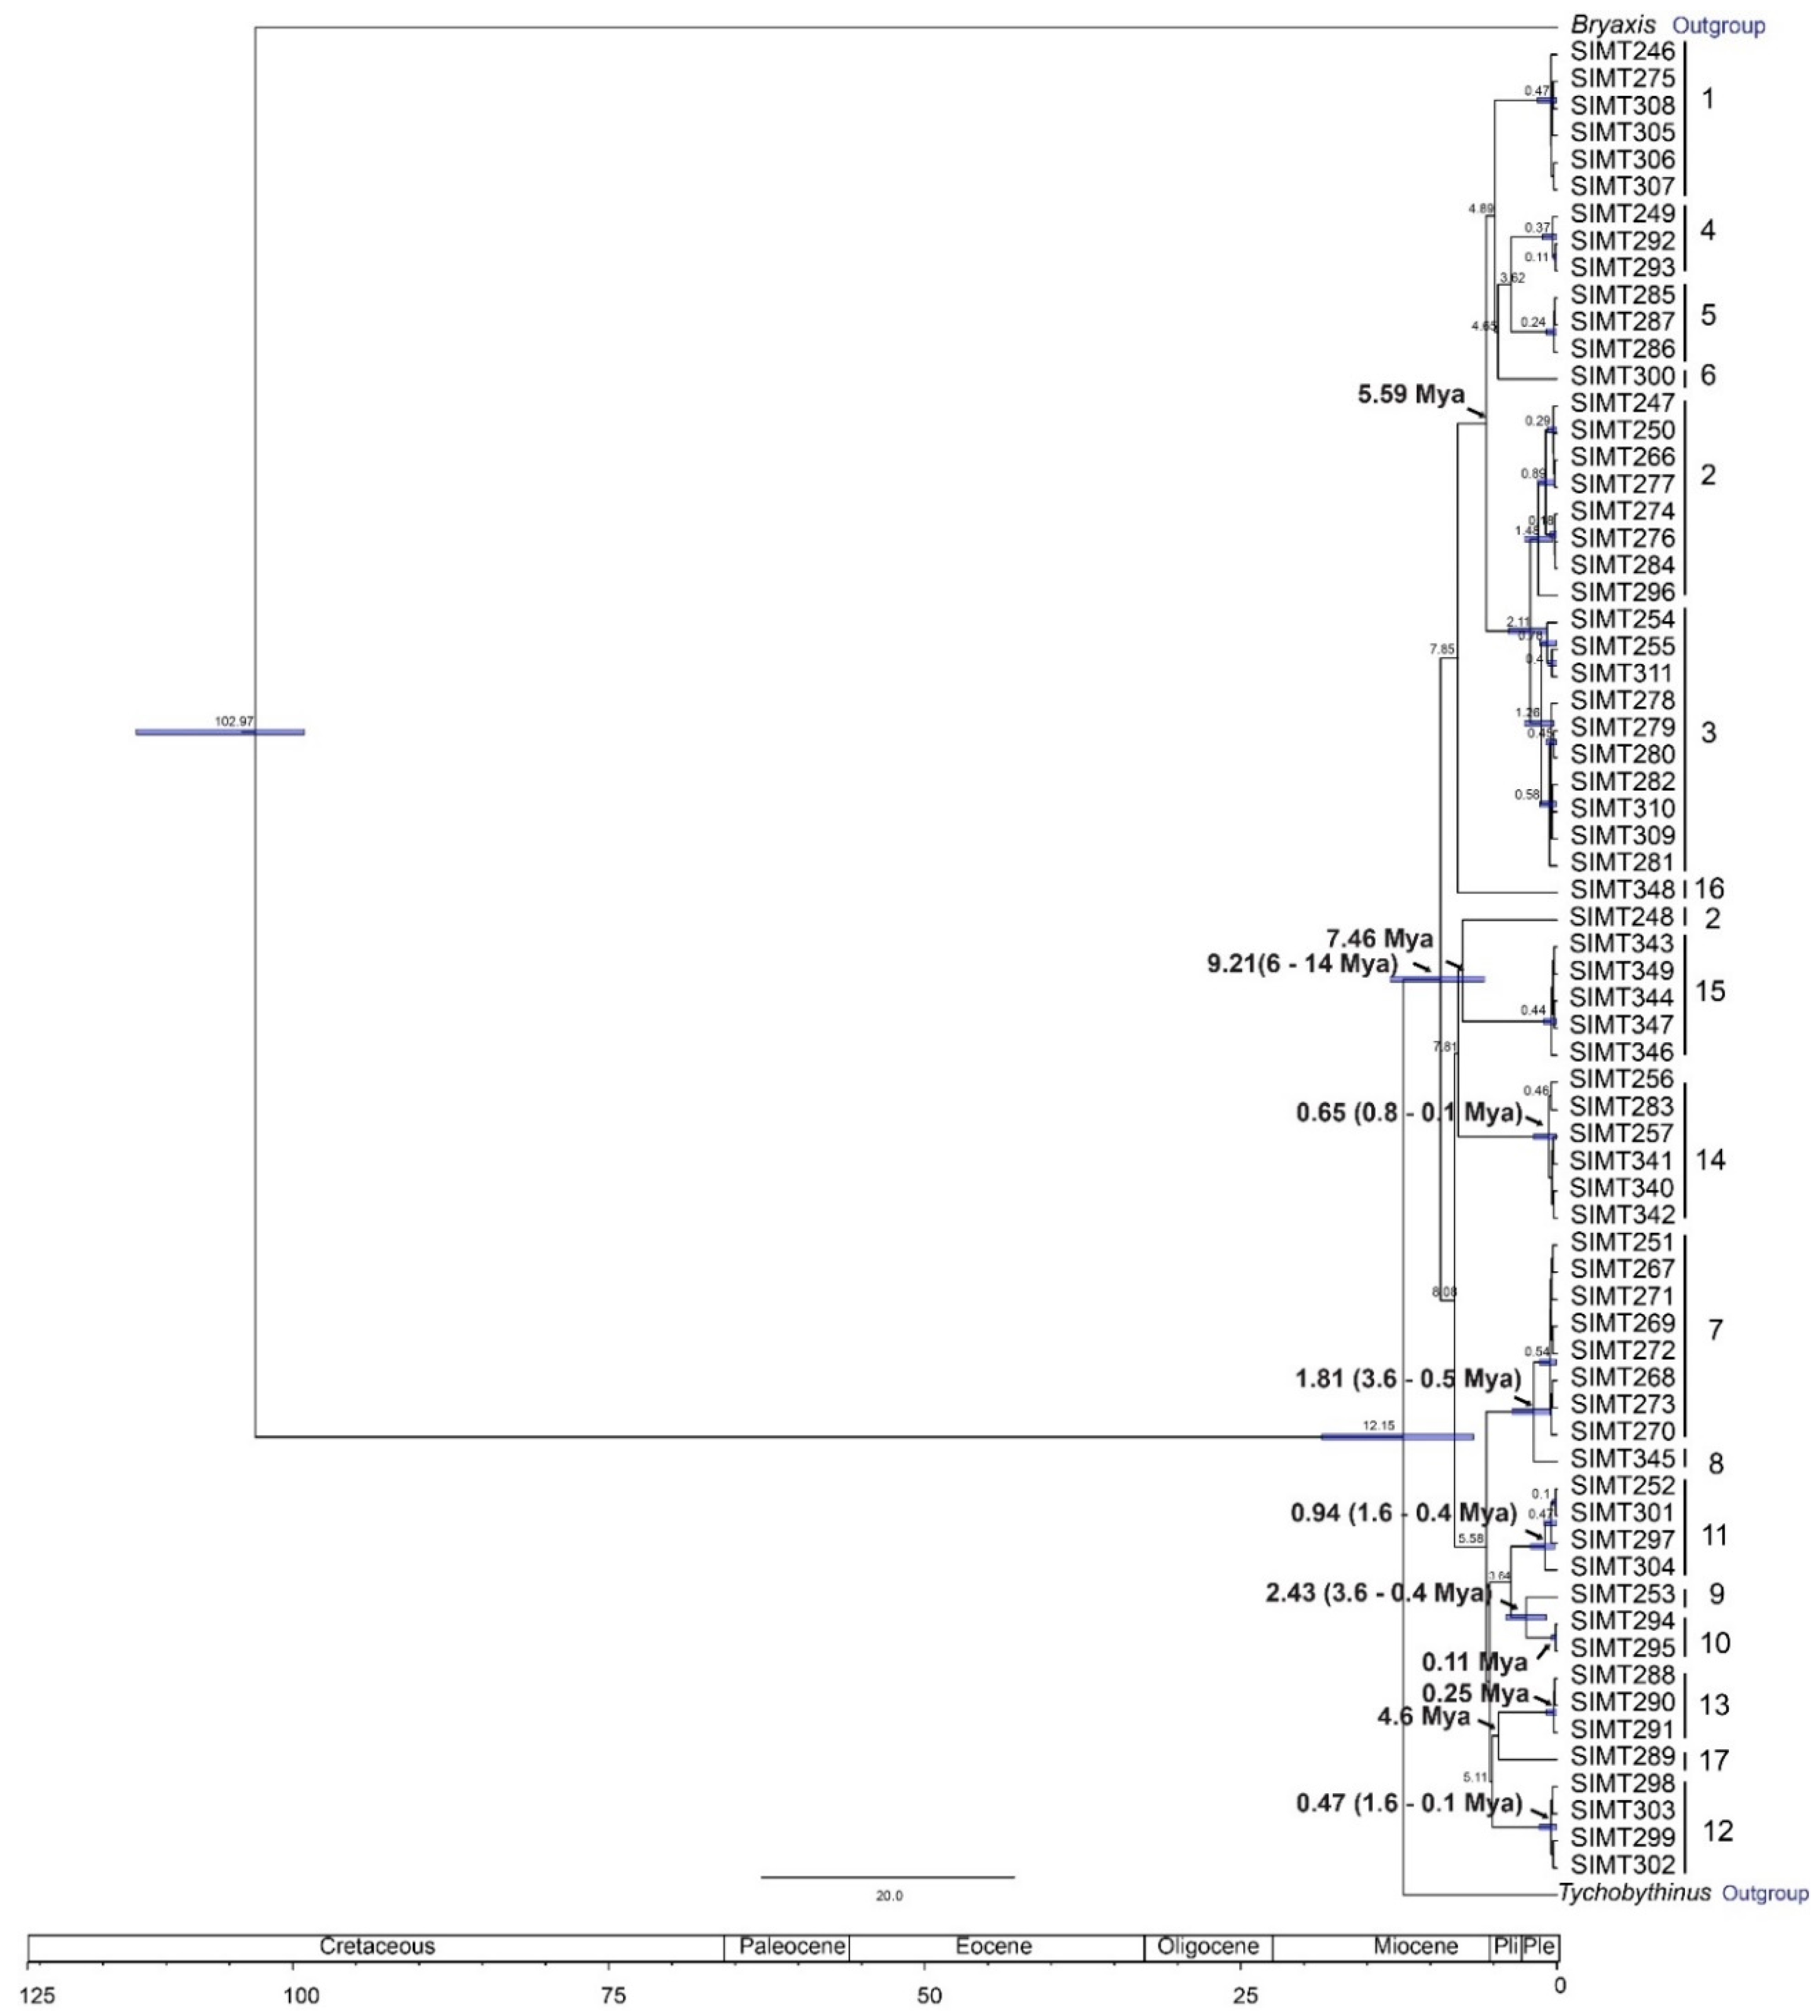
3.3. Phylogenetic Analyses and Divergence Time Estimates

Phylogenetic inferences generated through Maximum Likelihood and Bayesian methods show two separate clades in the combined data set tree as well for the COI gene tree (Figure 4 and Figure 5). Most putative species identified through species delimitation analyses appear to be well supported by bootstrap and posterior probability values (Figure 4). Exceptions are found for clades 1, 2 and 17, which do not have strong branch support (Figure 4). Gene trees did not recover all the genetic clusters observed in the species delimitation analyses (Figure 5 and Figure 6). For example, the COI gene tree shows strong bootstrap and posterior probability values for most putative species (Figure 5). But clades 2 and 3 are exceptions. In the case of the wingless gene tree, bootstrap and posterior probability values only support seven clades out of the 17 proposed (Figure 6), and multiple incongruences were found in this gene, contributing to the lower phylogenetic resolution, where clades 2, 3, 4, 5, 7, 11, and 14 appear at multiple points. In contrast, the COI tree only presented one incongruence, for individuals of clade 2. The COI tree topology largely resembles the combined data set result, where clade 2 is resolved as a single clade (Figure 4).
In reference to the distribution of putative species, clear geographical splits among sites were not detected in the phylogeny, since multiple species were identified for the majority of sites (e.g., four clades in Mojanda, Figure 4). Furthermore, the two main clades both include representatives across most of the area sampled (Figure 4). However, at a finer scale, some sister clades do show interesting allopatric disjunctions. This was the case of clade (Pichincha, W) and 7 (Atillo, E), separated by distance and side of the mountain range. The separation between clades 9 (Mojanda, W) and 10 (El Angel, W), separated by <70 km, spans the dry Mira River valley.
Divergence time estimates suggest that Panabachia in Ecuadorean páramo originated in the Miocene (9.2 Mya, Figure 7), and that most of the proposed species diverged during the Pliocene and Pleistocene (5.3–0.11 Mya). Two parallel radiations are observed through phylogenetic analyses; these radiations started in the Miocene (8–7.85 Mya) and continued throughout the Pleistocene. The first radiation event (7.86–0.47 Mya) gave rise to clade 7–17, and its sister gave rise to clade 1–6 (4.65–0.24 Mya). This second radiation is composed mostly of northern groups (clades 1–4, and 6), with the exception of clade 5, represented by specimens collected in Atillo (SE). Clade 2 was also exceptional, in that it contained individuals from several sites (La Virgen, Pichincha, El Angel and Releche), the last of which is quite remote from the others.

4. Discussion

High elevation species are particularly interesting given the climatic diversity, high levels of isolation and complex geological history of mountain systems [4,9,56,57]. Yet, alpine beetle faunas from the Andes have only been superficially explored. Previous work in the Ecuadorian páramo has shown distinct patterns of genetic distribution in ground beetles, from higher population structure in flightless ground beetles [28] to high levels of genetic connectivity between populations of a macropterous species [27]. Still, the genetic diversity of other alpine beetle lineages from the Andes has not been assessed, leaving the question open as to whether other alpine insect lineages are following similar patterns as the ground beetles.
Species delimitation analyses facilitate the identification of distinct evolutionary lineages within a sample of individuals [51,52,58], and the use of multilocus genetic data has proven to be a powerful tool for delimiting species [58]. Yet, methods to delimit species vary greatly in parameters and outcomes, and the search for congruence across results from species delimitation models can provide more reliable hypotheses for species boundaries. Results from the species delimitation analyses show that Panabachia from páramo comprises a diversity of species; 17–22 putative species were identified with bPTP, STACEY and GMYC using a multilocus data set. The three models of species delimitation showed similar outcomes for most species clades (Figure 4). Clustering disagreement was only reported in four clades, where bPTP and STACEY tended to subdivide lineages more finely, showing 1–5 more clades than GMYC. Evidence from phylogenetic inferences suggests that some delimited species using bPTP and STACEY might actually represent intrapopulation variation. This seems to be the case for clade 11 from Mojanda, which is divided by bPTP into two species lineages. In clade 5, from Atillo, bPTP also recognizes two presumed species. This appears be the result of the occurrence of highly divergent genotypes in the wingless data set (3 haplotypes in the wingless data set vs 1 haplotype in the COI data set). For clades 2 and 3, a total of one, two, or four species clades are recognized, depending on algorithm (bPTP, GMYC, or STACEY, respectively). Based on clade support and distribution of haplotypes in TCS, these individuals appear to represent two distinct species clusters.
More broadly, páramo Panabachia appear to represent two parallel radiations, at least by COI and the combined data (Figure 4 and Figure 5), though relationships within each are not clearly resolved. Divergence time estimates show that these radiations started during the Miocene (5.59–7.81 Mya), but 14 out of 17 putative species of Panabachia from páramo originated during the Pleistocene (0.11–4.6 Mya, Figure 7). These estimates are contemporary with the environment they live in, since the Andes reached its current elevation during the Pleistocene [1]. The increase in elevation created suitable conditions for the development of high elevation species [59], which are thought to have evolved from closely related lineages from the lowland tropical areas, as well as from lineages from temperate regions [9,60,61]. Studies of plant lineages from páramo also show accelerated rates of diversification during this period of time [9].
The main factors that affect cladogenetic events are associated with geographical isolation or ecological shifts [62]. Although most of the genetic clusters of Panabachia are well supported by bootstrap and posterior probability values, and represent distinct geographical areas, few phylogenetic relationships between clades are adequately supported to connect to geological events or features. Some correspondence with geography was found in the COI gene tree (Figure 5). For example, the split between species 8 and 7 spans opposite sides of the mountain range (Atillo and Pichincha). However, most of the speciation events with well supported branches show divergence between presumed species on the same sides of the mountain ranges but separated by distance (clades 9–10 and 14–15). In some instances, for example between clade 9 and 10, the distance might be reinforced by the presence of a putative barrier (Mira river and valley).
While allopatric speciation might explain some of the patterns in Panabachia from páramo, it does not explain the high number of sympatric clades found in El Angel (4), Mojanda (4) and Atillo (3). Climatic oscillation during the Pleistocene glaciations and topographic characteristics of each cordillera appear to influence the level of connectivity and fragmentation of populations across the northern Andes [5]. Understanding the timing of local geological events might give us insight into the factors that influence diversity in these sites; for example, volcanic activity dates to 10,000 years BP in Mt. Mojanda and Mt. Fuya in Mojanda, and Mt. Chiles in El Angel [63,64]. For Atillo, evidence for the presence of small glaciers during the Pleistocene and Holocene was found on Mt. Ayapungo (4730 m) and Mt. Coyay (4630 m) [65], mountains that are adjacent to Atillo. The increased number of putative species of these particular sites could be the result of multiple re-colonization events from adjacent areas during recent environmental fluctuations, as seen in other mountain systems [66,67].
Apart from the effect of environmental conditions and ecological interactions, the dispersal ability of each beetle lineage plays an important role in species diversification [28,68,69,70]. From previous studies done in ground beetles from páramo, we understand that the loss or reduction of wings can promote diversification events for some beetle lineages [28]. This appears not to be a factor for most putative species of Panabachia from páramo, where more than half of the proposed species are macropterous (56%, Figure 4). Still, wing polymorphic species of Panabachia represent a substantial proportion of the assessed clades (41%, Figure 4), where males are macropterous and females are micropterous or brachypterous. Yet, distinct wing morphologies are not restricted to a geographical area, and both wing polymorphic and macropterous groups can be found in the same sites. Further sampling and a better understanding of the distributional range and natural history of each species is needed to assess whether dispersal ability is a significant driver of diversification of this beetle lineage.
The high diversity found in Panabachia might be associated with the high diversity of leaf litter types sampled. These included decomposing grass leaves and roots, Polylepis and Compositae leaf litter, and moss over rocks and rotten wood. This microhabitat diversity is related to the high diversity of plants and plants forms (from cushion plants and shrubs, to herbaceous rosettes) páramo presents [60,71]. However, microhabitat-focused sampling has not been systematic enough to measure correspondence of putative species of Panabachia with particular types of leaf litter. More focused sampling and more information about the natural history of the group will be needed to determine if any such associations are related to diversification rates.
In comparison with patterns found among ground beetles from páramo, Panabachia from páramo diverged in more recent times (mostly in the Pleistocene). Most ground beetle species from Ecuadorian páramo evolved during the Miocene, prior to the evolution of this ecosystem (~6–20 Mya) [27,28]. Phylogeographic breaks in Panabachia are not as clear as in the Dercylus lineage (Carabidae, Harpalinae), where the presence of geographical barriers (e.g., rivers, dry valleys and mountain range) had a great effect on the pattern of speciation of this group [28]. Yet, most of the proposed species within the Panabachia lineage do represent restricted geographical areas.
When the diversity of Panabachia is compared to the widely distributed Pelmatellus columbianus (11.19 Mya, Carabidae, Harpalinae), clade 2 of Panabachia show similar patterns in the distribution of the genetic diversity, since members of this clade are present across multiple sites. Preliminary analyses of the population structure of species 2 (not shown), suggest Releche represents a distinct genetic cluster. We found incongruence among gene trees for an individual from Releche (SIMT284), which in the COI gene tree is grouped with clade 2, while in the wingless tree is found as sister to clade14. Hence, a more comprehensive analysis will require additional samples from each population to determine if this clade represents one or two proposed species. Nevertheless, widely distributed species of ground beetles have been reported at the same sites as this widespread clade of Panabachia. Such is the case in Pelmatellus columbianus (Cayambe, La Virgen, Pichincha, Releche) and Dyscolus alpinus (Cayambe, Pichincha, La Virgen [28], which suggests similar factors are affecting the distribution of these northern beetle lineages. In particular, the effect of Quaternary glaciation might have enabled gene flow between sites now isolated by elevation [14].
The study of multiple beetle lineages from páramo is slowly providing a better understanding or the evolution of high elevation beetle faunas. An increasing number of studies have concentrated on ground beetle species from the Ecuadorian Andes [17,72,73]. Other beetle lineages from páramo have been less studied, but results to date show that high elevation faunas tend to have an elevated number of endemic species [14,17,72,73,74]. Numerous putative species of Panabachia (those documented herein as well as others) have yet to be described, further underscoring the importance of conserving high elevation ecosystems. Although most of the sampled sites are already protected areas [75], many high elevation areas across the Ecuadorian Andes are not part of this network of national parks.

5. Conclusions

Overall, Panabachia represents a promising model for the study of diversification of beetles from high elevation areas in the Andes, considering its high interpopulational diversity and recent divergence (Pliocene and Pleistocene, 5.3–0.11 Mya). Through the use of three methods of species delimitation analyses and two molecular markers we were able to identify 17 putative species from seven sites in the Ecuadorian Andes. Assessed species appear to be restricted to small geographical ranges, with exception of one species clade present in multiple sites in the northern Ecuadorian Andes. The distribution of genetic diversity of Panabachia is complex, and a generalized pattern for alpine beetles of the Ecuadorian Andes has yet to emerge. Multiple factors appear to be shaping the genetic diversity of this beetle lineage, such as mountain isolation, habitat discontinuity and dispersal capability. The pattern of divergence observed across the tree topologies in this study certainly does not capture the entire genetic diversity of the Panabachia lineage, since sampling was only focused on isolated páramo patches. Further sampling (especially cloud and montane forest) and more information about the natural history of the species are needed to develop a more comprehensive picture of the distribution of phylogenetic diversity of Panabachia. The present study should provide a strong preliminary framework for more thorough systematic treatment of this diverse genus.

Supplementary Materials

The following are available online at https://www.mdpi.com/2075-4450/11/1/64/s1, Figure S1: Male morphological characters for clades 1 and 5, showing high morphological variation; Figure S2: Male morphological characters for clades 1 and 5, showing high morphological variation Figure S3: Single locus and multilocus species delimitation analyses for Panabachia.

Author Contributions

S.I.M.-T. and M.S.C. conceived the study research; S.I.M.-T. collected samples and conducted the labwork. S.I.M.-T. and M.S.C. analyzed the data. S.I.M.-T. and M.S.C. wrote and edited the manuscript. All authors have read and agreed to the published version of the manuscript.

Funding

This study was funded by the King Research Grant (Clemson University) and the Ecuadorian Secretary of Higher Education, Science, Technology and Innovation (SENESCYT).

Acknowledgments

We are thankful to the institutions who provided us with support for obtaining collection and export permits: Pontificia Universidad Católica del Ecuador and Ministerio del Ambiente de Ecuador. To individuals who assisted us during the field portion of this study: Shelley Langton-Myers, Andrés Romero-Carvajal and Rosario Tobar, and to Joseph Parker and Donald Chandler for helping identify samples used in this project.

Conflicts of Interest

The authors declare no conflict of interest.

References

  1. Gregory-Wodzicki, K.M. Uplift history of the Central and Northern Andes: A review. Geol. Soc. Am. Bull. 2000, 112, 1091–1105. [Google Scholar] [CrossRef]
  2. Veblen, T.T.; Young, K.R.; Orme, A. The Physical Geography of South America; Oxford University Press: New York, NY, USA, 2007; pp. 1–60. [Google Scholar]
  3. Hoorn, C.T.; Wesselingh, F.P.; Ter Steege, H.; Bermudez, M.A.; Mora, A.; Sevink, J.; Sanmartín, I.; Sanchez-Meseguer, A.; Anderson, C.L.; Figueiredo, J.P.; et al. Amazonia Through Time: Andean Uplift, Climate Change, Landscape Evolution, and Biodiversity. Science 2010, 330, 927–931. [Google Scholar] [CrossRef] [PubMed] [Green Version]
  4. Antonelli, A. Multiple origins of mountain life. Nature 2015, 524, 300–301. [Google Scholar] [CrossRef] [PubMed]
  5. Flantua, S.G.A.; O’Dea, A.; Onstein, R.E.; Giraldo, C.; Hooghiemstra, H. The flickering connectivity system of the north Andean páramos. J. Biogeogr. 2019, 46, 1808–1825. [Google Scholar] [CrossRef]
  6. Orme, A.R. The tectonic framework of South America. In The Physical Geography of South America; Veblen, T.T., Young, K.R., Orme, A.R., Eds.; Oxford University Press: New York, NY, USA, 2007; pp. 3–22. [Google Scholar]
  7. Schubert, C.; Clapperton, C.M. Quaternary Glaciations in the northern Andes (Venezuela, Colombia and Ecuador). Quat. Sci. Rev. 1990, 9, 123–135. [Google Scholar] [CrossRef]
  8. Ehlers, J.; Gibbard, P.L.; Hughes, P.D. Quaternary Glaciations–Extent and Chronology: A Closer Look; Elsevier: Oxford, UK, 2011; Volume 15, pp. 151–163. [Google Scholar]
  9. Madriñán, S.; Cortés, A.J.; Richardson, J.E. Páramo is the world’s fastest evolving and coolest biodiversity hotspot. Front. Genet. 2013, 4, 192. [Google Scholar] [CrossRef] [Green Version]
  10. Myers, N.; Mittermeier, R.A.; Mittermeier, C.G.; da Fonseca, G.A.; Kent, J. Biodiversity hotspots for conservation priorities. Nature 2000, 403, 853–858. [Google Scholar] [CrossRef]
  11. Villota, A.; Behling, H. Late Glacial and Holocene environmental change inferred from the paramo of Cajanuma in the Podocarpus National Park, Southern Ecuador. Caldasia 2014, 36, 345–364. [Google Scholar] [CrossRef] [Green Version]
  12. Hazzi, N.A.; Moreno, J.S.; Ortiz-Movliav, C.; Palacio, R.D. Biogeographic regions and events of isolation and diversification of the endemic biota of the tropical Andes. Proc. Natl. Acad. Sci. USA 2018, 115, 7985–7990. [Google Scholar] [CrossRef] [Green Version]
  13. Gómez-Gutiérrez, M.C.; Pennington, R.T.; Neavez, L.E.; Milne, R.I.; Madriñán, S.; Richardson, J.E. Genetic diversity in the Andes: Variation within and between the South American species of Oreobolus. Alp. Bot. 2017, 127, 155–170. [Google Scholar] [CrossRef]
  14. Mac Vean, C.; Schuster, J.C. Altitudinal Distribution of Passalid Beetles (Coleoptera, Passalidae) and Pleistocene Dispersal on the Volcanic Chain of Northern Central America. Biotropica 1981, 13, 29–38. [Google Scholar] [CrossRef]
  15. Muñoz-Mendoza, C.; D’Elia, G.; Panzera, A.; Villalobos-Leiva, A.; Sites, J.W., Jr.; Victoriano, P.F. Geography and past climate changes have shaped the evolution of a widespread lizard from the Chilean hotspot. Mol. Phylogenet. Evol. 2017, 116, 157–171. [Google Scholar] [CrossRef] [PubMed]
  16. Hooghiemstra, H.; Flantua, S.G.A. Colombia in the Quaternary: An overview of environmental and climatic change. In The Geology of Colombia; Gómez-Tapias, J., Pinilla-Pachon, A.O., Eds.; Servicio Geológico Colombiano, Publicaciones Geológicas Especiales: Bogota, Colombia, 2019; Volume 4, pp. 33–57. [Google Scholar]
  17. Anthelme, F.; Jacobsen, D.; Macek, P.; Meneses, R.I.; Moret, P.; Beck, S.; Dangles, O. Biodiversity Patterns and Continental Insularity in the Tropical High Andes Biodiversity patterns and continental insularity in the tropical High Andes. Arct. Antarct. Alp. Res. 2014, 46, 811–828. [Google Scholar] [CrossRef] [Green Version]
  18. Neil, D.A. Geología. In Catálogo De Las Plantas Vasculares Del Ecuador; Jorgensen, P.M., Leon-Yanez, S., Eds.; Monographs in Systematic Botany from the Missouri Botanical Garden: St. Louis, MO, USA, 1999; pp. 1–1181. [Google Scholar]
  19. Hodkinson, I.D. Terrestrial insects along elevation gradients: Species and community responses to altitude. Biol. Rev. 2005, 80, 489–513. [Google Scholar] [CrossRef] [Green Version]
  20. Dillon, M.E. Into thin air: Physiology and evolution of alpine insects. Integr. Comp. Biol. 2006, 46, 49–61. [Google Scholar] [CrossRef] [PubMed] [Green Version]
  21. Somme, L.; Block, W. Adaptations to Alpine and Polar Environments in Insects and Other Terrestrial Arthropods. In Insects at Low Temperature; Lee, R.E., Denlinger, D.L., Eds.; Springer Science & Business Media: New York, NY, USA, 1991; pp. 318–359. [Google Scholar]
  22. Helgen, K.M.; Kays, R.; Helgen, L.E.; Tsuchiya-jerep, M.T.N.; Pinto, C.M.; Koepfli, K.; Eizirik, E.; Maldonado, J.E. Taxonomic boundaries and geographic distributions revealed by an integrative systematic overview of the mountain coatis, Nasuella (Carnivora: Procyonidae). Carnivore 2009, 41, 65–74. [Google Scholar]
  23. Guayasamin, J.M.; Bonaccorso, E.; Duellman, W.E.; Coloma, L.A. Genetic differentiation in the nearly extinct Atelopus, with emphasis on the A. ignescens and A. bomolochos. Zootaxa 2010, 68, 55–68. [Google Scholar] [CrossRef]
  24. Hines, H.M. Historical biogeography, divergence times, and diversification patterns of bumble bees (Hymenoptera: Apidae: Bombus). Syst. Biol. 2008, 57, 58–75. [Google Scholar] [CrossRef]
  25. Elias, M.; Joron, M.; Willmott, K.; Silva-BrandÃo, K.L.; Kaiser, V.; Arias, C.F.; Piñerez, L.M.G.; Uribe, S.; Brower, A.V.Z.; Freitas, A.V.L.; et al. Out of the Andes: Patterns of diversification in clearwing butterflies. Mol. Ecol. 2009, 18, 1716–1729. [Google Scholar] [CrossRef]
  26. Maddison, D.R. An unexpected clade of South American ground beetles (Coleoptera, Carabidae, Bembidion). Zookeys 2014, 155, 113–155. [Google Scholar] [CrossRef] [Green Version]
  27. Muñoz–Tobar, S.I. Weak Genetic Differentiation among Populations of the Andean Ground Beetle Pelmatellus columbianus (Reiche, 1843) (Coleoptera: Carabidae). Coleopt. Bull. 2019, 73, 411–427. [Google Scholar] [CrossRef]
  28. Muñoz–Tobar, S.I.; Caterino, M.S. The role of dispersal for shaping phylogeographical structure of flightless beetles from the Andes. PeerJ 2019, 7, e7226. [Google Scholar] [CrossRef] [PubMed] [Green Version]
  29. Graham, C.H.; Carnaval, A.C.; Cadena, C.D.; Zamudio, K.R.; Roberts, T.E.; Parra, J.L.; Mccain, C.M.; Bowie, R.C.K.; Moritz, C.; Baines, S.B.; et al. The origin and maintenance of montane diversity: Integrating evolutionary and ecological processes. Ecography 2014, 37, 711–719. [Google Scholar] [CrossRef]
  30. Newton, A.F. Beetles (Coleoptera) of Peru: A Survey of the Families. Mycteridae Blanchard, 1845. J. Kansas Entomol. Soc. 2015, 89, 283–304. [Google Scholar]
  31. Thayer, M.K. Staphylinidae Latreille, 1802. In Coleoptera, Beetles. Volume 1: Morphology and Systematics (Archostemata, Adephaga, Myxophaga, Polyphaga Partim); Kristensen, P., Beutel, R.G., Eds.; Walter de Gruyter: Berlin, Germany; New York, NY, USA, 2005; pp. 296–344. [Google Scholar]
  32. Asenjo, A.; Irmler, U.; Klimaszewski, J.; Chandler, D.S.; Fierros-López, H.E.; Vieira, J.S. Staphylinidae (Insecta: Coleoptera) in Latin America: Synopsis, annotated catalog, diversity and distribution. Zootaxa 2019, 4621, 1–406. [Google Scholar] [CrossRef]
  33. Sánchez-Baracaldo, P.; Thomas, G.H. Adaptation and convergent evolution within the JamesoniaEriosorus complex in high–elevation biodiverse andean hotspots. PLoS ONE 2014, 9, e110618. [Google Scholar] [CrossRef]
  34. Hubb, N.; Lllambi, L.D.; Ramirez, L.; Callaway, R.M. Alpine cushion plants have species–specific effects on microhabitat and community structure in the tropical Andes. ARPN J. Eng. Appl. Sci. 2017, 28, 928–938. [Google Scholar]
  35. Park, O. A Study in Neotropical Pselaphidae; Pantagraph Press: Bloomington, IN, USA, 1942; pp. 125–153. [Google Scholar]
  36. Navarrete-Heredia, J.L.; Newton, A.F.; Thayer, M.K. Guia Ilustrada Para Los Géneros de Staphylinidae (Coleoptera) de Mexico; Universidad de Guadalajara; Comission Nacional para el Conocimiento y Uso de la Biodiversidad (CONABIO): Guadalajara, Mexico, 2002; pp. 53–89.
  37. Sharp, D. Insecta, Coleoptera Volume 1, Part 2. In Biologia Centrali-Americana; Godman, F.D., Savin, O., Eds.; Taylor & Francis: London, UK, 1887; pp. 30–31. [Google Scholar]
  38. Newton, A.F.; Chandler, D.S. World catalog of the genera of Pselaphidae (Coleoptera). Fieldiana Zool. New Ser. 1989, 53, 1–93. [Google Scholar]
  39. Simon, C.; Frati, F.; Beckenbach, A.; Crespi, B.; Liu, H.; Flook, P. Evolution, weighting, and phylogenetic utility of mitochondrial gene sequences and a compilation of conserved polymerase chain reaction primers. Ann. Entomol. Soc. Am. 1994, 87, 651–701. [Google Scholar] [CrossRef]
  40. Caterino, M.S.; Tishechkin, A.K. New genera and species of Neotropical Exosternini (Coleoptera, Histeridae). Zookeys 2014, 78, 11–78. [Google Scholar] [CrossRef] [Green Version]
  41. Wild, A.L.; Maddison, D.R. Evaluating nuclear protein–coding genes for phylogenetic utility in beetles. Mol. Phylogenet. Evol. 2008, 48, 877–891. [Google Scholar] [CrossRef] [PubMed]
  42. Parker, J.; Grimaldi, D.A. Specialized myrmecophily at the ecological dawn of modern ants. Curr. Biol. 2014, 24, 2428–2434. [Google Scholar] [CrossRef] [PubMed] [Green Version]
  43. Darriba, D.; Taboada, G.L.; Doallo, R.; Posada, D. Europe PMC Funders Group jModelTest 2: More models, new heuristics and high–performance computing. Nat. Methods 2012, 9, 6–9. [Google Scholar] [CrossRef] [PubMed] [Green Version]
  44. Clement, M.; Posada, D.; Crandall, K.A. TCS: A computer program to estimate gene genealogies. Mol. Ecol. 2000, 9, 1657–1660. [Google Scholar] [CrossRef] [PubMed] [Green Version]
  45. Rozas, J.; Sanchez-DelBarrio, J.C.; Messeguer, X.; Rozas, R. DnaSP, DNA polymorphism analyses by the coalescent and other methods. Bioinformatics 2003, 19, 2496–2497. [Google Scholar] [CrossRef]
  46. Stamatakis, A. RAxML version 8: A tool for phylogenetic analysis and post–analysis of large phylogenies. Bioinformatics 2014, 30, 1312–1313. [Google Scholar] [CrossRef]
  47. Maddison, D.R.; Maddison, W.P. Zephyr: A Mesquite Package for Interacting with External Phylogeny Inference Programs, Version 3.0. Available online: http://zephyr.mesquiteproject.org (accessed on 30 May 2018).
  48. Huelsenbeck, J.P.; Ronquist, F. MrBayes: Bayesian inference of phylogenetic trees. Bioinformatics 2001, 17, 754–755. [Google Scholar] [CrossRef] [Green Version]
  49. Bouckaert, R.; Heled, J.; Kühnert, D.; Vaughan, T.; Wu, C.-H.; Xie, D.; Suchard, M.A.; Rambaut, A.; Drummond, A.J. BEAST 2: A Software Platform for Bayesian Evolutionary Analysis. PLoS Comput. Biol. 2014, 10, e1003537. [Google Scholar] [CrossRef] [Green Version]
  50. Chandler, D.S. Biology, Morphology, and Systematics of the Ant–Like Litter Beetle Genera of Australia (Coleoptera: Staphylinidae: Pselaphinae), 15th ed.; Memoirs on Entomology International; American Entomological Institute: Gainesville, FL, USA, 2001; pp. 1–560. [Google Scholar]
  51. Zhang, J.; Kapli, P.; Pavlidis, P.; Stamatakis, A. A general species delimitation method with applications to phylogenetic placements. Bioinformatics 2013, 29, 2869–2876. [Google Scholar] [CrossRef] [Green Version]
  52. Fujisawa, T.; Barraclough, T.G. Delimiting species using single–locus data and the generalized mixed yule coalescent approach: A revised method and evaluation on simulated data sets. Syst. Biol. 2013, 62, 707–724. [Google Scholar] [CrossRef] [Green Version]
  53. Jones, G. Algorithmic improvements to species delimitation and phylogeny estimation under the multispecies coalescent. J. Math. Biol. 2017, 74, 447–467. [Google Scholar] [CrossRef] [PubMed]
  54. Rambaut, A.; Suchard, M.A.; Xie, D.; Drummond, A.J. Tracer v1.6. Available online: http://beast.bio.ed.ac.uk/Tracer (accessed on 11 November 2016).
  55. Swofford, D.L. PAUP*. Phylogenetic Analysis Using Parsimony (*and Other Methods), Version 4. 2003. Available online: https://paup.phylosolutions.com/ (accessed on 2 March 2018).
  56. Hoorn, C.; Perrigo, A.; Antonelli, A. Mountains, Climate and Biodiversity: An Introduction. In Mountains, Climate and Biodiversity; Hoorn, C., Perrigo, A., Antonelli, A., Eds.; Wiley: Oxford, UK, 2018; pp. 1–5. [Google Scholar]
  57. Antonelli, A.; Kissling, W.D.; Flantua, S.G.A.; Bermúdez, M.A.; Mulch, A.; Muellner-Riehl, A.N.; Kreft, H.; Linder, H.P.; Badgley, C.; Fjeldså, J.; et al. Geological and climatic influences on mountain biodiversity. Nat. Geosci. 2018, 11, 718–725. [Google Scholar] [CrossRef]
  58. Fujita, M.K.; Leaché, A.D.; Burbrink, F.T.; McGuire, J.A.; Moritz, C. Coalescent–based species delimitation in an integrative taxonomy. Trends Ecol. Evol. 2012, 27, 480–488. [Google Scholar] [CrossRef]
  59. Sklenář, P.; Dušková, E.; Balslev, H. Tropical and Temperate: Evolutionary History of Paramo Flora. Bot. Rev. 2011, 77, 71–108. [Google Scholar] [CrossRef]
  60. Luteyn, J.L. Paramos: A Checklist of Plan Diversity, Geographical Distribution and Botanical Literature, 84th ed.; Memoirs of the New York Botanical Garden: New York, NY, USA, 1999; pp. 1–38. [Google Scholar]
  61. Merckx, V.S.F.T.; Hendriks, K.P.; Beentjes, K.K.; Mennes, C.B.; Becking, L.E.; Peijnenburg, K.T.C.A.; Afendy, A.; Arumugam, N.; de Boer, H.; Biun, A.; et al. Evolution of endemism on a young tropical mountain. Nature 2015, 524, 347–350. [Google Scholar] [CrossRef]
  62. Barraclough, T.G.; Nee, S. Phylogenetics and speciation. Trends Ecol. Evol. 2001, 16, 391–399. [Google Scholar] [CrossRef]
  63. Robin, C.; Eissen, J.P.; Samaniego, P.; Martin, H.; Hall, M.; Cotten, J. Evolution of the late Pleistocene Mojanda–Fuya Fuya volcanic complex (Ecuador), by progressive adakitic involvement in mantle magma sources. Bull. Volcanol. 2009, 71, 233–258. [Google Scholar] [CrossRef] [Green Version]
  64. Monsalve, M.L.; Laverde, C.A. Actividad de los volcanes Chiles y Cerro Negro (Frontera Colombo–Ecuatoriana). Bol. Geol. 2016, 38, 61–78. [Google Scholar]
  65. Jordan, E.; Hastenrath, S.L. Glaciers of South America: Glaciers of Ecuador. In US Geological Survey Professional Paper; Williams, R.S., Ferrigno, J.G., Eds.; United States Government Printing Office: Washington, DC, USA, 1998; pp. 131–150. [Google Scholar]
  66. Edwards, J.S.; Sugg, P. Arthropod Fallout as a Resource in the Recolonization of Mount St. Helens. Ecol. Soci. 1993, 74, 954–958. [Google Scholar] [CrossRef]
  67. Elizalde, L. Volcanism and arthropods: A review. Ecol. Austral 2014, 24, 3–16. [Google Scholar]
  68. Lester, S.; Ruttenberg, B.; Gaines, S.D.; Kinlan, B.P. The relationship between dispersal ability and geographic range size. Ecol. Lett. 2007, 10, 745–758. [Google Scholar] [CrossRef] [PubMed]
  69. Ikeda, H.; Nishikawa, M.; Sota, T. Loss of flight promotes beetle diversification. Nat. Commun. 2012, 3, 647–648. [Google Scholar] [CrossRef] [PubMed] [Green Version]
  70. Mcculloch, G.A.; Wallis, G.P.; Waters, J.M. Does wing size shape insect biogeography? Evidence from a diverse regional stonefly assemblage. Glob. Ecol. Biogeogr. 2017, 26, 93–101. [Google Scholar] [CrossRef]
  71. Sklenář, P.; Hedberg, I.; Cleef, A.M. Island biogeography of tropical alpine floras. J. Biogeogr. 2014, 41, 287–297. [Google Scholar] [CrossRef]
  72. Moret, P. Los Coleópteros Carabidae Del Páramo En Los Andes Del Ecuador; Museo de Zoología; Centro de Biodiversidad y Ambiente; Escuela de Biología; Pontificia Universidad Católica del Ecuador: Quito, Ecuador, 2005; pp. 11–273. [Google Scholar]
  73. Moret, P. Altitudinal distribution, diversity and endemicity of Carabidae (Coleoptera) in the páramos of Ecuadorian Andes Pierre. Ann. Société Entomol. Fr. 2009, 45, 500–510. [Google Scholar] [CrossRef] [Green Version]
  74. Martinez, E.; Duque, P.; Wolff, M. Succession pattern of carrion–feeding insects in Paramo, Colombia. Forensic Sci. Int. 2007, 166, 182–189. [Google Scholar] [CrossRef]
  75. Cuesta, F.; Peralvo, M.; Merino-Viteri, A.; Bustamante, M.; Baquero, F.; Freile, J.F.; Muriel, P.; Torres-Carvajal, O. Priority areas for biodiversity conservation in mainland Ecuador. Neotrop. Biodivers. 2017, 3, 93–106. [Google Scholar] [CrossRef]
Figure 1. (A) Map of the collecting sites for Panabachia in the Ecuadorian Andes. Sites are represented by colored circles, the páramo ecosystem (above 3000 m) is highlighted in grey, and divided into East (light grey) and West (dark grey) cordillera. Potential geographical barriers (rivers and dry valleys) are highlighted in this map. (B) Head and pronotum from male individual from the La Virgen site. (C) Head and pronotum from male individual from the Atillo site. (D) Female individual from the Cayambe site.
Insects 11 00064 g001
Figure 2. TCS haplotype networks for the COI gene of Panabachia.
Insects 11 00064 g002
Figure 3. TCS haplotype networks for the nuclear gene, wingless of Panabachia.
Insects 11 00064 g003
Figure 4. Bayesian inference based on a combined data set for Panabachia putative species. Colored bars represent site information, and species delimitation analysis using bPTP, STACEY and GMYC are represented by bars on the right side of the phylogeny. The grey color on the bars signifies there is an agreement across methods of delimitation, while the color blue signifies that there is disagreement across methods, and the two shades of blue signify that they belong to the same group within each clade. Wing size is represented in bars, white colored bars indicate wing polymorphic clades (micropterous and macropterous), black bars macropterous clades, and the black and white bar represents a micropterous clade. Posterior probabilities are shown above the branches and RAxML bootstrap values are shown below branches. Branch lengths are not proportional with the number of changes.
Insects 11 00064 g004
Figure 5. Posterior probability tree for the mitochondrial gene COI of Panabachia. Branch lengths are in proportion to the number of substitutions per site, in reference to the scale bar. Posterior probabilities are shown above the branches and bootstrap support values for the Maximum Likelihood tree are shown below branches.
Insects 11 00064 g005
Figure 6. Posterior probability tree for the nuclear protein-coding gene wingless of Panabachia. Branch lengths are in proportion to the number of substitutions per site, in reference to the scale bar. Posterior probabilities are shown above the branches and bootstrap support values for the ML tree are shown below branches.
Insects 11 00064 g006
Figure 7. Divergence time estimation for Panabachia based on a relaxed molecular clock, using a combined data set.
Insects 11 00064 g007
Table 1. Population and site information for each sample of Panabachia from páramo sites.
Mountain RangeNo.SiteNLatitudeLongitudeElevationCollecting Date
West1El Angel1000°42.3521′ N77°57.985′ W3301 m26 July 2016
2Mojanda1000°08.710′ N78°16.753′ W3715 m12 July 2016
3Pichincha1100°11.259′ S78°32.432′ W3897 m22 June 2016
East4Cayambe1000°02.101′ S78°03.608′ W3743 m1 June 2016
5La Virgen1000°18.477′ S78°13.953′ W3694 m28 June 2016
6Releche701°38.400′ S78°30.426′ W3124 m8 July 2016
7Atillo1002°11.265′ S78°31.2601′ W3501 m7 July 2016
Table 2. GenBank accession numbers for voucher specimens.
Voucher IDGenusSpeciesSiteHaplotypeCOIHaplotypeWinglessReference
SIMT248Panabachiasp.El AngelH8/H9MK674905This study
SIMT249Panabachiasp.El AngelH15MN536380H11MK674907This study
SIMT288Panabachiasp.El AngelH24MN536401H30MK674927This study
SIMT289Panabachiasp.El AngelH25MN536402H31MK674928This study
SIMT290Panabachiasp.El AngelH24MN536403H32/H33MK674929This study
SIMT291Panabachiasp.El AngelH24MN536404H34/H35MK674930This study
SIMT292Panabachiasp.El AngelH15MN536405H36MK674931This study
SIMT293Panabachiasp.El AngelH15MN536406H37MK674932This study
SIMT294Panabachiasp.El AngelH27MN536407H38MK674933This study
SIMT295Panabachiasp.El AngelH27MN536408H39MK674934This study
SIMT252Panabachiasp.MojandaH12MN536371This study
SIMT297Panabachiasp.MojandaH13MN536410H40/H41MK674936This study
SIMT298Panabachiasp.MojandaH21MN536411H42MK674937This study
SIMT299Panabachiasp.MojandaH20MN536412H43MK674938This study
SIMT300Panabachiasp.MojandaH26MN536413H44/H45MK674939This study
SIMT301Panabachiasp.MojandaH12MN536414H46MK674940This study
SIMT302Panabachiasp.MojandaH20MN536415H47MK674941This study
SIMT303Panabachiasp.MojandaH20MN536416H48MK674942This study
SIMT304Panabachiasp.MojandaH14MN536417H40MK674943This study
SIMT253Panabachiasp.MojandaH28MN536382H13MK674909This study
SIMT250Panabachiasp.PichinchaH8MN536381H12MK674908This study
SIMT251Panabachiasp.PichinchaH29MN536370H2MK674899This study
SIMT266Panabachiasp.PichinchaH9MN536375H6MK674903This study
SIMT267Panabachiasp.PichinchaH29MN536376H7MK674904This study
SIMT268Panabachiasp.PichinchaH29MN536377This study
SIMT269Panabachiasp.PichinchaH29MN536378This study
SIMT270Panabachiasp.PichinchaH29MN536384H15/H16MK674911This study
SIMT271Panabachiasp.PichinchaH29MN536385H17MK674912This study
SIMT272Panabachiasp.PichinchaH29MN536386H17MK674913This study
SIMT273Panabachiasp.PichinchaH29MN536387H15/H18MK674914This study
SIMT296Panabachiasp.PichinchaH7MN536409H10MK674935This study
SIMT254Panabachiasp.CayambeH6MN536383H14MK674910This study
SIMT255Panabachiasp.CayambeH5MN536372H3MK674900This study
SIMT278Panabachiasp.CayambeH4MN536392This study
SIMT279Panabachiasp.CayambeH1MN536393H10/H20MK674919This study
SIMT280Panabachiasp.CayambeH1MN536394H21/H22MK674920This study
SIMT281Panabachiasp.CayambeH2MN536395H10MK674921This study
SIMT282Panabachiasp.CayambeH3MN536396H23MK674922This study
SIMT309Panabachiasp.CayambeH1MN536422H51MK674947This study
SIMT310Panabachiasp.CayambeH1MN536423H52/H53MK674948This study
SIMT311Panabachiasp.CayambeH5MN536424H10/H54MK674949This study
SIMT246Panabachiasp.La VirgenH11MN536369H1MK674898This study
SIMT247Panabachiasp.La VirgenH9MN536379H10MK674906This study
SIMT274Panabachiasp.La VirgenH10MN536388H11MK674915This study
SIMT275Panabachiasp.La VirgenH22MN536389H14MK674916This study
SIMT276Panabachiasp.La VirgenH10MN536390H19MK674917This study
SIMT277Panabachiasp.La VirgenH9MN536391H19MK674918This study
SIMT305Panabachiasp.La VirgenH22MN536418H49MK674944This study
SIMT306Panabachiasp.La VirgenH22MN536419H50MK674945This study
SIMT307Panabachiasp.La VirgenH22MN536420H50MK674946This study
SIMT308Panabachiasp.La VirgenH22MN536421This study
SIMT256Panabachiasp.RelecheH16MN536373H4MK674901This study
SIMT257Panabachiasp.RelecheH16MN536374H5MK674902This study
SIMT283Panabachiasp.RelecheH16MN536397H24/H25MK674923This study
SIMT284Panabachiasp.RelecheH10MN536398H26MK674924This study
SIMT340Panabachiasp.RelecheH16MN536425This study
SIMT341Panabachiasp.RelecheH17MN536426H55/H56MK674950This study
SIMT342Panabachiasp.RelecheH16MN536427H4MK674951This study
SIMT285Panabachiasp.AtilloH23MN536399H27MK674925This study
SIMT286Panabachiasp.AtilloH23MN536400H28/H29MK674926This study
SIMT287Panabachiasp.AtilloH23MN536434H65MK674959This study
SIMT343Panabachiasp.AtilloH18MN536428 MK674952This study
SIMT344Panabachiasp.AtilloH18MN536429H59MK674953This study
SIMT345Panabachiasp.AtilloH30MN536430H60MK674954This study
SIMT346Panabachiasp.AtilloH19MN536431H61MK674955This study
SIMT347Panabachiasp.AtilloH18MN536432H61MK674956This study
SIMT348Panabachiasp.AtilloH62MK674957This study
SIMT349Panabachiasp.AtilloH18MN536433H63/H64MK674958This study
BryaxiscurtisiOutgroupKM350460KM350297Parker and Grimaldi (2014).
Tychobythinussp.OutgroupKM350498KM350290Parker and Grimaldi (2014).
Table 3. Overall genetic indexes for the genus Panabachia. N refers to the number of individuals sampled; S, number of segregating sites; Ps, number of parsimony informative sites; π, is a measure of nucleotide diversity; θ is a measure of genetic diversity; D represents Tajima’s D, a neutrality test.
GeneNSPsθ ΠD
COI67240660.0540.1131.73 (p > 1.78)
wingless621181050.0560.047−0.51 (p > 0.10)

