Article

Influence of Nitrile Butadiene Rubber (NBR) Shore Hardness and Polytetrafluoroethylene (PTFE) Elastic Modulus on the Sealing Characteristics of Step Rod Seals

1
College of Mechanical Engineering, Zhejiang University of Technology, Hangzhou 310023, China
2
College of Mechanical and Electrical Engineering, China Jiliang University, Hangzhou 310018, China
3
College of Quality and Safety Engineering, China Jiliang University, Hangzhou 310018, China
4
Oil and Gas Team, Zhejiang Baima Lake Laboratory, Hangzhou 310051, China
*
Author to whom correspondence should be addressed.
Lubricants 2023, 11(9), 367; https://doi.org/10.3390/lubricants11090367
Submission received: 29 July 2023 / Revised: 16 August 2023 / Accepted: 26 August 2023 / Published: 31 August 2023
(This article belongs to the Special Issue Dynamics of Lubricated Interfaces)

Abstract

:
The influence of NBR Shore hardness and PTFE elastic modulus on the sealing characteristics of step rod seals is analyzed in this paper based on the developed mixed elastohydrodynamic lubrication (EHL) model. The optimized selection studies of NBR Shore hardness and PTFE elastic modulus under different operating conditions are carried out based on the principle of minimizing net leakage and friction power loss. Results show that the Shore hardness of the NBR O-ring and, in particular, the elastic modulus of the PTFE ring has a significant effect on the sealing characteristics. Although the high values of these parameters result in high friction forces, they are beneficial for leakage control. To achieve both low leakage and low friction, it is recommended that high hardness and low modulus are selected for moderate-low pressure or high speed conditions, but low hardness and high modulus are selected for high pressure or low speed conditions.

1. Introduction

Step rod seals, usually consisting of an NBR O-ring and a PTFE step ring, are widely used in the hydraulic equipment in the fields of aerospace, railways, engineering machinery, and other industrial applications, especially the high pressure and high speed occasions, due to their excellent performance in anti-extrusion and anti-friction [1,2]. According to the literature, for a working seal, the plastic step ring contacts with the moving rod and forms a mixed lubrication region during the reciprocating process, while the rubber O-ring provides the elastic force for it to reduce the leakage channels. Selecting the appropriate materials to ensure that their good mechanical properties are fully translated into excellent sealing performance has therefore become the key to successful seal design.
Reviews of the literature reveal that, insofar as research on the step rod seal, rich volumes of recent research reports have been devoted to both theoretical and experimental works to gain better insight into the seal mechanism [3,4], performance analyses [5,6,7], and failure evaluations [8,9]. For example, Wang et al. [4] have shown the effect of the non-Newtonian fluid behavior of hydraulic oil on the sealing characteristics based on an elastohydrodynamic lubrication model that combines a power-law fluid model, and Heipl et al. [5] have presented the influence of sealed pressure, ambient temperature, and rod acceleration on the seal’s friction with a series of experimental studies. Zhang et al. [7] have also investigated the influence of sealed pressure, rod speed, and ambient temperature on the sealing performance parameters, such as leakage and friction, based on the inverse hydrodynamic-lubrication method and the experimental test method. Ran et al. [8] and Wang et al. [9] have both developed a performance degradation models that combine the seal wear process and the mixed lubricating conditions and have shown that wear failure will lead to large leakage. However, the influence of the mechanical properties of the materials on the sealing characteristics of the step rod seal is not clear and is rarely reported.
Among the index parameters characterizing the mechanical properties of seal materials, elastic modulus and hardness are the most commonly used. Through a series of hot oil aging experiments, Guo et al. [10] have shown that the elastic modulus of rubber will decrease with the increasing ambient temperature, and thus the radial force of the lip seal decreases. In addition, its elastic modulus is a relatively constant value when the strain is less than 0.3 because the stress–strain curve is almost linear. Peng et al. [11] and Nikas et al. [12,13] have also found that both rubber and plastic materials of the combined rod seal have a decreasing elastic modulus with increasing ambient temperature and have pointed out that seals have lower leakage but higher friction in low temperature environments. In fact, rubber is a nonlinear material and its elastic modulus is usually determined by tensile or compression tests. However, according to the studies by Bouaziz et al. [14] and Gent [15,16], the hardness of rubber has a quantitative relationship with its elastic modulus and can be easily measured. Ucar et al. [17] and Feyzullahoğlu [18] have shown that rubber with high hardness has better wear resistance and anti-extrusion ability, while rubber with low hardness is more susceptible to wear and tear. Notwithstanding, the relevant research into the effects of the rubber hardness and the plastic hardness on the sealing performance has not yet been conducted.
From the available literature, little work has been performed to study the mechanical properties of the material on the sealing performance of the step rod seal, which can play a significant role in the seal behavior. In this paper, the influences of NBR Shore hardness and PTFE elastic modulus on the static and dynamic sealing characteristics of the step rod seal are analyzed based on a developed mixed EHL model. A series of results are presented to quantify the comprehensive effects of NBR Shore hardness and PTFE elastic modulus, and to recommend their optimized selection ranges that meet the minimization of leakage and friction under different operating conditions.

2. Theoretical Models

2.1. Geometrical Model

Figure 1 illustrates the geometry of a step combined rod seal installed on a linear hydraulic actuator. The seal consists of a rubber O-ring and a PTFE ring and relies on the deformation of the rubber O-ring caused by the high sealed pressure and compression ratio to hold the PTFE ring close to the rod to achieve the sealing function. There is a wiper seal on the outside of the rod seal, which prevents the ingress of external contaminants, such as dust and water, and a guide ring on the inside, which carries the lateral load and ensures the centering movement of the rod. Unfortunately, they do not have a sealing function. There are two operating states of the rod seal: outstroke, when the rod extends from the housing and the oil pressure in the rod seal is generally atmospheric, and instroke, when the rod retracts into the housing and the oil pressure in the rod seal is high. It is generally believed that the output power and efficiency are high when the sealed pressures of the piston seal during outstroke and the rod seal during instroke are high.

2.2. Mathematical Model

2.2.1. Mechanical Property Characterization of Seal Materials

For the rubber material, it exhibits nonlinearity in its mechanical behavior due to its ability to undergo significant deformation under applied forces, which distinguishes it from linear materials. According to the literature reports, its mechanical behaviors, namely the stress–strain relationship, can be described by using the Mooney–Rivlin model, especially for small and intermediate strains [19]. The two-parameter Mooney–Rivlin model, which has been shown by numerous researchers to be applicable to NBR rubber, is expressed as follows [20].
W 0 = C 10 ( I 1 3 ) + C 01 ( I 2 3 )
E 0 = 6 ( C 10 + C 01 )
C 01 = 0.25 C 10
where W0 is the strain energy density, C10 and C01 are the Mooney–Rivlin coefficients, I1 and I2 are the invariants of the Cauchy–Green strain tensor, E0 is the elastic modulus.
There are two methods for obtaining the Mooney–Rivlin coefficient, one is to fit the stress–strain curve measured by tensile or compression tests, and the other is to derive it from the hardness measured by the hardness tester. The first method gives accurate results but is a complicated procedure, while the second method is easy to use and is particularly suitable for NBR materials. According to the work of Gent [15,16], the elastic modulus E0 of NBR materials can be obtained as a function of its Shore hardness H, as follows.
E 0 = 2.15 H + 15.75 100 H
For the PTFE material, it exhibits excellent linear and isotropic material properties, with consistent mechanical strength, thermal stability, and electrical insulation ability. According to the work of Zahabi et al. [21] and Bao et al. [22], the elastic modulus of PTFE material is statistically considered to be an increasing function of hardness, and it can be obtained by indentation technique or the Oliver–Pharr method.

2.2.2. Mixed EHL Model

A theoretical model, the mixed EHL model, which includes the static contact mechanics, fluid mechanics, asperity contact mechanics, micro-deformation mechanics, and thermal mechanics, of hydraulic oil lubricated rod seals has been developed and described previously [4,23]. Therefore, the mixed lubrication modeling of step rod seals, taking into account the mechanical properties of the seal materials, can be summarized as follows.
In the static contact mechanics analysis, the commercial finite element software ANSYS (https://www.ansys.com/) is applied to deal with the complex nonlinear problem, including structural nonlinearity, material nonlinearity, and contact nonlinearity. Here, it is assumed that the seal shown in Figure 1 has no manufacturing defects and is installed without misalignment. Thus, a two-dimensional axisymmetric (2D) model is used to calculate the stress–strain distributions offline with less computational time but high computational efficiency. In the analysis, a higher-order 8-node 2D element, PLANE 183, is used. The material properties of NBR are set using the nonlinear Mooney–Rivlin model, where the Mooney–Rivlin coefficients are calculated according to Equations (2)–(4) with a given Shore hardness. The material properties of PTFE are set using a linear model with a given elastic modulus and Poisson’s ratio. The advanced Lagrange contact algorithm is used to solve the contact problems between interfaces, including the rod-seal interface, seal-housing interface, NBR O-ring and PTFE ring interface. The fluid pressure penetration APDL command, which can automatically identify the boundary, is used to apply fluid pressure loads. This allows the macro-deformation and stress distribution of the seal to be calculated and the contact width L of the sealing zone (i.e., the region where the PTFE ring contacts the rod), the static contact pressure psc (i.e., the contact pressure of the seal when the rod is stationary), and the influence coefficient matrix In to be obtained.
In the fluid mechanics analysis, it is assumed that the hydraulic oil is a Newtonian fluid in laminar flow and does not include the inertial and slip flow effects of the fluid. The fluid film pressure between the rod and PTFE ring interface, pf, can be derived from the following averaged Reynolds equation, taking into account the effect of surface roughness.
x ( ϕ x h 3 12 μ p f x ) = U 2 ( ( θ h T ) x + σ ( θ ϕ s ) x )
{ 0 < θ < 1 ,   p f = p cav ,   in   cavitation   zone θ = 1 ,   p f > p cav ,   in   liquid   film   zone
where x represents the axial coordinate, and U is the rod speed in the x-axis direction. µ is the dynamic viscosity of the fluid and can be calculated using the Barus–Reynolds formula. h is the nominal film thickness, and hT is the truncated film thickness. θ is the density ratio. ϕx and ϕs are the flow factors.
In the asperity contact mechanics analysis, the Greenwood–Williamson model, based on Hertz contact theory, is used to calculate the asperity contact pressure of the rod and PTFE ring interface caused by the micro-contacting asperities, which has been shown to be suitable for the rod seal. Then, the asperity contact pressure (i.e., the contact pressure of the PTFE ring in the sealing zone when the rod moves), pc, can be calculated using the following formula.
p c = 4 3 η E R 1 2 h 1 2 π σ e z 2 2 σ 2 ( z h ) 3 2 d z
where η is the asperity density, R is the asperity radius, E′ is the equivalent elastic modulus, σ is the root mean square surface roughness.
In the micro-deformation mechanics analysis, the dynamic effect will change the morphology of the fluid film and result in a micro-scale deformation of the PTFE ring. Then, the fluid film thickness in the sealing zone can be calculated by the influence coefficient method based on the small deformation theory as follows.
h = h s + k = 1 n ( I n ) i k ( p f + p c p sc ) k
where hs is the static film thickness and can be derived from the static contact pressure. In is the influence coefficient matrix, and i and k are the ith row and kth column of the matrix.
In the thermal mechanics analysis, the frictional heat generated between the PTFE ring and the rod interface is absorbed to a small extent by the fluid film, while most of it is dissipated to the rod and PTFE ring. According to the work of Salant et al. [24] and Bhushan [25], it is reasonable to assume that all the heat is transferred to the rod since the thermal conductivity of the rod is more than 100 times that of the PTFE ring. Then, the fluid film temperature, T, can be calculated using the following formula proposed by Salant et al. [24].
T = { T a + 0.64 Q h l k R ln [ 5.0 k R ρ R c R U l ] ,   ρ R c R U l / k R 0.68 T a + 1.07 Q h l k R [ ρ R c R U l k R ] 1 / 2 ,   ρ R c R U l / k R > 0.68
where ρR, cR, and kR are the density, specific heat, and thermal conductivity of the rod, respectively. Ta is the ambient temperature. l is a half-length of the contact width. Qh is the heat generation rate, which can be calculated by
Q h = ( τ f + τ c ) U
where τf is the fluid viscous shear stress, which is calculated by
τ f = μ U h ( ϕ f ϕ f s s ) ϕ f p p h 2 p f x
where τc is the contact shear stress, which is calculated by
τ c = f c p c ( U | U | )
where ϕf, ϕfss, and ϕfpp are the shear stress factors. fc is the dry friction coefficient.

2.3. Boundary Conditions

For the seal rings, as shown in Ref. [4], the PTFE ring is in contact with the rod, the housing, and the NBR O-ring, and the NBR O-ring is also in contact with the housing. Nonpenetration conditions are imposed on the above contact surfaces, with the housing and rod surfaces set as the target surface. The sealed pressure, psealed, is imposed on the seal surfaces immersed in oil by the fluid pressure penetration APDL command. Meanwhile, the stretching effect of the seal is taken into account by using the putter movement method under the premise of a fixed rod and housing, which can avoid the overstretching problem.
For the fluid film, between the PTFE ring and the rod interface, is delimited by the oil and air sides (x = 0 and x = L) of the sealing zone. In the analysis, to solve Equation (5) for calculating the fluid film pressure distribution, the pressure boundary condition is applied as follows.
{ p f = p sealed ,   x = 0   ( oil   side ) p f = p a ,             x = L   ( air   side )
where pa is the ambient pressure.

2.4. Numerical Method

The analysis of the sealing characteristics of the step rod seal is carried out using the numerical method shown in Figure 2. An iterative computational procedure with two overlapping loops is implemented to solve the coupling relationship between fluid mechanics, solid mechanics, and thermal mechanics, as shown in the mixed EHL model. The main steps of the procedure can be described as follows:
(1)
Begin by specifying the initial material and structural properties of the seal and hydraulic oil, and the operating conditions such as rod speed, sealed pressure, and ambient temperature.
(2)
Solve the offline 2D finite element model to obtain the seal macro-deformation and stress distribution, static contact pressure distribution, and influence coefficient matrix.
(3)
Solve the Reynolds equation using the streamline-upwind/Petrov–Galerkin finite element method with a convergence criterion of 10−6 to obtain the fluid film pressure distribution, and calculate the fluid viscous shear stress distribution.
(4)
Calculate the asperity contact pressure distribution and the contact shear stress distribution.
(5)
Update the fluid film thickness distribution, and calculate the fluid film temperature distribution to update the fluid viscosity.
(6)
Compare the new fluid film thickness with the old values. If |hnewhold|/hnew ≤ 10−6, then end the computation and output. If |hnewhold|/hnew > 10−6, then return to step (3) to continue.
Leakage and friction are two of the most important aspects when evaluating the sealing performance of a dynamic seal. In numerical analysis, the flow rate (volume flow) is calculated by
q = π D ( ϕ x h 3 12 μ p f x + U 2 θ h T + U 2 σ θ ϕ S )
The friction force is expressed as
F R = π D 0 L ( τ f + τ c ) d x
Integrate the flow rate and the friction force in one cycle, including outstroke and instroke. Then, the net leakage and friction power loss per cycle in steady state can be expressed as follows.
Q = ( q outstroke + q instroke ) L stroke / U
W = ( F R outstroke + F R instroke ) L stroke

3. Results Analysis and Discussion

3.1. Validation

To verify the mathematical model and the computational procedure, the film thickness and fluid film pressure distribution results from the present model and the published work of Salant et al. [24] are compared, as shown in Figure 3. It shows how close the fluid film thickness and fluid film pressure distribution are between Salant’s results and the present model, which verifies the validation and accuracy of the developed procedure proposed in this study.
In Figure 4, the mesh independence of the model and numerical method is checked in the case of H = 70 HA, E = 200 MPa, psealed = 5 MPa, where the mesh is generated as shown in Figure 2. It is clearly shown that the maximum static contact pressure psc.max and the contact width converge to their stable values as the number of elements increases, and their deviation is less than 2% when the elements range from 21,967 to 92,894. Therefore, the number of 21,967 elements is used in this paper to reduce the computation time.
In the following numerical analysis, the computational parameters, including the seal dimensions, the seal materials, the hydraulic oil properties, and the operating conditions, are shown in Table 1.
According to Trelleborg’s application, the step rod seals can be used in a wide range of pressure (0.1–50 MPa) and speed (0.01–15 m/s) operating conditions, and NBR Shore hardness ranges from 70 HA to 90 HA, and PTFE elastic modulus ranges from 200 MPa to 1000 MPa. For a better understanding of the research results, taking aircraft aviation as an example, the sealed pressure of 10 MPa is set as moderate-low pressure, while 28 MPa is set as high pressure. The critical rod speeds are defined as 0.1 m/s and 0.5 m/s, thus dividing the speed range into low, moderate, and high speeds.

3.2. Influence of Rubber Hardness on the Sealing Characteristics

The influence of NBR Shore hardness on the static and dynamic sealing characteristics of the seal is discussed in this section. In all cases below, it is assumed that the PTFE elastic modulus is 600 MPa in order to clearly analyze the influence of the NBR Shore hardness.
Figure 5 illustrates the influence of NBR Shore hardness on static contact pressure distribution at different sealed pressures. In all cases, the static contact pressure in the sealing zone is much larger than that in other contact regions, and the maximum value of each region is greater than the sealed pressure, indicating that the static sealing performance meets the requirements. It is clearly shown that the maximum static contact pressure and the contact width of the sealing zone increase with increasing NBR Shore hardness, except that the contact width slightly decreases in the case of instroke with psealed = 28 MPa. This is due to the fact that in this case, the NBR O-ring, especially at a low NBR Shore hardness, is completely squeezed into the relief angle of the PTFE ring, whose function is to reduce stress concentration by increasing the contact width. It can also be observed that the NBR Shore hardness has an obvious influence at low sealed pressures, but only a small influence at high sealed pressures. The maximum static contact pressure increases from 72.56 MPa to 100.99 MPa and the contact width increases from 0.21 mm to 0.31 mm at a sealed pressure of 0.1 MPa, whereas it only increases by 3.82 MPa and decreases by 0.04 mm at a sealed pressure of 28 MPa when the NBR Shore hardness increases from 70 HA to 90 HA. This is because the NBR O-ring with a higher Shore harness obtaining better deformation resistance ability, and can therefore avoid being squeezed into the relief angle of the PTFE ring.
Figure 6 shows the influence of NBR Shore hardness on fluid film thickness and fluid film pressure distributions at different sealed pressures and rod speeds. According to the fluid film thickness distribution, it is clearly illustrated that the clearance is noticeably convergent first then divergent from the oil side to the air side, the minimum value of the clearance occurs close to the oil side, and the film thickness of most region of all cases is less than 3σ, indicating mixed lubrication conditions. The NBR Shore hardness has an obvious influence on the fluid thickness, and its minimum value decreases as the NBR Shore hardness increases, while the influence becomes weaker as the sealed pressure increases during the instroke. For the case of psealed = 0.1 MPa (outstroke), U = 0.01 m/s, the minimum film thickness decreases from 0.95 µm to 0.86 µm, a decrease of about 9.5%.
Meanwhile, another important result from Figure 6 is that, a pressure peak occurs near the oil side in all cases, while fluid cavitation, which prevents leakage, occurs near the exit of the seal during the outstroke. The maximum value of the film pressure and the cavitation region increase as the NBR Shore hardness increases, indicating an enhanced hydrodynamic effect. In addition, the influence of NBR Shore hardness increases as the rod speed increases, but also decreases as the sealed pressure increases. Generally, the film pressure increases with increasing rod speed and sealed pressure due to the enhanced dynamic and static effects. However, in the present case, the film pressure curve is below the static pressure line during the low speed instroke. That is owing to the direction of the rod speed being opposite to that of the fluid difference and resulting in part of the static effect being counteracted.
Figure 7 presents the influence of NBR Shore hardness on fluid flow rate and friction force at different sealed pressures and rod speeds. It is clearly shown that the NBR Shore hardness has little influence on the flow rate, while the rod speed and the sealed pressure have a significant influence. It should be noted that it represents the leakage rate when the fluid flow rate is positive and the pumping rate when it is negative. In addition, leakage can occur during outstroke and instroke, whereas pumping only occurs during instroke when the rod retracts. Obviously, as the rod speed increases, the leakage rate increases during the outstroke, while it decreases or the pumping rate increases during the instroke. As the sealed pressure increases, the leakage rate increases at low rod speed, while it converts to pumping rate and increases at high rod speed.
Meanwhile, the NBR Shore hardness has an obvious influence on the friction force, and its influence decreases with increasing sealed pressure but is almost unaffected by rod speed, as shown in Figure 7. The friction force increases with increasing NBR Shore hardness, especially at low sealed pressures. This is due to the fact that, as discussed above, the higher contact pressure produces a greater contact shear stress as shown in Equation (12), and then the greater integral of the contact shear stress over the contact width as shown in Equation (15), resulting in a greater contact friction force. For the case of psealed = 0.1 MPa (outstroke), U = 0.01 m/s, the friction force increases from 97.3 N to 191.1 N when the NBR Shore hardness increases from 70 HA to 90 HA. However, the friction force increases greatly as the sealed pressure increases, while it decreases as the rod speed increases.

3.3. Influence of PTFE Elastic Modulus on the Sealing Characteristics

The influence of PTFE elastic modulus on the static and dynamic sealing characteristics of the seal is discussed in this section, where the NBR Shore hardness is assumed to be 80 HA in all cases below.
Figure 8 illustrates the influence of PTFE elastic modulus on static contact pressure distribution at different sealed pressures. Obviously, the static contact pressure in the sealing zone shows an asymmetric parabolic distribution with a pressure peak closer to the oil side (see also Figure 5). However, there is another pressure peak close to the air side when E = 200 MPa, psealed = 28 MPa. The maximum static contact pressure occurs at the sealing zone and increases significantly, while the contact width of the sealing zone decreases as the PTFE elastic modulus increases. In addition, it can be also observed that the PTFE elastic modulus has an obvious influence at high sealed pressure. The maximum static contact pressure increases from 80.7 MPa to 189.6 MPa and the contact width decreases from 1.51 mm to 0.76 mm at the sealed pressure of 28 MPa as the PTFE elastic modulus increases from 200 MPa to 1000 MPa. This is also due to the fact that the PTFE ring with a higher elastic modulus has better anti-deformation properties and therefore has less contact with the rod, but the stress is more concentrated. It should be noted, however, that although a seal with a high PTFE elastic modulus will have better static performance, the high stress will make it more susceptible to cracking or wear under dynamic operating conditions.
Figure 9 shows the influence of PTFE elastic modulus on fluid film thickness and fluid film pressure distributions at different sealed pressures and rod speeds. It can be clearly illustrated that the PTFE elastic modulus also has an obvious influence on the film thickness and film pressure. As the PTFE elastic modulus increases, the minimum value of the film thickness decreases significantly, while the maximum value of the film pressure increases at high speeds, except for the case of psealed = 10 MPa (instroke). In this case, the maximum film pressure decreases from 14.27 MPa to 10.91 MPa as the PTFE elastic modulus increases from 200 MPa to 1000 MPa at U = −3.0 m/s. This is because the counteraction of the hydrostatic pressure on the apparent hydrodynamic pressure becomes stronger as the contact width at E = 1000 MPa is much smaller than that at E = 200 MPa. For the case of psealed = 28 MPa and U = –3.0 m/s, as the PTFE elastic modulus increases from 200 MPa to 1000 MPa, the minimum film thickness decreases from 1.13 µm to 0.77 µm, a decrease of about 32.26%, and the maximum film pressure increases from 28 MPa to 33.98 MPa, an increase of about 21.36%. The reason why the above case of E = 200 MPa is the smallest is that the geometric convergence wedge is small and therefore the dynamic effect is weak, as shown in Figure 9e.
In addition, the influence of PTFE elastic modulus on film thickness and fluid pressure generally becomes more apparent as the sealed pressure and rod speed increase. For example, in the two cases of psealed = 0.1 MPa, U = 0.01 m/s and psealed = 28 MPa, U = −3.0 m/s, as the PTFE elastic modulus increases from 200 MPa to 1000 MPa, the variance of the minimum film thickness increases from 0.29 µm to 0.36 µm and that of the maximum film pressure increases from 0.002 MPa to 5.98 MPa. This is because the increased sealed pressure causes the seal to deform more and the increased rod speed causes the dynamic effect of the fluid to become more apparent, resulting in significant changes in film thickness and film pressure. Compared to Figure 6, it appears that PFTE elastic modulus has a more obvious influence on the film thickness and film pressure than the NBR Shore hardness. This means that the seal behavior is mainly determined by the deformation of the PTFE ring, which is closely related to its modulus.
Figure 10 presents the influence of PTFE elastic modulus on fluid flow rate and friction force at different sealed pressures and rod speeds. It is clearly shown that the PTFE elastic modulus has a significant influence on the friction force but little influence on the flow rate. As the PTFE elastic modulus increases, the leakage rate and pumping rate decrease slightly, while the friction force increases greatly, except for the case of psealed = 28 MPa, U = −3.0 m/s, which first decreases and then increases due to the fact that another pressure peak weakens the convergence wedge and dynamic pressure effect, which results in a greater contact friction force when E = 200 MPa. This is because the higher PTFE elastic modulus generates a larger contact pressure, which leads to a larger leak-preventing force and a larger contact friction force (see Figure 8).
It can also be seen from Figure 10 that the influence of PTFE elastic modulus on flow rate and friction force is more pronounced than that of NBR Shore hardness (see Figure 7) within the range of analysis parameters in this paper. In addition, the influence of PTFE elastic modulus on flow rate and friction force increases with increasing sealed pressure, while the influence of it on flow rate increases and on friction force decreases with increasing rod speed. For the case of psealed = 28 MPa and U = –3.0 m/s, as the PTFE elastic modulus increases from 200 MPa to 1000 MPa, the pumping rate decreases from 0.163 mL·s–1 to 0.147 mL·s–1, the friction force first decreases from 338.2 N to 306.5 N and then increases to 468.4 N.

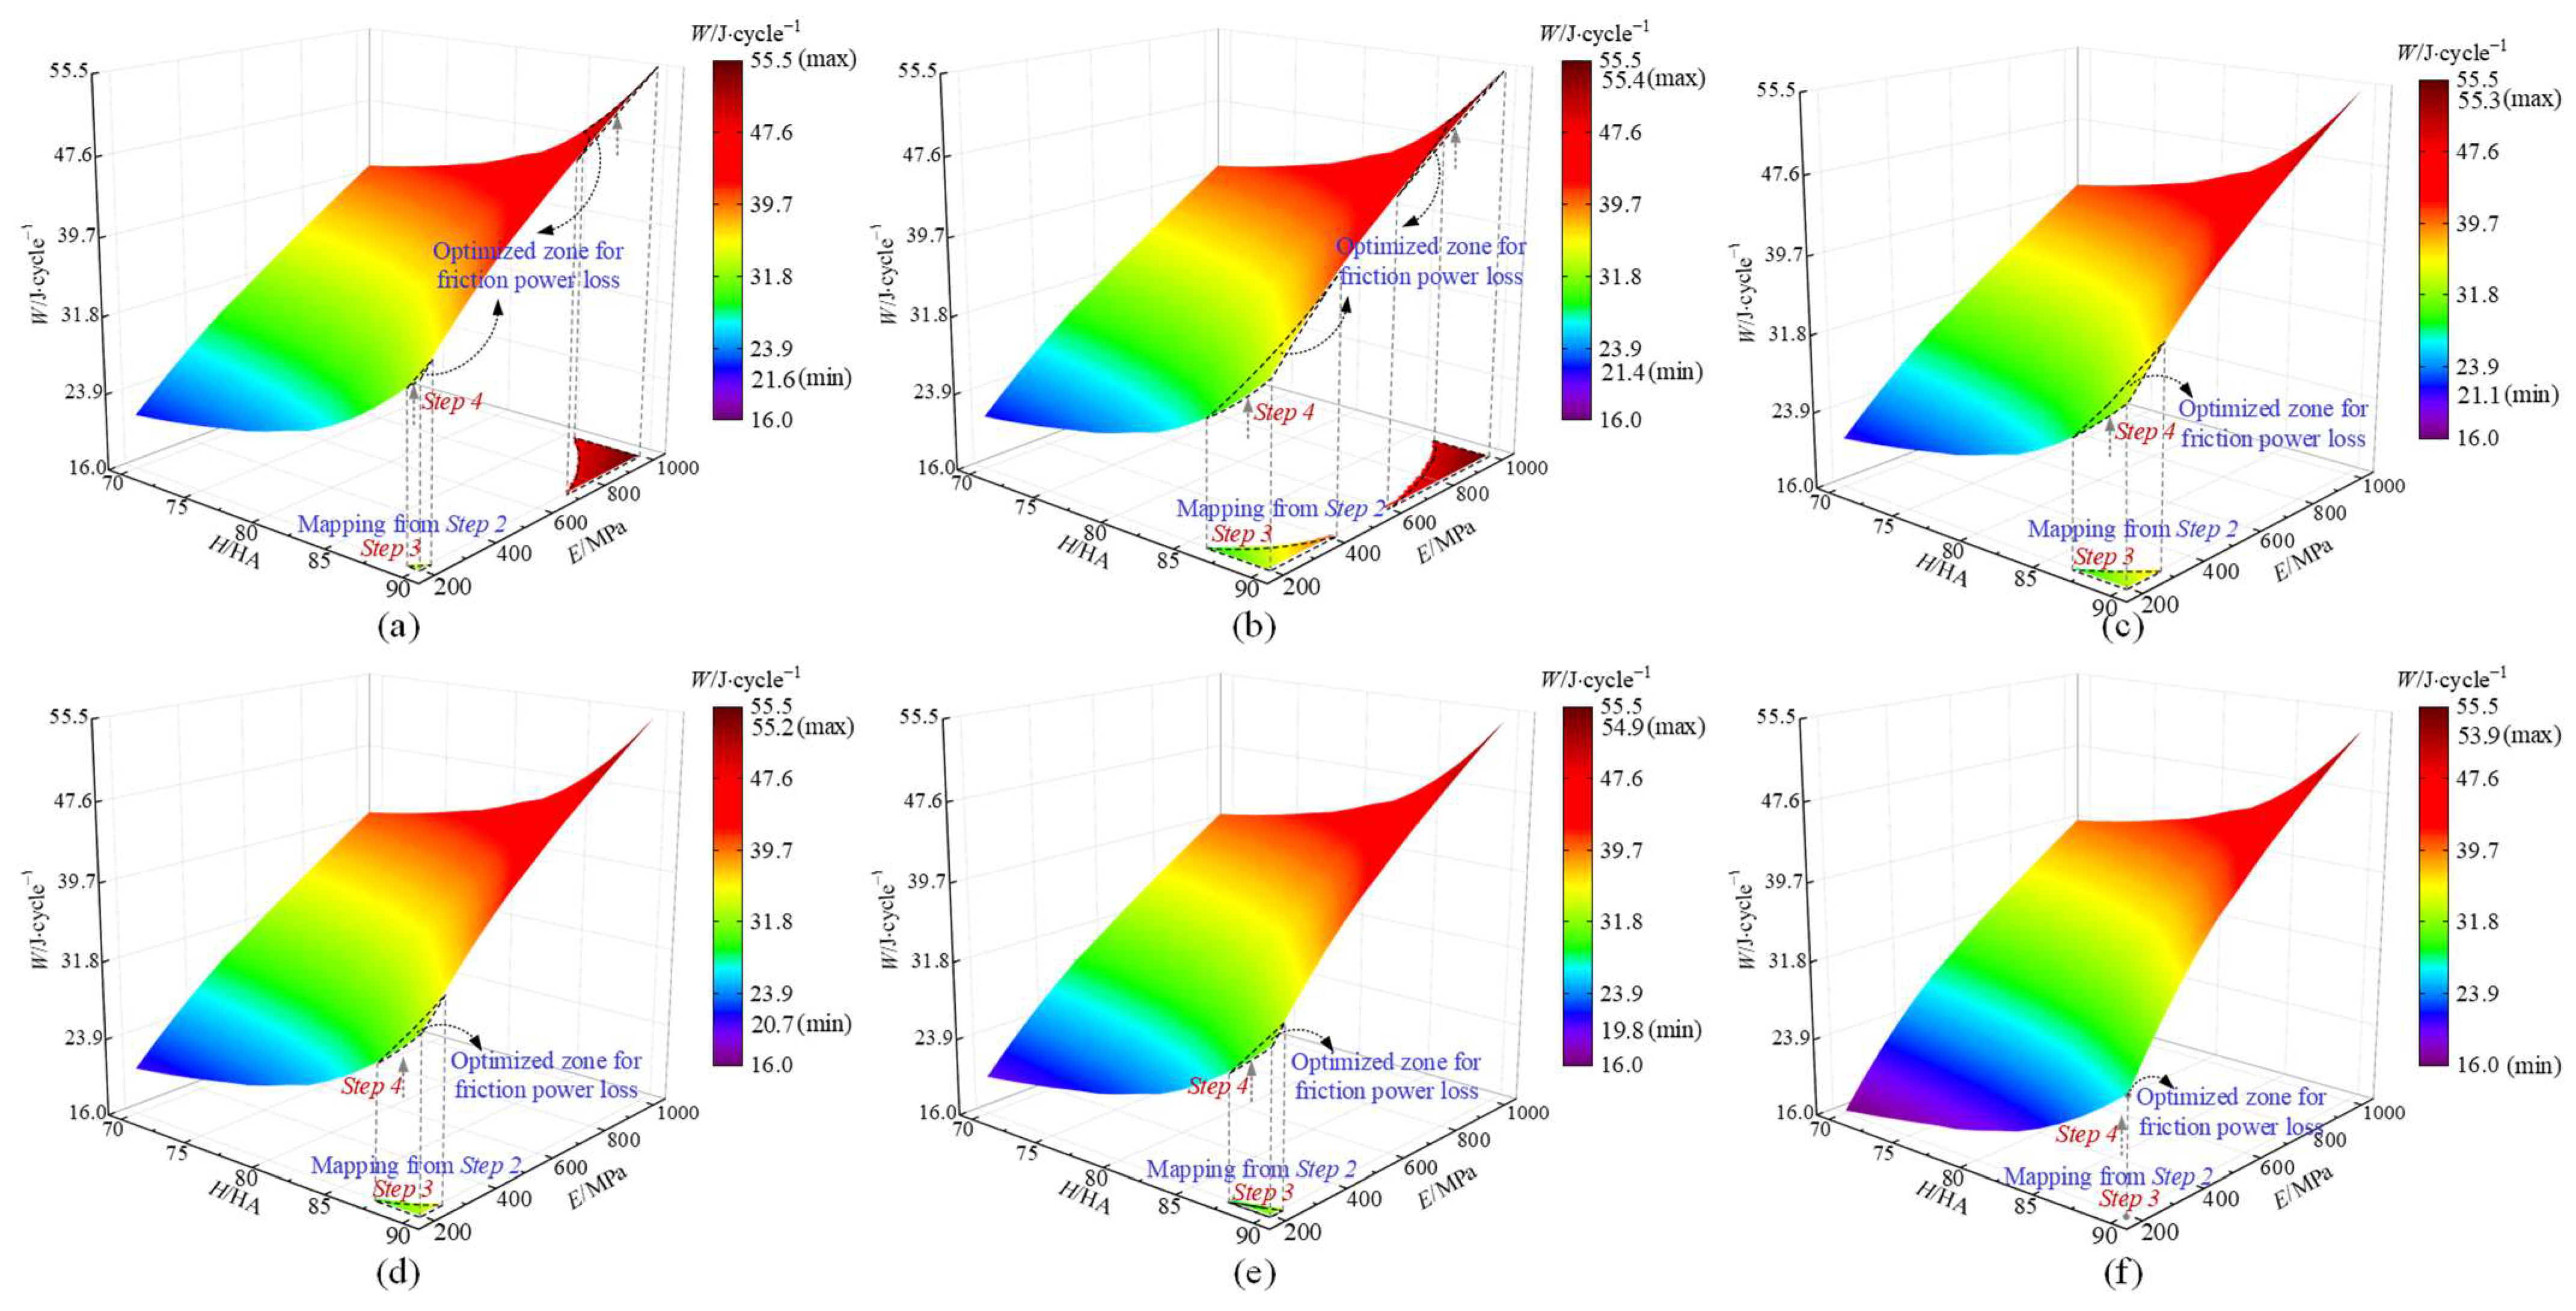
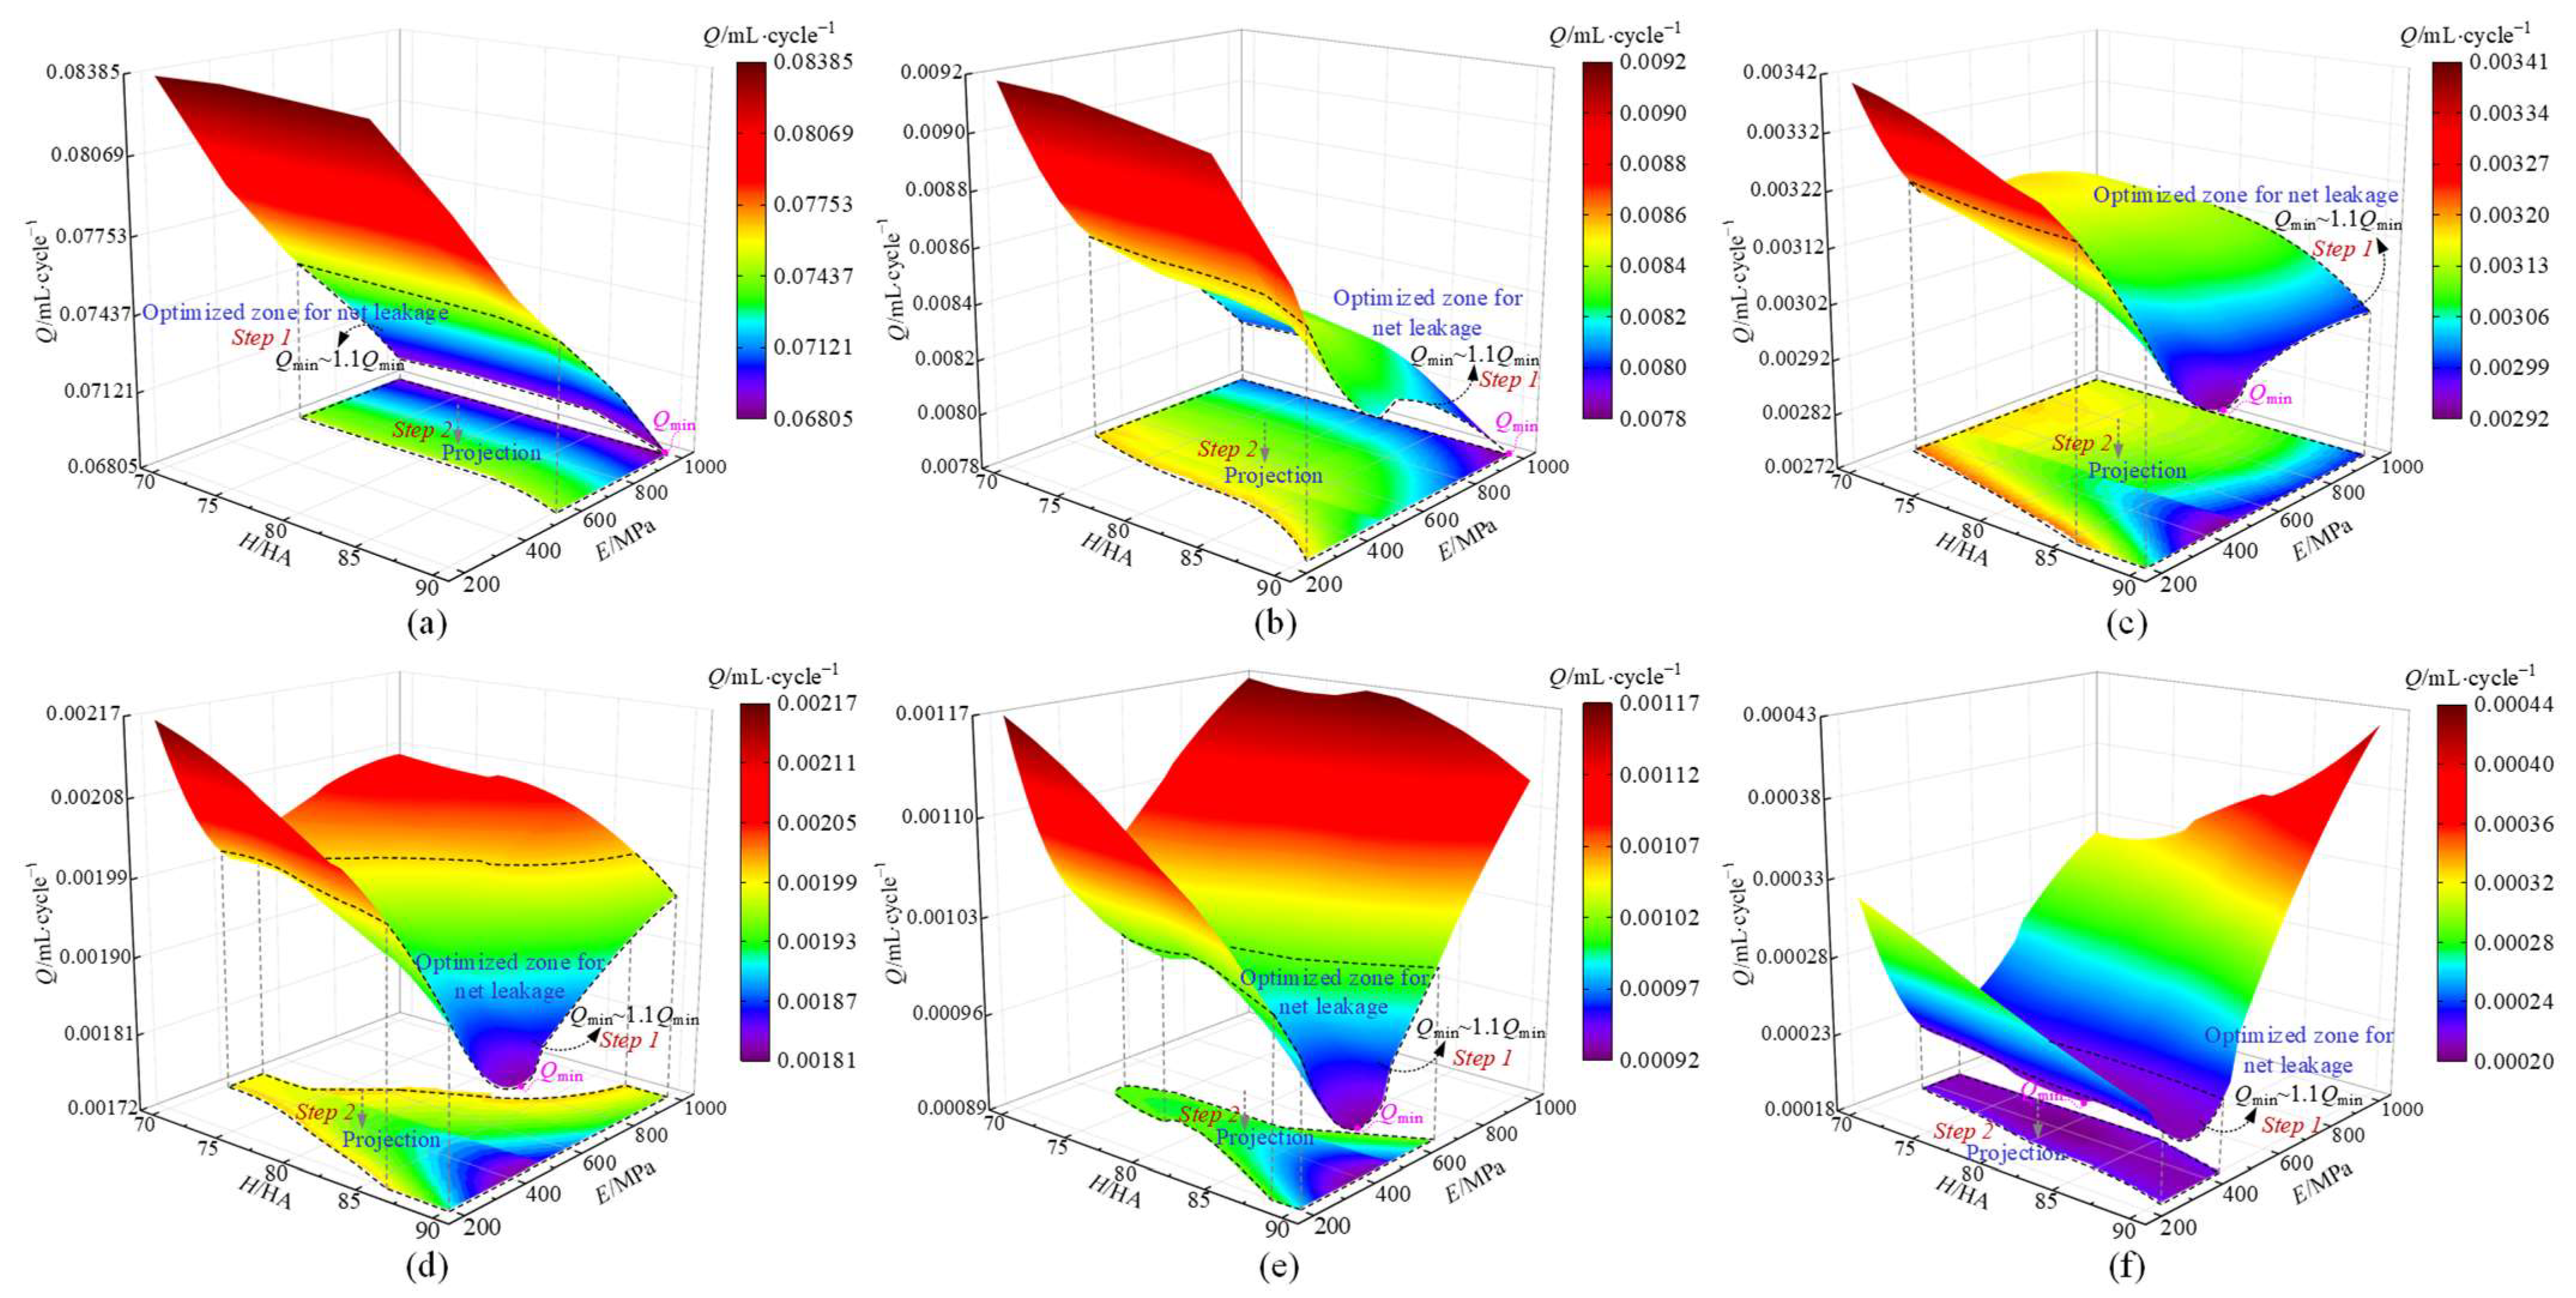
3.4. Optimized Selection of NBR Shore Hardness and PTFE Elastic Modulus

The optimized selection of NBR Shore hardness and PTFE elastic modulus under different operating conditions is carried out in this section, with the goal of reducing leakage and friction for the seal. According to the practical application, the net leakage is used as the evaluation criterion to characterize the leakage and the friction is the friction power loss. In order to obtain the optimized zone of NBR Shore hardness and PTFE elastic modulus, the optimization objectives and procedures are developed as follows:
Step 1: Select the low net leakage zone I with the criterion Q ≤ 1.1 Qmin, where Qmin is the minimum value of Q at a given operating condition.
Step 2: Obtain the optimized hardness and modulus zone II corresponding to the low net leakage zone I by projection.
Step 3: Determine the friction power loss corresponding to the optimized hardness and modulus zone II by mapping.
Step 4: Select the low friction power loss zone III within the optimized hardness and modulus zone II.
Step 5: Obtain the optimized hardness and modulus zone IV where net leakage and friction power loss are all low.
For a clear understanding of the optimization procedures, in the following case studies, the above steps are illustrated in Figure 11, Figure 12, Figure 13 and Figure 14. Figure 11 presents the influence of NBR Shore hardness and PTFE elastic modulus on net leakage when psealed = 10 MPa. It can be clearly seen from the net leakage response surface that there is a strong interaction between the influence of NBR Shore hardness and PTFE elastic modulus on net leakage. Obviously, the net leakage decreases with increasing NBR Shore hardness, while the decreasing magnitude also decreases with increasing PTFE elastic modulus, except at low speeds (0.01–0.1 m/s). In addition, the net leakage first increases and then decreases at low speeds, and increases at moderate (0.1–0.5 m/s) to high (>0.5 m/s) speeds as PTFE elastic modulus increases, with the changing magnitude increasing as the NBR Shore hardness increases. Therefore, in moderate-low pressure conditions, the seal with a high NBR Shore hardness but a low PTFE elastic modulus is recommended for reducing leakage. However, it should be noted that the low PTFE elastic modulus is inapplicable to anti-wear.
Figure 12 shows the influence of NBR Shore hardness and PTFE elastic modulus on friction power loss when psealed = 10 MPa. It is clearly illustrated that the friction power loss increases with increasing NBR Shore hardness and PTFE elastic modulus, especially the latter, while rod speed has little influence. According to the above optimization procedures, mapping the optimized hardness and modulus zone, which is the projection of the optimized zone for net leakage shown in Figure 11, onto the friction power loss response surface gives the optimized zone for friction power loss. Furthermore, selecting the low friction power loss zone within this response surface will result in low net leakage and low friction power loss. Therefore, it is recommended to select a high NBR Shore hardness and a low PTFE elastic modulus for the seal to achieve both low leakage and low friction at moderate-low pressure conditions, as shown in Table 2.
Figure 13 presents the influence of NBR Shore hardness and PTFE elastic modulus on net leakage when psealed = 28 MPa. It is clearly shown that the net leakage response surface is very different from Figure 11 for the same rod speed case as the sealed pressure increases. For the case of |U| = 0.01 m/s, from the response surface, the net leakage decreases sharply with increasing PTFE elastic modulus but decreases slightly with increasing NBR Shore hardness. As the rod speed increases, there is a valley that changes from the high PTFE elastic modulus position to the low PTFE elastic modulus position near the high NBR Shore hardness position. Therefore, the net leakage first decreases and then increases as the PTFE elastic modulus increases, and resulting in a more complex interaction between the influence of NBR Shore hardness and PTFE elastic modulus on net leakage. Meanwhile, the influence of NBR Shore hardness and PTFE elastic modulus on net leakage decreases as the rod speed increases (see also Figure 11). In addition, a higher PTFE elastic modulus seal should be recommended for high sealed pressure conditions to reduce leakage compared to moderate-low pressure conditions.
Figure 14 shows the influence of NBR Shore hardness and PTFE elastic modulus on friction power loss when psealed = 28 MPa. It is clearly illustrated that the friction power loss increases significantly as the PTFE elastic modulus increases but increases slightly as the NBR Shore hardness increases. Unlike the result shown in Figure 12, where the optimized zone is globally optimal, the minimum friction power loss here is not included in the optimized zone for friction power loss corresponding to low net leakage shown in Figure 13. Similarly, to select the low value zone within the optimized zone for friction power loss, compared to moderate-low pressure conditions, a relatively high PTFE elastic modulus but relatively low NBR Shore hardness are recommended for the seal to reduce leakage and friction at high sealed pressure conditions, as shown in Table 2.

4. Conclusions

  • NBR Shore hardness and PTFE elastic modulus have a significant influence on the deformation behavior and contact state of step rod seals, forming a sealing zone with different fluid film thickness and fluid film pressure, resulting in obvious changes in seal behavior and performance.
  • As NBR Shore hardness and PTFE elastic modulus increase, the static contact pressure increases, the minimum film thickness decreases, the friction force increases, and the leakage rate decreases. There is a strong interaction between the influence of NBR Shore hardness and PTFE elastic modulus on leakage under different operating conditions.
  • To reduce both leakage and friction in step rod seals, it is recommended that high NBR Shore hardness and low PTFE modulus be selected for moderate-low pressure or high speed conditions, and low NBR Shore hardness and high modulus be selected for high pressure or low speed conditions.

Author Contributions

Conceptualization, B.W., X.L. (Xiaoxuan Li) and X.P.; methodology, B.W., X.L. (Xiaoxuan Li), X.P., Y.L., X.L. (Xiang Li), Y.C. and J.J.; software, B.W. and X.L. (Xiaoxuan Li); validation, B.W.; formal analysis, B.W. and X.L. (Xiaoxuan Li); investigation, B.W. and X.L. (Xiaoxuan Li); resources, B.W., X.P. and Y.L.; data curation, Y.C. and J.J.; writing—original draft preparation, B.W. and X.L. (Xiaoxuan Li); writing—review and editing, B.W. and X.L. (Xiaoxuan Li); visualization, X.L. (Xiaoxuan Li); supervision, B.W., X.P. and Y.L.; project administration, B.W.; funding acquisition, B.W. All authors have read and agreed to the published version of the manuscript.

Funding

This research was funded by the National Natural Science Foundation of China (52005470), the Natural Science Foundation of Zhejiang Province (LQ21E050020), and the Fundamental Research Funds for the Provincial Universities of Zhejiang (2021YW17).

Data Availability Statement

Not applicable.

Conflicts of Interest

The authors declare no conflict of interest.

Nomenclature

cRSpecific heat of the rod
C10, C01Mooney–Rivlin coefficients
DRod diameter
E, E0, EPTFE elastic modulus, NBR elastic modulus, equivalent elastic modulus
fcDry friction coefficient
FRFriction force
h, hS, hTNominal film thickness, static film thickness, truncated film thickness
HNBR Shore hardness
InInfluence coefficient matrix
kRThermal conductivity of the rod
lHalf-length of the contact width
LLength of the sealing zone
LstrokeStroke length
paAmbient pressure
pcAsperity contact pressure
pcavCavitation pressure of fluid film
pfFluid film pressure
pscStatic contact pressure
psc.maxMaximum static contact pressure
psealedSealed pressure
qFlow rate
QNet leakage
QhHeat generation rate
RRadius of asperities
T, T0, TaFilm temperature, reference temperature, ambient temperature
URod speed
WFriction power loss
αViscosity–pressure coefficient
βViscosity–temperature coefficient
ηDensity of asperities
θFluid density ratio
µ, µ0Lubricant dynamic viscosity, lubricant dynamic viscosity at T0
υPoisson’s ratio of PTFE
ρThe density of the fluid film
ρLThe density of the fluid film in liquid phase
ρRThe density of the rod
σRoot mean square surface roughness
τc, τfContact shear stress, fluid viscous shear stress
ϕf, ϕfss, ϕfppShear stress factors
ϕs, ϕxShear flow factor, pressure flow factor

References

  1. Nikas, G.K. Eighty years of research on hydraulic reciprocating seals: Review of tribological studies and related topics since the 1930s. Proc. Inst. Mech. Eng. Part J J. Eng. Tribol. 2010, 224, 1–23. [Google Scholar] [CrossRef]
  2. Tan, B.; Stephens, L.S. Evaluation of viscoelastic characteristics of PTFE-Based materials. Tribol. Int. 2019, 140, 105870. [Google Scholar] [CrossRef]
  3. Yang, B.; Salant, R.F. Soft EHL simulations of U-Cup and step hydraulic rod seals. J. Tribol. 2009, 131, 021501. [Google Scholar] [CrossRef]
  4. Wang, B.; Peng, X.; Meng, X. Simulation of the effects of non-Newtonian fluid on the behavior of a step hydraulic rod seal based on a power law fluid model. J. Zhejiang Univ.-Sci. A 2018, 19, 824–842. [Google Scholar] [CrossRef]
  5. Heipl, O.; Murrenhoff, H. Friction of hydraulic rod seals at high velocities. Tribol. Int. 2015, 85, 66–73. [Google Scholar] [CrossRef]
  6. Li, Y.; Wang, J.; Lian, Z. High-speed friction and sealing characteristics of step seal under mixed lubrication conditions. China Mech. Eng. 2021, 32, 533–539. [Google Scholar] [CrossRef]
  7. Zhang, M.; Feng, Y. Numerical model of mixed lubrication and experimental study of reciprocating seal based on inverse lubrication theory. Lubricants 2022, 10, 153. [Google Scholar] [CrossRef]
  8. Ran, H.; Wang, S.; Liu, D. A multiscale wear model for reciprocating rod stepseal under mixed lubricating conditions based on linear elasticity. Proc. Inst. Mech. Eng. Part J J. Eng. Tribol. 2021, 235, 161–180. [Google Scholar] [CrossRef]
  9. Wang, J.; Li, J.; Ma, C. A performance degradation analysis method for a reciprocating rod seal in the wear process under mixed lubrication conditions. Proc. Inst. Mech. Eng. Part J J. Eng. Tribol. 2023, 237, 681–697. [Google Scholar] [CrossRef]
  10. Guo, F.; Jia, X.; Lv, M.; Wang, L.; Salant, R.F.; Wang, Y. The effect of aging in oil on the performance of a radial lip seal. Tribol. Int. 2014, 78, 187–194. [Google Scholar] [CrossRef]
  11. Peng, C.; Ouyang, X.; Schmitz, K.; Wang, W.; Guo, S.; Yang, H. Investigation of the tribological performance of reciprocating seals in a wide temperature range. Proc. Inst. Mech. Eng. Part J J. Eng. Tribol. 2021, 235, 2396–2414. [Google Scholar] [CrossRef]
  12. Nikas, G.K.; Sayles, R.S. Nonlinear elasticity of rectangular elastomeric seals and its effect on elastohydrodynamic numerical analysis. Tribol. Int. 2004, 37, 651–660. [Google Scholar] [CrossRef]
  13. Nikas, G.K. Parametric and optimization study of rectangular-rounded, hydraulic, elastomeric, reciprocating seals at temperatures between –54 and +135 °C. Lubricants 2018, 6, 77. [Google Scholar] [CrossRef]
  14. Bouaziz, R.; Truffault, L.; Borisov, R.; Ovalle, C.; Laiarinandrasana, L.; Miquelard-Garnier, G.; Fayolle, B. Elastic properties of polychloroprene rubbers in tension and compression during ageing. Polymers 2020, 12, 2354. [Google Scholar] [CrossRef]
  15. Gent, A.N. On the relation between indentation hardness and Young’s modulus. Rubber Chem. Technol. 1958, 31, 896–906. [Google Scholar] [CrossRef]
  16. Gent, A.N. Engineering with Rubber: How to Design Rubber Components, 3rd ed.; Carl Hanser Verlag: München, Germany, 2012; pp. 37–41. [Google Scholar]
  17. Ucar, H.; Basdogan, I. Dynamic characterization and modeling of rubber shock absorbers: A comprehensive case study. J. Low Freq. Noise Vib. Act. Control 2018, 37, 509–518. [Google Scholar] [CrossRef]
  18. Feyzullahoğlu, E. Abrasive wear, thermal and viscoelastic behaviors of rubber seal materials used in different working conditions. Proc. Inst. Mech. Eng. Part J J. Eng. Tribol. 2015, 229, 64–73. [Google Scholar] [CrossRef]
  19. Han, D.; Che, W. Comparison of the shear modulus of an offshore elastomeric bearing between numerical simulation and experiment. Appl. Sci. 2021, 11, 4384. [Google Scholar] [CrossRef]
  20. Liao, C.; Huang, W.; Wang, Y.; Suo, S.; Liu, Y. Fluid-solid interaction model for hydraulic reciprocating O-ring seals. Chin. J. Mech. Eng. 2013, 26, 85–94. [Google Scholar] [CrossRef]
  21. Zahabi, S.R.; Sheikhzadeh, M.; Shahramforouz, F.; Ko, F. The micro/macro mechanical approach of reinforced braid composite used in tribology. J. Compos. Mater. 2021, 55, 3813–3825. [Google Scholar] [CrossRef]
  22. Bao, Y.W.; Wang, W.; Zhou, Y.C. Investigation of the relationship between elastic modulus and hardness based on depth-sensing indentation measurements. Acta Mater. 2004, 52, 5397–5404. [Google Scholar] [CrossRef]
  23. Wang, B.; Peng, X.; Meng, X. Analysis of sealing performance of a hydraulic Glyd-ring seal based on soft EHL model. Tribology 2018, 38, 75–83. [Google Scholar] [CrossRef]
  24. Yang, B.; Salant, R.F. Elastohydrodynamic lubrication simulation of O-ring and U-cup hydraulic seals. Proc. Inst. Mech. Eng. Part J J. Eng. Tribol. 2011, 225, 603–610. [Google Scholar] [CrossRef]
  25. Bhushan, B. Principles and Applications of Tribology, 2nd ed.; Wiley: New York, NY, USA, 1999; pp. 403–444. [Google Scholar]
Figure 1. Schematic diagram of a step combined rod seal installed on a linear hydraulic actuator.
Lubricants 11 00367 g001
Figure 2. Flowchart of the computational procedure.
Lubricants 11 00367 g002
Figure 3. Model validation.
Lubricants 11 00367 g003
Figure 4. Validation of mesh independence.
Lubricants 11 00367 g004
Figure 5. Influence of NBR Shore hardness on static contact pressure distribution at different sealed pressures.
Lubricants 11 00367 g005
Figure 6. Influence of NBR Shore hardness on fluid film thickness distribution: (a) (outstroke, psealed = 0.1 MPa), (c) (instroke, psealed = 10 MPa), (e) (instroke, psealed = 28 MPa) and fluid film pressure distribution: (b) (outstroke, psealed = 0.1 MPa), (d) (instroke, psealed = 10 MPa), (f) (instroke, psealed = 28 MPa).
Lubricants 11 00367 g006aLubricants 11 00367 g006b
Figure 7. Influence of NBR Shore hardness on fluid flow rate: (a) (outstroke, psealed = 0.1 MPa), (c) (instroke, psealed = 10 MPa), (e) (instroke, psealed = 28 MPa) and friction force: (b) (outstroke, psealed = 0.1 MPa), (d) (instroke, psealed = 10 MPa), (f) (instroke, psealed = 28 MPa).
Lubricants 11 00367 g007
Figure 8. Influence of PTFE elastic modulus on static contact pressure distribution at different sealed pressures.
Lubricants 11 00367 g008
Figure 9. Influence of PTFE elastic modulus on fluid film thickness distribution: (a) (outstroke, psealed = 0.1 MPa), (c) (instroke, psealed = 10 MPa), (e) (instroke, psealed = 28 MPa) and fluid film pressure distribution: (b) (outstroke, psealed = 0.1 MPa), (d) (instroke, psealed = 10 MPa), (f) (instroke, psealed = 28 MPa).
Lubricants 11 00367 g009aLubricants 11 00367 g009b
Figure 10. Influence of PTFE elastic modulus on fluid flow rate: (a) (outstroke, psealed = 0.1 MPa), (c) (instroke, psealed = 10 MPa), (e) (instroke, psealed = 28 MPa) and friction force: (b) (outstroke, psealed = 0.1 MPa), (d) (instroke, psealed = 10 MPa), (f) (instroke, psealed = 28 MPa).
Lubricants 11 00367 g010
Figure 11. Influence of NBR Shore hardness and PTFE elastic modulus on net leakage (psealed = 10 MPa): (a) |U| = 0.01 m/s, (b) |U| = 0.1 m/s, (c) |U| = 0.3 m/s, (d) |U| = 0.5 m/s, (e) |U| = 1.0 m/s, (f) |U| = 3.0 m/s.
Lubricants 11 00367 g011
Figure 12. Influence of NBR Shore hardness and PTFE elastic modulus on friction power loss (psealed = 10 MPa): (a) |U| = 0.01 m/s, (b) |U| = 0.1 m/s, (c) |U| = 0.3 m/s, (d) |U| = 0.5 m/s, (e) |U| = 1.0 m/s, (f) |U| = 3.0 m/s.
Lubricants 11 00367 g012
Figure 13. Influence of NBR Shore hardness and PTFE elastic modulus on net leakage (psealed = 28 MPa): (a) |U| = 0.01 m/s, (b) |U| = 0.1 m/s, (c) |U| = 0.3 m/s, (d) |U| = 0.5 m/s, (e) |U| = 1.0 m/s, (f) |U| = 3.0 m/s.
Lubricants 11 00367 g013
Figure 14. Influence of NBR Shore hardness and PTFE elastic modulus on friction power loss (psealed = 28 MPa): (a) |U| = 0.01 m/s, (b) |U| = 0.1 m/s, (c) |U| = 0.3 m/s, (d) |U| = 0.5 m/s, (e) |U| = 1.0 m/s, (f) |U| = 3.0 m/s.
Lubricants 11 00367 g014
Table 1. Computational parameters.
Item and SymbolDimensions and Data
O-ring materialNitrile butadiene rubber
Rubber Shore hardness, H70 HA–90 HA
PTFE ring materialPolytetrafluoroethylene (PTFE)
Poisson’s ratio of PTFE, υ0.45
PTFE elastic modulus, E200 MPa–1000 MPa
O-ring cross-section diameter, d 3.53 mm
Rod diameter, D32 mm
Stroke length, Lstroke100 mm
Specific heat of rod, cR460 J·kg–1·K–1
Thermal conductivity of rod, kR46 W·m −1·K–1
Density of rod, ρR7900 kg·m–3
Reference viscosity, µ00.0117 Pa·s
Viscosity–pressure coefficient, α2.0 × 10⁻⁸ Pa–1
Viscosity–temperature coefficient, β1.63335 × 10⁻² K–1
Rod speed, U0.01 m·s–1–3.0 m·s–1
Sealed pressure, psealed0.1 MPa (Outstroke); 10 MPa/28 MPa (Instroke)
RMS roughness of seal, σ0.6 µm
Dry friction coefficient, fc0.1
Radius of asperities, R1.0 µm
Density of asperities, η1.0 × 10¹⁴ m–2
Ambient temperature, Ta300 K
Reference temperature, T0313.5 K
Table 2. Optimized zone of NBR Shore hardness and PTFE elastic modulus under different operating conditions.
Sealed Pressure psealed (MPa)Rod Speed U (m/s)NBR Shore Hardness H (HA)PTFE Elastic Modulus E (MPa)
10 (Moderate-low pressure)0.01–0.1 (Low speed)85–90200–300
10 (Moderate-low pressure)0.1–0.5 (Moderate speed)85–90200–260
10 (Moderate-low pressure)0.5–3.0 (High speed)85–90200–220
28 (High pressure)0.01–0.1 (Low speed)70–80600–800
28 (High pressure)0.1–0.5 (Moderate speed)70–85400–500
28 (High pressure)0.5–3.0 (High speed)70–90350–450
Disclaimer/Publisher’s Note: The statements, opinions and data contained in all publications are solely those of the individual author(s) and contributor(s) and not of MDPI and/or the editor(s). MDPI and/or the editor(s) disclaim responsibility for any injury to people or property resulting from any ideas, methods, instructions or products referred to in the content.

