Article

Understanding the Machinability and Energy Consumption of Al-Based Hybrid Composites under Sustainable Conditions

Department of Electricity and Energy, Vocational School of Technical Sciences, Bingöl University, Bingöl 12000, Turkey
Lubricants 2023, 11(3), 111; https://doi.org/10.3390/lubricants11030111
Submission received: 7 February 2023 / Revised: 1 March 2023 / Accepted: 2 March 2023 / Published: 3 March 2023
(This article belongs to the Special Issue Advances in Sustainable Machining)

Abstract

:
Tribological properties are directly related to cutting efficiency. To achieve high machinability performances, sustainable coolants (minimum quantity lubricant (MQL), cryogenic etc.) have been used instead of conventional cutting fluids in recent years. This study used MQL and cryogenic-cooling techniques while milling Al-based hybrid composites. The effects of different cutting environments on flank wear, surface roughness, cutting temperature, and energy consumption were analyzed according to the Taguchi method. According to the findings, the best cutting environment for surface roughness, flank wear, and cutting temperature is the cryo-LN2-assisted cooling technique. In terms of energy consumption, MQL was found to be more efficient than cryo-LN2 and dry environments. According to SEM/EDS analysis, BUE formation was observed at the tool edges during milling in dry conditions. It was determined that cutting tool surfaces are smoother in MQL and cryo-LN2 environments. The effect ratios of control factors on response parameters were determined according to Taguchi analysis. As a result, it was concluded that MQL and cryo-LN2 strategies could be evaluated within the scope of sustainable conditions.

Graphical Abstract

1. Introduction

Composites reinforced with structures such as particles or fibers have higher mechanical and tribological performances compared to unreinforced metals and alloys [1]. These composites, which have superior properties, attract attention with their ability to work in different conditions and their use in many areas. Aluminum is often used as the main matrix. Using copper as the second matrix gives different properties to the matrix structure. Silicon carbide and aluminum oxide are the most commonly used reinforcements in metal matrix composite (MMC) materials [2,3]. Thanks to their superior properties, such as easy manufacturing and low costs, particle-reinforced composites are used in many areas [4]. Hybrid composites formed by adding different reinforcements into aluminum are frequently preferred, especially in the aviation and automotive sectors.
MMCs reinforced with reinforcement particles may have poor machinability performance due to hard reinforcements [5]. Difficult-to-cut materials during machining cause serious tool failures due to extremely high temperatures [6,7]. Conventional cutting fluids are used to overcome these adverse conditions [8]. However, employing these coolants has many negative impacts on the environment and people’s health. Many researchers have investigated different cooling/lubrication techniques to minimize the effect of this disadvantageous situation [9,10,11]. Among these strategies, the minimum-quantity lubricant (MQL) method has been employed as an alternative more often in recent years [12,13,14]. Mia et al. [15] focused on MQL-assisted hard-turning analyses, such as surface roughness, tool life, and material removal rate. To conduct their experiments, they relied on a Taguchi orthogonal array and optimized their results based on the signal-to-noise ratio. According to their findings, cutting speed influences surface roughness, depth of cut influences tool wear, and feed rate influences material removal rate. Sarıkaya and Güllü [16] analyzed the surface roughness of AISI 1050 steel in an MQL environment. According to their findings, the feed rate was the most influential element in surface roughness. It was also reported that the MQL environment is the best tool for improving surface quality. Race et al. [17] investigated tool wear, surface roughness, residual stress, and energy consumption of SA516 carbon steel under MQL conditions. During machining in the MQL environment, significant improvements in surface quality and tool wear were observed. In addition to cost-saving and environmental benefits, MQL-assisted processing has been credited with reducing costs.
The environmentally friendly cryogenic-cooling technique has attracted the attention of many researchers in recent years [18,19,20]. Nitrogen and carbon dioxide are usually liquids used in cryogenic-cooling techniques. In this study, Al2O3 (aluminum oxide) and SiC (silicon carbide) particles added to the Al-Cu (aluminum-copper) matrix made machinability difficult. Due to the hardness and high strength of reinforcement particles, temperatures can rise to high levels during the cutting process. High temperatures cause adverse conditions, such as plastic deformation and rapid tool wear [21,22]. In the cryogenic cooling strategy, cold fog vapor is transferred to the cutting zone [23]. Consequently, the temperatures in the cutting zone may be decreased to a minimum. In this way, the workpiece’s surface integrity is preserved, and the wear of the cutting tool can be reduced [24,25]. It was reported that surface quality could be increased with different cutting parameters using the cryogenic-cooling method [26]. Gupta et al. [27] examined the tribological performance of a Ti6Al4V alloy with cryogenic cooling. According to reports, cryogenic-assisted cooling may be a viable method. Morkavuk et al. [28] used cryogenic cutting fluids to mill carbon-fiber-reinforced plastics (CFRPs). It was reported that less damage occurs on the treated surfaces, and a higher quality surface is obtained thanks to the cryogenic environment.
In this study, novel Al-5Cu-based hybrid-reinforced (Al2O3-SiC) composites were milled in different cutting parameters and cutting environments and evaluated in terms of machinability and energy consumption. There are limited studies on the sustainable milling of novel aluminum-based hybrid composites. For this purpose, surface roughness, flank wear, cutting temperature, and energy consumption analyses are discussed in detail.

2. Materials and Methods

2.1. Experimental Setup

Several industries employ Al-based hybrid composites as structural materials (space, automotive, aerospace, etc.). For this purpose, hybrid composites were produced by the hot-pressing method using commercially available powder particles (Al < 44 µm, Cu < 44 µm, Al2O3 < 50 µm, SiC < 50 µm). Powder mixing ratios are shown in Table 1.
A computer-controlled milling machine (DAHLIH MCV-860) was used for the milling experiments. HM90 APKT 1003PDR IC908 coded cutting tools with Al-TIN coated with PVD method, and parallelogram geometry was used. The inserts were mounted on the APKTHM10 12-1-120 shank carding router. The cutting tool is attached to the CNC machine with a tool holder with a tool collet (MAS 403 BT 40 ER 32x70). Three cutting speeds (200–250–300 m/min), three feed rates (0.20–0.25–0.30 mm/rev), and a single cutting depth (0.5 mm) were selected as the cutting parameters. The suggestions given by the tool manufacturer were used to calculate the cutting settings. Dry, MQL, and cryo-LN2 techniques were used as cutting environments. Table 2 shows the machinability parameters and levels.

2.2. Cooling Environments

The primary focus of this research are the impacts of three different cutting conditions (dry, MQL, and cryo-LN2) on machinability and energy consumption. No cutting fluid is used in a dry environment. The purpose of the MQL environment is to carry a small amount of oil into the cutting area in the form of a mist. The cutting zone was cooled and lubricated with an MQL system (Werte Micro Stn-15), which was regulated by a potentiometer. Cuttex Syn5 cutting fluid was sprayed onto the cutting area regularly under pressure. MQL parameters (compressor pressure 7 bar, flow rate 50 mL/h, nozzle diameter 5 mm, and spray angle 35°) were determined by a detailed literature search and manufacturer’s recommendations. Figure 1 shows the schematic of the cooling environment during milling.
In the experiments, a special self-pressurized 35 L tank (Taylor Wharton LD-35) containing liquid nitrogen (LN2) was used for the cryogenic-cooling environment. A nozzle with a diameter of 5 mm was used to direct the flow of liquid nitrogen into the cutting zone. To prevent heat loss, a two-meter-long vacuum spiral steel-coated hose was used between the tank and the cutting zone. In the experiments, similar conditions were applied to the MQL parameters to make comparisons correctly.

2.3. Measuring Instruments and Methods

To establish the impact of the cutting conditions employed in the studies, the temperatures during tool–chip contact were monitored. Using an infrared camera (Testo 871), the temperatures in the deformation zone were measured. High temperatures during machining hurt tool life. Therefore, the effects of cooling techniques are significant. Surface quality and integrity in machining are important parameters associated with many phenomena. Surface roughness analyses were measured using EN ISO 4287 standards. Roughness measurements on the milled surfaces were made using the TIME3200 device. Each measurement was made five times to reduce measurement errors. The average surface roughness was calculated with the help of Equation (1).
R a = 0 L d v L d dx ,
Here, “Ra” represents the arithmetic mean surface roughness, “Ld” represents the measured distance, and “v” represents the variation from the nominal surface. The 3D surface profiles of the machined surfaces were determined with the Ntegra Solaris type atomic force microscope. Flank wear measurements and energy-dispersive X-ray spectroscopy (EDS) analyses were performed on a JEOL JSM 6510 scanning electron microscope (SEM). The measurements were obtained from the side of the cutting tool, taking into consideration the most worn region by ISO standards. A power analyzer (HIOKI-PW3198) with 0.1% measurement accuracy was used to analyze power consumption. The necessary connections of the analyzer were completed to determine the power drawn from the machine tool. The spent energy consumption results were recorded using special software. Figure 2 shows the power consumption values obtained from experiment No. 1.

2.4. Statistical Analysis

Using the Taguchi approach in machinability analysis, optimal parameters may be established, and economy can be gained by lowering the number of tests. The Taguchi L18 orthogonal array was employed for the experiments. Many researchers widely use this analysis to determine the optimum parameters. This method is used to analyze processing problems and to obtain more results with fewer experiments [29]. The experimental design is shown in Table 3. In the Taguchi technique, a function is used to correlate the experimental findings with the intended values. Through the use of the Minitab program, this function was transformed into a signal-to-noise (S/N) ratio. Because the smallest values are better in the results obtained in the experiments, the “smaller is better” option was applied. Using Equation (2), the S/N ratios were calculated.
S / N smaller   is   better = 10   log     1 n   i = 1 n   y 2   ,
Here, “y” indicates the response parameters (surface roughness, flank wear, cutting temperature, and energy consumption), “n” denotes the number of repetitions under the test circumstances, and “i” is the number of repetitions.

3. Results and Discussion

3.1. Composite Fabrication

Hybrid composites were produced by hot-pressing using fixed-ratio (5%) copper in aluminum powders and Al2O3-SiC reinforcements with the mixing ratios listed in Table 1. Microstructural analyses of the produced hybrid composites were made. Figure 3a–g represents the SEM/EDS images of sample 6 with all powder particles together. It is possible to say that the powder particles contained in the matrix display uniform distribution. In EDS analysis, elements in the spectrum 1 region were determined. At the same time, elemental-mapping analysis and backscattered images proved the presence of powder particles in the structure.

3.2. Surface Roughness Analysis

Surface quality is one of the most important variables in determining machining performances in machining operations. The measurement of a quality surface can be determined by surface roughness. To assess cutting performance and to determine the influence of cooling conditions on the process, surface roughness evaluations should be undertaken [30]. Figure 4a–c depicts 3D surface plots illustrating the impact of various cutting variables and conditions on surface roughness.
When evaluated in terms of cutting environments, cryogenic-LN2 cooling seems to be more effective. As temperatures in the cutting zone decrease, the surface roughness values also decrease. The interaction of the cutting tool with the chip and workpiece can also cause a reduction in surface roughness [31]. Sample 1′s surface roughness was measured to be 0.478 m at a 200 m/min cutting speed, 0.20 mm/rev feed rate, and cryo-LN2 cutting conditions. It was observed that when cutting speed is increased, surface roughness also rises. The temperature during the contact between the tool and the chip rises directly due to increased cutting speed. The surface quality is negatively impacted by the rise in temperature in the cutting zone indirectly. BUE formed at the cutting tool edge in MMCs is an important phenomenon that affects all machinability parameters. High temperatures during processing accelerate BUE formation [32]. Due to the formation of BUE, the print on the workpiece surface may adversely affect surface quality. In addition, it can be said that BUE, which is formed as a result of friction at the tool–chip interface, is also very effective in chip formation. This study shows that surface quality decreases due to high temperatures and BUE formation in the dry-cutting environment. A previous study reported that surface quality decreased as the BUE formed in the dry machining environment spread on the cutting tool edge [33].
Figure 5 depicts the 3D and 2D surface topographies of hybrid composites milled under various cutting conditions. Because the interaction between the cutting tool and the workpiece during material processing is related to all cutting parameters, the surface properties should be considered whole. This provide a detailed perspective for the assessment of surface quality. In this context, it will be possible to monitor changes in surface quality with three-dimensional surface topography.
When the surface topographies are examined, it is seen that the roughness values decrease as one goes from the dry environment to the cryo-LN2-cooling environment. High peaks and deep valleys were observed in all regions in dry and MQL environments. A smoother surface was obtained in the cryo-LN2 environment than in the other two. However, certain irregularities are observed in some areas. Cryogenic cooling was reported to reduce tool wear and microstructural changes on the machined surface [34].

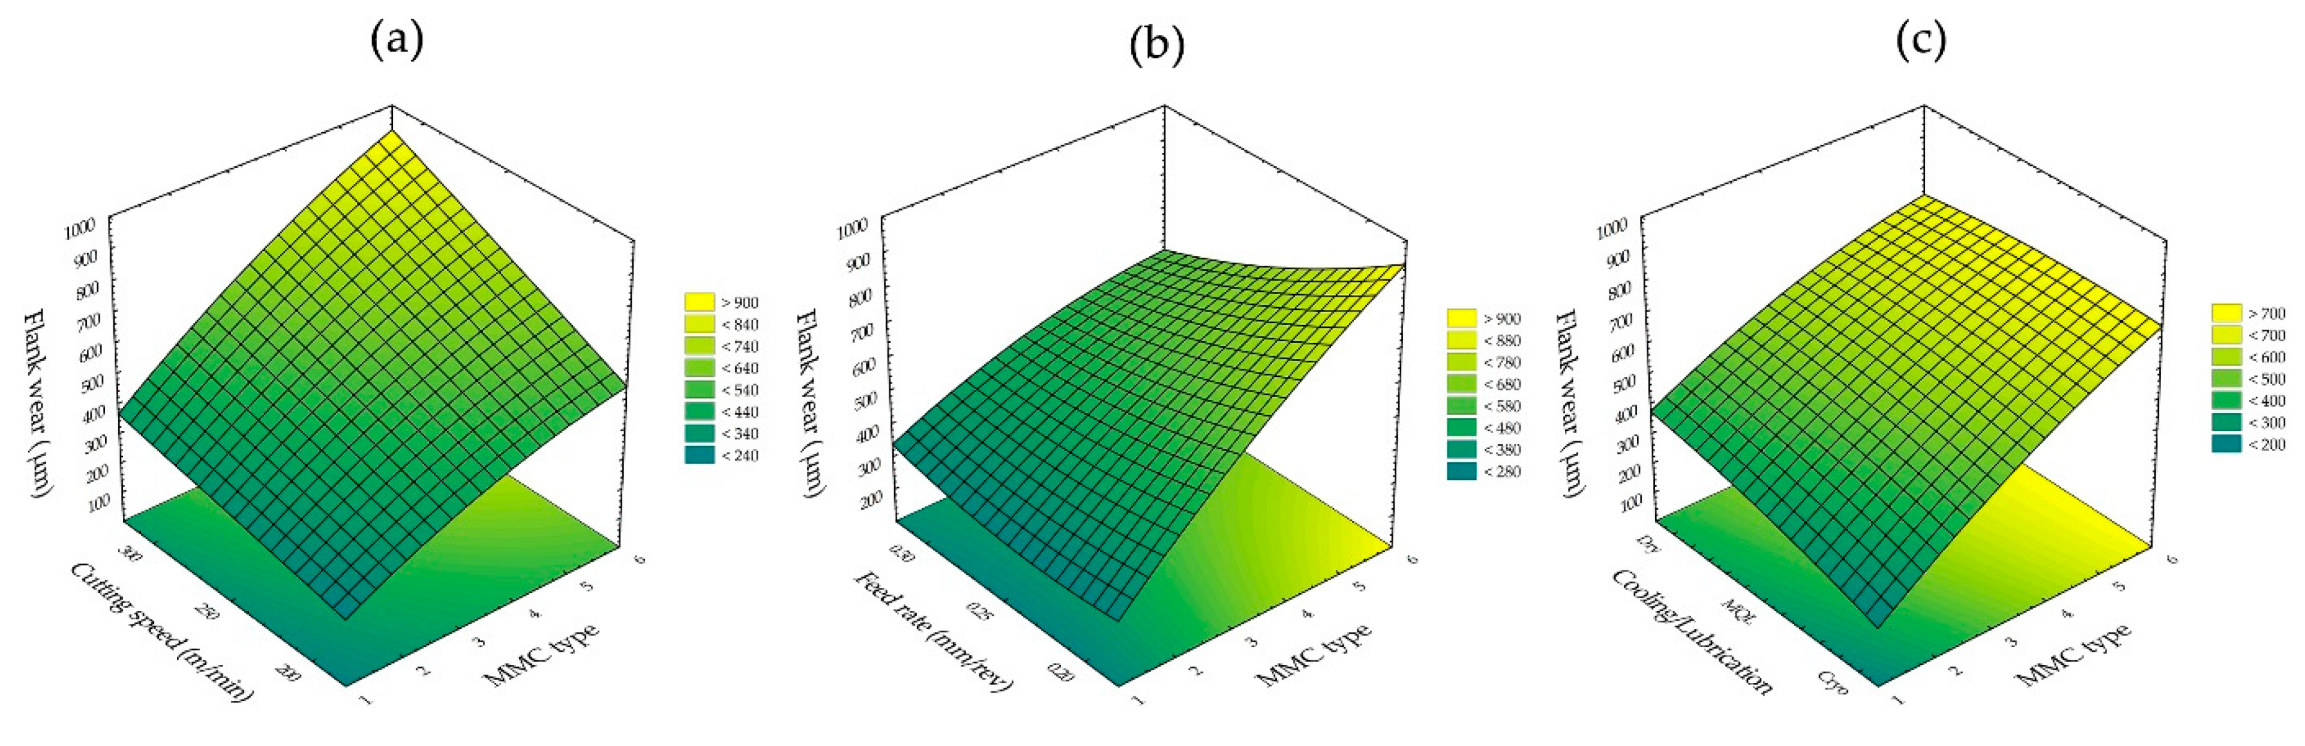
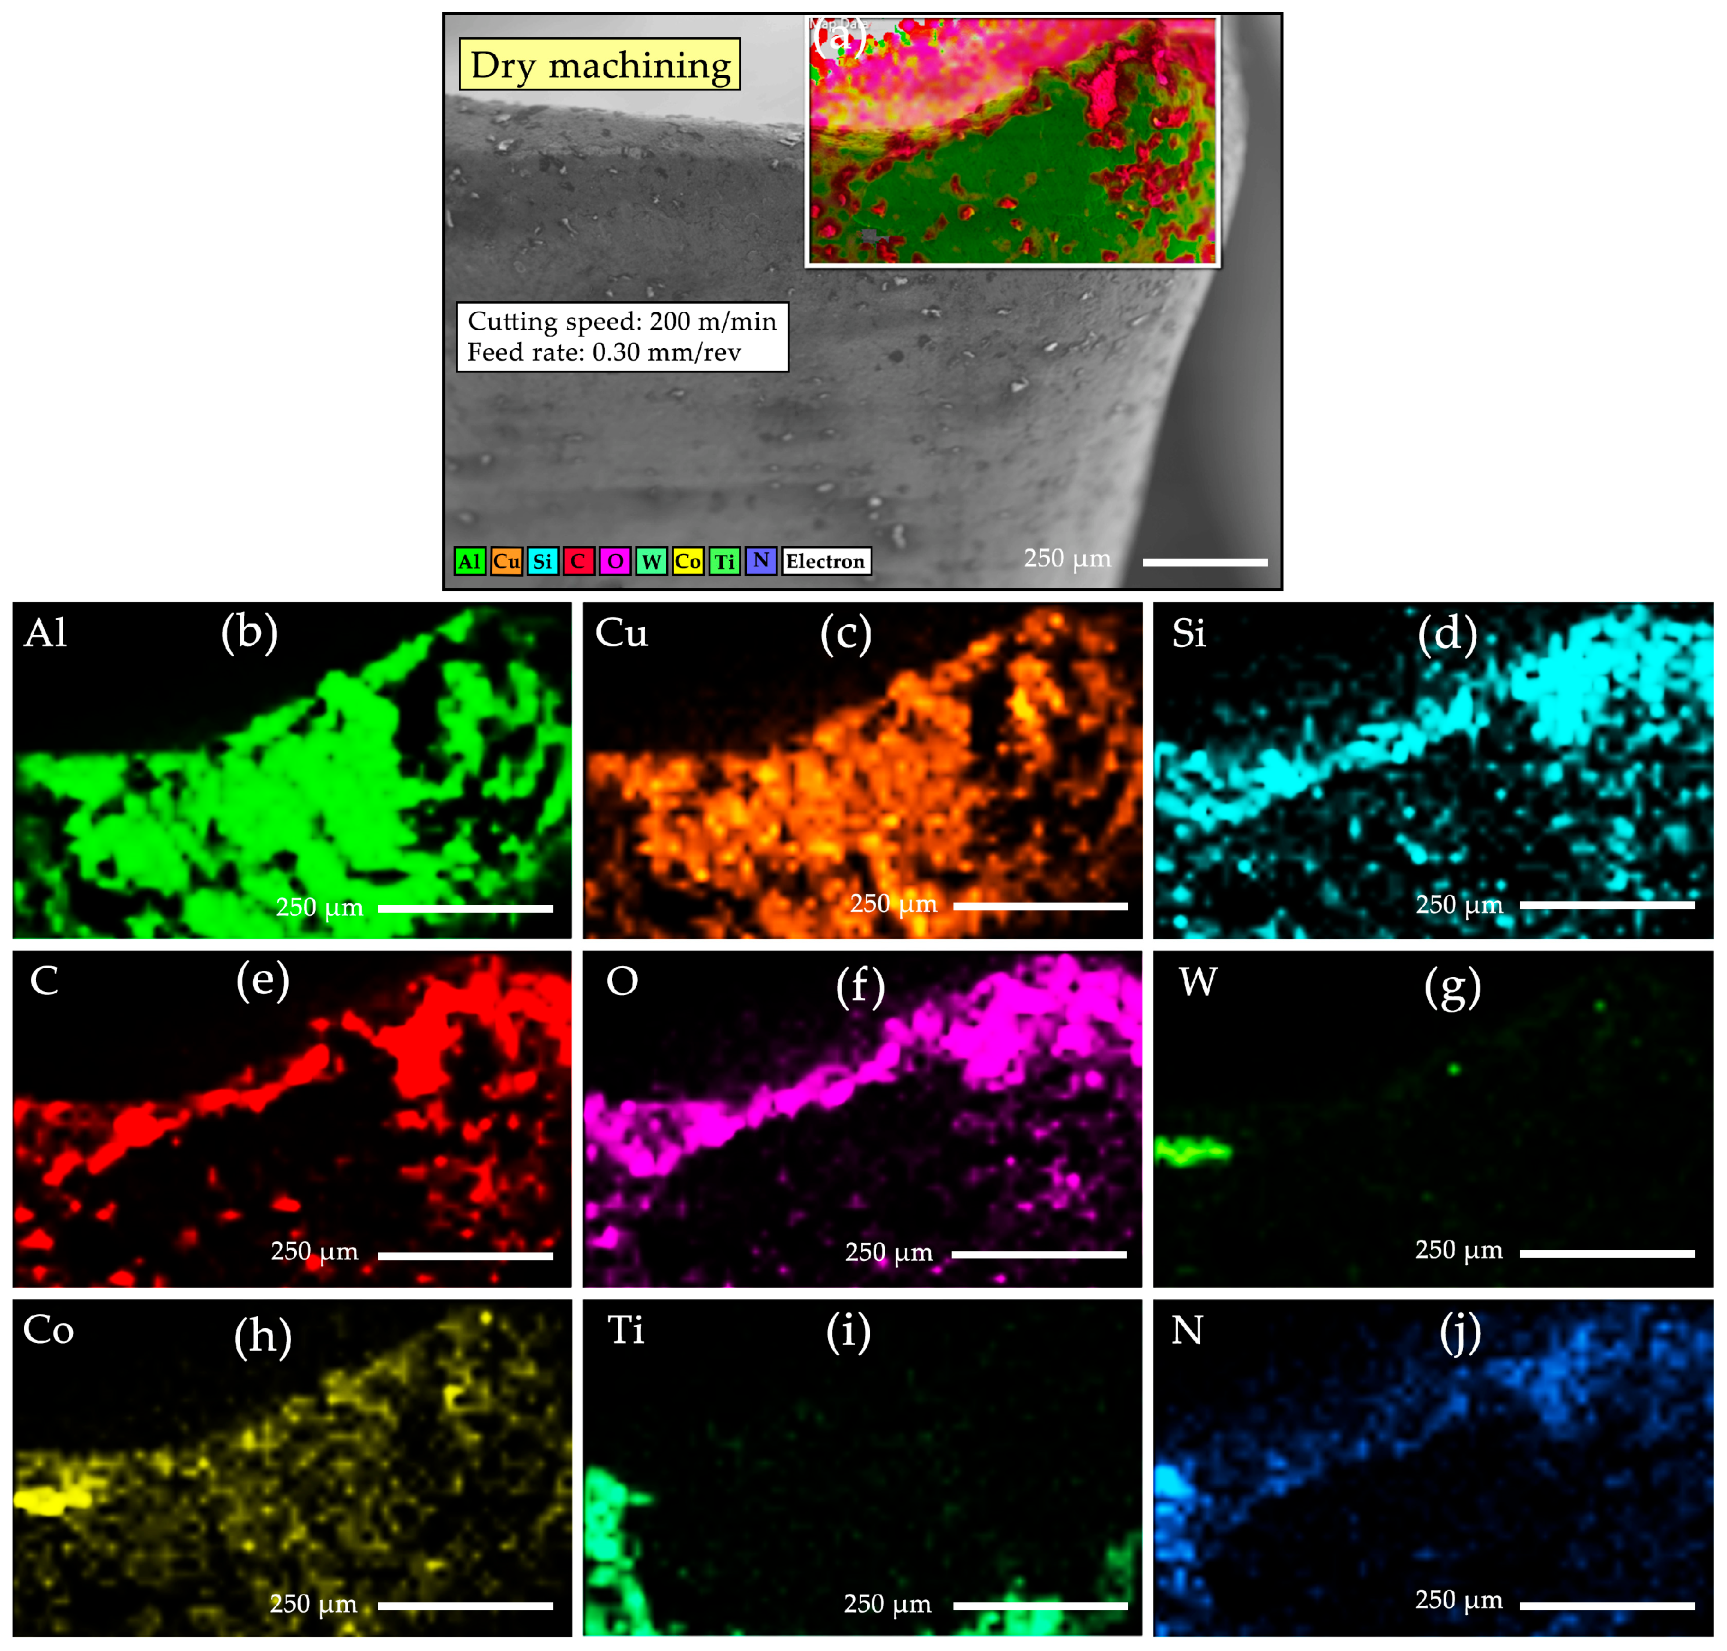
3.3. Flank Wear Analysis

It can be said that many parameters that affect tool wear (energy consumption, surface roughness, tool life, cutting temperature, etc.) have a direct effect on machinability performance. Hence, analyzing and evaluating tool wear is crucial. This section analyzes, in depth, the wear conditions of the cutting tool under various cutting settings and cooling circumstances. The graphs in Figure 6a–c illustrate the impact of flank wear on various cutting variables and conditions. The dry environment has the worst performance among all cutting parameters. It was reported that wear performance decreases in the dry environment due to the temperature and friction conditions at the tool–chip interface [35]. MQL-assisted cooling was found to be more effective compared to dry environments. In the MQL system, the cutting fluid, which is pressurized and sprayed in small amounts, provides more effective cooling and improves wear performance. A small amount of liquid, transferred to the cutting zone as a fog cloud, can penetrate small areas on the fast-rotating machine tool [36].
Several earlier studies have shown the importance of cryogenic-cooling methods in machinability. With the cryogenic-cooling regime, damage caused by thermal effects can be prevented, and temperatures that adversely affect the structural properties of the workpiece can be reduced [37]. With the cryogenic-cooling technique, the cutting tool’s performance increases, and the workpiece’s corrosion resistance is improved [38]. This study determined that the cutting environment that shows the best performance in cutting tool wear was cryogenic-LN2. The lowest flank wear value was recorded at 200 m/min cutting speed, 0.20 mm/rev feed rate, and 250 µm in the cryogenic-LN2 cutting environment. It was observed that an increase in cutting speed increases flank wear, whereas an increase in feed rate somewhat lowers flank wear.
Figure 7 represents the wear images of the flank and rake faces of the cutting tool as a result of milling Al-5Cu/Al2O3-SiC hybrid composites in dry, MQL, and cryogenic-LN2 cutting environments. One of the most important findings from experiments is that cryogenic cooling is the most effective way to minimize tool wear. Thermal stability may be disturbed due to continued chip production and plastic deformation in the cutting zone. Thermal stability can be achieved by reducing temperatures with cryogenic cooling and forced convection. Thus, negative situations caused by high temperatures can be eliminated [39]. The cryo tempering effect increases wear performance in materials processed at very low temperatures [40]. Evidence in the literature showing that the cryogenic environment improves tool wear performance supports this study [41,42].
Figure 8 represents the SEM/EDS analysis showing BUE formation at the cutting tool edge after dry machining.
Figure 9a–j illustrates the elemental-mapping analysis of the structure produced at the cutting tool edge as a result of milling in a dry-cutting environment. When the mapping images are examined, the tool elements (Al, Ti, Co, W, N) and the workpiece elements (Al, Cu, Si, C, O) can be seen on the cutting tool. There may be more than one reason for the appearance of all elements on the cutting tool. One of these causes is the interaction between the cutting tool and the workpiece. In the second case, the thermal conductivity of the workpiece causes the temperatures in the cutting zone to increase. Thus, the diffusion mechanism becomes effective [43]. Common types of tool failure in cutting tools include abrasive, adhesive, and diffusion wear. In this study, adhesive and diffusion wear occurred.

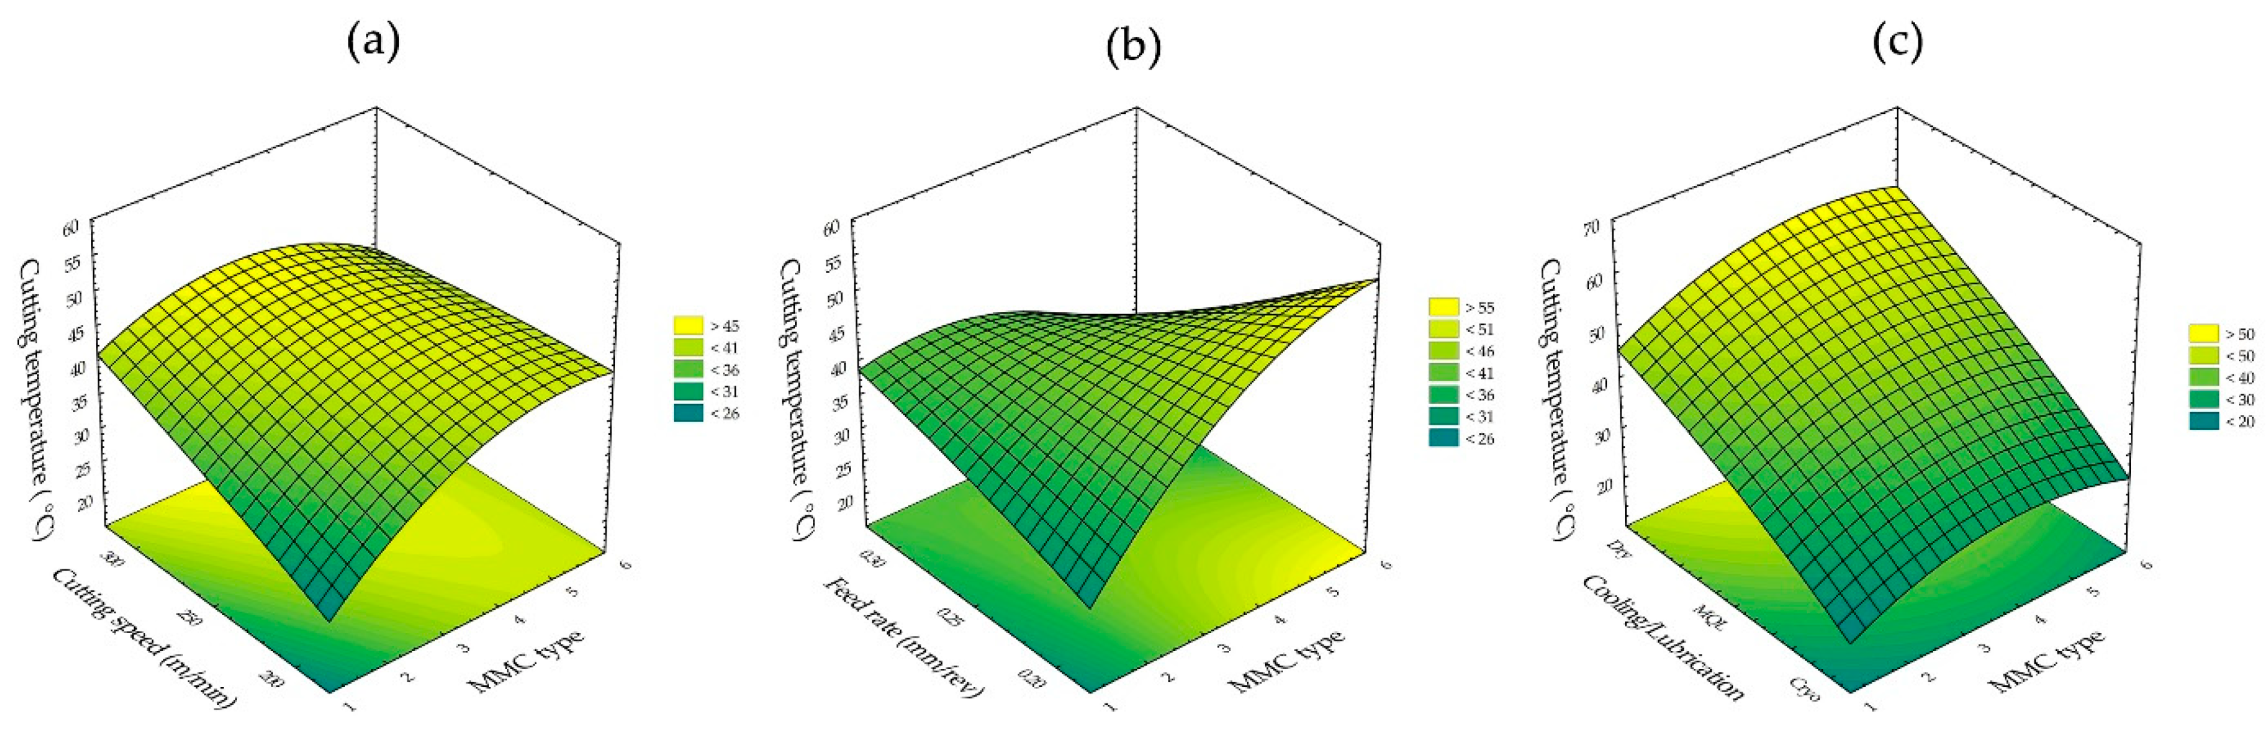
3.4. Cutting Temperature Analysis

The electrical energy used during machining is converted into mechanical energy and released as heat energy during machining. The heat energy emitted in the cutting zone spreads throughout the workpiece and cutting tool, resulting in the cutting temperature. Chips often remove the majority of high heat in the deformation zone. However, residual temperatures in the cutting zone can cause adverse conditions in terms of tribological performance and surface quality. Sustainable cooling and lubrication conditions can be used for desired tribological performances and surface quality [44]. Using cooling/lubrication techniques increases both machining performances, thermal shocks are prevented, and positive effects can be obtained on the formation mechanisms of chips. Traditional approaches in the form of dry environments and flood cooling in machining processes also pose a threat to the environment and human health [45]. Figure 10a–c depicts 3D surface plots illustrating the impact of various cutting variables and conditions on cutting temperature. When evaluated in terms of cutting environments and cutting parameters, it is seen that cryogenic-LN2 is the best choice for the cutting temperature. The lowest temperature was recorded as 24.3 °C in composite No. 1, with a 200 m/min cutting speed, 0.20 mm/rev feed rate, and cryo-LN2 cutting environment.
Figure 11 represents the images and temperature distribution graphs obtained with the help of a thermal camera in different cutting environments.
It was determined that the temperatures required for cutting are lower in the cryo-LN2 condition than in the dry state. In the cryogenic-cooling technique, temperatures are significantly reduced, and the chips are regularly broken and removed from the environment. It was reported that heat is absorbed by creating a gas cushion with cryogenic cooling at the cutting site [46]. Although the cryogenic environment is the best option for reducing temperatures, the success of the MQL environment is quite evident. The cutting fluid in the MQL system can intensively penetrate the tool–chip interface, considerably reducing friction and ambient temperature.

3.5. Energy Consumption Analysis

The demand for electrical energy in the world is increasing day by day. Approximately 30% of the total electrical energy produced is spent on manufacturing. Reducing energy consumption to minimum levels in machining processes, which have a significant share in total energy consumption, is very important. The amount of energy consumed in machining processes may vary according to cutting parameters and cooling methods [47]. Figure 12a–c depicts three-dimensional surface plots illustrating the impact of various cutting variables and cutting conditions on energy consumption. It was observed that the MQL cutting environment has the lowest energy consumption values. The lowest energy consumption in composite 6 was recorded at a 200 m/min cutting speed, 0.30 feed rate, and 9.76 kJ in the MQL cutting environment. In the MQL environment, the cooling liquid is transferred to the cutting zone in a pressurized manner, and the clouds in the form of fog vapor can remove heat from the environment. Additionally, the coolant functions as a lubricant to reduce friction. Thus, power consumption can be reduced indirectly by reducing contact pressure. Energy consumption may increase in dry environments due to high temperatures and high friction coefficients. By reducing the temperatures in the cutting zone, both cutting tool life is improved, and BUE formation can be prevented. By preventing the formation of BUE, friction can be reduced; thus, energy efficiency is achieved. By forming oil films with MQL fog droplets in the deformation zones, cutting forces are reduced, and energy consumption is reduced proportionally [48]. It was observed that energy demand rises as cutting speed increases (Figure 12a), whereas it falls when feed rate increases (Figure 12b). As cutting speed increases, the amount of energy drawn from the spindle motor also increases. In addition, high cutting speeds can reduce tool life in difficult-to-machine materials [49].

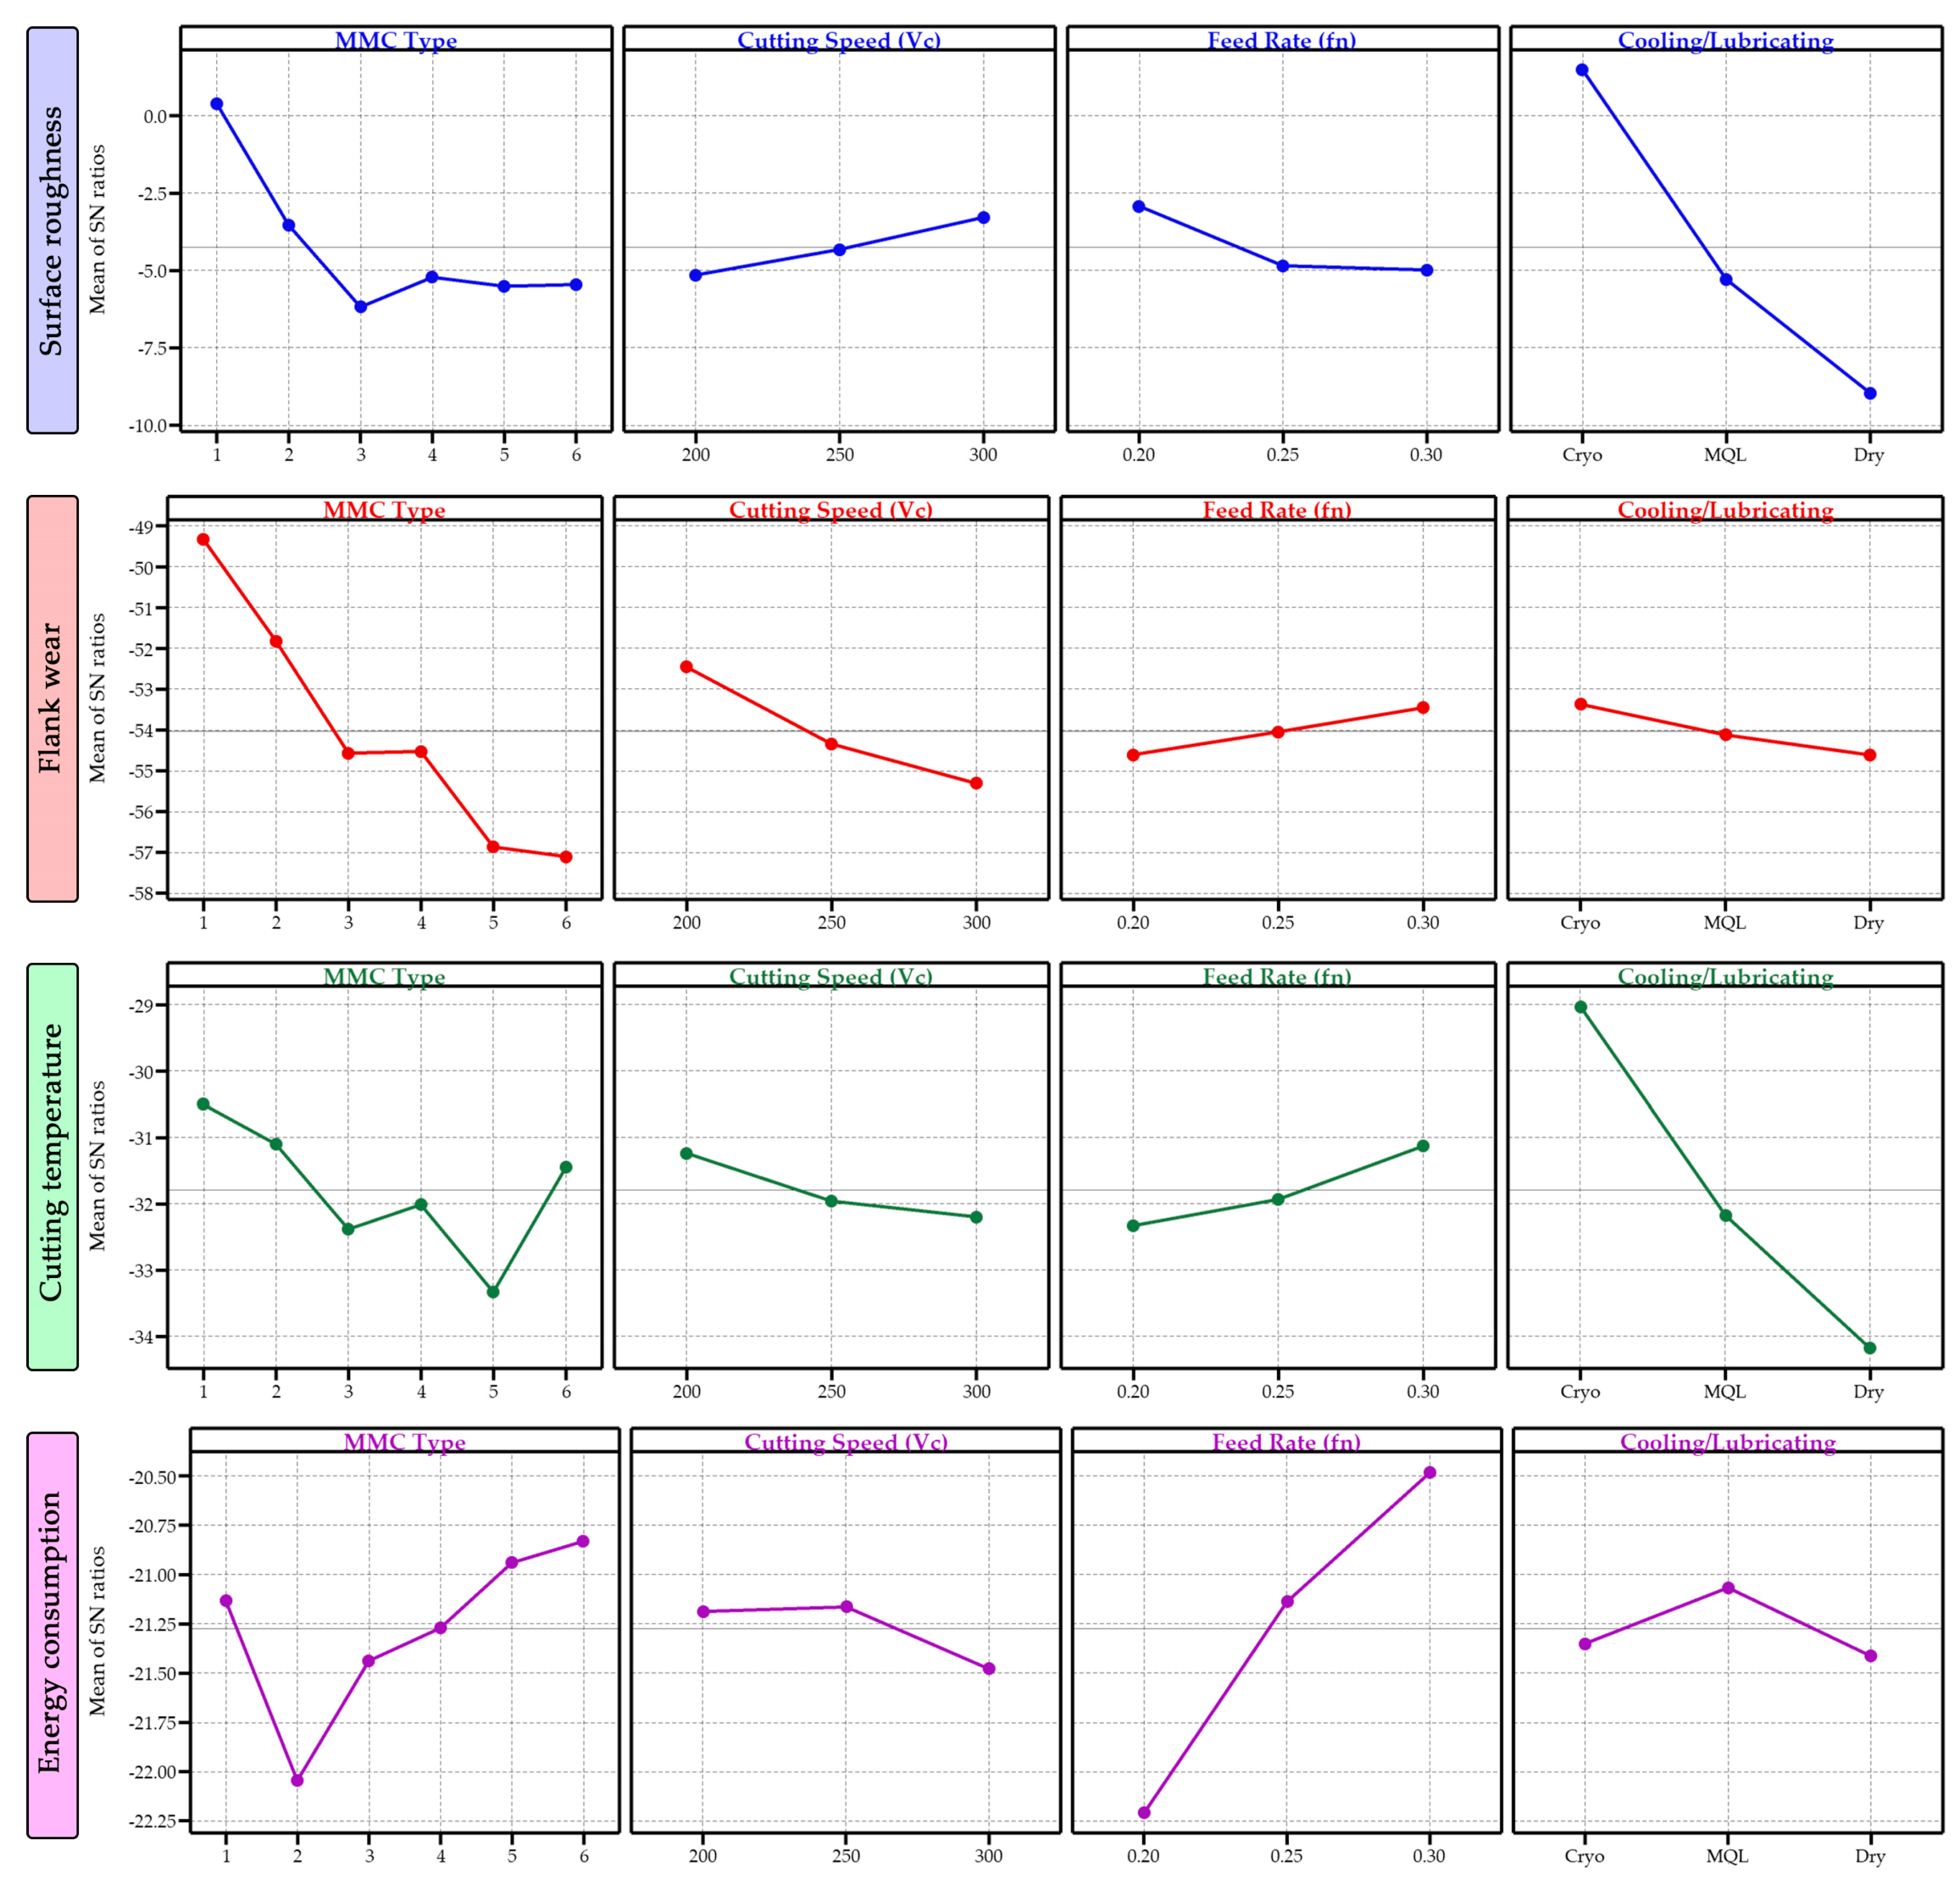
3.6. Statistical Analysis

The complexity increases and becomes difficult to control with the increase in the number of parameters in traditional experimental methods. Many methods are used to overcome this complexity. The Taguchi approach, which employs orthogonal arrays for experimental design, is one of these techniques. With the Taguchi method, the number of experiments is significantly reduced, and the uncontrollable effects on the experiments can be minimized. The Taguchi technique uses a statistical measure called the S/N ratio to analyze the results [50]. Table 4 contains the test findings and signal-to-noise ratios for the response parameters surface roughness (Ra), flank wear (Vb), cutting temperature (Tc), and energy consumption (Ec).
Figure 13 illustrates the impacts of all response parameters (surface roughness, flank wear, cutting temperature, and energy consumption) on control variables (type of MMC, cutting speed, feed rate, and cooling/lubrication). The optimum control factors for surface roughness are as follows: MMC type 1; cutting speed 300 m/min; feed rate 0.20 mm/rev; and cooling/lubrication cryo-LN2. The optimum control factors for flank wear are as follows: MMC type 1; cutting speed 200 m/min; feed rate 0.30 mm/rev; and cooling/lubrication cryo-LN2. The optimum control factors for cutting temperature are as follows: MMC type 1; cutting speed 200 m/min; feed rate 0.30 mm/rev; and cooling/lubrication cryo-LN2. The optimum control factors for energy consumption are as follows: MMC type 6; cutting speed 250 m/min; feed rate 0.30 mm/rev; and cooling/lubrication MQL.
To analyze the impact of the many variables used as control factors on the outcomes of the experiments, analysis of variance (ANOVA) was used. ANOVA may be used to identify the most important moderators and the relative contributions they make. The findings of the ANOVA are shown in Table 5, which details the control factors. In this investigation, analyses were carried out using a significance level of p < 0.05 and a confidence level of 95%. If the P value is less than 0.05, the analysis is assumed to be statistically significant. The most effective control factors on response parameters are recorded as follows: cooling/lubrication for surface roughness (71.90%); MMC type for flank wear (75.98%); cooling/lubrication for cutting temperature (76.67%); and feed rate for energy consumption (70.92%).
Figure 14a–d represents graphs in which response parameters are compared with the experimental results of quadratic regression models. Modeling and investigating the nature of the connection between a dependent variable and one or more independent variables may be accomplished via the use of regression analysis [51]. The dependent variables in this study are Ra, Vb, Tc, and Ec. The factors considered include MMC type, cutting speed, feed rate, and cooling and lubrication. It is seen that the success rates of all regression analyses are at high levels. Success rates were recorded as 95.5% for Ra, 94.4% for Vb, 98.4% for Tc, and 99.0% for Ec.

4. Conclusions

This study investigated the milling of Al-5Cu/Al2O3-SiC hybrid composites under different cutting parameters and cooling/lubrication strategies. As a result, the following findings were made:
The lowest surface roughness values were obtained with the cryo-LN2-cooling technique. The lowest surface roughness was recorded as 0.478 µm in composite No. 1, at a 200 m/min cutting speed, 0.20 mm/rev feed rate, and cryo-LN2 cutting environment. It was determined that the surface roughness increased with increasing cutting speed.
A dry-cutting environment increased flank wear compared to MQL and cryo-LN2-assisted cooling. It was determined that the best cooling lubrication environment for flank wear is cryo-LN2. The lowest flank wear value was recorded at a 200 m/min cutting speed, 0.20 mm/rev feed rate, and 250 µm in a cryo-LN2 cutting environment. In addition, BUE formation was determined in the dry environment in the SEM/EDS analyses of the cutting tools. It was observed that the cutting tool surfaces are smoother in MQL and cryo-LN2-supported cooling environments.
It was determined that all cutting temperature values decreased in the cryo-LN2-assisted cooling environment. Regarding the cutting temperature, it is important to reduce the temperature as they are directly related to all machinability parameters. The lowest temperature was recorded as 24.3 °C in composite No. 1, at a 200 m/min cutting speed, 0.20 mm/rev feed rate, and cryo-LN2 cutting environment.
It was observed that the MQL environment is more successful in energy consumption. The lowest energy consumption in composite 6 was recorded at a 200 m/min cutting speed, 0.30 feed rate, and 9.76 kJ in the MQL cutting environment. The fog cloud transferred to the cutting zone in the MQL system both cools the environment and reduces energy consumption to a minimum by reducing friction.
The effects of the control factors on the response parameters were determined by statistical analyses. Analyses were performed at a 95% confidence level.

Funding

This research received no external funding.

Institutional Review Board Statement

Not applicable.

Informed Consent Statement

Not applicable.

Data Availability Statement

Not applicable.

Conflicts of Interest

The author declares no conflict of interest.

References

  1. Arulkirubakaran, D.; Senthilkumar, V.; Chilamwar, V.L.; Senthil, P. Performance of surface textured tools during machining of Al-Cu/TiB2 composite. Measurement 2019, 137, 636–646. [Google Scholar] [CrossRef]
  2. Şap, S.; Turgut, A.; Uzun, M. Investigation of microstructure and mechanical properties of Cu/Ti–B–SiCp hybrid composites. Ceram. Int. 2021, 47, 29919–29929. [Google Scholar] [CrossRef]
  3. Aruri, D.; Adepu, K.; Adepu, K.; Bazavada, K. Wear and mechanical properties of 6061-T6 aluminum alloy surface hybrid composites [(SiC+Gr) and (SiC+Al2O3)] fabricated by friction stir processing. J. Mater. Res. Technol. 2013, 2, 362–369. [Google Scholar] [CrossRef] [Green Version]
  4. Karabulut, Ş.; Karakoç, H.; Çıtak, R. Influence of B4C particle reinforcement on mechanical and machining properties of Al6061/B4C composites. Compos. Part B Eng. 2016, 101, 87–98. [Google Scholar] [CrossRef]
  5. Das, B.; Roy, S.; Rai, R.N.; Saha, S.C. Study on machinability of in situ Al–4.5%Cu–TiC metal matrix composite-surface finish, cutting force prediction using ANN. CIRP J. Manuf. Sci. Technol. 2016, 12, 67–78. [Google Scholar] [CrossRef]
  6. Abbas, A.T.; Sharma, N.; Anwar, S.; Luqman, M.; Tomaz, I.; Hegab, H. Multi-response optimization in high-speed machining of Ti-6Al-4V using TOPSIS-fuzzy integrated approach. Materials 2020, 13, 1104. [Google Scholar] [CrossRef] [Green Version]
  7. Salur, E.; Kuntoğlu, M.; Aslan, A.; Pimenov, D.Y. The effects of MQL and dry environments on tool wear, cutting temperature, and power consumption during end milling of AISI 1040 steel. Metals 2021, 11, 1674. [Google Scholar] [CrossRef]
  8. Cetin, M.H.; Kabave Kilincarslan, S. Effects of cutting fluids with nano-silver and borax additives on milling performance of aluminium alloys. Manuf. Process 2020, 50, 170–182. [Google Scholar] [CrossRef]
  9. Gajrani, K.K. Assessment of cryo-MQL environment for machining of Ti-6Al-4V. Manuf. Process 2020, 60, 494–502. [Google Scholar] [CrossRef]
  10. Gupta, M.K.; Song, Q.; Liu, Z.; Sarikaya, M.; Jamil, M.; Mia, M.; Khanna, N.; Krolczyk, G.M. Experimental characterisation of the performance of hybrid cryo-lubrication assisted turning of Ti–6Al–4V alloy. Tribol. Int. 2021, 153, 106582. [Google Scholar] [CrossRef]
  11. Kuntoğlu, M. Measurement and analysis of sustainable indicators in machining of Armox 500T armor steel. Proc. Inst. Mech. Eng. C J. Mech. Eng. Sci. 2022, 236, 7330–7349. [Google Scholar] [CrossRef]
  12. Singh, G.; Pruncu, C.I.; Gupta, M.K.; Mia, M.; Khan, A.M.; Jamil, M.; Pimenov, D.Y.; Sen, B.; Sharma, V.S. Investigations of machining characteristics in the upgraded MQL-assisted turning of pure titanium alloys using evolutionary algorithms. Materials 2019, 12, 999. [Google Scholar] [CrossRef] [Green Version]
  13. Boswell, B.; Islam, M.N.; Davies, I.J.; Ginting, Y.R.; Ong, A.K. A review identifying the effectiveness of minimum quantity lubrication (MQL) during conventional machining. Int. J. Adv. Manuf. Technol. 2017, 92, 321–340. [Google Scholar] [CrossRef] [Green Version]
  14. Kamata, Y.; Obikawa, T. High speed MQL finish-turning of Inconel 718 with different coated tools. J. Mater. Process. Techno.L 2007, 192–193, 281–286. [Google Scholar] [CrossRef]
  15. Mia, M.; Dey, P.R.; Hossain, M.S.; Arafat, M.T.; Asaduzzaman, M.; Shoriat Ullah, M.; Tareq Zobaer, S.M. Taguchi S/N based optimization of machining parameters for surface roughness, tool wear and material removal rate in hard turning under MQL cutting condition. Measurement 2018, 122, 380–391. [Google Scholar] [CrossRef]
  16. Sarıkaya, M.; Güllü, A. Taguchi design and response surface methodology based analysis of machining parameters in CNC turning under MQL. J. Clean. Prod. 2014, 65, 604–616. [Google Scholar] [CrossRef]
  17. Race, A.; Zwierzak, I.; Secker, J.; Walsh, J.; Carrell, J.; Slatter, T.; Maurotto, A. Environmentally sustainable cooling strategies in milling of SA516: Effects on surface integrity of dry, flood and MQL machining. J. Clean. Prod. 2021, 288, 125580. [Google Scholar] [CrossRef]
  18. Danish, M.; Ginta, T.L.; Habib, K.; Carou, D.; Rani, A.M.A.; Saha, B.B. Thermal analysis during turning of AZ31 magnesium alloy under dry and cryogenic conditions. Int. J. Adv. Manuf. Technol. 2017, 91, 2855–2868. [Google Scholar] [CrossRef]
  19. Gupta, M.K.; Korkmaz, M.E.; Sarıkaya, M.; Krolczyk, G.M.; Günay, M.; Wojciechowski, S. Cutting forces and temperature measurements in cryogenic assisted turning of AA2024-T351 alloy: An experimentally validated simulation approach. Measurement 2022, 188, 110594. [Google Scholar] [CrossRef]
  20. Khanna, N.; Shah, P.; Chetan. Comparative analysis of dry, flood, MQL and cryogenic CO2 techniques during the machining of 15-5-PH SS alloy. Tribol. Int. 2020, 146, 106196. [Google Scholar] [CrossRef]
  21. Kıvak, T. Optimization of surface roughness and flank wear using the Taguchi method in milling of Hadfield steel with PVD and CVD coated inserts. Measurement 2014, 50, 19–28. [Google Scholar] [CrossRef]
  22. Değirmenci, Ü.; Usca, Ü.A.; Şap, S. Machining characterization and optimization under different cooling/lubrication conditions of Al-4Gr hybrid composites fabricated by vacuum sintering. Vacuum 2023, 208, 111741. [Google Scholar] [CrossRef]
  23. Abbas, A.T.; Anwar, S.; Abdelnasser, E.; Luqman, M.; Qudeiri, J.E.A.; Elkaseer, A. Effect of different cooling strategies on surface quality and power consumption in finishing end milling of stainless steel 316. Materials 2021, 14, 903. [Google Scholar] [CrossRef] [PubMed]
  24. Pereira, O.; Celaya, A.; Urbikaín, G.; Rodríguez, A.; Fernández-Valdivielso, A.; Lacalle, L.N.L.d. CO2 cryogenic milling of Inconel 718: Cutting forces and tool wear. J. Mater. Res. Technol. 2020, 9, 8459–8468. [Google Scholar] [CrossRef]
  25. Usca, Ü.A.; Uzun, M.; Şap, S.; Giasin, K.; Pimenov, D.Y.; Prakash, C. Determination of machinability metrics of AISI 5140 steel for gear manufacturing using different cooling/lubrication conditions. J. Mater. Res. Technol. 2022, 21, 893–904. [Google Scholar] [CrossRef]
  26. Pusavec, F.; Hamdi, H.; Kopac, J.; Jawahir, I.S. Surface integrity in cryogenic machining of nickel based alloy—Inconel 718. J. Mater. Process. Techno.L 2011, 211, 773–783. [Google Scholar] [CrossRef]
  27. Gupta, M.K.; Song, Q.; Liu, Z.; Sarikaya, M.; Mia, M.; Jamil, M.; Singla, A.K.; Bansal, A.; Pimenov, D.Y.; Kuntoğlu, M. Tribological performance based machinability investigations in cryogenic cooling assisted turning of α-β titanium Alloy. Tribol. Int. 2021, 160, 107032. [Google Scholar] [CrossRef]
  28. Morkavuk, S.; Köklü, U.; Bağcı, M.; Gemi, L. Cryogenic machining of carbon fiber reinforced plastic (CFRP) composites and the effects of cryogenic treatment on tensile properties: A comparative study. Compos. Part B Eng. 2018, 147, 1–11. [Google Scholar] [CrossRef]
  29. Usca, Ü.A.; Şap, S.; Uzun, M. Evaluation of machinability of Cu matrix composite materials by computer numerical control milling under cryogenic LN2 and minimum quantity lubrication. J. Mater. Eng. Perform. 2022, 32, 2417–2431. [Google Scholar] [CrossRef]
  30. Kaynak, Y. Evaluation of machining performance in cryogenic machining of Inconel 718 and comparison with dry and MQL machining. Int. J. Adv. Manuf. Technol. 2014, 72, 919–933. [Google Scholar] [CrossRef]
  31. Zhao, W.; Ren, F.; Iqbal, A.; Gong, L.; He, N.; Xu, Q. Effect of liquid nitrogen cooling on surface integrity in cryogenic milling of Ti-6Al-4 V titanium alloy. Int. J. Adv. Manuf. Technol. 2020, 106, 1497–1508. [Google Scholar] [CrossRef]
  32. Şap, S.; Uzun, M.; Usca, Ü.A.; Pimenov, D.Y.; Giasin, K.; Wojciechowski, S. Investigation of machinability of Ti–B-SiCp reinforced Cu hybrid composites in dry turning. J. Mater. Res. Technol. 2022, 18, 1474–1487. [Google Scholar] [CrossRef]
  33. Gururaja, S.; Ramulu, M.; Pedersen, W. Machining of MMCs: A Review. Mach. Sci. Technol. 2013, 17, 41–73. [Google Scholar] [CrossRef]
  34. Klocke, F.; Settineri, L.; Lung, D.; Claudio Priarone, P.; Arft, M. High performance cutting of gamma titanium aluminides: Influence of lubricoolant strategy on tool wear and surface integrity. Wear 2013, 302, 1136–1144. [Google Scholar] [CrossRef] [Green Version]
  35. Sreejith, P.S.; Ngoi, B.K.A. Dry machining: Machining of the future. J. Mater. Process. Techno.L 2000, 101, 287–291. [Google Scholar] [CrossRef]
  36. Sharma, V.S.; Singh, G.; Sørby, K. A review on minimum quantity lubrication for machining processes. Mater. Manuf. Process 2015, 30, 935–953. [Google Scholar] [CrossRef]
  37. Gupta, M.K.; Pruncu, C.I.; Mia, M.; Singh, G.; Singh, S.; Prakash, C.; Sood, P.K.; Gill, H.S. Machinability investigations of inconel-800 super alloy under sustainable cooling conditions. Materials 2018, 11, 2088. [Google Scholar] [CrossRef] [Green Version]
  38. Jayal, A.D.; Badurdeen, F.; Dillon, O.W.; Jawahir, I.S. Sustainable manufacturing: Modeling and optimization challenges at the product, process and system levels. CIRP J. Manuf. Sci. Technol. 2010, 2, 144–152. [Google Scholar] [CrossRef]
  39. Sharma, V.S.; Dogra, M.; Suri, N.M. Cooling techniques for improved productivity in turning. Int. J. Mach. Tools Manuf. 2009, 49, 435–453. [Google Scholar] [CrossRef]
  40. Jawahir, I.S.; Attia, H.; Biermann, D.; Duflou, J.; Klocke, F.; Meyer, D.; Newman, S.T.; Pusavec, F.; Putz, M.; Rech, J.; et al. Cryogenic manufacturing processes. CIRP Ann. 2016, 65, 713–736. [Google Scholar] [CrossRef]
  41. Sivaiah, P.; Chakradhar, D. Effect of cryogenic coolant on turning performance characteristics during machining of 17-4 PH stainless steel: A comparison with MQL, wet, dry machining. CIRP J. Manuf. Sci. Technol. 2018, 21, 86–96. [Google Scholar] [CrossRef]
  42. Şap, S.; Usca, Ü.A.; Uzun, M.; Kuntoğlu, M.; Salur, E.; Pimenov, D.Y. Investigation of the effects of cooling and lubricating strategies on tribological characteristics in machining of hybrid composites. Lubricants 2022, 10, 63. [Google Scholar] [CrossRef]
  43. Gupta, M.K.; Niesłony, P.; Sarikaya, M.; Korkmaz, M.E.; Kuntoğlu, M.; Królczyk, G.M.; Jamil, M. Tool wear patterns and their promoting mechanisms in hybrid cooling assisted machining of titanium Ti-3Al-2.5V/grade 9 alloy. Tribol. Int. 2022, 174, 107773. [Google Scholar] [CrossRef]
  44. Salur, E. Understandings the tribological mechanism of Inconel 718 alloy machined under different cooling/lubrication conditions. Tribol. Int. 2022, 174, 107677. [Google Scholar] [CrossRef]
  45. Maruda, R.W.; Krolczyk, G.M.; Nieslony, P.; Wojciechowski, S.; Michalski, M.; Legutko, S. The influence of the cooling conditions on the cutting tool wear and the chip formation mechanism. Manuf. Process 2016, 24, 107–115. [Google Scholar] [CrossRef]
  46. Hong, S.Y.; Ding, Y.; Jeong, W.C. Friction and cutting forces in cryogenic machining of Ti–6Al–4V. Int. J. Mach. Tools Manuf. 2001, 41, 2271–2285. [Google Scholar] [CrossRef]
  47. Shokrani, A.; Dhokia, V.; Newman, S.T. Comparative investigation on using cryogenic machining in CNC milling of Ti-6Al-4V titanium alloy. Mach. Sci. Technol. 2016, 20, 475–494. [Google Scholar] [CrossRef] [Green Version]
  48. Şap, S.; Usca, Ü.A.; Uzun, M.; Kuntoğlu, M.; Salur, E. Performance evaluation of AlTiN coated carbide tools during machining of ceramic reinforced Cu-based hybrid composites under cryogenic, pure-minimum quantity lubrication and dry regimes. J. Compos. Mater. 2022, 56, 3401–3421. [Google Scholar] [CrossRef]
  49. Krolczyk, G.; Maruda, R.; Krolczyk, J.; Wojciechowski, S.; Mia, M.; Nieslony, P.; Budzik, G. Ecological trends in machining as a key factor in sustainable production–A review. J. Clean. Prod. 2019, 218, 601–615. [Google Scholar] [CrossRef]
  50. Yıldırım, Ç.V.; Kıvak, T.; Erzincanlı, F. Influence of different cooling methods on tool life, wear mechanisms and surface roughness in the milling of nickel-based waspaloy with WC tools. Arab. J. Sc.I Eng. 2019, 44, 7979–7995. [Google Scholar] [CrossRef]
  51. Cetin, M.H.; Ozcelik, B.; Kuram, E.; Demirbas, E. Evaluation of vegetable based cutting fluids with extreme pressure and cutting parameters in turning of AISI 304L by Taguchi method. J. Clean. Prod. 2011, 19, 2049–2056. [Google Scholar] [CrossRef]
Figure 1. Schematic view of MQL and cryo-LN2 systems during milling.
Lubricants 11 00111 g001
Figure 2. Calculation of power consumption in experiment 1.
Lubricants 11 00111 g002
Figure 3. Microstructure analysis and elemental-mapping images of sample 6: (a) SEM micrograph; (b) EDS analysis; (c) Al; (d) Cu; (e) O; (f) Si; (g) C.
Lubricants 11 00111 g003
Figure 4. 3D surface graphs representing the relationship between surface roughness and different machinability parameters: (a) cutting speed, MMC type; (b) feed rate, MMC type; (c) cooling/lubrication, MMC type.
Lubricants 11 00111 g004
Figure 5. The 3D and 2D surface topographies of specimens milled in various cutting conditions.
Lubricants 11 00111 g005
Figure 6. 3D surface graphics representing the relationship of flank wear with different machinability parameters: (a) cutting speed, MMC type; (b) feed rate, MMC type; (c) cooling/lubrication, MMC type.
Lubricants 11 00111 g006
Figure 7. SEM photos of the flank and rake surfaces of materials milled in various cutting conditions.
Lubricants 11 00111 g007
Figure 8. SEM/EDS images of the cutting tool after dry machining.
Lubricants 11 00111 g008
Figure 9. Mapping images are taken from the cutting tool edge after dry machining: (a) SEM image; (b) Al; (c) Cu; (d) Si; (e) C; (f) O; (g) W; (h) Co; (i) Ti; (j) N.
Lubricants 11 00111 g009
Figure 10. 3D surface graphics representing the relationship of cutting temperature with different machinability parameters: (a) cutting speed, MMC type; (b) feed rate, MMC type; (c) cooling/lubrication, MMC type.
Lubricants 11 00111 g010
Figure 11. Images taken with a thermal camera and temperature distribution graphs in different cutting environments.
Lubricants 11 00111 g011
Figure 12. 3D surface plots illustrating the link between energy consumption and several machinability variables: (a) cutting speed, MMC type; (b) feed rate, MMC type; and (c) cooling/lubrication, MMC type.
Lubricants 11 00111 g012
Figure 13. Plots of main effects of response parameters on control factors.
Lubricants 11 00111 g013
Figure 14. Quadratic regression analysis results: (a) Ra; (b) Vb; (c) Tc; (d) Ec.
Lubricants 11 00111 g014
Table 1. Adjusting the proportions of the powder’s particles.
Samples
No.
Al Ratio
(wt.%)
Cu Ratio
(wt.%)
Al2O3 Ratio
(wt.%)
SiC Ratio
(wt.%)
1955--
29352-
3935-2
491522
587544
683566
Table 2. Machinability parameters and levels.
Milling ParametersUnitLevels
123456
MMC type-123456
Cooling conditions-DryMQLCryo---
Cutting speed, (Vc)m/min200250300---
Feed rate, (fn)mm/rev0.20.250.3---
Table 3. Taguchi L18 experimental design (61 × 33).
Experiment NumberMMC TypeCutting Speed (m/min)Feed Rate (mm/rev)Cooling/Lubrication
112000.20Cryo
212500.25MQL
313000.30Dry
422000.20MQL
522500.25Dry
623000.30Cryo
732000.25Cryo
832500.30MQL
933000.20Dry
1042000.30Dry
1142500.20Cryo
1243000.25MQL
1352000.25Dry
1452500.30Cryo
1553000.20MQL
1662000.30MQL
1762500.20Dry
1863000.25Cryo
Table 4. Test results and S/N ratios of response parameters.
Experiment NumberRa
(µm)
Vb
(µm)
Tc
(°C)
Ec
(kJ)
S/N for Ra (dB)S/N for Vb (dB)S/N for Tc (dB)S/N for Ec (dB)
10.47825024.312.706.4114−47.9588−27.7121−22.0761
21.19133436.110.84−1.5182−50.4749−31.1501−20.7006
31.52630042.810.74−3.6711−49.5424−32.6289−20.6201
41.41631439.013.63−3.0213−49.9386−31.8213−22.6899
52.60547547.712.46−8.3162−53.5339−33.5704−21.9104
60.91539724.811.930.7716−51.9758−27.889−21.5328
71.38238929.011.59−2.8102−51.7990−29.248−21.2817
82.32750742.610.23−7.3359−54.1002−32.5882−20.1975
92.62177558.213.85−8.3693−57.7860−35.2985−22.8290
103.42849048.410.57−10.7008−53.8039−33.6969−20.4815
110.78155329.912.692.147−54.8545−29.5134−22.0692
122.25855643.711.56−7.0745−54.9015−32.8096−21.2592
134.02559456.710.96−12.0953−55.4757−35.0717−20.7962
141.03659932.010.31−0.3072−55.5485−30.103−20.2652
151.60395055.012.24−4.0987−59.5545−34.8073−21.7556
162.69161131.09.76−8.5983−55.7208−29.8272−19.7890
173.36175054.912.35−10.5294−57.5012−34.7914−21.8333
180.72580030.611.052.7932−58.0618−29.7144−20.8672
Table 5. ANOVA results of control factors.
SourceDFSeq SSAdj SSAdj MSFPContribution
Rate (%)
Ra
MMC type589.4889.4817.8956.770.0187319.08
Cutting speed (m/min)210.4310.435.2171.970.219522.22
Feed rate (mm/rev)215.9815.987.993.020.123633.41
Cooling/lubrication2337.11337.11168.55563.750.0000971.90
Residual error615.8615.862.644--3.38
Total17468.86----100.00
Vb
MMC type5134.868134.86826.97418.610.00175.98
Cutting speed (m/min)225.28225.28212.6418.720.01714.24
Feed rate (mm/rev)23.9713.9711.9851.370.3242.24
Cooling/lubrication24.6854.6852.3421.620.2752.64
Residual error68.6978.6971.449--4.90
Total17177.502----100.00
Tc
MMC type515.09715.0973.01959.280.0086214.34
Cutting speed (m/min)23.013.011.50494.620.060932.86
Feed rate (mm/rev)24.54.52.24996.910.027724.27
Cooling/lubrication280.72680.72640.363124.020.0000176.67
Residual error61.9531.9530.3255--1.85
Total17105.286----100.00
Ec
MMC type52.84792.84790.5695828.80.00040122.12
Cutting speed (m/min)20.36910.36910.184549.330.0144022.87
Feed rate (mm/rev)29.13139.13134.56563230.840.00000270.92
Cooling/lubrication20.40860.40860.2043210.330.0113983.17
Residual error60.11870.11870.01978--0.92
Total1712.8756----100.00
Disclaimer/Publisher’s Note: The statements, opinions and data contained in all publications are solely those of the individual author(s) and contributor(s) and not of MDPI and/or the editor(s). MDPI and/or the editor(s) disclaim responsibility for any injury to people or property resulting from any ideas, methods, instructions or products referred to in the content.

