Article

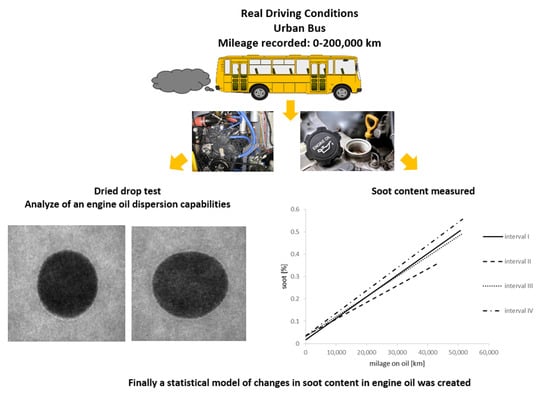
Analysis of Changes in Soot Content in Engine Oils under Operating Conditions

by
Grzegorz Zając
1,
Wojciech Gołębiowski
1,*,
Małgorzata Szczepanik
2,
Artur Wolak
3 and
Marie Sejkorová
4
1
Department of Power Engineering and Transportation, Faculty of Production Engineering, University of Life Sciences in Lublin, Głeboka 28, 20-612 Lublin, Poland
2
Department of Applied Mathematics and Computer Science, Faculty of Production Engineering, University of Life Sciences in Lublin, Głeboka 28, 20-612 Lublin, Poland
3
Department of Quality and Safety of Industrial Products, Cracow University of Economics, Sienkiewicza 4, 30-033 Kraków, Poland
4
Department of Transport Means and Diagnostics, Faculty of Transport Engineering, University of Pardubice, Studentská 95, 532 10 Pardubice, Czech Republic
*
Author to whom correspondence should be addressed.
Lubricants 2023, 11(2), 89; https://doi.org/10.3390/lubricants11020089
Submission received: 30 January 2023 / Revised: 14 February 2023 / Accepted: 16 February 2023 / Published: 18 February 2023
(This article belongs to the Special Issue Advances in Sustainable Machining)

Abstract

:
Oil has an enormous influence on the condition of the engine. Determining its degradation allows companies to maximize the availability of a specific vehicle and fleet of vehicles in general. In the evolution of engine oil degradation, one of the variables considered to be the most important is soot content. This article examines the direction and severity of soot content and dispersion changes in engine oil occurring during actual engine operation during four complete change intervals. The oil under study was operated in a city bus. It belonged to the fleet of vehicles of a transport company from new to the mileage of about 200,000 km. Soot content was determined in accordance with ASTM E2412-10, while dispersion size was determined using the dried drop test in accordance with ASTM D7899. The results obtained provide the basis for the conclusion that the direction of change in soot content in each interval is characterized by a high degree of homogeneity. With respect to the degree of soot build-up, a high level of similarity was observed between the intervals studied. The study of change in the degree of oil dispersion using the “drop on blotter” method made it possible to confirm the trend of decreasing dispersion as the run increases. The obtained results led to the development of a statistical model describing these relationships.

Graphical Abstract

1. Introduction

Diesel engines are currently the main group of engines used in trucking and public transportation. The advantages of this type of engine include low fuel consumption, high durability, and reliability [1]. Despite these advantages, diesel engines have disadvantages, such as high levels of NOx and particulate emissions. The emission of air pollutants from transport has a negative impact both on the environment and human health, as well as on climate change [2,3]. In terms of reducing air pollution, economical driving in city traffic also has great potential, and it is worth using the eco-driving style [4]. Additionally, the use of alternative fuels is one of the simpler and more effective methods of reducing exhaust emissions from diesel engines. According to studies by Ge et al., the addition of biodiesel and ethanol to diesel as a ternary blended fuel, or binary blends, can simultaneously reduce NOx and smoke emissions, as well as particle diameter [5,6]. Another frequently used method of reducing NOx emissions is the use of exhaust gas recirculation (EGR). However, this technology causes problems due to the increase in particulate matter entering the lubricating oil.
Only 29% of the soot produced when fuel is burned in the cylinders enters the atmosphere through the exhaust system. The remainder is deposited on the cylinder walls and piston bottoms and eventually ends up in the engine oil [7]. Soot contamination of the lubricating oil translates into increased engine wear [8]. The amount of accumulated soot in the oil is influenced by how the engine is operated, including its low or high load, ambient temperature, or idling time [9,10]. Increased soot content in engine oil can reduce lubrication efficiency by increasing viscosity, forming an abrasive substance that accelerates wear, and adsorb anti-wear additives [11,12,13,14,15,16,17,18,19]. Soot particles entering the oil can gather into larger clusters. They can more than double in size, as small soot particles increase from a size of less than 50 nm to more than 100 nm [20]. Therefore, effective dispersion of soot agglomerates is necessary to help mitigate the harmful effects of wear (caused by soot) on mating surfaces. Dispersant additives in lubricants reduce particle (especially soot) agglomeration through spherical stabilization, and can prevent particles and contaminants from adhering to surfaces [21]. Liu et al. [22] studied soot aggregation and the interaction between dispersant and soot using molecular dynamics simulations. The results showed that the presence of dispersant had a significant effect on disrupting soot aggregation.
Dispersion is a property that allows oil to suspend and carry away “contaminants” formed from a variety of sources, such as soot from fuel combustion, metallic particles from engine component wear, corrosion of mechanical parts, insoluble products from oil aging, etc. Dispersant particles play an important role in modifying soot particles (carbon particles from degradation) to resist their aggregation, which leads to oil thickening, mainly in heavy engines [23,24]. The accumulation of contaminants such as soot causes an increase in the viscosity of the engine oil and the formation of sludge, which can consequently lead to blockage of the oil main as well as excessive component wear [25].
The above information shows that the control of the soot content and its dispersion in engine oils is extremely important both from the point of view of oil degradation rate and replacement interval, as well as engine durability and reliability. There are many ways to measure soot in engine oils. The main technique is thermogravimetric analysis (TGA), but it has several limitations, such as a long measurement procedure and limitations in measuring small soot contents in oil [26]. Another alternative measurement technique is Fourier transform infrared spectroscopy (FTIR), which also, like TGA, has limitations in measuring small soot contents in oil [27]. In an article [28], the authors presented an alternative measurement technique that is applicable to measuring small soot contents in oil in service, based on visible ultraviolet–visible (UV–VIS) spectroscopy. Abdulqadir [29] observed that a lot of work has been devoted to analyzing soot in laboratory tests and its wear effects on engine components, while there is little work showing what effect soot has on engine oil and its additives degradation during actual road tests. These conditions, compared to laboratory tests, are characterized by less repeatability and control, while they show the problem in a more complex and thus more representative way. In addition, they can change not only depending on the conditions of their use [10], but also due to the wear of various engine components. Therefore, it is important to conduct long-term studies that enable the analysis of problems occurring not only during one oil cycle, but also covering changes in several successive cycles. In the literature, there is a very small number of papers describing research on the degradation of lubricating oil in a long-term test [30].
Therefore, the purpose of this study was to investigate the direction and intensity of changes in soot content and its dispersibility in engine oils during four consecutive engine oil change intervals. It was important to involve a vehicle belonging to the urban transport fleet in the research and to obtain oil, of which the degree of degradation is the result of the actual operating conditions of the vehicle. The obtained results led to the development of a statistical model that describes the relationship between the soot content in engine oil and the number of kilometers driven, taking into account the real conditions of vehicle operation.

2. Materials and Methods

2.1. Materials

The engine oil used in the study was operated in an Iveco city bus, model Urbanway 12M, equipped with a 228 kW Cursor 9 engine with HI-SCR technology (exhaust emission control system with passive particulate filter) meeting the Euro VI emission standard without the use of an exhaust gas recirculation (EGR) system. The test vehicle was intended for operation in public transportation in typical urban conditions. The volume of the oil sump was 34 L.
The test material included 17 engine oil samples, including one fresh oil sample. The samples were aggregated over a period of 3 years. The oil used in the engine was Petronas Urania FE LS brand oil with a viscosity grade of SAE 5W30, meeting European quality standards ACEA E4/E6/E7. In order to obtain representative oil samples, a correct and systematic sampling procedure was ensured. At the beginning of the test, a sample of new oil was tested, and then oil samples were taken periodically at successive oil change intervals. Three of the intervals ended at about 51,000 km, and one at about 44,500 km. It should be noted that the values are below the manufacturer’s recommended limit of 60,000 km. The detailed data from each engine oil mileage is presented in Table 1.

2.2. Test Apparatus

Soot content was measured in accordance with ASTM E2412-10 using an ERASPEC OIL mid-infrared FTIR spectrometer (Eralytics GmbH, Wien, Austria). Fourier-transform infrared spectroscopy (FTIR) is an ASTM-accepted technique for monitoring soot levels in diesel engine oils. The method works by first placing a clean oil sample in an IR cell and measuring it on the spectrometer to establish a baseline, then measured is the used oil sample [31]. Because the method measures the amount of IR light scattered rather than absorbed, the difference in baseline between the sample and the clean oil at 2000 cm−1 is used to determine the soot value. The FTIR method is best suited for trend analysis in the field when monitoring soot.
An automatic dispersion tester for in-service motor oils DT 100DL (AD Systems product, Saint-André-sur-Orne, France) was used to test the dispersion capacity of the oil under test. The apparatus analyzed the image of the oil droplet using a digital camera in accordance with ASTM D7899 (ASTM D7899-19, 2019). The software then scanned and analyzed all regions of the oil droplet and converted the scan into oil quality parameters. Dispersion magnitude (MD) is a key piece of information in determining the nature and content of detergents in the oil that facilitate dispersion. MD is expressed by an index of 100 (perfect dispersion) to 0 (no dispersion). Characterization of the dispersion of an oil stain was performed by determining the distance reached by the droplets from the center, or how large the central area of the drenching is and its homogeneity relative to the theoretical size of 32 mm, which is shown as a blue circle in Figure 1.

2.3. Statistical Analysis

Statistica ver. 13 software (TIBCO Software Inc., Palo Alto, CA, USA, 2017) was used to analyze the results. Linear correlation coefficients were calculated between soot percentage and mileage for successive intervals. The statistical significance of the correlation coefficients was tested. Regression lines were determined and the significance of the coefficients of the lines was tested using the SimReg method. Pairwise comparisons of the runs of the lines for the intervals considered were made.

3. Results and Discussion

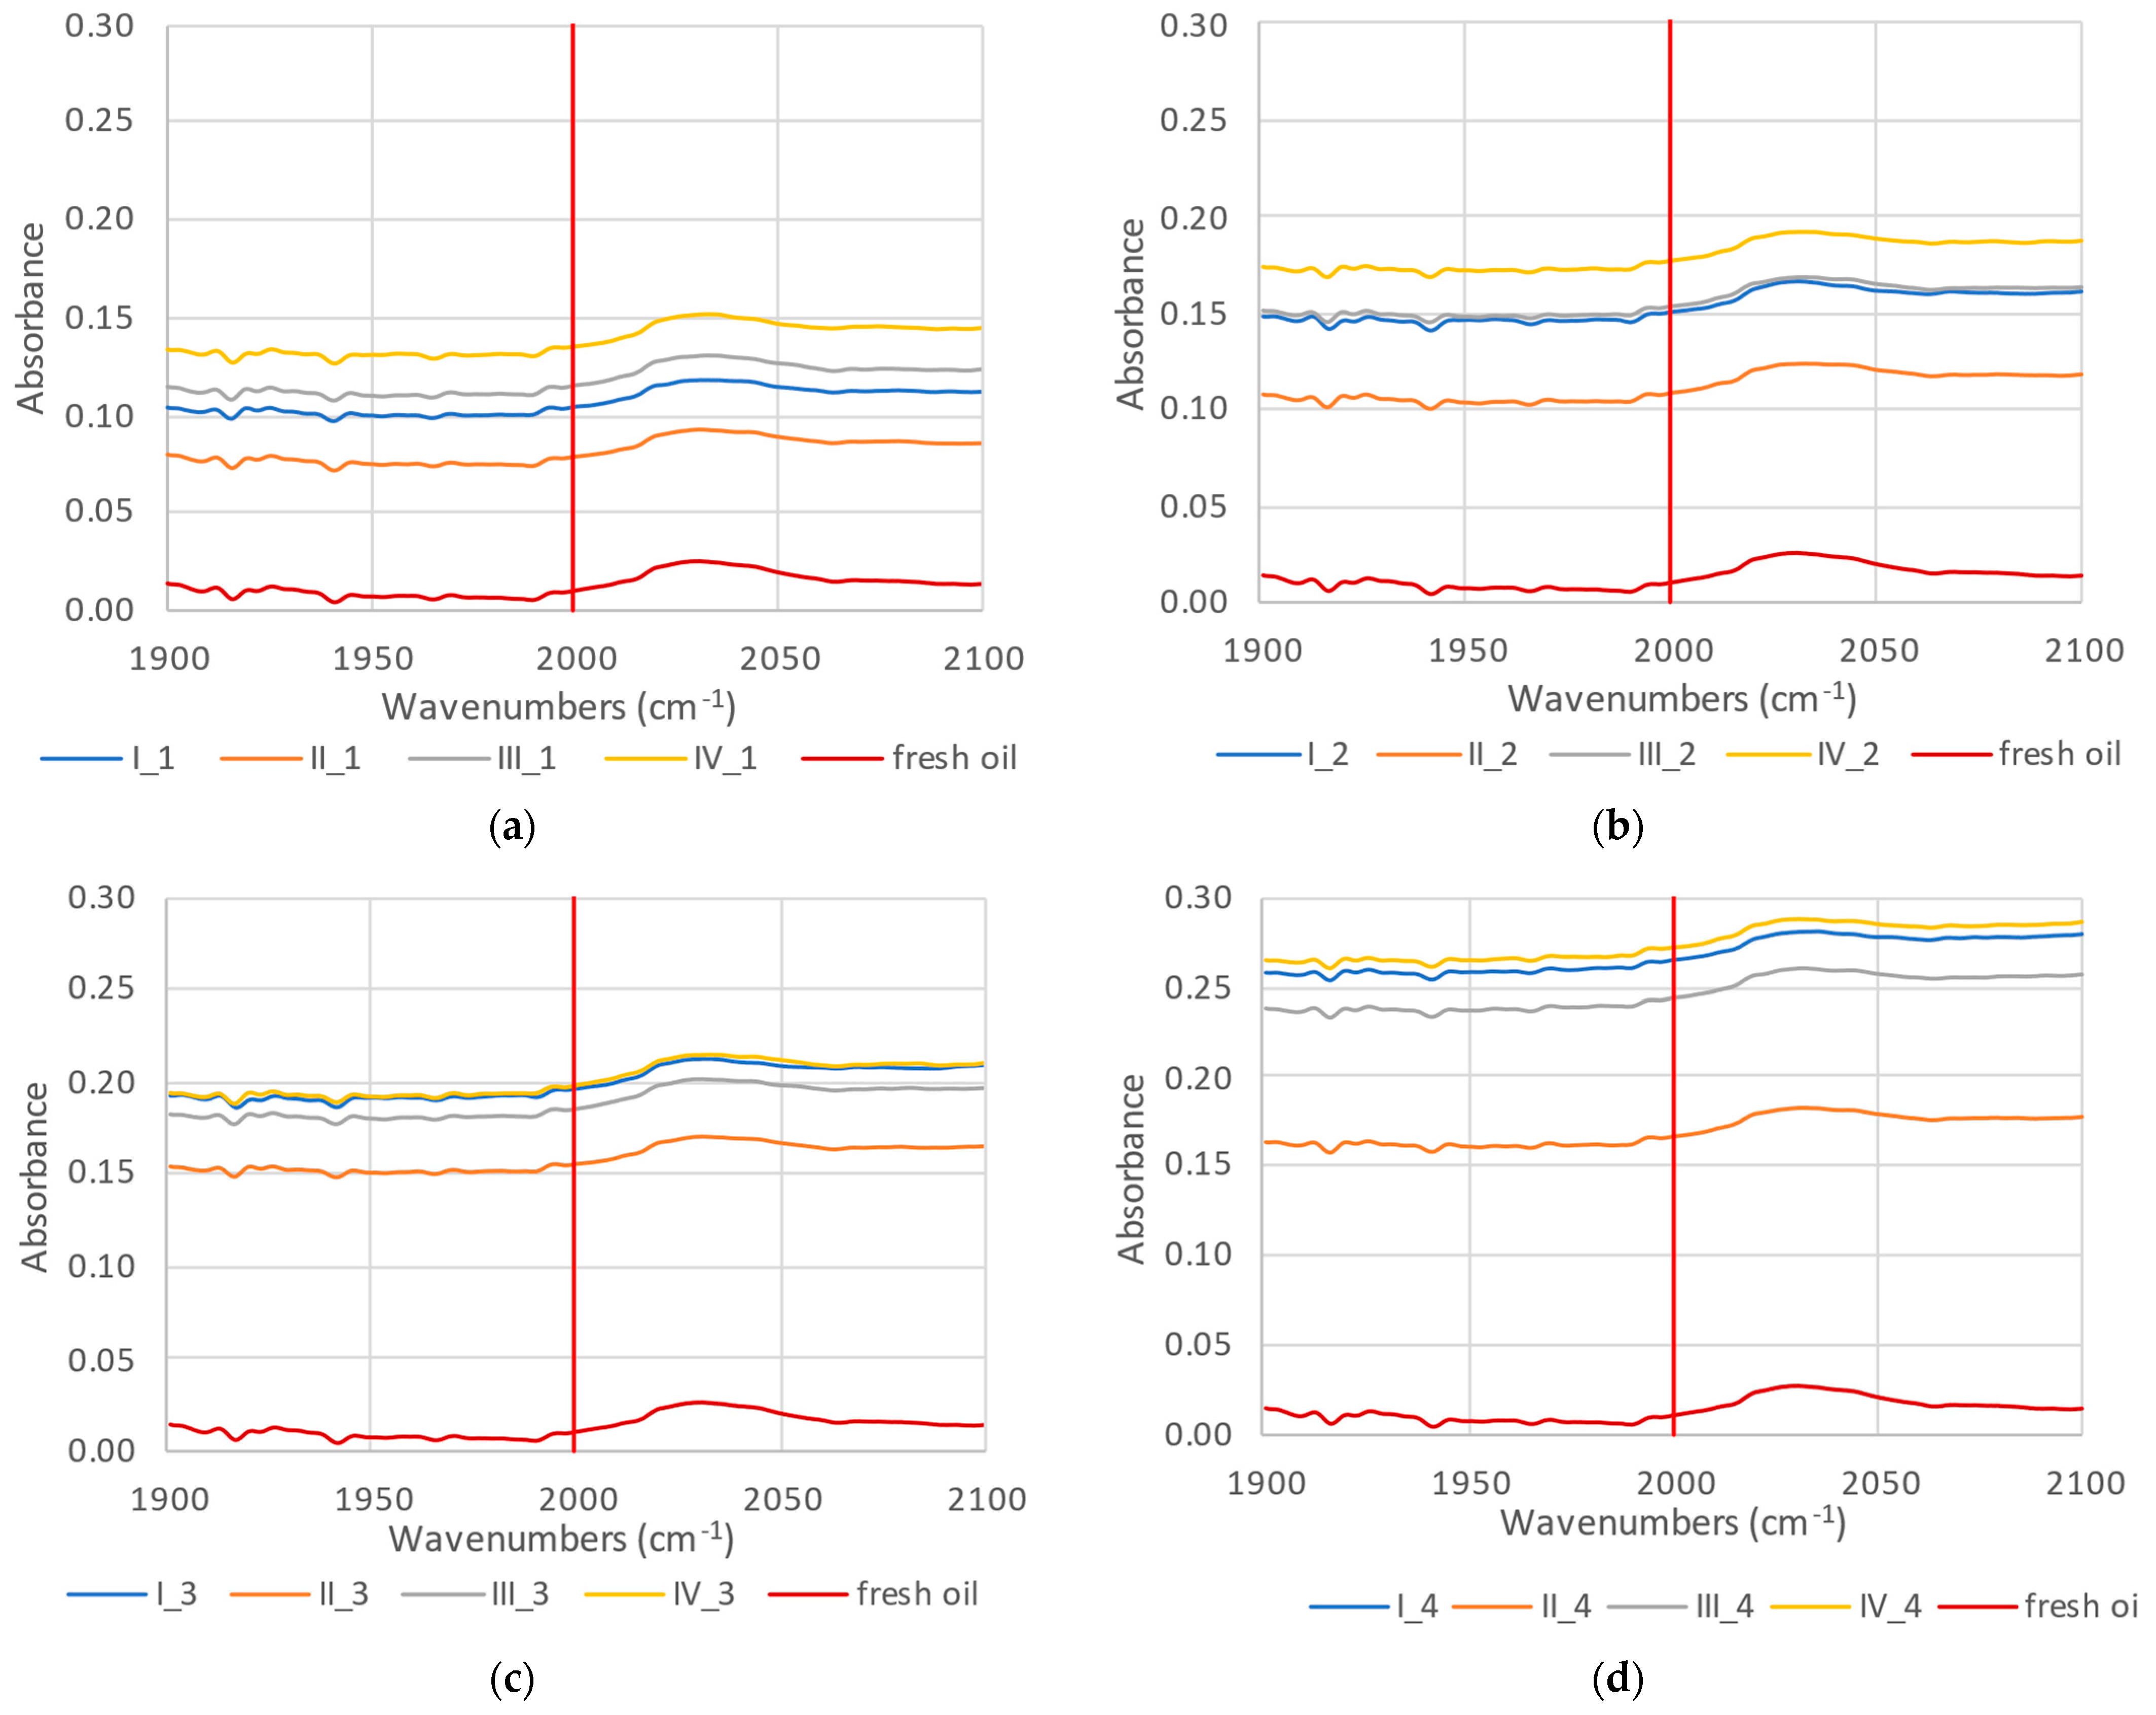
3.1. Changes in Soot Content in Oils

Due to continuous vehicle operation, sampling periods vary slightly. Engine oil top-ups, which were performed as part of periodic vehicle maintenance, were not recorded.
According to ASTM E2412, FTIR detects changes in the concentration of soot in engine oil in the region of about 2000 cm−1. The presence of soot in engine oil causes the FTIR spectrum to shift depending on the level of soot. Figure 2 shows the recorded spectra juxtaposed with the change intervals for each cycle.
The characteristic feature of soot is the lack of any specific infrared absorption bands. Rather, the soot particles cause a general scattering of infrared radiation, which is more severe at higher wavenumbers. The darkening effect is related to the production of polymeric or polycondensation substances at higher temperatures and with the presence of impurities (especially carbon/soot). As expected, the FTIR spectra shifted with increasing levels of soot in the oils associated with the vehicle’s oil service mileage. Similar observations were presented in References [24,32] examining the frequency of changing engine oil in public transport vehicles. The largest shifts in the spectrum relative to fresh oil are seen for the fourth interval for all oil intake cycles (Figure 2, yellow curve), while the smallest shifts are seen for the second interval (Figure 2, orange curve).
It is noteworthy that the shifts of the spectrum for the third and fourth oil intake cycles are similar in Intervals I and IV (Figure 2c,d).
The shifts recorded in Cycles 1 and 3 for Interval I were similar to Interval IV, while those for Cycle 2 were similar to the spectrum recorded for Interval III.
The instrument software allows the recorded spectra to be converted to soot content expressed in %.
The data presented in Table 2 show the increase in soot content at four successive engine oil change intervals in the test vehicle. The averages of the three measurements for the test sample taken in a given cycle were used for the analysis, and standard deviations are also shown in the table. It was found that all the differences in the measurements at each interval for both the soot parameter and the dispersion size had high statistical significance.
In all intervals, an increase in soot compactness was observed as the vehicle was driven. The highest soot content was obtained for Interval IV (Cycle 4) and was 0.55%. Slightly lower values were obtained for Interval I (Cycle 4) at 0.51% and Interval III at 0.49 (Cycle 4). This indicates that as the mileage of the vehicle, and therefore the wear of the engine, increases, the soot content of the oil also increases. This can be linked to the gradual wear of the injection apparatus. It can also be noted that the rate of accumulation of soot in the oil is similar from period to period. Differences for Cycle 4 can be seen only in the case of Interval II; however, this is due to the fact that the oil change took place at 43,801 km, so earlier than in the other periods, but the value is similar to the value at the corresponding mileage for the other intervals.
Similar results were obtained by [33] for a tractor-trailer after 40,000 km of mileage, where the value of soot in the engine oil was 0.62% (m/m). Comparing the obtained results with the works of other authors, in Reference [34] the authors, using a thermogravimetric analyzer (TGA), determined the soot content of small turbocharged engines, where at 5000 km mileage the soot content was at the level of 1% (m/m), and after 8000 km at the level of 1.5% (m/m), considering the obtained results to be surprisingly high, considering that the oil change interval given by the manufacturer is 15,000 km. For example, in Reference [35], the oils obtained during oil changes did not exceed 1% (m/m).

Statistical Analysis and Modeling Changes in Soot Content in Oils

Table 3 presents descriptive characteristics per oil sampling cycle for all oil change intervals. The cut-off value for the significance level was set at 0.05, and p < 0.01 was considered highly significant.
Analyzing Table 3, it was found that all the differences for variables in successive measurement periods between the first and second, second and third, and third and fourth cycles (based on data for all intervals) of oil changes for the parameter determining soot content were highly statistically significant. These results indicate an upward trend for the average values of this parameter.
The changes in the amount of soot by mileage for each interval are described by regression lines (Table 4, Figure 3). The determined coefficients of the straights at the intervals studied are statistically significant (p < 0.01). Very strong statistically significant linear correlations were found between soot percentage and mileage at each of the four oil change intervals considered (Table 4). Each correlation coefficient is statistically significant (p < 0.001).
It was checked whether the course of the straights corresponding to each interval differed significantly. The SimReg procedure [36] was used to compare the straights in pairs. Significant differences were obtained for all compared pairs of straights at a significance level less than 0.001 except for straights corresponding to Intervals I and Interval III, for which no significant difference was found (test statistic value = 1.9153 and p = 0.9935). Minor differences may be due to the time of year and the nature of operation between these intervals, but as shown, the direction of soot content accumulation is similar in each interval regardless of vehicle mileage, so it may be easier to control this type of pollution.
The mileage-dependent changes in soot content for the four intervals were described by linear regression equations. A common regression equation expressing soot content changes for the four oil change intervals can be created by attaching zero-one variables to the regression model [37]. After taking into account the test result that there are no significant differences in the course of soot changes for the first and third intervals, the common regression equation has the form:
S = 0.0244765 + 0.0000093 M + 0.0113123 Z1 + 0.0108823 Z2 − 0.0000018 Z1M + 0.0000008 Z2M,
where the variables Z1 and Z2 are zero-one variables: Z1 takes a value of 1 when the observation is from Interval II and a value of 0 for observations from other intervals, and Z2 takes a value of 1 when the observation is from Interval IV and a value of 0 for observations from other intervals.
The very high value of the coefficient of determination of 0.989 for the above model indicates a very good fit of the estimated function to the data.

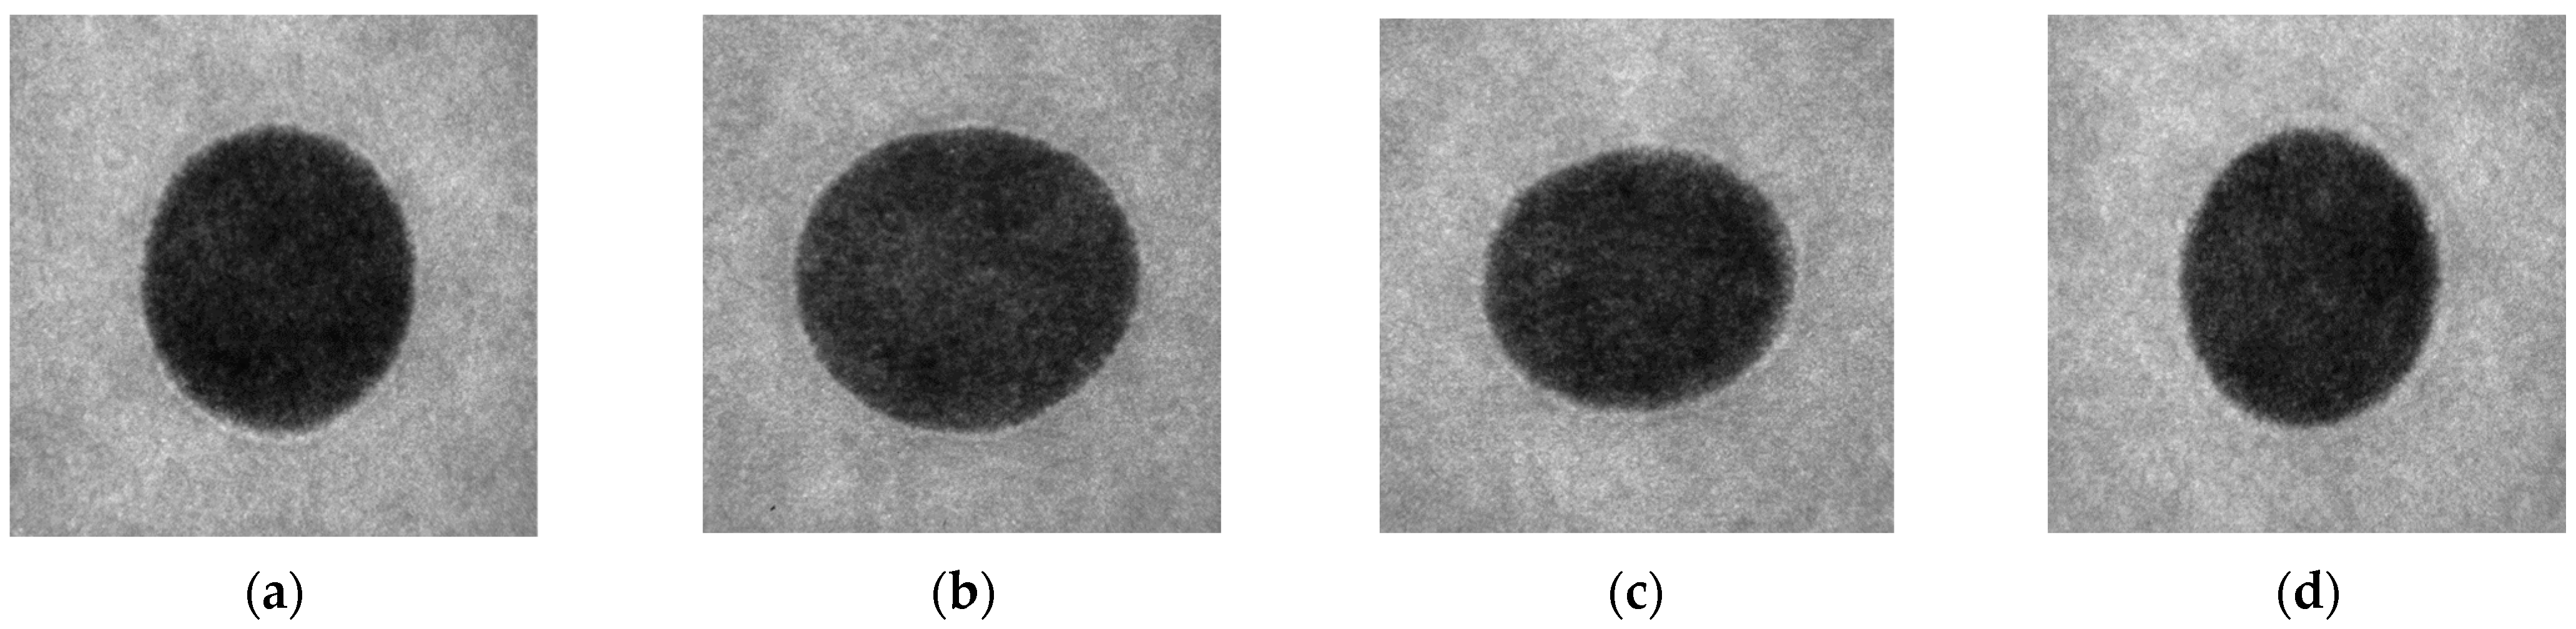
3.2. Changes in the Level of Oil Dispersion

As a dispersed solid phase, soot is kept in dispersion form by dispersant-type additives introduced into engine oils, hence causing its agglomeration to be difficult. Dispersants make up a significant part of the engine oil additive package, hence the effect of soot interaction with the dispersant is of particular importance.
Figure 4 presents sample images from the oil droplet camera of recent cycles of individual oil intervals. The camera analyzed the dispersion characteristics of the oil droplets from all measurements, and based on these images, a measure of the dispersive capacity of the oil during operation at each measurement period is presented for all four oil intervals.
Analyzing the level of oil dispersion during the intervals studied (Table 2), we can conclude that the oil retained a high degree of dispersing capabilities for almost the entire period of operation (values close to 100). In Intervals III and IV, the levels of dispersion for the last four oil intake cycles were at the same level and amounted to 84, and a slightly lower level of 82 was observed in Interval I. Different from the other intervals, the character of the changes in dispersion magnitude was observed during the second oil change interval, where during the third intake cycle at 30,000 km, a significant increase in the value of this indicator to the level of 99.8 was observed, which may be indicative of the application of an increased dose of new oil to the oil during operation. The oil in this case, too, was changed 6000 km earlier than at the other intervals, which also affected the final result of this parameter at 97.
A similar change curve for a passenger car was observed in Reference [38].

Statistical Analysis and Modeling Changes in the Level of Oil Dispersion

Table 5 presents descriptive characteristics per oil sampling cycle for all oil change intervals. As in the case of soot content, all variables in successive measurement periods between oil change cycles were highly statistically significant and indicate an upward trend for the average values of this parameter.
The changes in the magnitude of dispersion depending on the waveform for the first, third, and fourth intervals are described by regression lines (Table 6, Figure 5). The determined coefficients of the straights in the studied cycles are statistically significant (p < 0.01). Statistically significant linear correlations were found between dispersion magnitude and mileage for the first, third, and fourth oil change intervals (p < 0.004). For the second interval, the linear correlation coefficient (−0.1928) is not statistically significant.
It was checked whether the course of the straights corresponding to each interval differed significantly [36]. Significant differences were obtained for the compared pairs of straights corresponding to Intervals I and III and Intervals I and IV at a significance level of less than 0.004, while no significant difference was found for straights corresponding to Intervals III and IV (test statistic value = 0.6196 and p = 0.8265).
For Intervals I, III, and IV, the changes in the amount of dispersion depending on the waveform were described by linear regression equations. In addition, the result of the test indicated that there were no significant differences in the course of changes in dispersion magnitude for the IIIrd and IVth intervals. The common regression equation for the first, third, and fourth oil change intervals is of the form
MD = 101.04698 − 0.0002246 M + 0.0385072Z1 − 0.0001466 Z1M,
where the variable Z1 takes the value of 1 for observations coming from Interval I and the value of 0 for observations from Intervals III and IV.
The coefficient of determination for the determined model common to the three intervals is 0.618.

4. Conclusions

The field test carried out on a selected bus from the vehicle fleet provides a deeper understanding of how the soot content of engine oil changes during operation. The observation concerned four consecutive oil change intervals (mileage of about 200,000 km) over a 3-year period, during which engine oil samples were taken periodically. The presented work fills the diagnosed gap in the literature on the subject, as it has been observed that there are few works presenting the degradation processes of engine oils during actual operating conditions.
The results obtained provide a basis for the conclusion that the direction of changes in soot content is the same in each interval, and these changes are similar to each other. Soot accumulation does not significantly differ between the intervals studied. Statistical analysis made it possible to confirm the significance of changes in the soot content of the oil in relation to the vehicle’s operating mileage.
The data obtained indicate that it is possible to develop a statistical model of changes in the soot content of oil, which could be used to predict the behavior of engine oil during operation, which was realized in the presented work.
Investigations of the change in the degree of oil dispersion using the “drop on blotter” method made it possible to confirm the trend of decreasing dispersion as the mileage increases. Statistical analysis confirmed the significance of changes in the level of dispersion in relation to the vehicle’s operating mileage. However, the results are not as conclusive as in the case of changes in soot compactness. No significant differences were found in the course of changes in dispersion volume for only two intervals. Thus, the model obtained in this study had a low correlation coefficient of 0.618 and was based on only three intervals, which should be considered an area for improvement based on more data in future studies.
The authors are in the course of further research based on the presented methodology. These tests include checking other engines, oil categories, and number of change intervals. This will make it possible to check the validity of the obtained models.

Author Contributions

Conceptualization, G.Z.; methodology, G.Z. and W.G.; validation, W.G., and G.Z.; formal analysis, M.S. (Małgorzata Szczepanik); investigation, W.G.; resources, M.S. (Marie Sejkorová); data curation, W.G.; writing—original draft preparation, G.Z., W.G., A.W.; writing—review and editing, M.S. (Marie Sejkorová); visualization, W.G., G.Z. and M.S. (Małgorzata Szczepanik); supervision, G.Z.; project administration, G.Z.; funding acquisition, G.Z. All authors have read and agreed to the published version of the manuscript.

Funding

The publication was co-financed from the subsidy granted to the Cracow University of Economics—Project No. 068/ZJB/2022/POT.

Data Availability Statement

The data presented in this study are available on request from the corresponding author.

Conflicts of Interest

The authors declare no conflict of interest.

References

  1. Ge, J.C.; Wu, G.; Yoo, B.-O.; Choi, N.J. Effect of Injection Timing on Combustion, Emission and Particle Morphology of an Old Diesel Engine Fueled with Ternary Blends at Low Idling Operations. Energy 2022, 253, 124150. [Google Scholar] [CrossRef]
  2. Ge, J.C.; Kim, H.Y.; Yoon, S.K.; Choi, N.J. Optimization of Palm Oil Biodiesel Blends and Engine Operating Parameters to Improve Performance and PM Morphology in a Common Rail Direct Injection Diesel Engine. Fuel 2020, 260, 116326. [Google Scholar] [CrossRef]
  3. Dzieniszewski, G.; Kuboń, M.; Pristavka, M.; Findura, P. Operating Parameters and Environmental Indicators of Diesel Engines Fed with Crop-Based Fuels. Agric. Eng. 2021, 25, 13–28. [Google Scholar] [CrossRef]
  4. Caban, J.; Vrábel, J.; Šarkan, B.; Ignaciuk, P. About Eco-Driving, Genesis, Challenges and Benefits, Application Possibilities. Transp. Res. Procedia 2019, 40, 1281–1288. [Google Scholar] [CrossRef]
  5. Ge, J.C.; Kim, H.Y.; Yoon, S.K.; Choi, N.J. Reducing Volatile Organic Compound Emissions from Diesel Engines Using Canola Oil Biodiesel Fuel and Blends. Fuel 2018, 218, 266–274. [Google Scholar] [CrossRef]
  6. Ge, J.C.; Wu, G.; Choi, N.J. Comparative Study of Pilot–Main Injection Timings and Diesel/Ethanol Binary Blends on Combustion, Emission and Microstructure of Particles Emitted from Diesel Engines. Fuel 2022, 313, 122658. [Google Scholar] [CrossRef]
  7. Vyavhare, K.; Bagi, S.; Patel, M.; Aswath, P.B. Impact of Diesel Engine Oil Additives–Soot Interactions on Physiochemical, Oxidation, and Wear Characteristics of Soot. Energy Fuels 2019, 33, 4515–4530. [Google Scholar] [CrossRef]
  8. George, S.; Balla, S.; Gautam, M. Effect of Diesel Soot Contaminated Oil on Engine Wear. Wear 2007, 262, 1113–1122. [Google Scholar] [CrossRef]
  9. Wolak, A.; Krzyzaniak, M. Performance Evaluation of Engine Oils with the Use of Paper Chromatography. NAFTA-GAZ-Sci. Technol. OIL GAS Ind. 2017, 73, 54–60. [Google Scholar] [CrossRef]
  10. Gołębiowski, W.; Zając, G.; Sarkan, B. Evaluation of the Impact of Tractor Field Works on Changes in Selected Elements of Engine Oils. Agric. Eng. 2022, 26, 1–12. [Google Scholar] [CrossRef]
  11. La Rocca, A.; Bonatesta, F.; Fay, M.; Campanella, F. Characterisation of Soot in Oil from a Gasoline Direct Injection Engine Using Transmission Electron Microscopy. Tribol. Int. 2015, 86, 77–84. [Google Scholar] [CrossRef]
  12. Salehi, F.M.; Morina, A.; Neville, A. The Effect of Soot and Diesel Contamination on Wear and Friction of Engine Oil Pump. Tribol. Int. 2017, 115, 285–296. [Google Scholar] [CrossRef] [Green Version]
  13. Gołębiowski, W.; Wolak, A.; Zając, G. Definition of Oil Change Intervals Based on the Analysis of Selected Physicochemical Properties of Used Engine Oils. Combust. Engines 2018, 172, 44–50. [Google Scholar] [CrossRef] [PubMed]
  14. Kontou, A.; Southby, M.; Morgan, N.; Spikes, H. Influence of Dispersant and ZDDP on Soot Wear. Tribol. Lett. 2018, 66, 157. [Google Scholar] [CrossRef] [Green Version]
  15. Bagi, S.; Kamp, C.J.; Sharma, V.; Aswath, P.B. Multiscale Characterization of Exhaust and Crankcase Soot Extracted from Heavy-Duty Diesel Engine and Implications for DPF Ash. Fuel 2020, 282, 118878. [Google Scholar] [CrossRef]
  16. Omar, A.A.S.; Salehi, F.M.; Farooq, U.; Morina, A.; Neville, A. Chemical and Physical Assessment of Engine Oils Degradation and Additive Depletion by Soot. Tribol. Int. 2021, 160, 107054. [Google Scholar] [CrossRef]
  17. Furch, J.; Jelinek, J. Design of a Tribotechnical Diagnostics Model for Determining the Technical Condition of an Internal Combustion Engine during Its Life Cycle. Eksploat. Niezawodn.-Maint. Reliab. 2022, 24, 437–445. [Google Scholar] [CrossRef]
  18. Famfulik, J.; Richtar, M.; Smiraus, J.; Muckova, P.; Sarkan, B.; Dresler, P. Internal Combustion Engine Diagnostics Using Statistically Processed Wiebe Function. Eksploat. Niezawodn. 2021, 23, 505–511. [Google Scholar] [CrossRef]
  19. Hurtová, I. Hodnocení Karbonového Znečištění Motorových Olejů. Perner’ Contacts 2020, 15, 1–6. [Google Scholar] [CrossRef]
  20. Shi, J.; Yi, X.; Wang, J.; Jin, G.; Lu, Y.; Wu, H.; Fan, X. Carbonaceous Soot Dispersion Characteristic and Mechanism in Lubricant with Effect of Dispersants by Molecular Dynamics Simulation and Experimental Studies. Carbon 2022, 200, 253–263. [Google Scholar] [CrossRef]
  21. Kontou, A.; Taylor, R.; Spikes, H. Effects of Dispersant and ZDDP Additives on Fretting Wear. Tribol. Lett. 2021, 69, 1–13. [Google Scholar] [CrossRef]
  22. Liu, Q.; Wu, Z.; Huang, Z.; Zhang, F.; Zhao, Y. Simulation and Experimental Study on the Effect of Dispersants on Soot Aggregation. China Pet. Process. Petrochem. Technol. 2020, 22, 101–107. [Google Scholar]
  23. Nassar, A.M.; Ahmed, N.S.; Abdel-Hameed, H.S.; El-Kafrawy, A.F. Synthesis and Utilization of Non-Metallic Detergent/Dispersant and Antioxidant Additives for Lubricating Engine Oil. Tribol. Int. 2016, 93, 297–305. [Google Scholar] [CrossRef]
  24. Sejkorová, M.; Hurtová, I.; Jilek, P.; Novák, M.; Voltr, O. Study of the Effect of Physicochemical Degradation and Contamination of Motor Oils on Their Lubricity. Coatings 2021, 11, 60. [Google Scholar] [CrossRef]
  25. Abdulqadir, L.B. Investigation of the Effects of Soot on the Wear of Automotive Engine Components. Ph.D. Thesis, The University of Sheffield, Sheffield, UK, 2017. [Google Scholar]
  26. Bredin, A.; Larcher, A.V.; Mullins, B.J. Thermogravimetric Analysis of Carbon Black and Engine Soot—Towards a More Robust Oil Analysis Method. Tribol. Int. 2011, 44, 1642–1650. [Google Scholar] [CrossRef] [Green Version]
  27. Van De Voort, F.; Sedman, J.; Cocciardi, R.; Pinchuk, D. FTIR Condition Monitoring of In-Service Lubricants: Ongoing Developments and Future Perspectives. Tribol. Trans. 2006, 49, 410–418. [Google Scholar] [CrossRef]
  28. Macián, V.; Tormos, B.; Ruiz, S.; García-Barberá, A. An Alternative Procedure to Quantify Soot in Engine Oil by Ultraviolet-Visible Spectroscopy. Tribol. Trans. 2019, 62, 1063–1071. [Google Scholar] [CrossRef]
  29. Abdulqadir, L.; Mohd Nor, N.; Lewis, R.; Slatter, T. Contemporary Challenges of Soot Build-up in IC Engine and Their Tribological Implications. Tribol.-Mater. Surf. Interfaces 2018, 12, 115–129. [Google Scholar] [CrossRef]
  30. Chourasia, S.; Patel, P.D.; Lakdawala, A.; Patel, R.N. Study on Tribological Behavior of Biodiesel—Diethyl Ether (B20A4) Blend for Long Run Test on Compression Ignition Engine. Fuel 2018, 230, 64–77. [Google Scholar] [CrossRef]
  31. Wolak, A.; Krasodomski, W.; Zając, G. FTIR Analysis and Monitoring of Used Synthetic Oils Operated under Similar Driving Conditions. Friction 2020, 8, 995–1006. [Google Scholar] [CrossRef]
  32. Sejkorová, M.; Hurtová, I.; Glos, J.; Pokorný, J. Definition of a Motor Oil Change Interval for High-Volume Diesel Engines Based on Its Current Characteristics Assessment. Acta Univ. Agric. Silvic. Mendel. Brun. 2017, 65, 481–490. [Google Scholar] [CrossRef] [Green Version]
  33. Al Sheikh Omar, A.; Salehi, F.M.; Farooq, U.; Neville, A.; Morina, A. Effect of Zinc Dialkyl Dithiophosphate Replenishment on Tribological Performance of Heavy-Duty Diesel Engine Oil. Tribol. Lett. 2022, 70, 24. [Google Scholar] [CrossRef] [PubMed]
  34. Kozak, M.; Siejka, P. Soot Contamination of Engine Oil-the Case of a Small Turbocharged Spark-Ignition Engine. Combust. Engines 2020, 182, 28–32. [Google Scholar] [CrossRef]
  35. Kozak, M. A Comparison of Thermogravimetric Characteristics of Fresh and Used Engine Oils. Combust. Engines 2019, 178, 289–292. [Google Scholar] [CrossRef]
  36. Jamshidian, M.; Liu, W.; Zhang, Y.; Jamishidian, F. SimReg: A Software Including Some New Developments in Multiple Comparison and Simultaneous Confidence Bands for Linear Regression Models. J. Stat. Softw. 2005, 12, 1–22. [Google Scholar] [CrossRef] [Green Version]
  37. Neter, J.; Kutner, M.H.; Nachtsheim, C.J.; Wasserman, W. Applied Linear Statistical Models; McGraw-Hill/Irwin: New York, NY, USA, 1996. [Google Scholar]
  38. Dörr, N.; Agocs, A.; Besser, C.; Ristić, A.; Frauscher, M. Engine Oils in the Field: A Comprehensive Chemical Assessment of Engine Oil Degradation in a Passenger Car. Tribol. Lett. 2019, 67, 68. [Google Scholar] [CrossRef]
Figure 1. MD (dispersion) calculation on DT 100DL apparatus source: (https://www.zematra.com/product/dispersancy-tester-model-dt100dl, accessed on 11 January 2023).
Lubricants 11 00089 g001
Figure 2. Spectra recorded for individual cycles at the intervals studied and for fresh oil: (a) Cycle 1, (b) Cycle 2, (c) Cycle 3, and (d) Cycle 4.
Lubricants 11 00089 g002
Figure 3. Estimated regression lines for successive intervals.
Lubricants 11 00089 g003
Figure 4. Changes in merit of dispersancy of engine oil tested and pictures of the last dried drops from the oil change at each interval: (a) Interval I, oil mileage = 50,780 km; (b) Interval II, oil mileage = 44,415 km; (c) Interval III, oil mileage = 51,915 km; (d) Interval IV, oil mileage = 52,079 km.
Lubricants 11 00089 g004
Figure 5. Estimated regression lines for successive intervals.
Lubricants 11 00089 g005
Table 1. The number of kilometers traveled.
Oil Drain IntervalsTotal Vehicle Mileage (km)Oil Mileage (km)
Interval I20,28920,289
29,87229,872
39,45939,459
50,78050,780 (oil change)
Interval II65,34514,565
74,99224,212
85,09734,317
95,19544,415 (oil change)
Interval III114,69120,110
125,17930,598
135,38040,799
146,49651,915 (oil change)
Interval IV167,80021,849
175,06129,179
185,54639,595
197,96152,079 (oil change)
Table 2. Results of soot content and dispersion rate in the oil samples tested.
SamplesOverall Vehicle Mileage
(km)
Soot
(%)
Merit of Dispersancy
(0–100)
x ¯ ± SD x ¯ ± SD
Interval I1st cycle20,28920,2890.21 ± 0.0098.00 ± 2.00
2nd cycle29,87229,8720.30 ± 0.0092.67 ± 1.52
3rd cycle39,45939,4590.40 ± 0.0182.00 ± 7.21
4th cycle50,78050,7800.51 ± 0.0082.33 ± 0.58
Interval II1st cycle13,95165,3450.16 ± 0.0097.67 ± 0.58
2nd cycle23,59874,9920.22 ± 0.0093.00 ± 1.00
3rd cycle33,70385,0970.30 ± 0.0199.67 ± 0.58
4th cycle43,80195,1950.34 ± 0.0097.00 ± 1.00
Interval III1st cycle19,496114,6910.23 ± 0.0096.00 ± 4.00
2nd cycle29,984125,1790.31 ± 0.0096.00 ± 3.00
3rd cycle40,185135,3800.37 ± 0.0197.00 ± 2.00
4th cycle51,301146,4960.49 ± 0.0084.67 ± 3.21
Interval IV1st cycle21,235167,8000.27 ± 0.0099.00 ± 1.00
2nd cycle28,565175,0610.36 ± 0.0097.67 ± 0.58
3rd cycle38,981185,5460.40 ± 0.0097.00 ± 1.00
4th cycle51,465197,9610.55 ± 0.0084.33 ± 2.08
x ¯ —arithmetic average, SD—standard deviation.
Table 3. The mean values, standard deviations, and p-values for soot.
ParameterAverage from All Four Intervals
1st Cycle2nd Cyclep2nd Cycle3rd Cyclep3rd Cycle4th Cyclep
N = 12N = 12N = 12N = 12N = 12N = 12
x ¯ ± SD x ¯ ± SD x ¯ ± SD
Soot (%)0.22 ± 0.040.3 ± 0.05<0.0010.3 ± 0.050.4 ± 0.04<0.0010.4 ± 0.040.5 ± 0.08<0.001
N—number of samples tested, x ¯ —arithmetic average, SD—standard deviation, pp-value resulting from the application of Student’s test for independent samples.
Table 4. Equations of estimated lines and correlation coefficients for soot quantity.
Oil Drain Intervals EquationsCorrelation Coefficient
Interval IS = 9.6 × 10⁻⁶ M + 0.01730.9997
Interval IIS = 7.4 × 10⁻⁶ M + 0.03580.9896
Interval IIIS = 9.0 × 10⁻⁶ M + 0.03140.9959
Interval IVS = 1.0 × 10⁻⁵ M + 0.03540.9920
Table 5. The mean values, standard deviations, and p-values for merit of dispersancy.
ParameterAverage from All Four Intervals
1st Cycle2nd Cyclep2nd Cycle3rd Cyclep3rd Cycle4th Cyclep
N = 12N = 12N = 12N = 12N = 12N = 12
x ¯ ± SD x ¯ ± SD x ¯ ± SD
Merit of Disperancy (0–100)97.7 ± 2.394.8 ± 2.7<0.00194.8 ± 2.693.9 ± 7.9<0.00193.9 ± 7.987.1 ± 6.3<0.001
N—number of samples tested, x ¯ —arithmetic average, SD—standard deviation, pp-value resulting from the application of Student’s test for independent samples.
Table 6. Equations of estimated lines and correlation coefficients for merit of dispersancy.
Oil Drain IntervalsEquationsCorrelation Coefficient
Interval IMD = −3.7 × 10⁻⁴ M + 101.0855−0.8510
Interval IIIMD = −2.1 × 10⁻⁴ M + 100.3022−0.6963
Interval IVMD = −2.4 × 10⁻⁴ M + 101.7997−0.7363
Disclaimer/Publisher’s Note: The statements, opinions and data contained in all publications are solely those of the individual author(s) and contributor(s) and not of MDPI and/or the editor(s). MDPI and/or the editor(s) disclaim responsibility for any injury to people or property resulting from any ideas, methods, instructions or products referred to in the content.

