Article

Investigation on Machinability Characteristics of Inconel 718 Alloy in Cryogenic Machining Processes

1
College of Mechanical Engineering, Jiangsu University of Science and Technology, Zhenjiang 212100, China
2
College of Mechanical and Electrical Engineering, Nanjing University of Aeronautics and Astronautics, Nanjing 210016, China
3
Department of Mechatronics Engineering, University of Chakwal, Chakwal 48800, Pakistan
*
Author to whom correspondence should be addressed.
Lubricants 2023, 11(2), 82; https://doi.org/10.3390/lubricants11020082
Submission received: 22 January 2023 / Revised: 10 February 2023 / Accepted: 12 February 2023 / Published: 15 February 2023

Abstract

:
In this innovative work, Inconel 718 alloy turning simulation models under dry and cryogenic machining (Cryo) conditions are developed. The machinability characteristics of the aforementioned alloy were assessed with relation to cutting temperature ( T c t ) and cutting force ( F c f ). The comparison of the T c t and F c f results from simulation with those obtained under the identical experimental conditions served as additional evidence of the effectiveness of the suggested simulation model. By varying the cutting speed, the reduction in T c t under Cryo conditions was 9.36% to 11.98% compared to dry cutting. Regarding the force comparison under experiment and simulation, the average difference between the simulation and experimental values for the main cutting force ( F c ) was 13.73%, whereas the average deviation for the feed force ( F f ) was 14.63%. Response surface methodology (RSM) was employed to build the forecasting models for T c t and F c f in cryogenic settings. These mathematical models showed excellent predictive performance and were able to estimate the T c t and F c f under machining operations settings, according to the present research. When compared to dry cutting, Cryo reduced the cutting temperature, which had a positive impact on the alloy’s machinability.

1. Introduction

Inconel 718 alloy is a state-of-the-art engineering material for manufacturing engineering because of its remarkable corrosion resistance, great toughness, and high yield strength at high temperatures. This alloy is frequently used to build nuclear reactors, jet engines, and turbine engines [1].
Inconel 718 alloy has a number of unique characteristics, such as lower thermal conductivity, good strength, and superior mechanical properties [2], but it is extremely difficult to machine because of the generation of a large amount of cutting heat, severe tool wear, and poor machined surface quality. Therefore, lowering the cutting temperature is unquestionably essential to enhancing Inconel 718 alloy’s machinability.
In order to improve the processability, clean the workpiece, and remove chips, conventional cutting fluid is typically used in high quantities when machining Inconel 718. This tactic, however, has a lot of drawbacks and restrictions. Conventional manufacturing industries’ energy consumption and production costs will inevitably rise as a result of the unrestricted use of conventional cutting fluids. The four most common types of traditional cutting fluids used in manufacturing are mineral oil, soluble oil, semi-synthetic oil, and synthetic oil [3]. The majority of typical cutting fluids include some chemical additions, such as sulfur and chlorine compounds [4]. Consequently, the intemperate use of conventional cutting fluids causes a hike in disposal cost and it also leads to some negative effects on worker health, machine tool life, and working environment. In view of these points, the requirements of sustainable manufacturing cannot be met by conventional machining that uses common cutting fluids as coolants.
Dry cutting could seem like a good choice because it does not have the same detrimental effects that traditional cutting fluid does on the machinist and the workspace. When dry cutting the Inconel 718 alloy, Thakur et al. [5] looked into the impact of cutting speed ( v c ) and feed speed ( f ) on cutting temperature. When v c and f were simultaneously increased, the authors observed a rise in cutting temperature. Higher cutting parameters increased the energy used during the cutting operation, which likely contributed to the rise in cutting temperature. Zhao et al. [6] found that the use of aggressive cutting speeds in turning caused an increase in the cutting temperature under dry cutting conditions of the Inconel 718 alloy. Reports stated that the increasing rate of cutting temperature was gradually decreased as cutting speed increased. The cutting force clearly reduced as cutting speed increased, especially at higher cutting speeds. In cutting studies on Inconel 718, Devillez et al. [7] discovered that increasing the cutting speed greatly decreased the cutting force. The primary shear zone’s higher cutting temperature was identified as the cause. This occurrence caused the workpiece’s mechanical strength to weaken, which in turn reduced the cutting force. Nevertheless, dry cutting frequently results in higher T ct , increased tool wear, and subpar surface finishes due to the lack of lubrication, especially when machining hard-to-cut materials such as superalloy and titanium alloy.
Cryogenic machining (Cryo) using liquid nitrogen (LN2) as a coolant is an excellent method for enhancing the lubricooling (lubrication/cooling) effects in the cutting zone when compared to dry cutting and conventional machining. This is because it can more efficiently remove a significant amount of cutting heat produced during the cutting process and lower the cutting temperature. It should be highlighted that Cryo has diverse major advantages. The drawbacks of traditional cutting fluid utilized in traditional machining are eliminated by Cryo. The usage of LN2, which is utilized in cryogenic environments, negates the requirement for cutting fluid disposal costs because it swiftly evaporates and returns to the atmosphere with no cutting fluid residue pollution [8]. Compared with conventional machining, the consumption of lubricant/coolant is reduced significantly, thereby reducing the cutting fluid cost. Moreover, Cryo can reduce tool wear and improve surface quality [9].
Several research works were performed for machining advanced engineering materials, for instance Inconel 718 alloy, titanium alloy, stainless steel, and aluminum alloy using Cryo strategies [10,11,12]. He et al. [13] pointed out that the cutting temperature under Cryo strategies was notably lower than under dry cutting conditions when turning Inconel 718. This stems from the fact that, in the case of Cryo, LN2 has the capacity to cool the cutting region because of its very low boiling point (−196 °C).
Kaynak et al. [14] conducted the experimental tests for dry cutting and Cryo strategies and evaluated the machining responses in turning. The research findings showed that increasing the cutting speed increased the cutting temperature both under dry cutting and Cryo strategies. However, the cutting temperature under Cryo strategies was considerably lower than that under dry cutting conditions while machining titanium alloy Ti-5Al-5V-3Cr-0.5Fe (Ti-5553). When compared to dry tests, the main cutting force and feed force under Cryo methods were somewhat higher at lower cutting speeds. This decrease might be attributable to the thermal effect, whereby an increase in cutting temperature was brought on by an increase in v c , which helped to lower the energy needed for workpiece plastic deformation. In addition, Kaynak et al. [15] assessed the Inconel 718 alloy’s machining features with regard to T c t and tool wear during dry cutting and Cryo processes. In contrast to dry cutting, Cryo significantly reduced the T c t throughout the machining process, successfully minimizing the overheating of the cutting tool. LN2 with enhanced cooling capacity used in Cryo could effectively reduce tool wear. F c f and tool wear were studied by Kumar et al. [16] in the turning of stainless steel utilizing dry cutting and Cryo. In both dry cutting and Cryo, it was discovered that the F c f reduced as the v c increased. F c f increased as f and depth of cut ( a p ) increased. Cryo effectively reduced the cutting temperature, thereby reducing the flank wear by 37.39% compared with dry cutting.
In terms of tool wear and surface roughness, Rakesh et al. [17] evaluated the effects of dry cutting and Cryo on the machinability of Inconel 625 and discovered that using Cryo can reduce tool wear and surface roughness when compared to the dry cutting environment. In their study of the machinability of turning aluminum alloy in both dry cutting and Cryo environments, Gupta et al. [18] discovered that the latter resulted in less tool wear and 30.95% lower surface roughness than dry cutting. Daniel et al. [19] explored how dry cutting and Cryo affected the machinability of turning Inconel 718. With regard to extending tool life and lowering surface roughness, it has been demonstrated that Cryo has clear advantages over dry cutting.
On the basis of the adequate literature review and increasingly stringent requirements for sustainable manufacturing, the present investigation aspires to investigate the machinability features of the Inconel 718 alloy by utilizing the machining simulation in dry cutting and Cryo environments. Different friction coefficients, heat transfer coefficients, coolant characteristics, and machining parameters were specified in order to simulate the turning processes of the Inconel 718 alloy under several lubrication/cooling environments. This provides new research ideas and solutions for investigating the machining simulations under different lubrication/cooling strategies. Meanwhile, the present investigation also provides important simulation basis and simulation results, which make it easier to comprehend the machinability characteristics of the turning Inconel 718 alloy.
The following are the key differences and contributions between the work in this study and the published literature. First of all, the simulation model of the turning Inconel 718 is constructed in this study under various cooling and lubricating settings. The mathematical models of T c t and F c f in the cryogenic machining environment are then developed using the response surface method. These models are able to predict the T c t and F c f in the cryogenic machining environment for a variety of cutting parameter combinations. Additionally, it is discovered that cryogenic machining can lower the cutting temperature when compared to dry cutting, which benefits the machinability of hard-to-machine materials such as superalloy.

2. Simulation Modeling of the Machining Process

2.1. Material Constitutive Models for Machining Simulations

In this study, the finite element-based program AdvantEdge was used to simulate the machining process of the Inconel 718 alloy. On the one hand, in the machining processes simulation using AdvantEdge software the user-defined constitutive models are usually considered only when the existing material constitutive models are not suitable for the requirements of engineering projects [20]. On the other hand, the researchers used the default Power Law constitutive model in the AdvantEdge software to simulate the turning operation of Inconel 718, and achieved excellent outcomes [21,22]. Hence, the Power Law constitutive model [23] in the AdvantEdge software was adopted in the present investigation, as shown in Equation (1).
σ ( ε p ,   ε ˙ ,   T   ) = g ( ε p )   ×   Γ ( ε ˙ )   × Θ ( T )
where g ( ε p ) denotes the material’s strain hardening, Γ ( ε ˙ ) is the material’s sensitivity to strain rate, and Θ ( T ) is the material’s thermal softening.
Formulas (2) and (3) can be used to calculate the strain hardening of materials.
g ( ε p ) = σ 0 ( 1 + ε p ε 0 p ) 1 / n ,   ( ε p < ε cut p )
g ( ε p ) = σ 0 ( 1 + ε cut p ε 0 p ) 1 / n ,   ( ε p ε cut p )
where σ 0 represents the initial stress; ε p represents the plastic strain, ε 0 p is the reference plastic strain, and ε c u t p is the cutoff strain; and 1/n represents the exponent of strain hardening.
The sensitivity of strain rate Γ ( ε ˙ ) can be determined by the following Formulas (4) and (5).
Γ ( ε ˙ )   = ( 1 + ε ˙ ε ˙ 0 ) 1 m 1 , ( ε ˙ ε ˙ t )
Γ ( ε ˙ )   =   ( 1   +   ε ˙ ε ˙ 0 ) 1 m 2 ( 1   +   ε ˙ t ε ˙ 0 ) 1 m 1 1 m 2 , ( ε ˙ > ε ˙ t )
where ε ˙ 0 is reference plastic strain, ε ˙ is strain rate, and ε ˙ t is the strain rate at which the change from low to high strain rate sensitivity happens, while m 1 and m 2 are low and high coefficient of strain rate sensitivity.
The material’s thermal softening can be estimated by Formulas (6) and (7).
Θ ( T ) = C 0 + C 1 T 1 + C 2 T 2 + C 3 T 3 + C 4 T 4 + C 5 T 5 , ( T < T cut )
Θ ( T ) = Θ ( T cut ) ( 1 T T cut T melt T cut ) , ( T T cut )
where C 0 , C 1 , C 2 , C 3 , C 4 , and C 5 denote the polynomial fitting coefficients. T stands for the temperature, T cut for the linear cutoff temperature, and T melt for the melting temperature.

2.2. Workpiece, Cutting Tool, Boundary Conditions and Simulation Settings

The workpiece was made of Inconel 718 alloy. To minimize the boundary effect of the workpiece, the workpiece’s height ought to be at least five times the feed rate and the workpiece’s length should be three times the height of the workpiece [20]. As a result, the workpiece’s height and length are fixed at 2 and 6 mm, respectively (see Figure 1).
The material for the cutting tools was selected to be cemented carbide. The rake angle ( γ ), clearance angle ( α ), and cutting edge radius ( r n ) of the cutting tool are each set to 7°, 8°, and 0.03 mm, respectively.
The TiAlN coating was used, which is usually good for machining titanium alloys and superalloy. The cutting length can be greater or less than the length of the workpiece, but it should not be more than twice the length of the workpiece [20]. Therefore, the cutting length was set to 5 mm in the present investigation.
As per the AdvantEdge 7.1 User’s Manual, the adaptive meshing technique was used in this study. Under the majority of cutting circumstances, the mesh grading is set to 0.4, and the workpiece’s and cutting tool’s minimum and maximum element sizes are set to 0.018 and 0.09 mm. Under cutting conditions with feed rates of 0.1 and 0.15 mm/rev, the minimal element sizes of the cutting tool and workpiece are adjusted to 0.01 and 0.015 mm, respectively. The workpiece’s and cutting tool’s maximum element sizes are fixed at 0.05 and 0.075 mm, respectively. The factors of mesh refinement and coarsening are adjusted to 2 and 6, respectively, in accordance with the mesh parameter settings given by Mishra et al. [24]. The 40,000 maximum nodes are in good accord with the simulation parameters given by Laakso et al. [25].
Figure 1 presents the schematic representation of the machining simulation model composed of the cutting tool and the workpiece. The fact that the boundary conditions need to be set is noteworthy, which limits the workpiece’s range of motion in the Y direction and allows the workpiece to move from left to right in the X-direction.

2.3. Friction Model and Modeling of Lubrication/Cooling Effect

The friction coefficient (CoF) is an essential parameter, as it can be used to thoroughly understand the lubrication condition between two contact surfaces [26]. The Coulomb friction model is used in the AdvantEdge software, as demonstrated by Formula (8), below.
F μ   μ   F n
where   F μ   is the friction force and   F n denotes the normal force; μ reflects the friction coefficient.
It is worth emphasizing that most scholars only use the default friction coefficient in AdvantEdge software for machining simulation, but they ignore the important influence of the friction coefficient. The heat transfer coefficient determines the coolant’s ability to cool the cutting zone. Therefore, the effects of dry cutting and Cryo on the turning process of the Inconel 718 alloy by setting various friction coefficients, heat transfer coefficients and coolant characteristics were explored in the present research study.
For dry cutting, the friction coefficient ( μ ) is set to 0.708, 0.664 and 0.625 at lowest (70 m/min), medium (100 m/min), and highest v c (130 m/min), by considering the impact of v c on the friction coefficient and combining with research findings reported by Zhou et al. [27]. Due to convective heat transmission between the cutting tool, workpiece, and ambient air, the heat transfer coefficient (h) is adjusted to 20 W/(m2⋅K) for dry cutting circumstances [28]. Air has a density (ρ) of 1.205 kg/m3 [29]. According to the results of the study by Hong et al. published in [30], the friction coefficient for Cryo is set to 0.303, 0.265 and 0.232 at the lowest (70 m/min), medium (100 m/min), and highest v c (130 m/min).
As the coolant used in Cryo strategy is LN2, its heat transfer coefficient is 20,000 W/(m2⋅K) [31] and its density is 808 kg/m3 [32]. When dry cutting is taking place, the coolant’s starting temperature is set to 20 °C, while the Cryo is started at a temperature of −196 °C. Finally, Table 1 summarizes the friction coefficient, heat transfer coefficient and density of coolant under different machining conditions in the simulation process. To lower the T c t while using Cryo techniques, coolant is sprayed over the tool’s rake face.

2.4. Simulation Scheme

It is inevitable to determine the mechanical machining parameter and lubrication/cooling strategies during Inconel 718 alloy turning before designing the simulation scheme. The v c , f and a p ranges employed in this study were 70–130 m/min, 0.1–0.2 mm/rev, and 0.1–0.3 mm, according to the cutting parameters described by Grzesik et al. [33], Pusavec et al. [34], and Calleja et al. [35]. The lubrication/cooling strategies adopted in this work were cryogenic machining (Cryo) and dry cutting.
In the beginning, this research analyzes how well Cryo and dry cutting methods perform regarding T c t and F c f . The effects of machining parameters on T c t and F c f were then thoroughly examined using Cryo methods. Table 2 and Table 3 display the simulation scheme for turning Inconel 718.
RSM can be used to create predictive models and analyze the connection between input and output variables (response variables). Furthermore, it has the ability to save cost and time in the machining experiments by dropping the number of experiments required [36]. Actually, the traditional experimental method mostly uses a linear model. However, RSM can use the nonlinear model to statistically analyze the experimental data, thereby improving the modeling accuracy. Therefore, RSM is an effective method to solve practical engineering problems. RSM has been utilized successfully during the machining operation to predict tool wear and machined surface quality [37,38].
Using the assistance of Design Expert 10 software, RSM was employed to develop a mathematical model for T c t and F c f during turning Inconel 718 alloy. Using the second-order polynomial model [39], the prediction model between machinability features and cutting parameters is developed, as indicated in the Formula (9).
Y = b 0 + i = 1 k b i X i + i = 1 k b i i X i 2 + i < j k b i j X i X j
In this study, X i and X j represent the input parameters, namely v c , f and a p . Y represents the predicted response, namely T c t and F c f . b 0 is the constant coefficient, b i is the linear coefficient, b i i is the quadratic coefficient, b i j is the interaction coefficient, and k indicates the number of input variables.
One of the most successful and widely utilized RSM approaches is the Box–Behnken Design (BBD) [40]. The major advantage of the BBD [41] is its wide applicability, and since the BBD does not contain a combination of all factors at the higher or lower level, it is helpful for avoiding experiments in extreme circumstances.
The following formula determines the number of tests ( N ) necessary for BBD design [42].
N = 2 k ( k 1 ) + M
M is the amount of tests carried out at the center point, where k denotes the quantity of input parameters. In this article, the number of input variables is three and five tests are repeated at the center point, so the total number of tests is 17. The process parameters utilized in the BBD simulation plan are displayed in Table 4. Table 5 illustrates the BBD simulation plan.

2.5. Verification of Simulation Results

Due to the fact that T c t has a significant effect on tool life, tool wear, and the surface quality of fabricated parts [43], F c f [15] is a crucial and important measure of the power requirements and energy consumption in the manufacturing process. Hence, the machinability traits of the Inconel 718 alloy were evaluated regarding machining response. After the machining simulation is completed, the simulation results can be obtained by means of the post-processing program Tecplot 360 in AdvantEdge software. It is worth underlining that the steady-state values of all F c f (and peak tool temperature ( T t ) and cutting zone’s maximum temperature ( T c )) are used.
(1)
Verification of cutting temperature
To guarantee the accuracy of the simulation model created, the cutting zone’s experimental temperature described in [44] when turning Inconel 718 was compared with the simulated cutting temperature under the identical machining conditions. The machining parameter combinations used for the verification of the cutting temperature are displayed in Table 6. Figure 2 compares the temperatures in the cutting area during turning Inconel 718. The average difference in temperature between the experimental and simulation values for various machining parameter combinations is determined to be 9.71%, demonstrating the efficacy of the simulation model.
(2)
Verification of cutting force
When turning Inconel 718, the experimental cutting force ( F c f ) values given in [45] were contrasted with simulated values obtained under identical cutting conditions. Various combinations of machining parameters used for the machining experiment and machining simulation are summarized in Table 7. In turning Inconel 718, Figure 3 contrasts the actual cutting force with a simulated cutting force. Moreover, Figure 3 demonstrates that, for various combinations of machining settings, the simulated cutting force and the experimental cutting force exhibit good consistency. The average difference between the simulation and experimental value for the main cutting force ( F c ) is 13.73%, whereas the average deviation for the feed force ( F f ) is 14.63%. Therefore, this verifies the accuracy of the developed simulation model in turning Inconel 718.

3. Results and Discussion

3.1. Effects of Lubrication/Cooling Strategy and Machining Parameter on T c t

Figure 4 and Figure 5 show how the v c and lubrication/cooling strategy affect the T t and T c . It can be noted that the cutting zone’s maximum temperature typically occurs in the contact area between the workpiece material and the tool rake face. Moreover, it can be observed that the lubrication/cooling technique had a substantial impact on the T t and T c . The T t and T c obtained by Cryo were reduced by 9.36% and 11.68%, 8.81% and 11.42%, and 9.23%, and 11.98%, respectively. In the case of Cryo, LN2 has a higher convective heat transfer coefficient, stronger cooling capacity and lower friction coefficient [30,31]. Therefore, the lower T t and T c were obtained by employing Cryo techniques. As revealed in Figure 4 and Figure 5, the T t and T c rose as v c increased under dry cutting and Cryo strategies. When v c was raised by 130 m/min from 70 m/min, the T t and T c under the dry cutting and Cryo techniques increased by 9.02%, 6.66%, 9.18%, and 6.30%, respectively. Furthermore, the T c was higher than the T t . Faster cutting speeds result in a relatively high rate of strain in the shear zone, which generates more heat and elevates the temperature at the tool-chip contact (see Figure 5). Additionally, the heat dissipation time decreases with increasing cutting speeds, hence the cutting temperature increases [2].
Based on the above analysis, it is demonstrable that employing cryogenic machining lowers the T t and T c . This benefits improving the processability of Inconel 718, extending the life of the tool and improving the surface quality of the machined products. Hence, determining the variable law of cutting temperature and force with respect to processes parameters in Cryo settings is the subject of the current paper.
Figure 6 illustrates how feed rate affects the T t and T c when Cryo methods are used. Figure 7 shows how the feed rate influences the temperature field’s maximum temperature. The T c and T t both rose as the feed rate was raised, as demonstrated in Figure 6 and Figure 7. By increasing f from 0.1 to 0.2 mm/rev, the T t and T c increased by 9.04 percent and 4.50 percent, respectively. This is validated by the observation that at a fixed cutting speed, when the feed speed is increased, the material removal rate (MRR) also rises, raising the heat produced during the cutting operation [46].
Figure 8 shows how the a p affects T t and T c when using Cryo techniques. Varying the a p did not cause any changes in the T t and T c . Yang et al. [22] demonstrated that the a p had no notable effect on T c t   when turning Inconel 718 alloy. Despite the fact that the F c f rises as a p grows, the working length of the cutting edge participating in the cutting also increases, which leads to the improvement of the cooling conditions, and therefore the cutting temperature does not change obviously.

3.2. Cryogenic Machining Cutting Temperature Modeling and Response Surface Analysis

To assess the applicability of models, influential variables, and factor interactions, the analysis of variance (ANOVA) is frequently used. For the mean time, ANOVA can be employed to test the predictive model’s validity [47]. Applying Design Expert 10 software, an ANOVA of cutting temperature was performed according to the simulation findings of the T t and T c . The ANOVA findings for the T t and T c are shown in Table 8 and Table 9. It is typically assumed that the model, influential variables, and their interactions are often considered significant when the p-value for the 95 percent confidence interval is less than 0.05 [33]. The influence on the response parameter increases with decreasing p-value.
According to the aforementioned criteria, the models’ p-values are almost certainly less than 0.05 when viewed in light of the ANOVA results for the T t and T c , indicating that the models are desirable given their statistical significance. The ANOVA results of T t show that v c , f , v c 2 and f 2 are the key terms, demonstrating that they significantly affect the response parameters. The T t is not considerably affected by a p , v c × a p , f × a p , a p 2 , v c × f . The T c was studied using an ANOVA, and the important terms are shown to be v c , v c 2 , f , v c × f , a p 2 and f 2 . In contrast, a p , v c × a p , and f × a p have little effect on T c . It can be shown from comparing the value of the mean square for the several contributing elements that the extent of influence for the cutting parameters on the T c can be listed as follows in ascending order: a p , f , v c . In addition, it is evident from the summary of the findings of the aforementioned variance analysis that the cutting depth has no impact on the T t and T c .
The models for the T c and T t , respectively, have R2 values of 0.9920 and 0.9986, demonstrating great fitting precision and the ability to accurately forecast the response parameters. The “Adeq Precision” determines the signal-to-noise ratio (SN ratio). In reality, if the model’s SN ratio exceeds four, it may indicate that it has adequate judgment [36]. The models of the T c and T t have SN ratios of 36.545 and 92.244. Accordingly, these values are larger than four, confirming that these models are desirable.
Equations (11) and (12), respectively, illustrate the prediction models for the T t and T c under Cryo methods. Under different combinations of v c , a p , and f , these models are able to forecast the cutting temperature.
T t = 429.78 + 2.95 × ν c + 1515 × f 90 × a p ν c × f 8.06 × 10 3 × ν c 2 2300 × f 2 + 225 × a p 2
T c = 544.81 + 0.026 × ν c + 2849.17 × f 215 × a p 3.17 × ν c × f + 6.81 × 10 3 × ν c 2 6750 × f 2 + 537.5 × a p 2
The 3D response surface and contour plots for the T t and T c for various combinations of machining settings are shown in Figure 9 and Figure 10. It should be observed that increasing the v c and f led to a marked rise in the T c and T t . This is in line with the cutting temperature variation trend that Mia et al. [48] described in relation to v c and f . By using a lower v c and f , it is possible to achieve the lower cutting temperature. However, the T c and T t are largely independent of the a p . The ANOVA findings further confirmed that the T c and T t are not significantly affected by the a p . The results are in conformity with Figure 4, Figure 5, Figure 6, Figure 7 and Figure 8’s analysis findings.

3.3. Effects of Machining Parameter and Lubrication/Cooling Method on Cutting Force

Figure 11 describes the linear graphical analysis of cutting forces in the lubrication/cooling strategy. It is observed that, at fixed the v c , although the F c and F f obtained under Cryo strategies were slightly higher than dry cutting conditions, the differences in the cutting force values were negligible. According to Hong et al. [30], the cutting forces attained using Cryo methods were marginally greater than under dry cutting circumstances. This is because employing Cryo techniques drastically reduced the cutting temperature, which maintains the high strength and hardness of workpiece material at a lower temperature. Lower F f was found as compared to F c under all lubrication/cooling strategies and cutting speeds. This agrees with the results mentioned by Lalwani et al. [49].
Both responses decreased as the cutting speed increased under all lubrication/cooling strategies. This is in line with the force-speed variation trend discovered by Dhananchezian et al. [50]. The reason behind this is that when v c rises, cutting temperature rises as well (see Figure 4 and Figure 5). The drop in F c f was brought about by the material’s thermal softening produced by the increase in T c t , which also decreased the material’s strength [51].
The influences of f and a p on F c and F f are presented in Figure 12 and Figure 13, respectively. Both components of force rose due to an increase in f . As the f increases, more workpiece materials come into contact with the cutting edge, lengthening the tool-chip contact and, as a result, the cutting force. In addition to increasing the contact length, the ability to resist deformation increases as more workpiece materials come into contact with cutting tool, which also helps increase the cutting force [52].
With the rise in a p , both components of force show an increasing tendency. Both forces increased by nearly three times as the a p increased from 0.1 to 0.3 mm. This results from the fact that, at fixed v c and f , as the a p increases, both MRR and plastic strain rate also rise, leading to an increase in force [16]. Mkaddem et al. [53] have identified that, at given v c and f , the MRR increased as the a p increased, thereby increasing the cutting force required for chip separation.

3.4. Cryogenic Machining Cutting Force Modeling and Reaction Surface Analysis

Table 10 and Table 11 demonstrate, respectively, the F c and F f ’s ANOVA-related results. The F c and F f models have p-values that are both lower than 0.05, as shown in Table 10 and Table 11, indicating that the abovementioned models are acceptable. It is evident that v c , a p , f , f 2 , and f × a p are the important terms according to the ANOVA findings for F c . However, v c 2 , v c × f , a p 2 , and v c × a p do not obviously affect F c . In light of the ANOVA findings for F f , it is possible to state that the significant terms are v c , v c × f , a p , f × a p ,   f , v c × a p . Conversely, a p 2 , f 2 , and v c 2 have no discernible effect on F f . The following is a list of process parameter effects on the F c f , ranked descendingly: a p ,   f , v c . Comparing the mean square values for several significant factors will reveal this. The R2 values for both models’ components of force are 0.9997 and 0.9992, respectively, suggesting that these models are desirable. Furthermore, the SN ratios of the F c and F f model are greater than four, indicating that these models are reliable.
Both components of force in cryogenic machining under various machining parameters can be predicted by using Equations (13) and (14), respectively.
F c = 30.36 2.78 × 10 3 × ν c + 410.83 × f + 135.42 × a p 0.33 × ν c × f 0.17 × ν c × a p + 3250 × f × a p + 1.39 × 10 4 × ν c 2 1250 × f 2 62.5 × a p 2
F f = 23.85 + 0.23 × ν c + 130.83 × f + 215.42 × a p 0.83 × ν c × f 0.42 × ν c × a p + 500 × f × a p 5.56 × 10 4 × ν c 2 100 × f 2 75 × a p 2
The 3D response surface and contour plot of both force components under several machining parameter combinations are shown in Figure 14 and Figure 15. It was discovered that as f and a p rose, F c and F f both dramatically increased. Nevertheless, when v c increased, both components of force showed a declining tendency. According to the aforementioned analysis, adopting a lower f and a p will result in a lower cutting force. It deserves to be noted that the aforementioned findings align with those of Figure 11, Figure 12 and Figure 13.

4. Conclusions

The current research has established the machining simulation models for dry cutting and Cryo methods. From the perspectives of cutting temperature ( T c t ) and cutting force ( F c f ), the workpiece’s machining characteristics have been examined. The workpiece’s machining characteristics were contrasted under varying machining parameters and lubrication/cooling strategies when turning Inconel 718 alloy. The following succinct statements sum up the primary findings of this investigation.
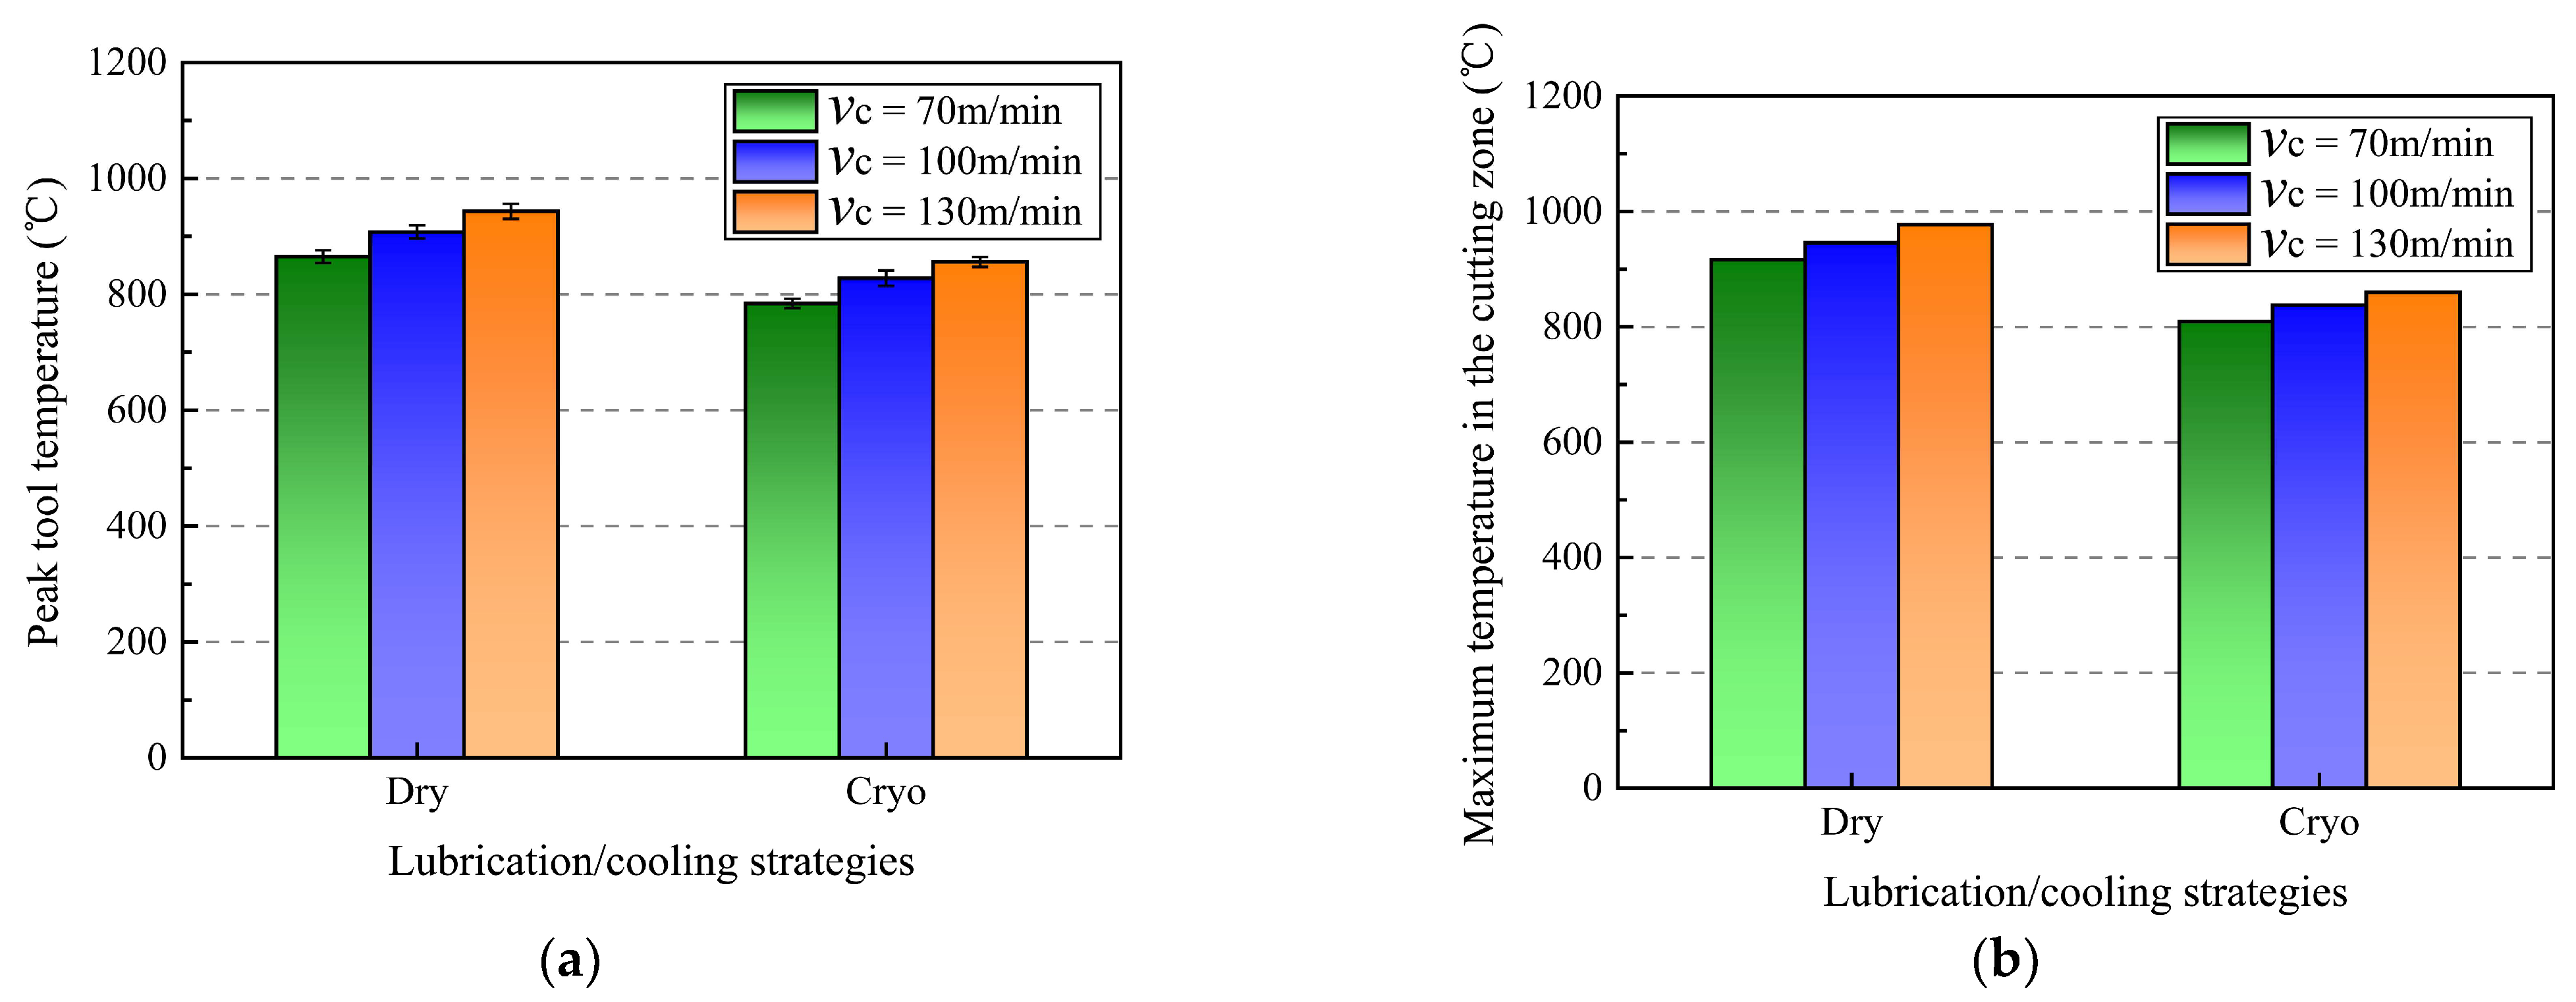
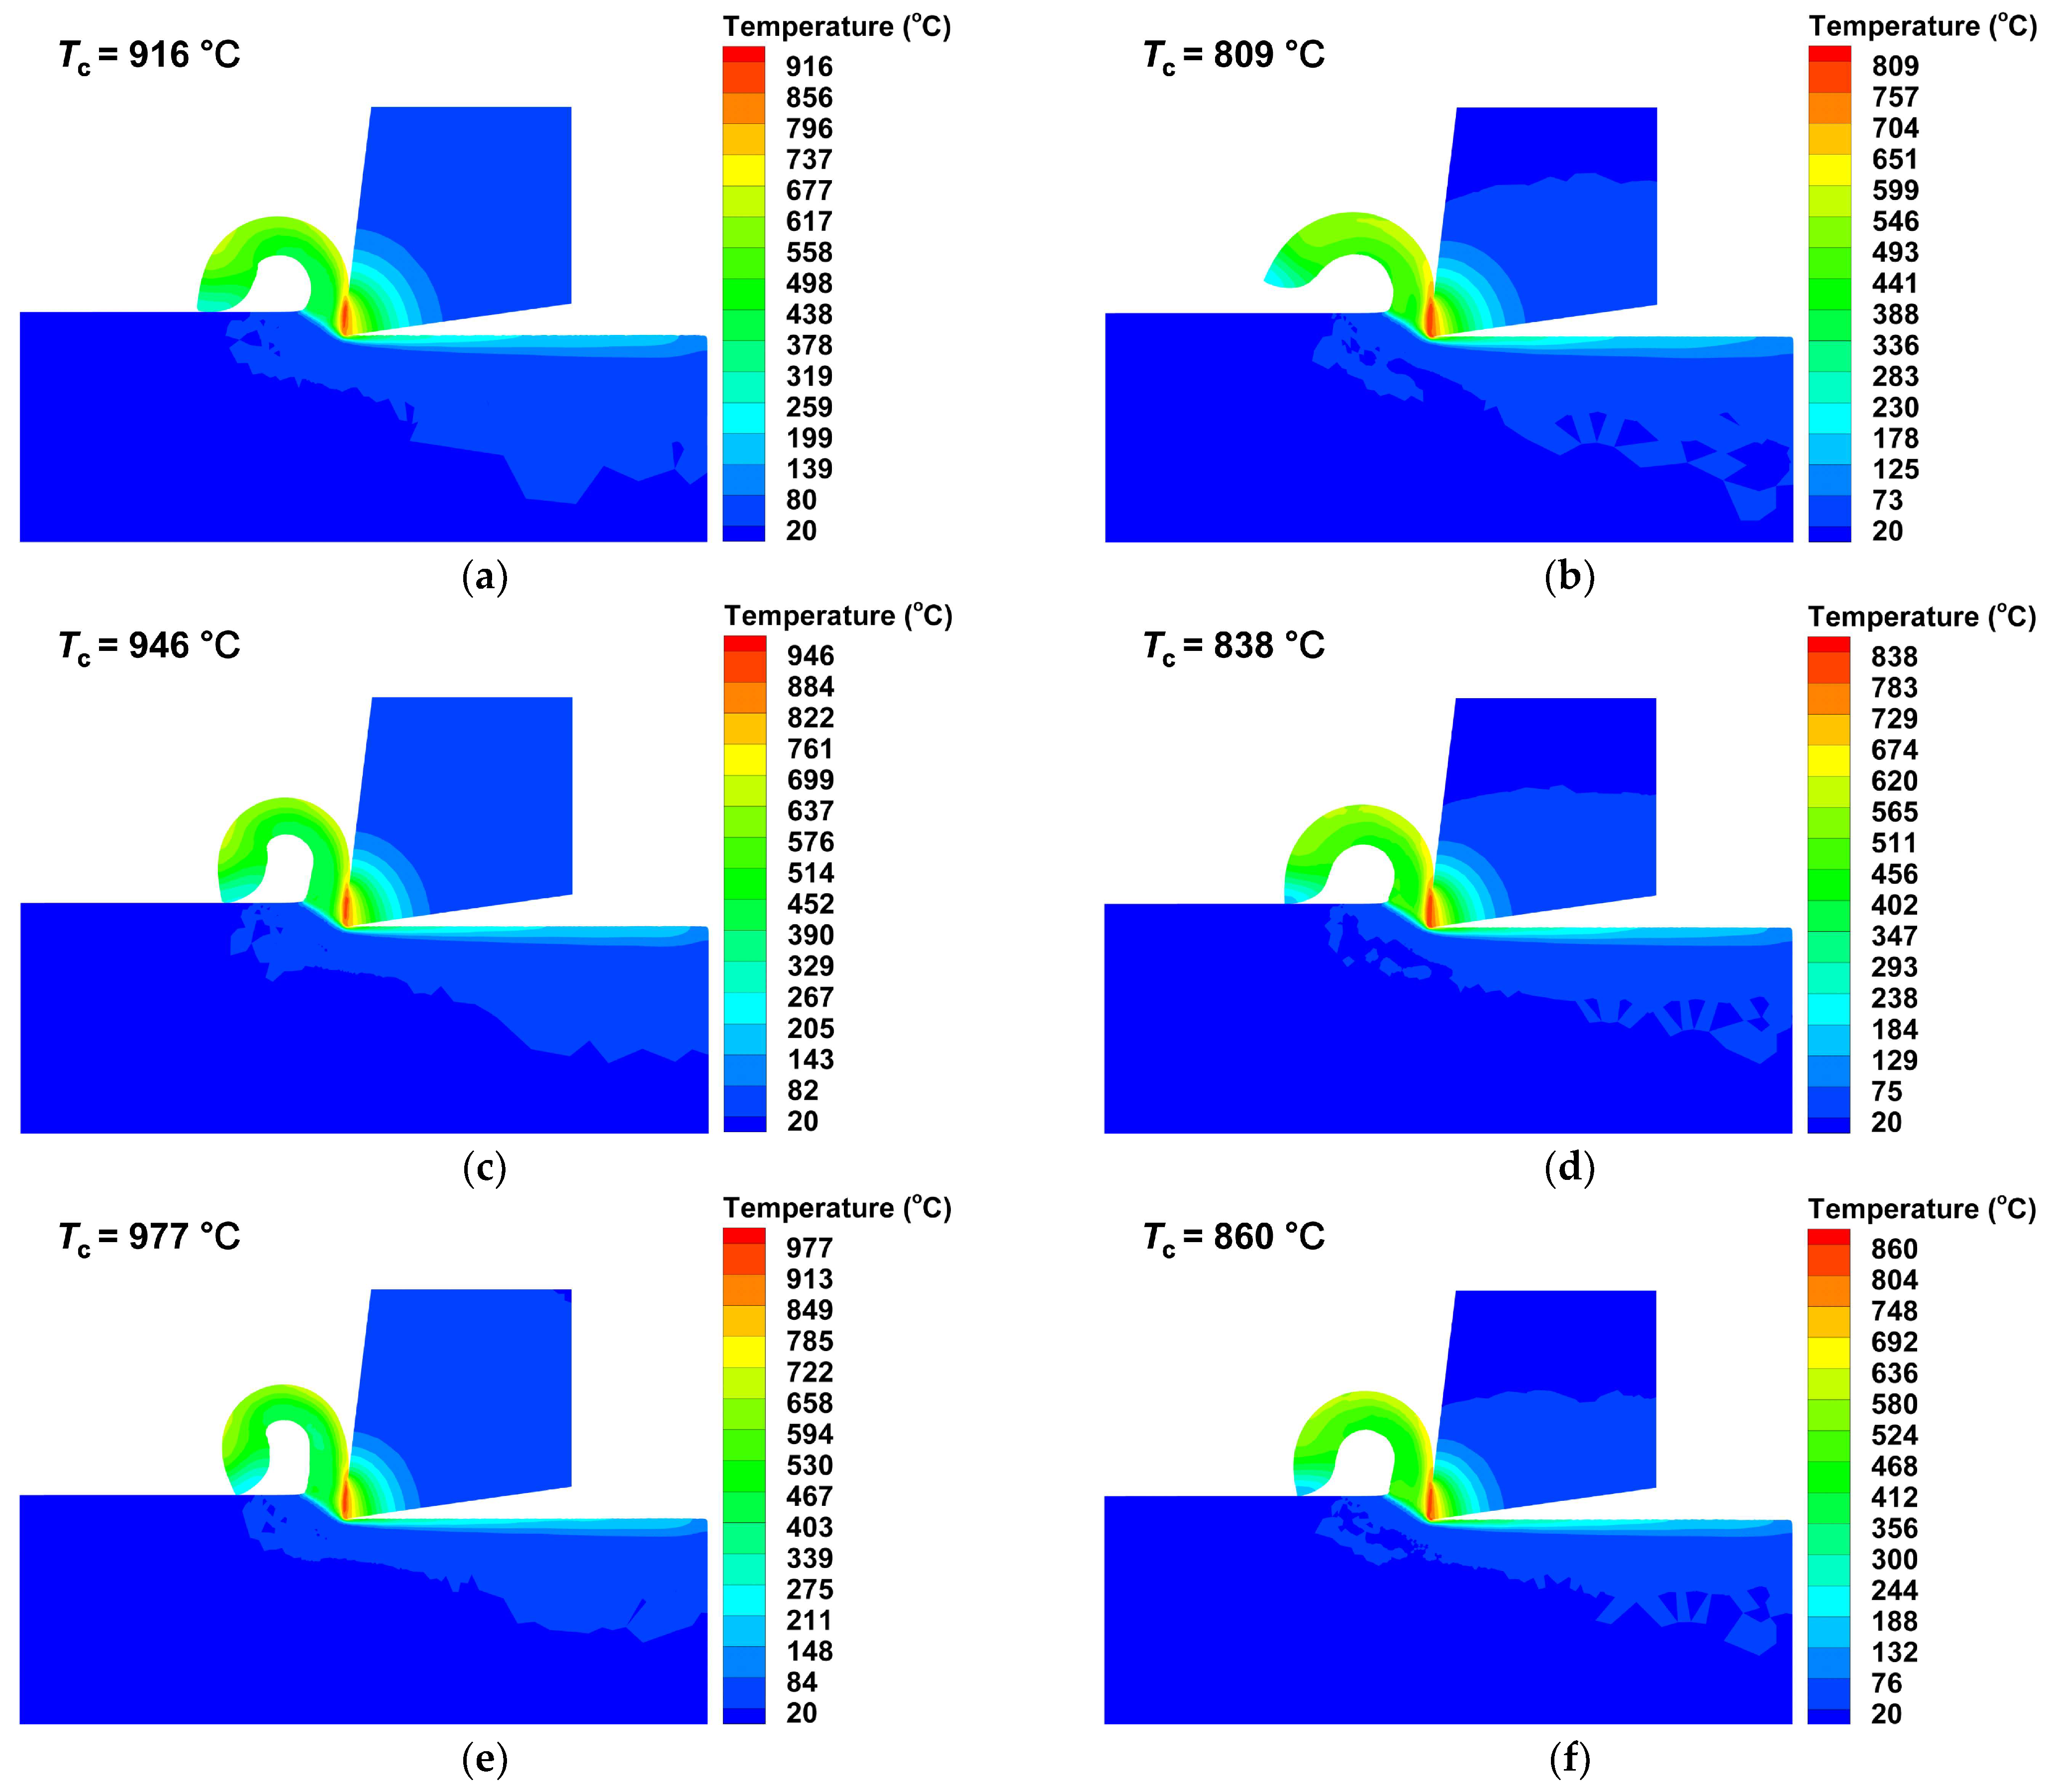
(1) When compared to dry cutting settings, the Cryo strategy reduced T c t , which improved machining performance. When the cutting speeds were lowest (70 m/min), medium (100 m/min) and highest (130 m/min), in contrast to conditions for dry cutting, the percentage reductions of the T t and T c under Cryo strategies were 9.36% and 11.68%, 8.81% and 11.42%, and 9.23% and 11.98%, respectively. This is because the Cryo approach, which uses LN2 as a coolant, has a superior cooling capability.
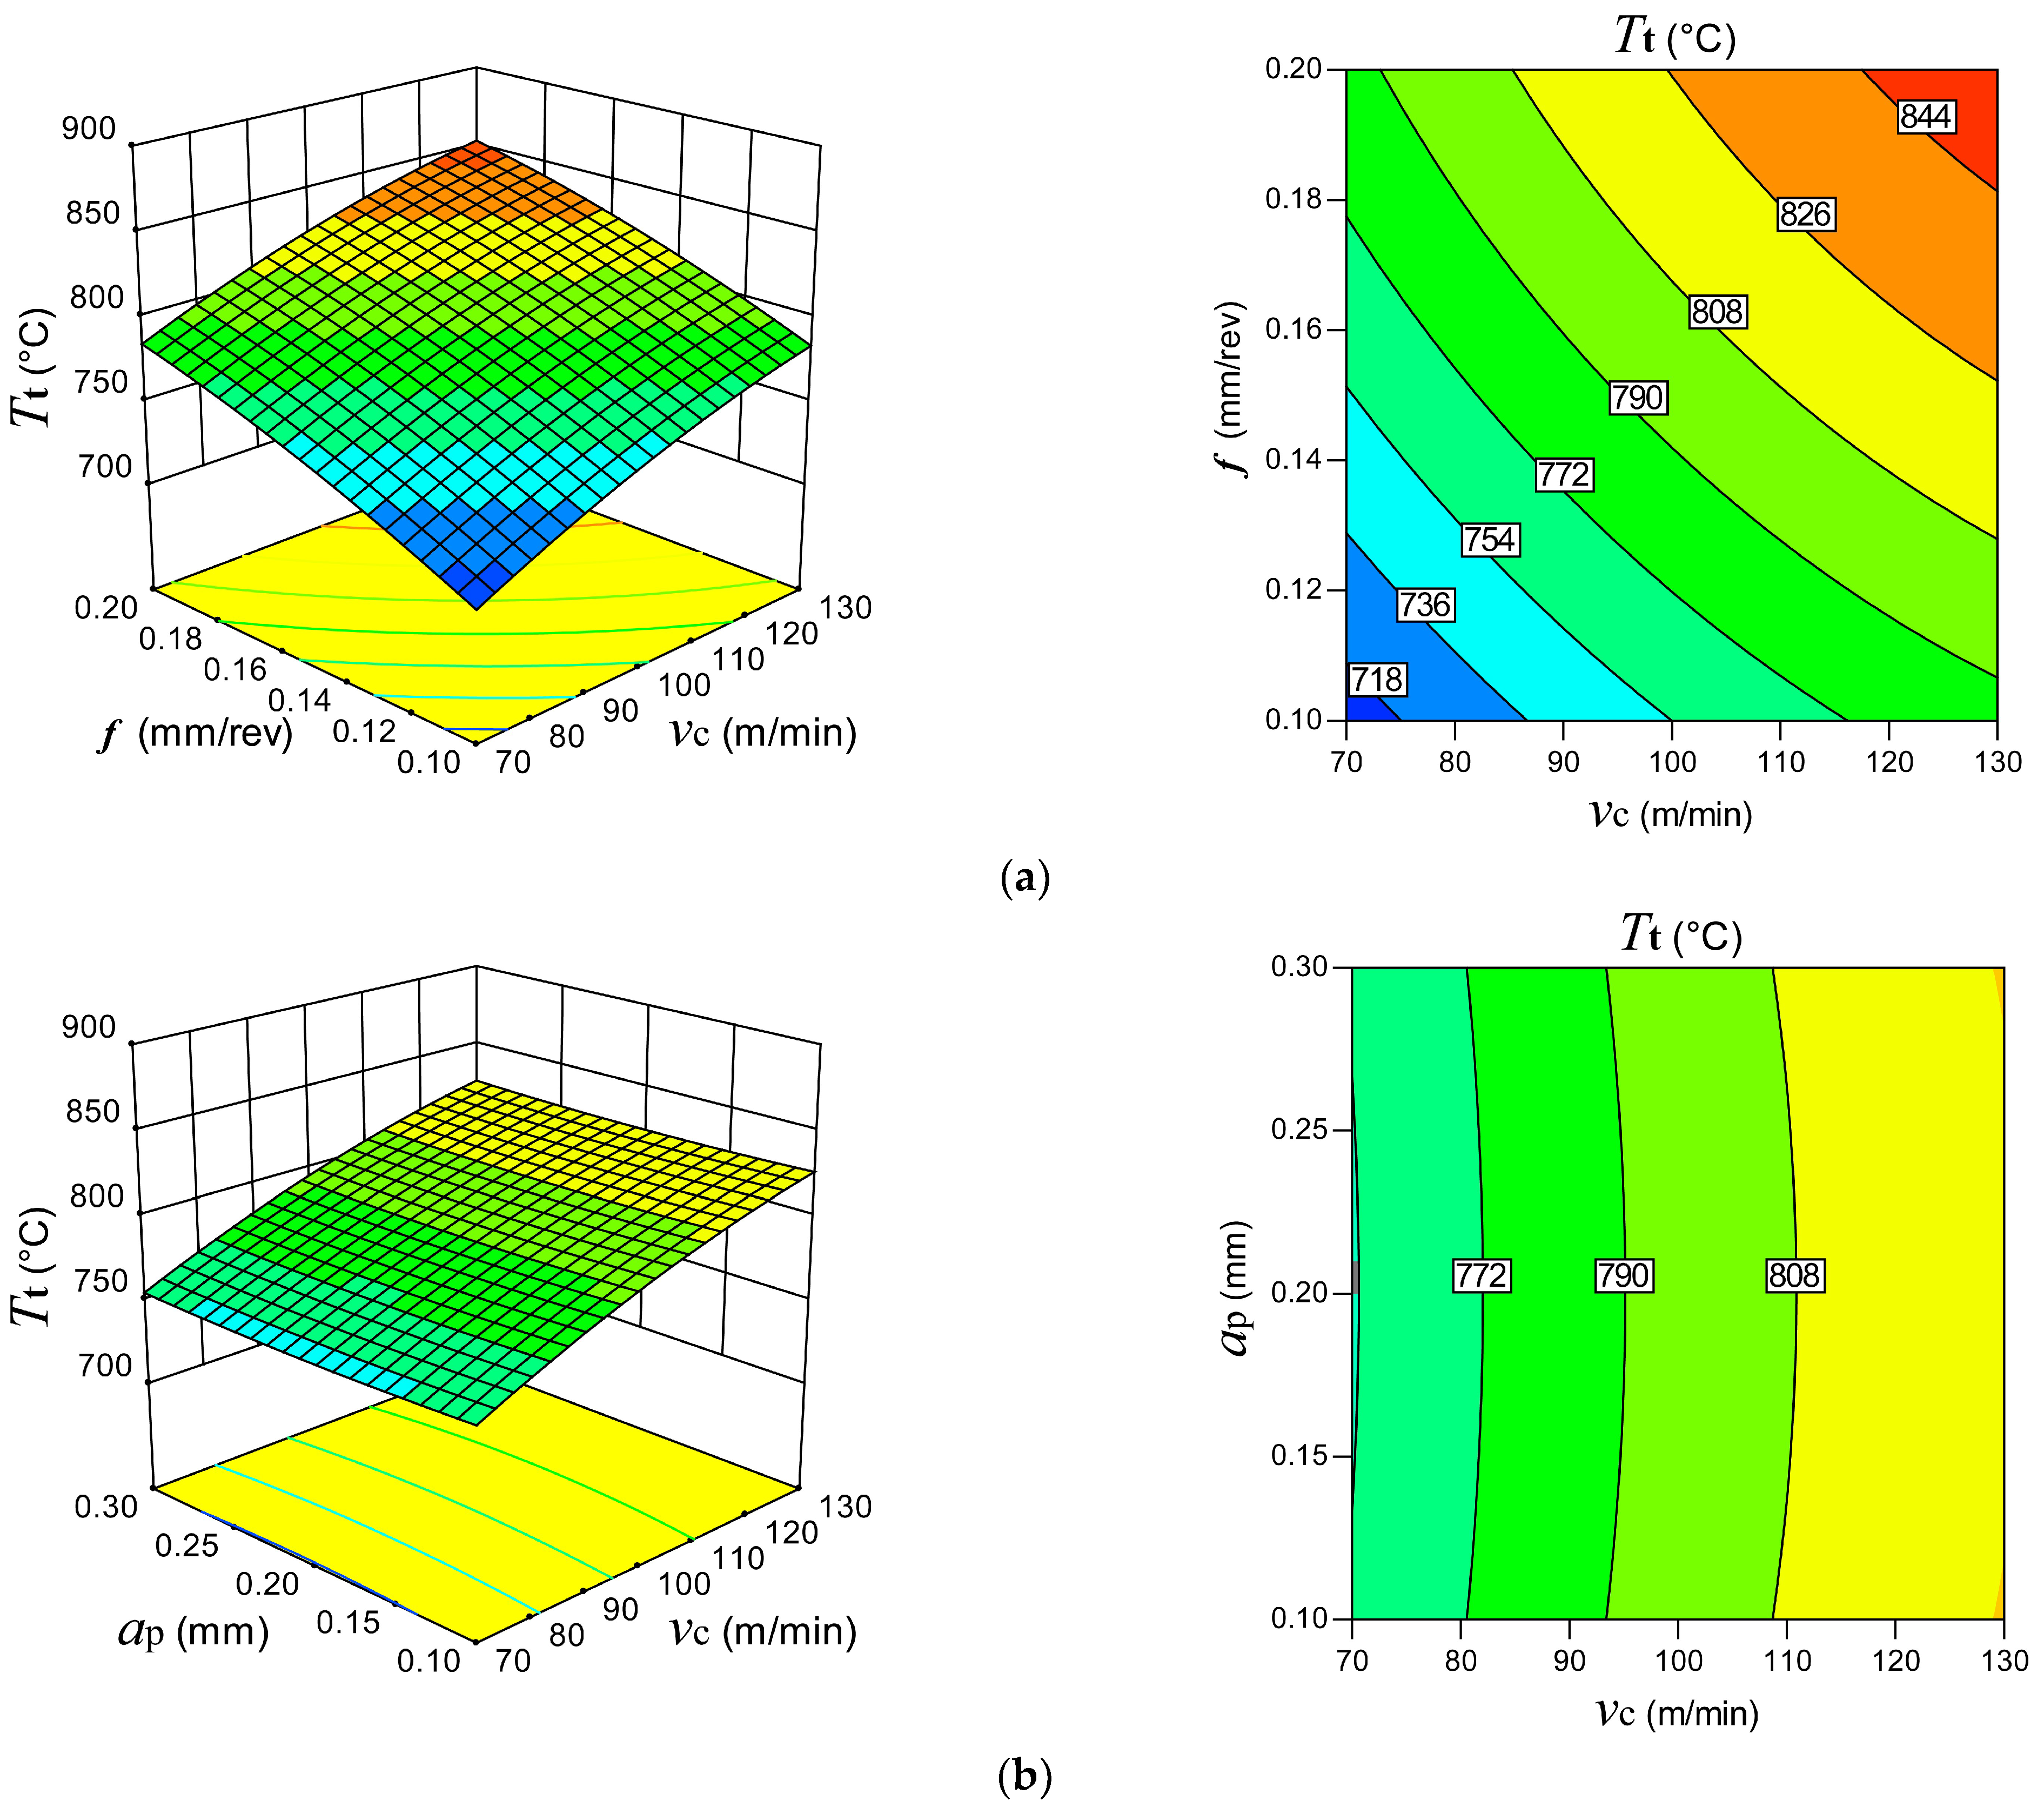
(2) Both v c and f were shown to have a considerable impact on T c t , according to the ANOVA findings. Additionally, T c t increased alongside v c and f . The reason for this is that as v c increases the shear zone’s strain rate likewise rises, which causes the cutting zone to generate more cutting heat. Meanwhile, as v c increases, less time is available for the heat to dissipate, which leads to the cutting heat building up. Correspondingly, a higher f results in a higher MRR, which raises the heat generated by the cutting operation.
(3) Cryo methods produced slightly higher cutting force than dry cutting strategies; however, there were negligible variations in both F c and F f . This is due to the Cryo strategy’s ability to significantly lower the T c t while preserving the workpiece material’s high strength and hardness at lower temperatures.
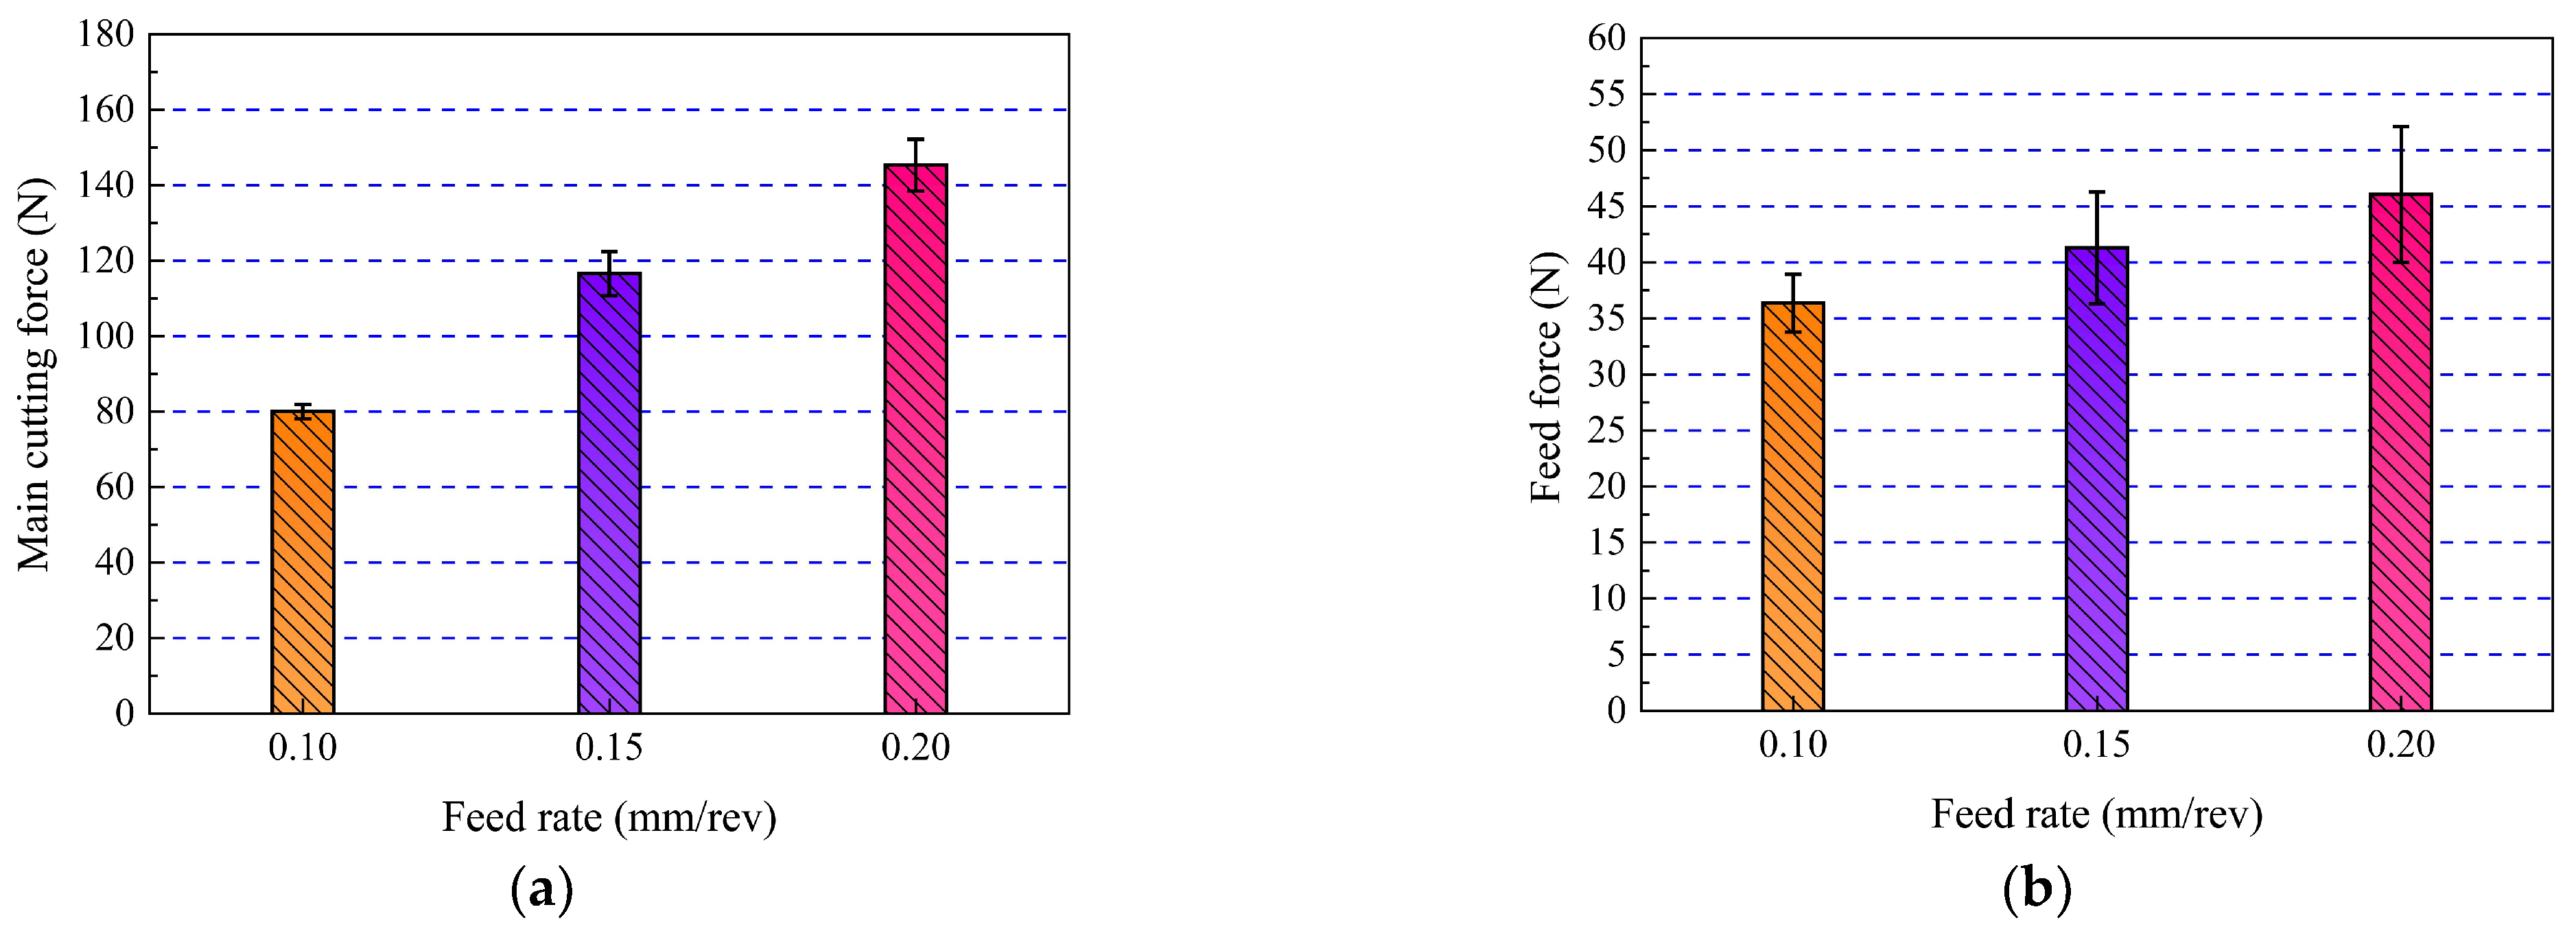
(4) F c f was influenced by both f and a p . The heat-induced material softening at higher cutting temperatures caused the F c f to decrease as v c rose. With an increase in f and a p , the F c f increased noticeably, which may have been caused by an increase in the tool-chip contact length and MRR.
(5) Through the use of RSM, the mathematical models of T c t and F c f in cryogenic environment were developed. These models were able to accurately forecast T c t and F c f under a variety of processes parameters.

Author Contributions

Investigation, methodology, software, writing—original draft, funding acquisition, L.G.; methodology, investigation, writing—review and editing, Y.S.; conceptualization, formal analysis, investigation, Y.L.; supervision, resources, investigation, W.Z.; formal analysis, investigation, writing—review and editing, A.M.K.; formal analysis, writing—review and editing, M.J. All authors have read and agreed to the published version of the manuscript.

Funding

This study was supported by the research start-up funding for high-level talent of Jiangsu University of Science and Technology (Grant No. 1022932208), China Scholarship Council (Grant No. 201906830023), and Nanjing University of Aeronautics and Astronautics PhD short-term visiting scholar project (Grant No. 190114DF05).

Data Availability Statement

Not applicable.

Conflicts of Interest

The authors declared no conflict of interest.

References

  1. Ghorbanpour, S.; Zecevic, M.; Kumar, A.; Jahedi, M.; Bicknell, J.; Jorgensen, L.; Beyerlein, I.J.; Knezevic, M. A crystal plasticity model incorporating the effects of precipitates in superalloys: Application to tensile, compressive, and cyclic deformation of Inconel 718. Int. J. Plast. 2017, 99, 162–185. [Google Scholar] [CrossRef]
  2. Thakur, D.G.; Ramamoorthy, B.; Vijayaraghavan, L. Study on the machinability characteristics of superalloy Inconel 718 during high speed turning. Mater. Des. 2009, 30, 1718–1725. [Google Scholar] [CrossRef]
  3. Krajnik, P.; Rashid, A.; Pušavec, F.; Remškar, M.; Yui, A.; Nikkam, N.; Toprak, M.S. Transitioning to sustainable production–part III: Developments and possibilities for integration of nanotechnology into material processing technologies. J. Clean. Prod. 2016, 112, 1156–1164. [Google Scholar] [CrossRef]
  4. Chetan; Ghosh, S.; Rao, P.V. Comparison between sustainable cryogenic techniques and nano-MQL cooling mode in turning of nickel-based alloy. J. Clean. Prod. 2019, 231, 1036–1049. [Google Scholar] [CrossRef]
  5. Thakur, D.G.; Ramamoorthy, B.; Vijayaraghavan, L. Some investigations on high speed dry machining of aerospace material Inconel 718 using multicoated carbide inserts. Mater. Manuf. Process. 2012, 27, 1066–1072. [Google Scholar] [CrossRef]
  6. Zhao, J.; Liu, Z. Influences of coating thickness on cutting temperature for dry hard turning Inconel 718 with PVD TiAlN coated carbide tools in initial tool wear stage. J. Manuf. Process. 2020, 56, 1155–1165. [Google Scholar] [CrossRef]
  7. Devillez, A.; Le Coz, G.; Dominiak, S.; Dudzinski, D. Dry machining of Inconel 718, workpiece surface integrity. J. Mater. Process. Technol. 2011, 211, 1590–1598. [Google Scholar] [CrossRef]
  8. Umbrello, D.; Micari, F.; Jawahir, I.S. The effects of cryogenic cooling on surface integrity in hard machining: A comparison with dry machining. CIRP Ann.-Manuf. Technol. 2012, 61, 103–106. [Google Scholar] [CrossRef]
  9. Hong, S.Y. Economical and ecological cryogenic machining. J. Manuf. Sci. Eng. 2001, 123, 331–338. [Google Scholar] [CrossRef]
  10. Pusavec, F.; Hamdi, H.; Kopac, J.; Jawahir, I.S. Surface integrity in cryogenic machining of nickel based alloy–Inconel 718. J. Mater. Process. Technol. 2011, 211, 773–783. [Google Scholar] [CrossRef]
  11. Trabelsi, S.; Morel, A.; Germain, G.; Bouaziz, Z. Tool wear and cutting forces under cryogenic machining of titanium alloy (Ti17). Int. J. Adv. Manuf. Technol. 2017, 91, 1493–1505. [Google Scholar] [CrossRef] [Green Version]
  12. Sivaiah, P.; Chakradhar, D. Performance improvement of cryogenic turning process during machining of 17-4 PH stainless steel using multi objective optimization techniques. Measurement 2019, 136, 326–336. [Google Scholar] [CrossRef]
  13. He, Z.H.; Zhang, X.M.; Ding, H. Comparison of residual stresses in cryogenic and dry machining of Inconel 718. Procedia CIRP 2016, 46, 19–22. [Google Scholar] [CrossRef] [Green Version]
  14. Kaynak, Y.; Gharibi, A. Cryogenic machining of titanium Ti-5553 alloy. J. Manuf. Sci. Eng. 2019, 141, 041012. [Google Scholar] [CrossRef]
  15. Kaynak, Y. Evaluation of machining performance in cryogenic machining of Inconel 718 and comparison with dry and MQL machining. Int. J. Adv. Manuf. Technol. 2014, 72, 919–933. [Google Scholar] [CrossRef]
  16. Kumar, K.K.; Choudhury, S.K. Investigation of tool wear and cutting force in cryogenic machining using design of experiments. J. Mater. Process. Technol. 2008, 203, 95–101. [Google Scholar] [CrossRef]
  17. Rakesh, P.R.; Chakradhar, D. Machining performance comparison of Inconel 625 superalloy under sustainable machining environments. J. Manuf. Process. 2023, 85, 742–755. [Google Scholar] [CrossRef]
  18. Gupta, M.K.; Niesłony, P.; Sarikaya, M.; Korkmaz, M.E.; Kuntoğlu, M.; Królczyk, G.M. Studies on Geometrical Features of Tool Wear and Other Important Machining Characteristics in Sustainable Turning of Aluminium Alloys. Int. J. Precis. Eng. Manuf.-Green Technol. 2023, 1–15. [Google Scholar] [CrossRef]
  19. Danish, M.; Gupta, M.K.; Rubaiee, S.; Ahmed, A.; Sarıkaya, M.; Krolczyk, G.M. Environmental, technological and economical aspects of cryogenic assisted hard machining operation of inconel 718: A step towards green manufacturing. J. Clean. Prod. 2022, 337, 130483. [Google Scholar] [CrossRef]
  20. AdvantEdge 7.1 User’s Manual; Third Wave Systems, Inc.: Eden Prairie, MN, USA, 2015.
  21. Dong, P.; Peng, H.; Cheng, X.; Xing, Y.; Tang, W.; Zhou, X. Semi-empirical prediction of residual stress profiles in machining IN718 alloy using bimodal Gaussian curve. Materials 2019, 12, 3864. [Google Scholar] [CrossRef] [Green Version]
  22. Yang, Z.C.; Zhang, D.H.; Huang, X.C.; Yao, C.F.; Liang, Y.S.; Mao, Y. The simulation of cutting force and temperature field in turning of Inconel 718. Key Eng. Mater. 2011, 458, 149–154. [Google Scholar] [CrossRef]
  23. Jiang, X.; Li, B.; Yang, J.; Zuo, X.; Li, K. An approach for analyzing and controlling residual stress generation during high-speed circular milling. Int. J. Adv. Manuf. Technol. 2013, 66, 1439–1448. [Google Scholar] [CrossRef]
  24. Mishra, S.K.; Ghosh, S.; Aravindan, S. Performance of laser processed carbide tools for machining of Ti6Al4V alloys: A combined study on experimental and finite element analysis. Precis. Eng. 2019, 56, 370–385. [Google Scholar] [CrossRef]
  25. Laakso, S.V.A.; Niemi, E. Using FEM simulations of cutting for evaluating the performance of different johnson cook parameter sets acquired with inverse methods. Robot. Comput. Integr. Manuf. 2017, 47, 95–101. [Google Scholar] [CrossRef]
  26. Banerjee, N.; Sharma, A. Identification of a friction model for minimum quantity lubrication machining. J. Clean. Prod. 2014, 83, 437–443. [Google Scholar] [CrossRef]
  27. Zhou, F. A new analytical tool-chip friction model in dry cutting. Int. J. Adv. Manuf. Technol. 2014, 70, 309–319. [Google Scholar] [CrossRef]
  28. Imbrogno, S.; Sartori, S.; Bordin, A.; Bruschi, S.; Umbrello, D. Machining simulation of Ti6Al4V under dry and cryogenic conditions. Procedia CIRP 2017, 58, 475–480. [Google Scholar] [CrossRef]
  29. Pan, H.; Li, H.; Zhang, T.; Laghari, A.A.; Zhang, Z.; Yuan, Y.; Qian, B. A portable renewable wind energy harvesting system integrated S-rotor and H-rotor for self-powered applications in high-speed railway tunnels. Energy Convers. Manag. 2019, 196, 56–68. [Google Scholar] [CrossRef]
  30. Hong, S.Y.; Ding, Y.; Jeong, W.C. Friction and cutting forces in cryogenic machining of Ti–6Al–4V. Int. J. Mach. Tool. Manuf. 2001, 41, 2271–2285. [Google Scholar] [CrossRef]
  31. Rotella, G.; Umbrello, D. Finite element modeling of microstructural changes in dry and cryogenic cutting of Ti6Al4V alloy. CIRP Ann.-Manuf. Technol. 2014, 63, 69–72. [Google Scholar] [CrossRef]
  32. Mishra, S.K.; Ghosh, S.; Aravindan, S. FEM based evaluation of Ti6Al4V cutting with plain and textured WC/Co tools under cryogenic cooling environment. Procedia Manuf. 2019, 40, 8–13. [Google Scholar] [CrossRef]
  33. Grzesik, W.; Niesłony, P.; Habrat, W.; Sieniawski, J.; Laskowski, P. Investigation of tool wear in the turning of Inconel 718 superalloy in terms of process performance and productivity enhancement. Tribol. Int. 2018, 118, 337–346. [Google Scholar] [CrossRef]
  34. Pusavec, F.; Deshpande, A.; Yang, S.; M’Saoubi, R.; Kopac, J.; Dillon, O.W., Jr.; Jawahir, I.S. Sustainable machining of high temperature Nickel alloy–Inconel 718: Part 1–predictive performance models. J. Clean. Prod. 2014, 81, 255–269. [Google Scholar] [CrossRef]
  35. Calleja, A.; Urbikain, G.; González, H.; Cerrillo, I.; Polvorosa, R.; Lamikiz, A. Inconel® 718 superalloy machinability evaluation after laser cladding additive manufacturing process. Int. J. Adv. Manuf. Technol. 2018, 97, 2873–2885. [Google Scholar] [CrossRef]
  36. Noordin, M.Y.; Venkatesh, V.C.; Sharif, S.; Elting, S.; Abdullah, A. Application of response surface methodology in describing the performance of coated carbide tools when turning AISI 1045 steel. J. Mater. Process. Technol. 2004, 145, 46–58. [Google Scholar] [CrossRef] [Green Version]
  37. Jumare, A.I.; Abou-El-Hossein, K.; Abdulkadir, L.N.; Liman, M.M. Predictive modeling and multiobjective optimization of diamond turning process of single-crystal silicon using RSM and desirability function approach. Int. J. Adv. Manuf. Technol. 2019, 103, 4205–4220. [Google Scholar] [CrossRef]
  38. Saini, S.; Ahuja, I.S.; Sharma, V.S. Influence of cutting parameters on tool wear and surface roughness in hard turning of AISI H11 tool steel using ceramic tools. Int. J. Precis. Eng. Manuf. 2012, 13, 1295–1302. [Google Scholar] [CrossRef]
  39. Hessainia, Z.; Belbah, A.; Yallese, M.A.; Mabrouki, T.; Rigal, J.F. On the prediction of surface roughness in the hard turning based on cutting parameters and tool vibrations. Measurement 2013, 46, 1671–1681. [Google Scholar] [CrossRef]
  40. Ferreira, S.L.C.; Bruns, R.E.; Ferreira, H.S.; Matos, G.D.; David, J.M.; Brandão, G.C.; Da Silva, E.G.P.; Portugal, L.A.; Dos Reis, P.S.; Souza, A.S.; et al. Box-Behnken design: An alternative for the optimization of analytical methods. Anal. Chim. Acta 2007, 597, 179–186. [Google Scholar] [CrossRef]
  41. Garcia, R.F.; Feix, E.C.; Mendel, H.T.; Gonzalez, A.R.; Souza, A.J. Optimization of cutting parameters for finish turning of 6082-T6 aluminum alloy under dry and RQL conditions. J. Braz. Soc. Mech. Sci. Eng. 2019, 41, 317. [Google Scholar] [CrossRef]
  42. Bezerra, M.A.; Santelli, R.E.; Oliveira, E.P.; Villar, L.S.; Escaleira, L.A. Response surface methodology (RSM) as a tool for optimization in analytical chemistry. Talanta 2008, 76, 965–977. [Google Scholar] [CrossRef]
  43. Abukhshim, N.A.; Mativenga, P.T.; Sheikh, M.A. Heat generation and temperature prediction in metal cutting: A review and implications for high speed machining. Int. J. Mach. Tools Manuf. 2006, 46, 782–800. [Google Scholar] [CrossRef]
  44. Hao, Z.P.; Lu, Y.; Gao, D.; Fan, Y.H.; Chang, Y.L. Cutting parameter optimization based on optimal cutting temperature in machining Inconel 718. Mater. Manuf. Process. 2012, 27, 1084–1089. [Google Scholar] [CrossRef]
  45. Ji, D.S.; Huang, X.H. Experimental study on cutting force in high-speed turning of Inconel 718. Tool Eng. 2012, 46, 23–25. [Google Scholar]
  46. Rashid, R.A.R.; Sun, S.; Wang, G.; Dargusch, M.S. An investigation of cutting forces and cutting temperatures during laser-assisted machining of the Ti–6Cr–5Mo–5V–4Al beta titanium alloy. Int. J. Mach. Tools Manuf. 2012, 63, 58–69. [Google Scholar] [CrossRef]
  47. Reddy, M.M.; William, L.C.S. Finite Element analysis: Predicting cutting force in turning of Inconel 625 using ceramic tools. IOP Conf. Ser. Mater. Sci. Eng. 2020, 943, 012019. [Google Scholar] [CrossRef]
  48. Mia, M.; Dhar, N.R. Influence of single and dual cryogenic jets on machinability characteristics in turning of Ti-6Al-4V. Proc. Inst. Mech. Eng. Part B J. Eng. Manuf. 2019, 233, 711–726. [Google Scholar] [CrossRef]
  49. Lalwani, D.I.; Mehta, N.K.; Jain, P.K. Experimental investigations of cutting parameters influence on cutting forces and surface roughness in finish hard turning of MDN250 steel. J. Mater. Process. Technol. 2008, 206, 167–179. [Google Scholar] [CrossRef]
  50. Dhananchezian, M.; Kumar, M.P. Cryogenic turning of the Ti–6Al–4V alloy with modified cutting tool inserts. Cryogenics 2011, 51, 34–40. [Google Scholar] [CrossRef]
  51. Sun, S.; Brandt, M.; Dargusch, M.S. Characteristics of cutting forces and chip formation in machining of titanium alloys. Int. J. Mach. Tools Manuf. 2009, 49, 561–568. [Google Scholar] [CrossRef]
  52. Selvaraj, D.P.; Chandramohan, P.; Mohanraj, M. Optimization of surface roughness, cutting force and tool wear of nitrogen alloyed duplex stainless steel in a dry turning process using Taguchi method. Measurement 2014, 49, 205–215. [Google Scholar] [CrossRef]
  53. Mkaddem, A.; Demirci, I.; El Mansori, M. A micro–macro combined approach using FEM for modelling of machining of FRP composites: Cutting forces analysis. Compos. Sci. Technol. 2008, 68, 3123–3127. [Google Scholar] [CrossRef]
Figure 1. Schematic diagram of the machining simulation model.
Lubricants 11 00082 g001
Figure 2. Comparison of experimental and simulated cutting temperature in turning Inconel 718.
Lubricants 11 00082 g002
Figure 3. The contrast between experimental and simulated cutting force when turning Inconel 718: (a) F c   ; (b) F f .
Lubricants 11 00082 g003
Figure 4. Effect of lubrication/cooling strategy and v c   on T t and T c ( f = 0.2 mm/rev, a p = 0.2 mm): (a) T t ; (b) T c .
Lubricants 11 00082 g004
Figure 5. Variation of the highest temperature of the temperature field in relation to v c and varied lubrication/cooling techniques ( f = 0.2 mm/rev, a p = 0.2 mm): (a) Dry ( v c = 70 m/min); (b) Cryo ( v c = 70 m/min); (c) Dry ( v c = 100 m/min); (d) Cryo ( v c = 100 m/min); (e) Dry ( v c = 130 m/min); (f) Cryo ( v c = 130 m/min).
Lubricants 11 00082 g005
Figure 6. Effects of f on T t and T c ( v c = 130 m/min, a p = 0.2 mm): (a) T t ; (b) T c .
Lubricants 11 00082 g006
Figure 7. Changes in the temperature field’s maximum temperature as a function of f ( v c = 130 m/min, a p = 0.2 mm): (a) f = 0.1 mm/rev; (b) f = 0.15 mm/rev; (c) f = 0.2 mm/rev.
Lubricants 11 00082 g007
Figure 8. Effects of cutting depth on T t   and T c ( v c = 130 m/min, f = 0.2 mm/rev): (a) T t ; (b) T c .
Lubricants 11 00082 g008
Figure 9. Three-dimensional response surface and contour plots for T t   : (a) f and v c ; (b) a p and v c ; (c) a p and f .
Lubricants 11 00082 g009aLubricants 11 00082 g009b
Figure 10. Three-dimensional response surface and contour plots for T c : (a) f and v c ; (b) a p and v c ; (c) a p and f .
Lubricants 11 00082 g010aLubricants 11 00082 g010b
Figure 11. Influence of lubrication/cooling strategy and v c   on F c and F f ( f = 0.2 mm/rev, a p = 0.2 mm): (a) F c ; (b) F f .
Lubricants 11 00082 g011
Figure 12. Influence of f on F c and F f ( v c = 130 m/min, a p = 0.2 mm): (a) F c ; (b) F f .
Lubricants 11 00082 g012
Figure 13. Effects of a p on F c and F f ( v c = 130 m/min, f = 0.2 mm/rev): (a) F c ; (b) F f .
Lubricants 11 00082 g013
Figure 14. The 3D response surface and contour depiction for F c : (a) f and v c ; (b) a p . and v c ; (c) a p and f .
Lubricants 11 00082 g014aLubricants 11 00082 g014b
Figure 15. The 3D response surface and contour depiction for F f : (a) f and v c ; (b) a p and v c ; (c) a p and f .
Lubricants 11 00082 g015aLubricants 11 00082 g015b
Table 1. Summary of coolant characteristics under dry cutting and Cryo strategies.
Coolant CharacteristicsLubrication/Cooling Strategies
DryCryo
v c (m/min) v c (m/min)
7010013070100130
μ 0.7080.6640.6250.3030.2650.232
h (W/(m2⋅K))20202020,00020,00020,000
ρ (kg/m3)1.2051.2051.205808808808
Table 2. Machining parameters and lubrication/cooling strategies for turning Inconel 718.
v c (m/min) f (mm/rev) a p (mm) Lubrication/Cooling Techniques
70, 100, 1300.20.2Dry
70, 100, 1300.20.2Cryo
Table 3. Cryogenic turning parameters for Inconel 718.
v c (m/min) f (mm/rev) a p (mm)
1300.10.2
1300.150.2
1300.20.2
1300.20.1
1300.20.3
Table 4. Varying ranges of machining parameters.
Machining ParametersLevels
−1 (Low)0 (Medium)1 (High)
v c (m/min)70100130
f (mm/rev)0.10.150.2
a p (mm)0.10.20.3
Table 5. BBD simulation plan.
Group NumberMachining Parameters
v c (m/min) f (mm/rev) a p (mm)
1700.10.2
21300.10.2
3700.20.2
41300.20.2
5700.150.1
61300.150.1
7700.150.3
81300.150.3
91000.10.1
101000.20.1
111000.10.3
121000.20.3
131000.150.2
141000.150.2
151000.150.2
161000.150.2
171000.150.2
Table 6. The machining parameter combinations used for the verification of cutting temperature.
Group NumberMachining Parameters
v c (m/min) f (mm/rev) a p (mm)
1300.11.0
2400.11.0
3500.11.0
Table 7. Various machining parameters combinations used for machining experiment and machining simulation.
Group NumberMachining Parameters
v c (m/min) f (mm/rev) a p (mm)
1610.080.15
2610.160.3
3750.110.3
4940.080.3
Table 8. ANOVA findings for T t  
SourceSum of SquaresDegrees of FreedomMean SquareF-Valuep-Value
Prob > F
Model21,135.9492348.44566.86<0.0001
v c 10,224.50110,224.502467.98<0.0001
f 10,512.50110,512.502537.50<0.0001
a p 0.00010.0000.0001.0000
v c × f 9.0019.002.170.1840
v c × a p 0.00010.0000.0001.0000
f × a p 0.00010.0000.0001.0000
v c 2 221.321221.3253.420.0002
f 2 139.211139.2133.600.0007
a p 2 21.32121.325.150.0576
Residual29.0074.14
Lack of Fit29.0039.67
Pure Error0.00040.000
Cor Total21,164.9416
Std. Dev.2.04 R20.9986
Mean790.95 Adj R20.9969
Pred R20.9781
Adeq. Precision92.244
Table 9. Findings from an ANOVA for T c  
SourceSum of SquaresDegrees of FreedomMean SquareF-Valuep-Value
Prob > F
Model12,647.9991405.3396.21<0.0001
v c 5995.1315995.13410.42<0.0001
f 5151.1315151.13352.64<0.0001
a p 1.819 × 10 12 1 1.819 × 10 12 1.245 × 10 13 1.0000
v c × f 90.25190.256.180.0419
v c × a p 1.819 × 10 12 1 1.819 × 10 12 1.245 × 10 13 1.0000
f × a p 1.819 × 10 12 1 1.819 × 10 12 1.245 × 10 13 1.0000
v c 2 157.961157.9610.810.0133
f 2 1199.0111199.0182.08<0.0001
a p 2 121.641121.648.330.0235
Residual102.25714.61
Lack of Fit102.25334.08
Pure Error0.00040.000
Cor Total12,750.2416
Std. Dev.3.82 R20.9920
Mean819.47 Adj R20.9817
Pred R20.8717
Adeq. Precision36.545
Table 10. ANOVA findings for F c  
SourceSum of SquaresDegrees of FreedomMean SquareF-Valuep-Value
Prob > F
Model36,669.7894074.422427.31<0.0001
v c 24.50124.5014.600.0065
f 8515.1318515.135072.84<0.0001
a p 27,028.13127,028.1316,101.86<0.0001
v c × f 1.0011.000.600.4655
v c × a p 1.0011.000.600.4655
f × a p 1056.2511056.25629.26<0.0001
v c 2 0.06610.0660.0390.8487
f 2 41.12141.1224.500.0017
a p 2 1.6411.640.980.3552
Residual11.7571.68
Lack of Fit11.7533.92
Pure Error0.00040.000
Cor Total36,681.5316
Std. Dev.1.30 R20.9997
Mean116.29 Adj R20.9993
Pred R20.9949
Adeq. Precision182.655
Table 11. ANOVA outcomes for F f  
SourceSum of SquaresDegrees of FreedomMean SquareF-Valuep-Value
Prob > F
Model4206.289467.361006.63<0.0001
v c 60.5160.50130.31<0.0001
f 276.131276.13594.73<0.0001
a p 3828.1313828.138245.19<0.0001
v c × f 6.2516.2513.460.0080
v c × a p 6.2516.2513.460.0080
f × a p 25.00125.0053.850.0002
v c 2 1.0511.052.270.1759
f 2 0.2610.260.570.4761
a p 2 2.3712.375.100.0585
Residual3.2570.46
Lack of Fit3.2531.08
Pure Error0.00040.000
Cor Total4209.5316
Std. Dev.0.68R20.9992
Mean44.29Adj R20.9982
Pred R20.9876
Adeq. Precision106.200
Disclaimer/Publisher’s Note: The statements, opinions and data contained in all publications are solely those of the individual author(s) and contributor(s) and not of MDPI and/or the editor(s). MDPI and/or the editor(s) disclaim responsibility for any injury to people or property resulting from any ideas, methods, instructions or products referred to in the content.

