Article

A Validated Computational Study of Lubricants under White Etching Crack Conditions Exposed to Electrical Fields

1
Technology Consultant, Sailegärten 2, 72351 Erlaheim, Germany
2
Faculty of Operational Mathematics, School of Engineering, Faculty of Engineering and Physical Sciences, University of Southampton, Southampton SO17 1BJ, UK
3
School of Mathematics, Faculty of Social Sciences, University of Southampton, Southampton SO17 1BJ, UK
4
Business School, Faculty of Social Sciences, University of Southampton, Southampton SO17 1BJ, UK
5
ASC Goerlach, Robert-Bosch-Straße 60/1, 72810 Gomaringen, Germany
*
Authors to whom correspondence should be addressed.
Lubricants 2023, 11(2), 45; https://doi.org/10.3390/lubricants11020045
Submission received: 30 December 2022 / Revised: 16 January 2023 / Accepted: 26 January 2023 / Published: 28 January 2023
(This article belongs to the Special Issue Rolling Contact Fatigue and White Etching Cracks of Bearings)

Abstract

:
The problem of White Etching Cracks (WEC) leading to failures in the life cycle of industrial and automotive drive trains has existed for more than 30 years. Many parameters leading to WEC, such as the presence of electricity, unfavorable lubricants, and other factors, have been identified by the use of test rigs. However, since (a) within lifecycle operation these impacts appear incidentally, and (b) the identified impacts stimulate each other as stated in WEC research, the appearance of WEC in a drive train is impossible to predict for any given application. This difficulty causes WEC to be a serious problem. Obtaining reliable failure prediction rates using construction guidelines is still impossible, resulting in warranty claims. The aim of this paper is, first, to establish a routine to determine if and how lubricants could be described numerically with respect to their susceptibility toward electrical fields and to see how this factor could be added in a later stage to construction guidelines. Second, this paper aims to give advice to the applicant in terms of countermeasures. Currently, as predictors are missing, extensive and time-consuming testing is required. Contradictory test results in the field of application, indicate the need for fundamental parameters to determine in which circumstances the application is exposed to WEC risk and to suggest countermeasures. The current study presents a simulation method based solely on the chemical structure of lubricant components, investigating the appearance of WEC and their response to increasing electrical fields. The results show a clear pattern in WEC criticality with respect to lubricants: if two or more components present in the lubricant create clusters through their dipolar interaction, an apparent WEC risk could be accurately predicted apart from test rig results. These clusters are charged like one big particle in an early stage of electrical field exposure. As a result, the surface area increases, facilitating a higher uptake of charge. The incidental breakdown of this charge is assumed. As the charge of a cluster is higher than that of single molecules, WEC critical lubricants are subjected to this pattern. The study validates these results by comparing them using lubricants known to be critical with respect to WEC, suggesting further tests in the near future. Despite the fact that some lubricants seem more critical than others related to WEC, each lubricant clearly might lead to WEC under given conditions. Thus, constructing guidelines for a prediction routine is essential.

1. Introduction

The unpredictability of failures due to White Etching Cracks (WEC) has prompted numerous studies to identify the driving parameters distinctively leading to so-called rolling fatigue mode [1,2]. Friction due to sliding has been discussed as an apparent mechanical impact to stimulate energy accumulation [3,4] leading to subsurface crack formation and later to white etching cracks by flank rubbing [5]. Lubricants have been identified as an additional cause [6,7] leading finally to hydrogen as a source for further deterioration of materials [8,9]. Further studies have suggested that straying currents combined with lubricants are possible causes, assuming hydrogen as an intermediate [9,10,11]. A recent study proves that WEC appears under full film (EHL) conditions, disproving that friction or slip roll ratio (SRR) is a stringent root cause [12]. Detailed material investigations show that cracks appear in a first state, leading to crack networks and later to white-decorated flanks. Electron backscatter diffraction (EBSD) measurements disprove the matter of flank rubbing because cracks are only partially accompanied by white etching [12]. However, the fact that specific lubricants in addition to functional additives lead to WEC and others do not suggest the essential question of how these facts could be used in a prediction scheme. Lubricants cause the separation of the mating surfaces by film formation in the tribo-contact covering assumed asperities and reducing friction and wear [13]. The latter theory has been used for decades as a valuable engineering tool to investigate and avoid friction and wear in tribo-contact, as well as to serve construction guidelines. The basic descriptors within the theory are the construction details of the contact and viscosity parameters from the side of the lubricant. Decreasing the size of machinery components by compacting drive trains and increasing power throughout results in the lubrication film formation undergoing stress since extensive shearing, increasing temperature, and decreasing viscosity minimize friction by splashing push the lubrication to thin films. Thus, the notion of thin film lubrication (TFL) arose as an extension and way forward from EHL [14]. As the size of the contact zone decreases, the molecular structure of lubricants becomes important and leads to the question of how these properties may be embedded in TFL [15]. Moreover, due to TFL tribo-chemistry also comes into the picture as thin films partially uncover metal asperities and chemical processes e are induced by charge transfer reactions from the metal, oxygen, and lubricant [16]. The appearance of tribo-emission in boundary-lubricated tribo-contacts was intensely studied by Kajdas, et al. [17]. Photon emission as a matter of tribo-plasma caused in boundary lubrication was reported by Nakayama [18]. The emission of charged particles as a part of advanced failure sensoring was a concept reported by Wang, et. al [19]. In [20], the concept is reported in relation to WEC-induced failure. The author of [21] reports the use of critical lubricants exposed to electrical charging and discharging in junction with electrostatic sensoring concepts. The criticality of a lubricant causing WEC was studied by [1,21]. The authors of [22,23] proved the formation of pores by the inherent impact of critical lubricants under boundary lubrication leading to WEC. The authors of [12,23] stated the criticality of individual lubrication components with respect to WEC obtained under different test conditions. In addition, while [9] identifies the reaction layer as a driving cause, [24] states implicitly that WEC appearance is not necessarily addressed to the existence of reaction layers, but instead to the formation of transient intermediate physical states related to the magnitude of the oil flow. Since neither the description of TFL nor TC sufficiently explains the role of lubricants, the natural question arises as to how the contribution of lubricants could be described. This reasoning leads to the assumption that transient physical states are more responsible than reaction layers caused by specific chemical reactions. In order to study the influence of chemicals, molecular drawings have to be converted into numbers representing the molecular properties. Apart from physical data obtained by measurements, quantum mechanics turns out to be very valuable to identify the inherent data of molecules.

2. Materials and Methods

Commonly, lubricants used in drive trains are defined by their viscosity, viscosity-temperature, viscosity-pressure values, pourpoint use at low temperature, flashpoint, and sometimes ingredients. As WEC indicate unpredictable failure risks related to the ingredients of lubricants and their susceptibility to electrical fields, a basic methodology must be established as to how individual components and their interaction in an electrical field could be addressed. This study uses lubricants whose components are known by their structure. Since these structures are represented by drawings, they must be converted to numbers using molecular simulations executed by Hyperchem®. The computation starts by drawing the chemical structure of the lubricant component. This structure shows basically how the atoms and bonds are oriented in space and then relaxed by molecular mechanics computational iteration to a state where a small change in the bond angles and stretching does not cause a steep change in energy. The point where the iteration stops is defined by the Root Mean Square (RMS) parameter. The convergence was carried out by the steepest gradient method. By the use of Quantitative-Structure Property Relations (QSPR), the molecule could be numerically described by its number of atoms, molecular surface, volume, and other parameters.
Exploring further properties such as energy, dipole moments, polarizability, and more, semi-empirical methods such as DFT methodology were used, substituted by PM3 methodology. Density Functional Theory (DFT) expresses all properties of a given molecule by the calculation of the charge density calculated by the square of the wave function. DFT calculation gives superior results in exploring spectral data and molecular geometries. In the case of large and complex structures, a DFT calculation may be time-consuming. We changed our methodology to the less accurate but fast-computing Parametrized Method 3 (PM3). Pre-studies not presented here have shown a good correlation between the two methods. The choice for PM3 was then taken due to the ease of computation. A detailed description of the methodology is not the intention of this paper which refers the reader to the basics of quantum chemistry. Parametrized Method 3 exploration was applied so that the molecule was again converged to its energy minimum defined by an RMS 0.01. The numerical values of the sketched molecules could then be read out, e.g., energy, dipole moment, inducible dipole moment, and more. The dipole moment is calculated in the units Debye (D). Figure 1 shows an example of the computational routine:
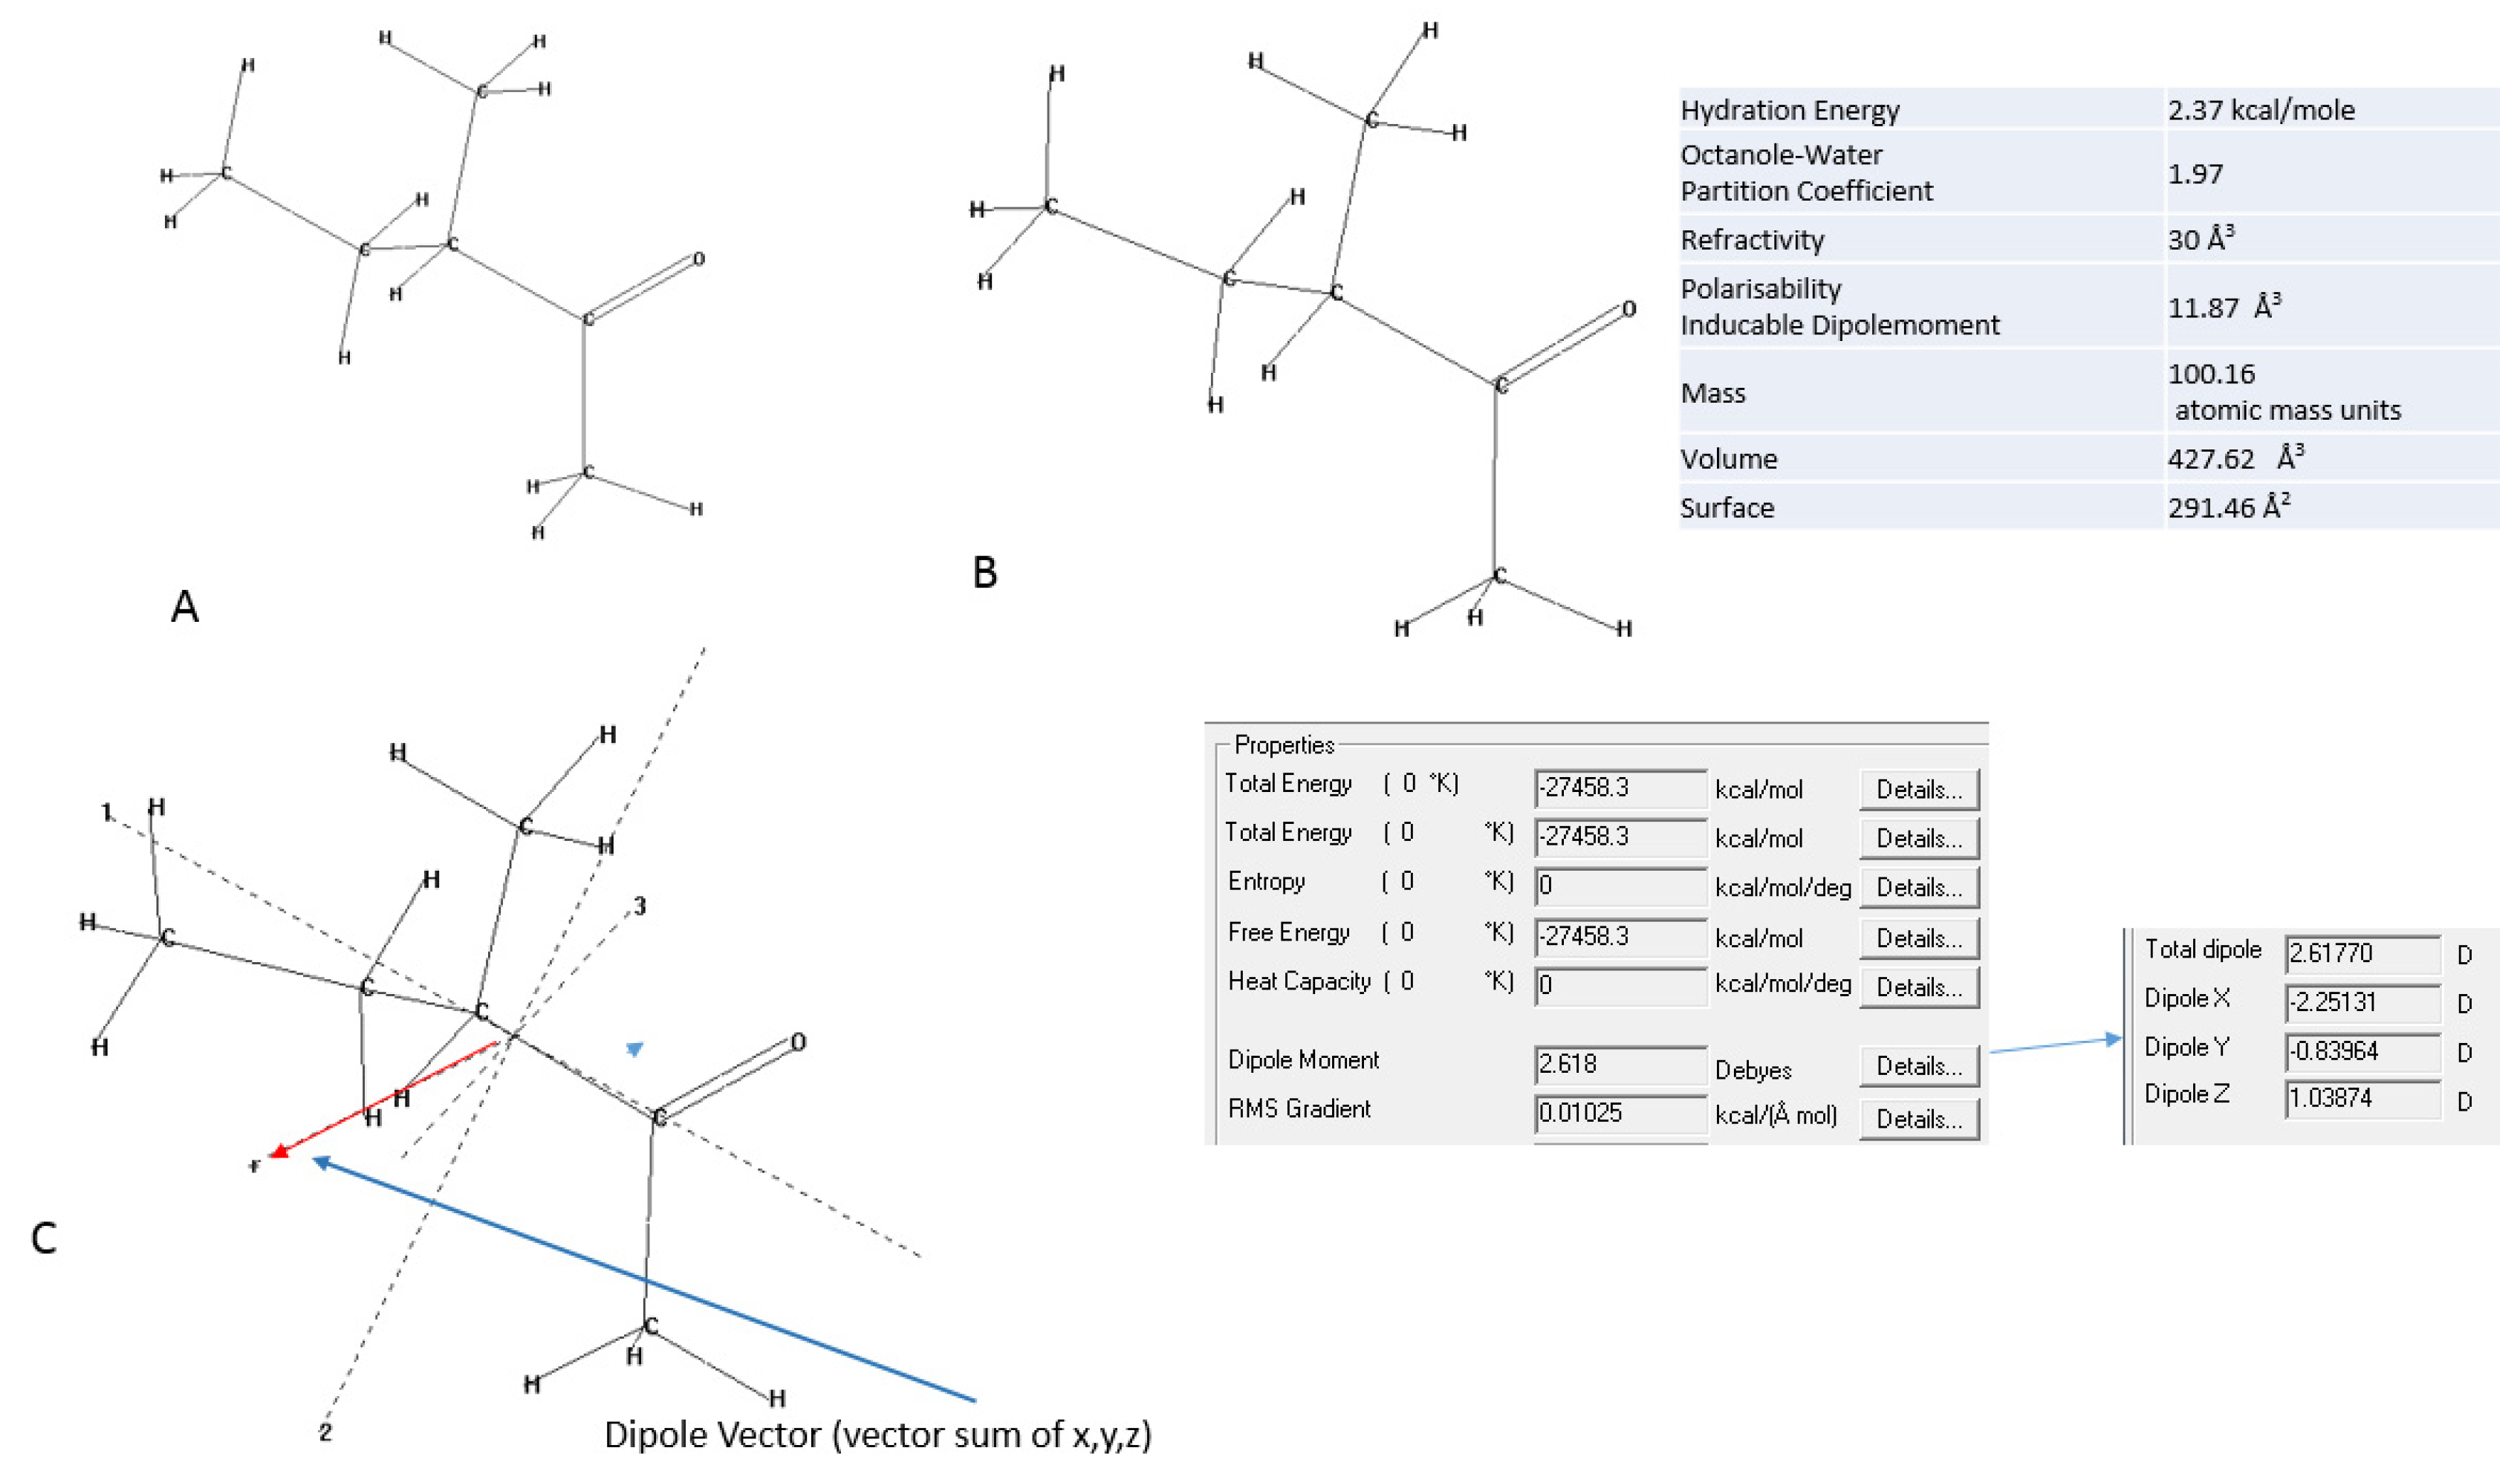
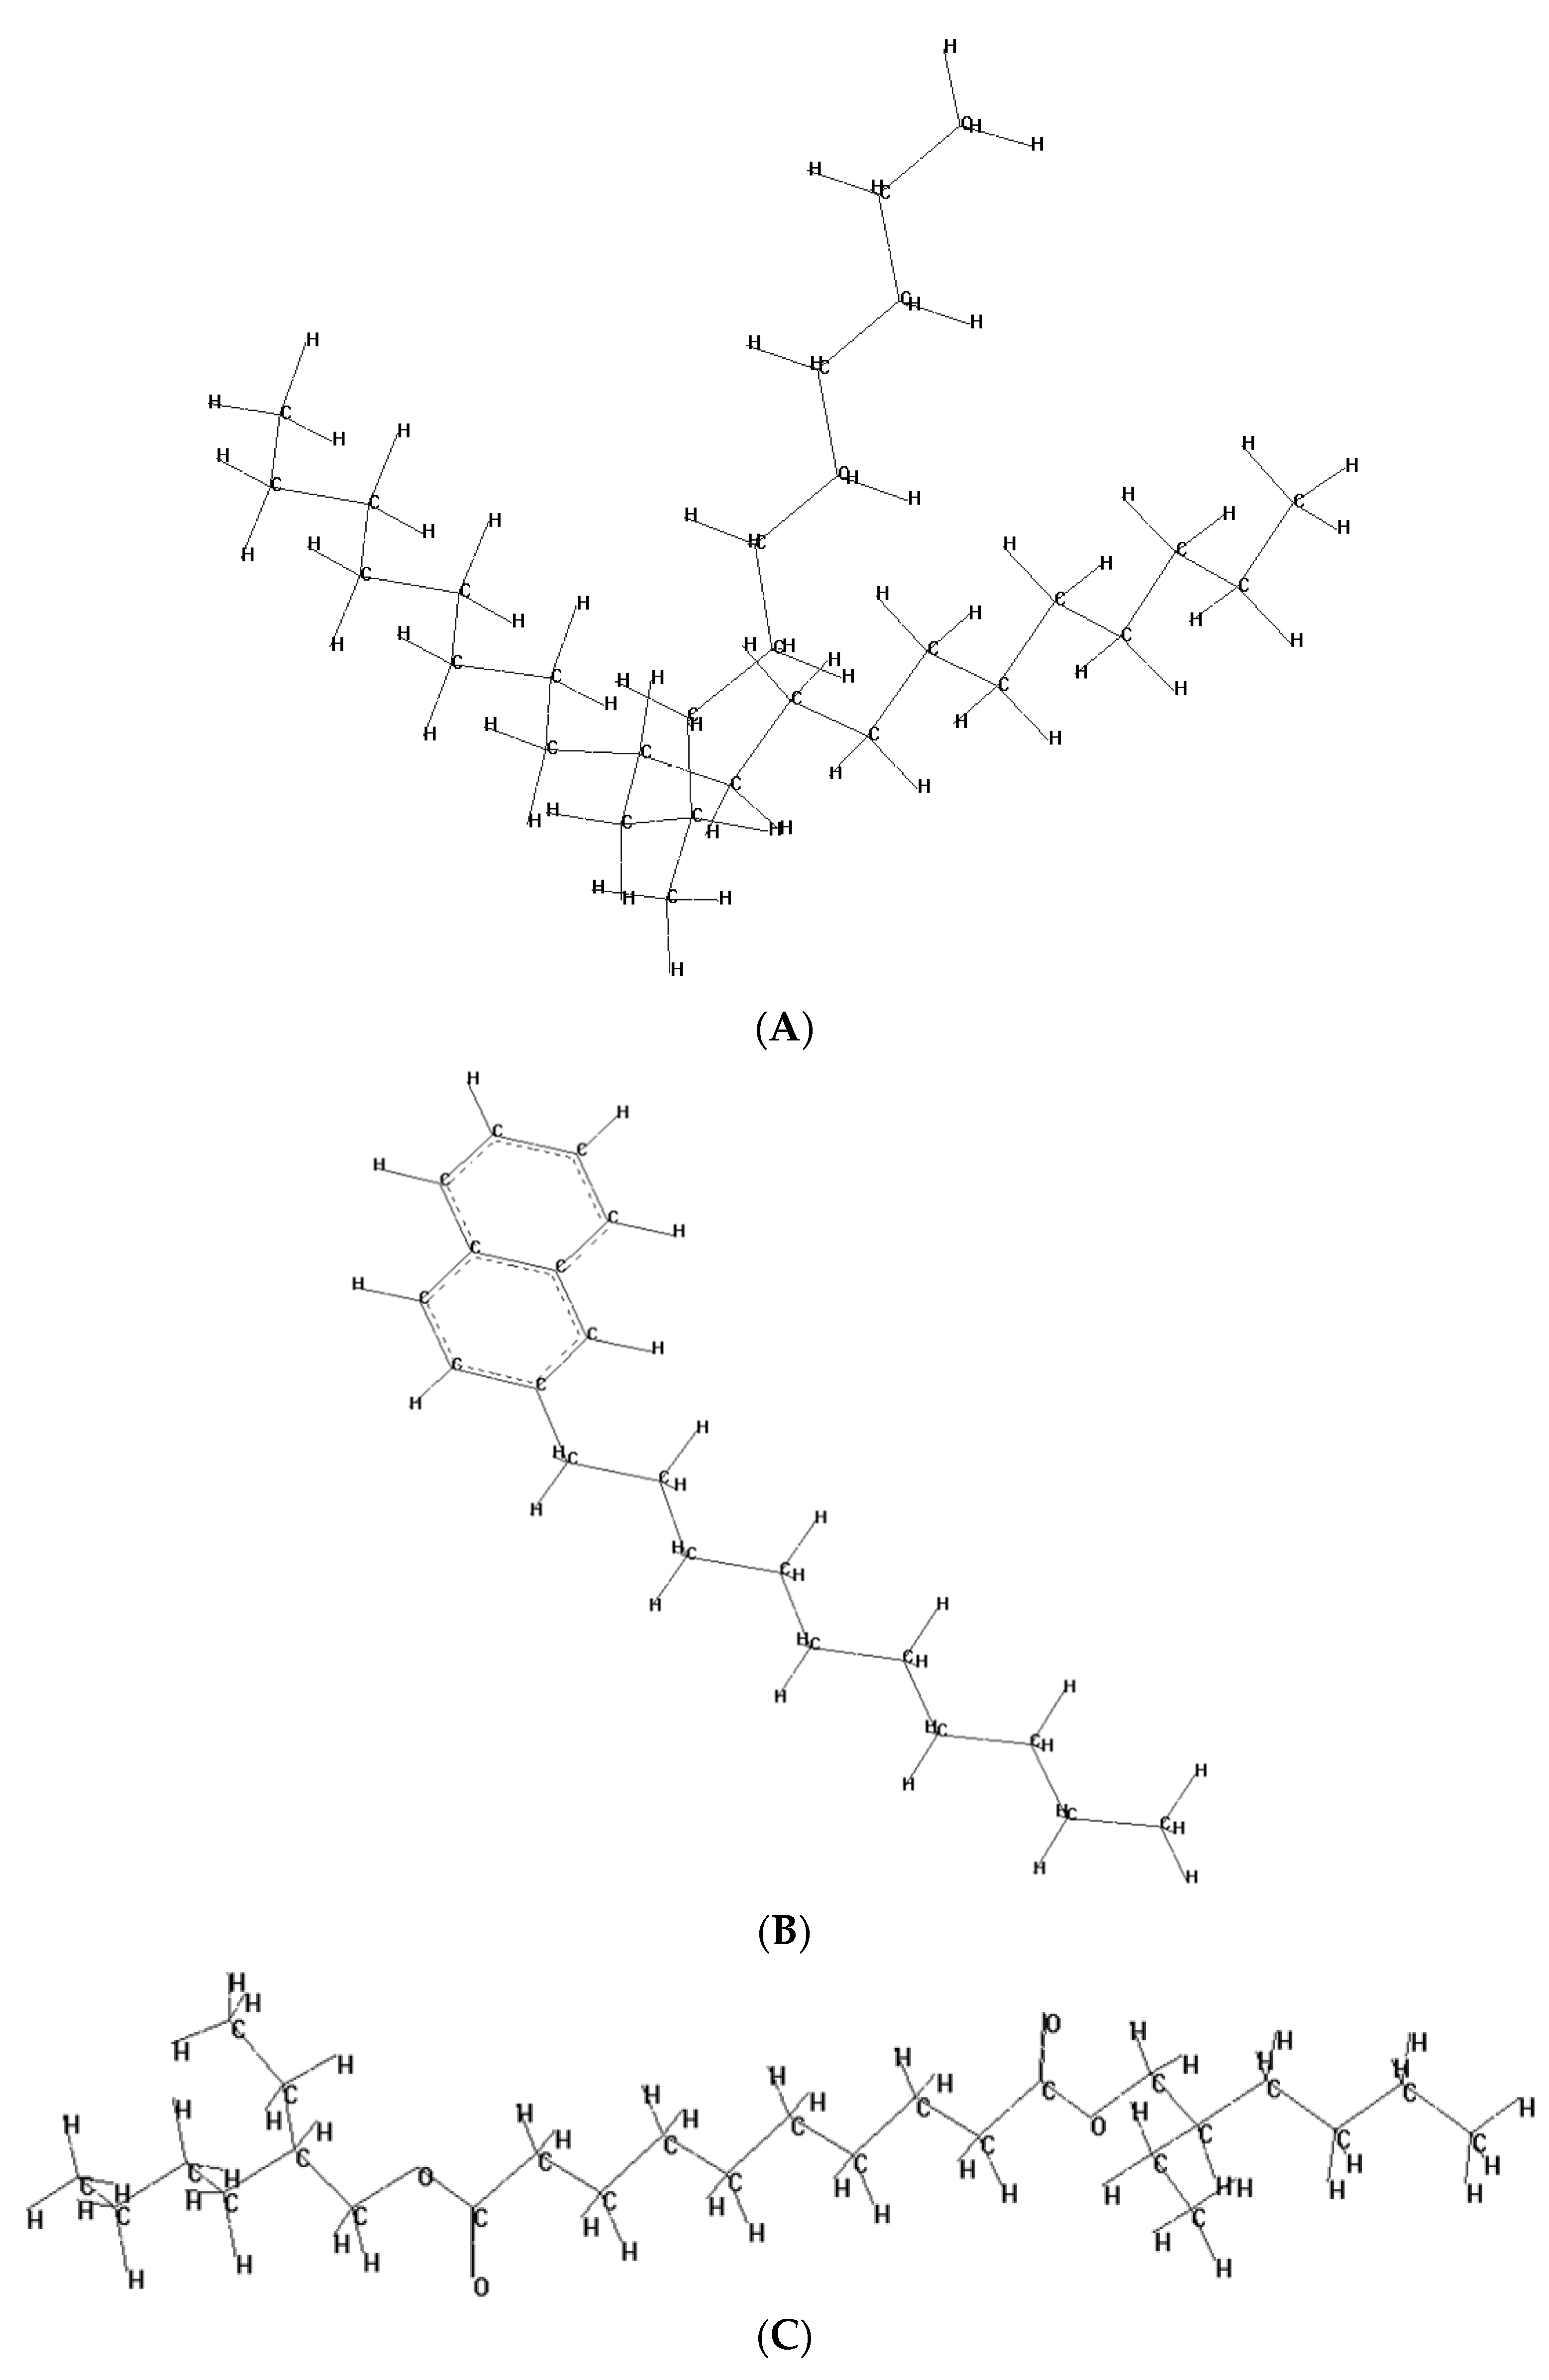
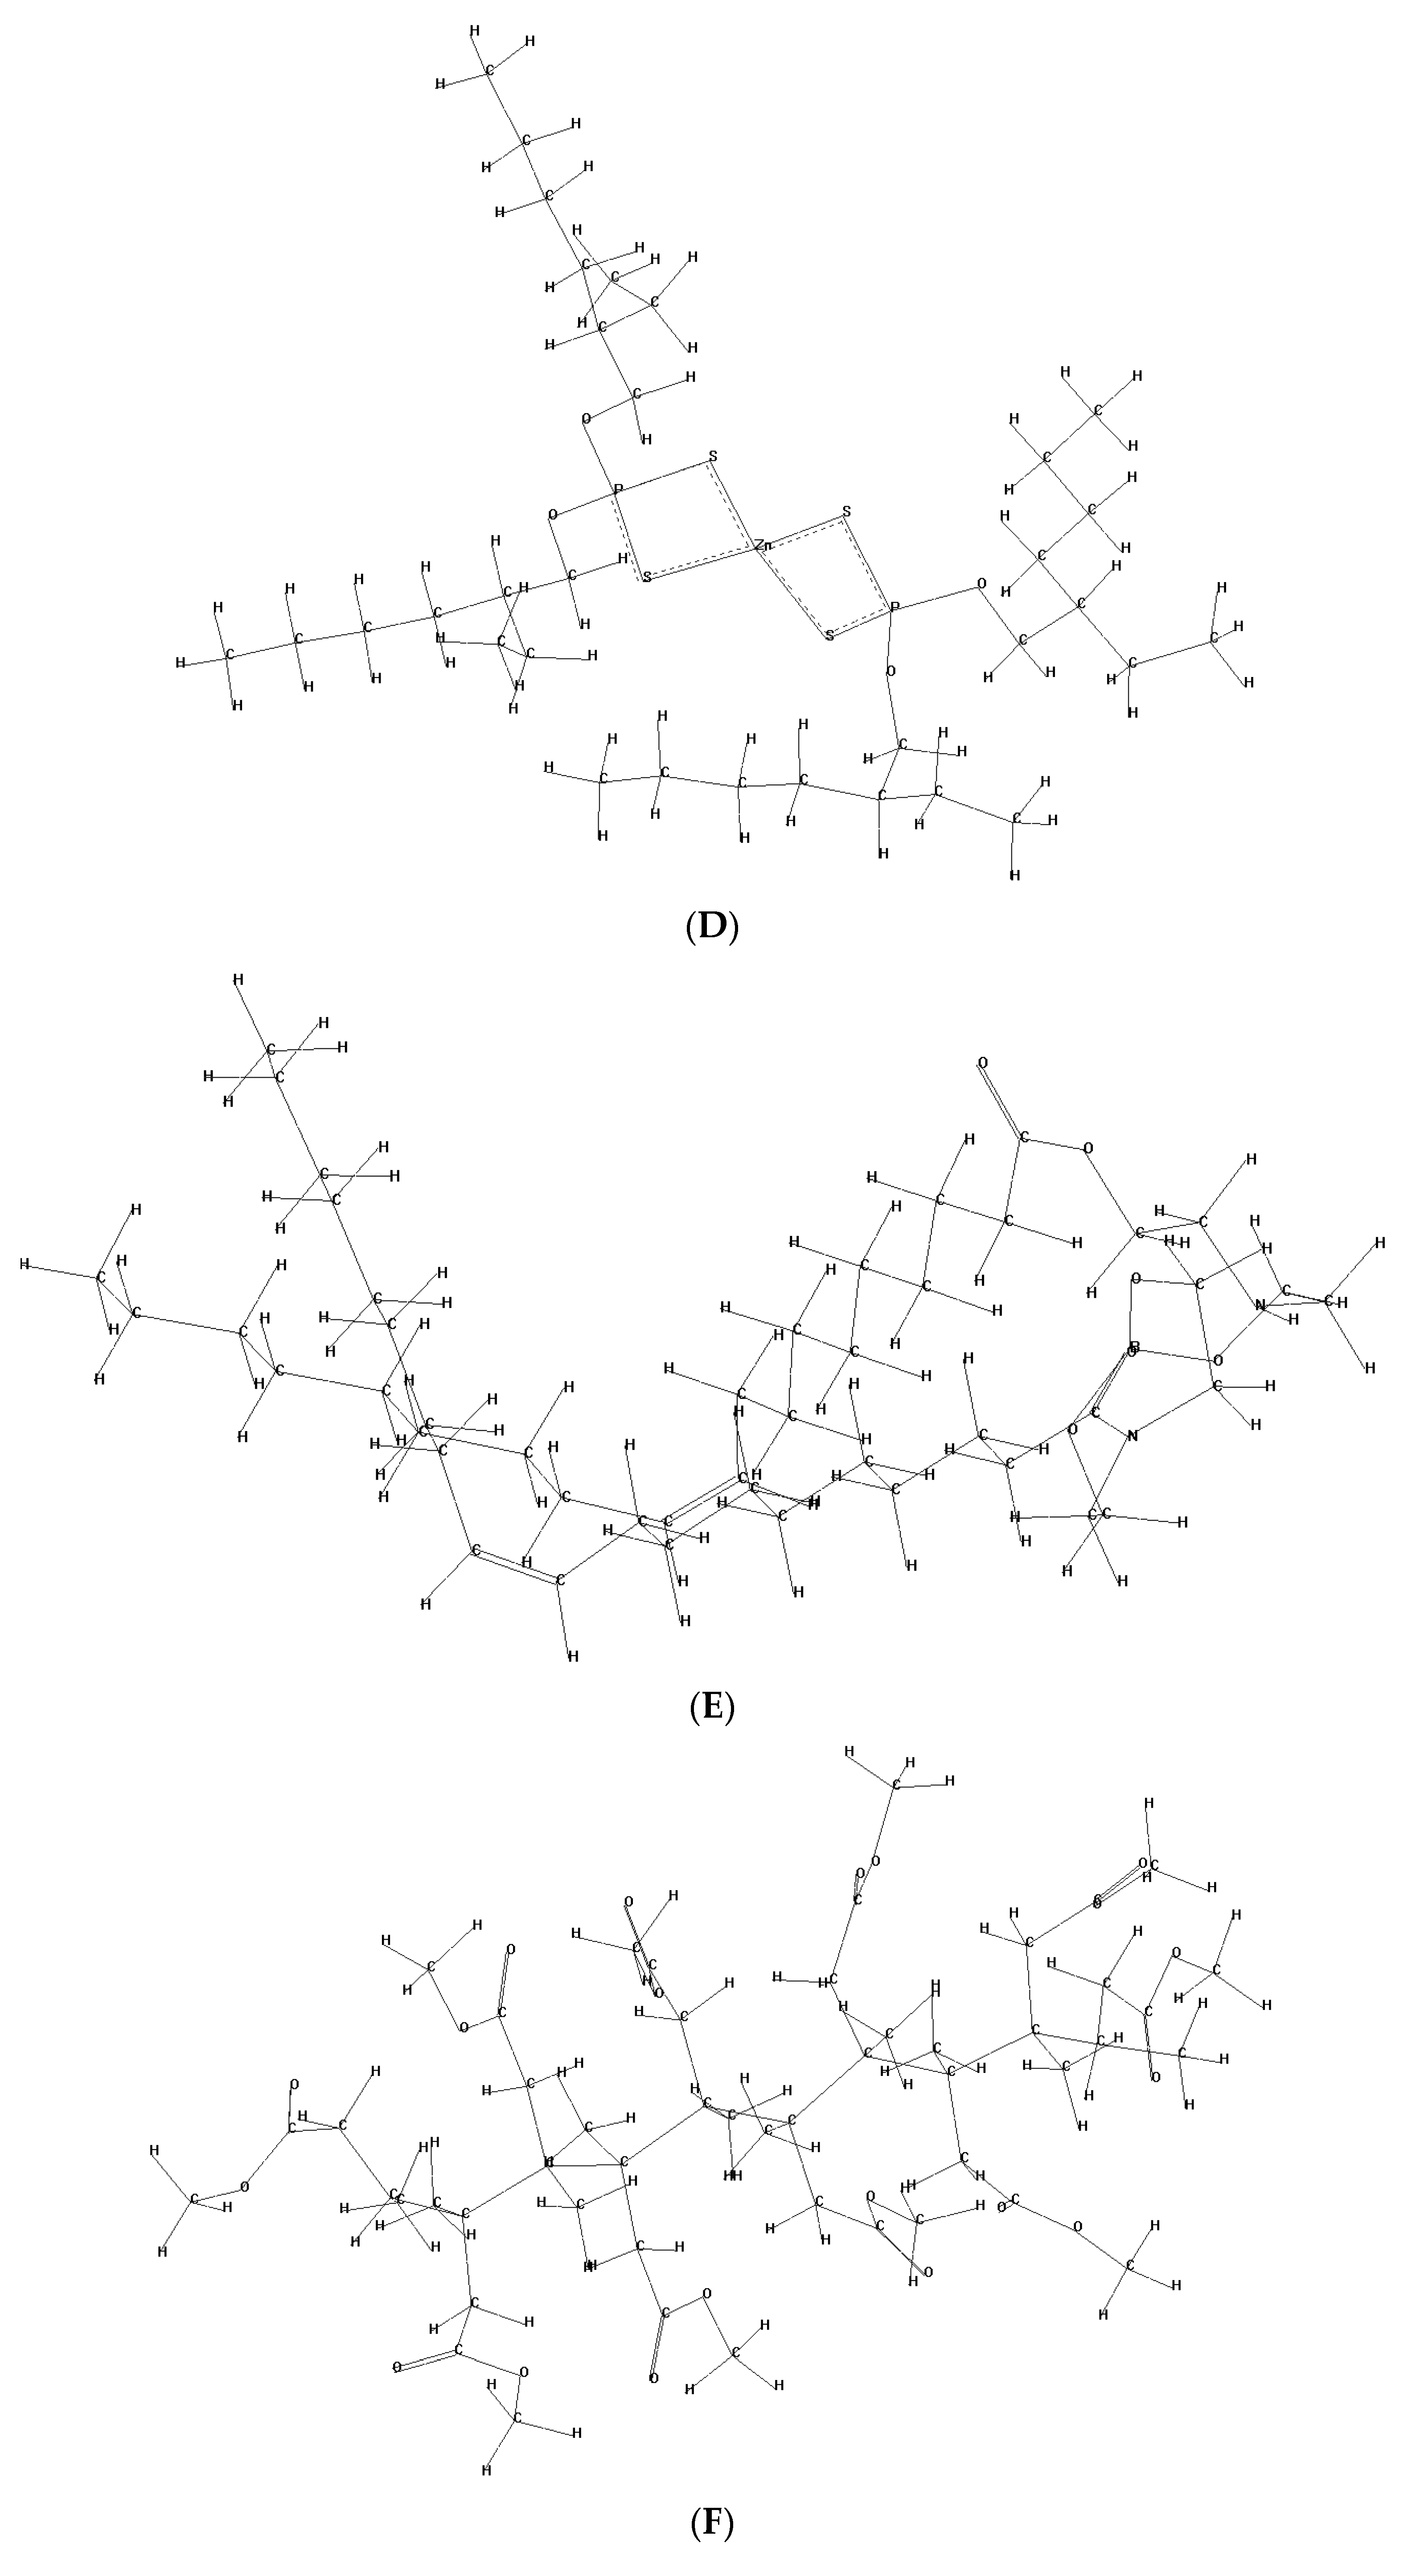
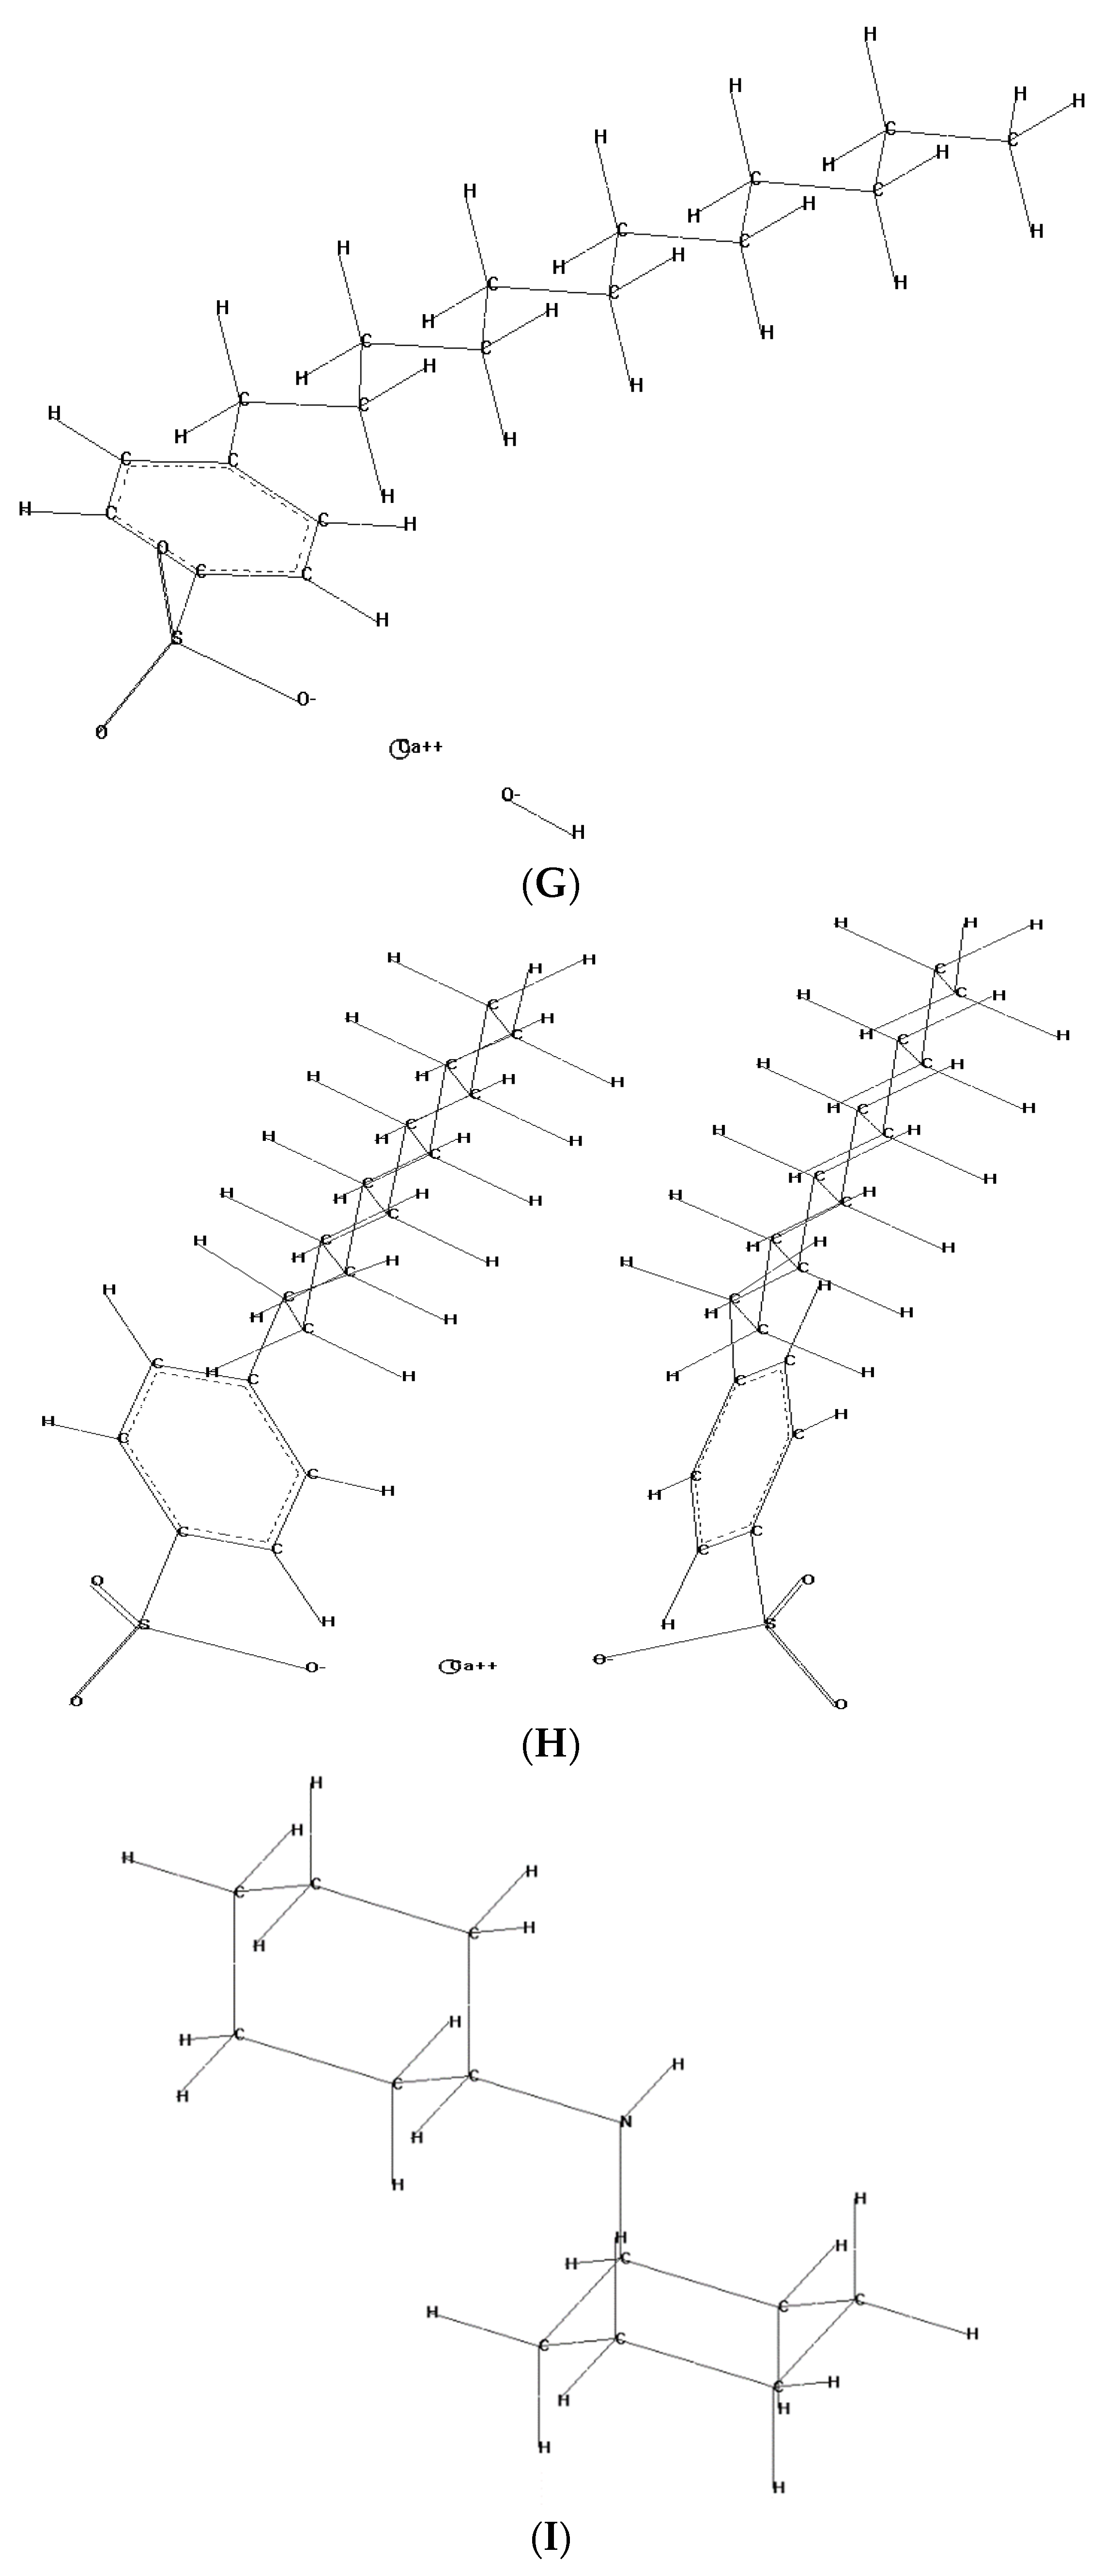
  • 3D drawing of the structure;
  • Relaxed Structure by molecular mechanics with the QSPR output values (to the right);
  • Energy relaxed structure starting from (B) by the use of PM3 calculation.
The spatial direction of the total dipole moment (red arrow and marked) is the vector sum of the x, y, z directions (see table screenshot to the right).
Computation of the Single State Energy was then carried out exposing the molecule to an electrical field increasing from 0 to 0.1 atomic units (au) and resulting in all basic parameters, e.g., energy, heat of formation, dipole vector, and polarizability tensor. For the current studies, the authors solely explored the variation of the dipole moment in all spatial directions (x, y, z) normalized by the number of atoms as a function of the applied electrical field in atomic units (a.u.) scale as provided by HyperChem®. Atomic units are defined as dimensionless parameters of the electrical field in the distance of 53 pico meters which is equal to the Bohr radius. Atomic units are commonly used in atomic or molecular physics apart from the standard SI system. The ratio between the dipole moment and the number of atoms is called the relative dipole moment in the course of the current study:
µ i r e l = µ i N
where μ i is the dipole moment of the i - t h component either from the literature or by PM3 calculation, while N is the number of atoms from the i - t h component.
As a base, the authors took the molecules stated by [12,24]. Then the study was expanded to a general prediction of WEC. Table 1 shows the idealized molecules being used while the idealized structures are shown in Figure 2.
Given the above molecules and structures, relative dipole moments for each molecule are considered. Then, a measure of the likelihood of creating clusters between two molecules is computed, assuming it to be related with the difference of the relative dipole moment as
L = 1 μ 1 r e l μ 2 r e l
where L represents the likelihood of creating clusters, while μ i r e l the relative dipole moment of component or molecule i . Equation (1) states that components similar in their relative dipole moments attract each other more strongly than situations where the components are dissimilar. A measure for similarity is assumed to be stated by the absolute difference of the relative dipole moment and the likelihood of attraction as their reverse. Since the first computations are all carried out in the absence of external influence, the question arises: what if there is an external presence? In particular, we are interested in situations where an external electrical field interferes with molecular properties, such as the relative dipole moment, that change the likelihood of the formation of clusters. In a similar fashion to what has been done for the calculation of the relative dipoles in the absence of external fields, we exploit the power of Hyperchem® and, considering electrical fields of different intensities (a.u.) applied in different directions named x, y, z, we compute the corresponding relative dipole moments. Examples of the resulting values will be provided in the following section.
Keeping in mind the goal of constructing a predictor of WEC formation, we then aim at narrowing down the results to one number, possibly embedding all directions (x, y, z). Thus, writing for simplicity μ i d i   ξ for μ i r e l ,   d i   ξ , the relative dipole moments μ i d i ξ as well as the likelihood of the formation of clusters L i , j d ξ are computed for each of the molecules i ,   j and directions d = d i , d j x , y , z × x , y , z as a function of the a.u. ξ of the electrical field applied. Clusters appear then when differences between μ i d i ξ and μ j d j ξ are small or even when crossing takes place (i.e. μ i d i ξ μ j d j ξ ) for some d = d i ,   d j . We can then define the Crossing Activity Coefficient ( A ) as follows
Crossing Activity Coefficient
A = A ξ = max d ,   i , j L i , j d ξ = max d , i , j 1 μ i d i ξ μ j d j ξ  
The Crossing Activity Coefficient will be high if the absolute difference of the relative dipole moments is close to zero. A relation between A ξ and WEC is then examined with the expectation that the more A ξ is high (or active) the more WEC are likely to appear. We are now ready to introduce a single value as a critical factor used for WEC prediction. We define the Chemical WEC predictor as
C h e m i c a l   W E C   P r e d i c t o r = V a r i a n c e A
In the following section, we show evidence of the ability of the Chemical WEC Predictor to help detect WEC. In particular, we consider different compositions for which WEC risk measures have been provided and tested, and we compute the corresponding WEC Predictors, showing the preliminary results of the separation ability.

3. Results

In this section, after showing the electrical field dependence of μ d ξ for some molecules along with some of the interactions, we provide evidence of the measurability for predicting WEC. For brevity, in what follows we show interactions between coupled molecules when both are subject to the same electrical field.
Figure 3, Figure 4 and Figure 5 show the calculated relative dipole moments in x, y, and z direction for a PAO (assumed as a hydrogenated trimer from Dec-1-ene) as a function of the electrical field (a.u.).
The progress in relative dipole moment for a Zinc-(2-ethylhexyl)-phosphate is seen in Figure 6, Figure 7 and Figure 8 for the x, y, and z-direction respectively.
To show the interaction between molecules, a combination of PAO and ZndtP is chosen. It can be noticed that the relative dipole moments cross at a given electrical field and (see Figure 9 and Figure 11), but also do not cross (see Figure 10) depending on the spatial direction. The likelihood of clusters formation behaves accordingly.
Another example is reported here to (i) include a baseoil component, (ii) show the possibility of multiple crossings, and (iii) show a first comparison of oil compositions with respect to WEC formation. For the baseoil–additive mixture presented, a binary mixture of Zinc-2-ethylhexyl-dithiophosphate and Calcium-dodecylsulfonate overbased/neutral as additives, more or less evident crossing is shown in Figure 12 (two crossings), Figure 13 (no crossings), and Figure 14 (one crossing).
On the other hand, the exposure of a binary mixture of Zinc-2-ethylhexyl-dithiophosphate and Calcium-dodecylsulfonate, neutral only shows one crossing (see Figure 15) while the other directions do not cross (see Figure 16 and Figure 17).
After the examination of all the possible crossing, the likelihood and consequently the Crossing Activity Coefficient are then computed as described in the previous section. We present here the results for a binary mixture of Zinc-2-ethylhexyl-dithiophosphate and Calciumdodecylbenzenesulfonate, overbased, compared with a binary mixture of Zinc-2-ethylhexyl-dithiophosphate and Calciumdodecylbenzenesulfonate, neutral (see Figure 18 and Figure 19).
As has been reported, mixtures of ZndtP with overbased Calciumsulfonates are more likely to create WEC (see introduction) than ZndtP combined with a neutral Calciumsulfonate. Obviously, a (positive) relation between A ξ and WEC might exist, where we might expect that the higher the A ξ , the higher the chances of having WEC. Moreover, as shown in the examples, crossing does not happen frequently, causing the mean value of A ξ to be small. Therefore, its variance (our Chemical WEC Predictor) can be considered as a better measure of WEC predictions. In fact, as previously described, the Chemical WEC Predictor is then computed as the variance of the Crossing Activity Coefficient. A series of different compositions is presented below in Table 2 along with the relative Chemical WEC Predictors. Noting that for a multi-component system (e.g., Oil 3, 5, 6, 7, 8) all permutations of the components are calculated and the highest value of A ξ is reported, we can observe the power of the Chemical predictor from Table 2 below. The correctness of the prediction is confirmed for Oils number 1, 3, 6, 8, and 9: oils with higher chances of exhibiting WEC correspond to high value of the Chemical WEC Predictor (above 1). The details of some tests are confidential, while test results for the other oils are pending.

4. Validation

In addition to the results reported previously, Table 3 shows a validation of the model across 28 lubrication oils (L*), covering results from Research and Development (R&D) and Industrial gear oils (I). Brand names and compositions are confidential. The results are in good accordance with the test rig and field results, showing correspondence between the high value of the Chemical WEC Predictor (above 2) and the actual formation of WEC. Mismatches appear due to the fact that some failures are suspicious with respect to WEC since similar failures like Surface Induced Fatigue (SIF) or pitting is observed.

5. Discussion

The current study shows that the susceptibility toward WEC of lubricants and their components is predictable through their chemical structure and properties. As most lubricants are based on organic chemicals and their mutual attraction, their dipole moments are of key interest. Calculation by using quantum mechanics methodology (Hyperchem®) shows an interesting pattern: molecules interacting on one side by their dipoles are able to create clusters without and under the influence of an imposed electrical field. The results suggest that the appearance of WEC is related to the formation of those clusters, and that WEC are more likely if they form at low field strength independent of the spatial distribution of the field. This “crossing activity”, once properly summarized, acts as a powerful predictor for WEC with respect to lubrication. Moreover, the study states that, in order for the prediction to be effective, at least two or more components must be present, and their presence should most likely be localized at the surface. The results show that the molecular interactions under certain conditions dominate, filling the gap between thin film lubrication (TFL) and tribocatalysis(TC). Cluster formation may facilitate the uptake of electrical charges more than the single ones and cause processes leading finally to White Etching Cracks. Finally, since the predictors consider solely the chemical structure of the lubricant and its inherent properties, we show that the proposed model is independent from test rig and hence very valuable to assess a general WEC risk. Given these predictors, the application could be judged, first, a priori as to whether or not WEC is a part of the application and, second, how countermeasures could be taken from the beginning.
Despite the obvious benefits, the model still depends on very basic quantum mechanical computation and as it now stands is not ready for commodity installation. As a further obstacle, the model requires the chemical structures of the oil ingredients and their concentration, the application, and the temperature in operation which are not trivial to acquire. These obstacles must be overcome in order to make substantial progress in WEC prediction and prevention from the start. However, the validation shows that, by applying the model, it is possible to have an a priori WEC alert.

6. Conclusions

In this paper, we analyse the formation of White Etching Cracks (WEC) in relation to chemical properties of molecules with particular attention to dipole moments and relative dipole moments. We discussed the fact that molecular interactions and clusters formation might cause WEC. We derive a way to measure the likelihood of clusters formation, considering coupled interactions. In addition, we showed that chemical properties might depend on external factors, and we focused on the interference of an electrical field operating in different directions and with different strengths (measured in atomic units). Therefore, we derived a Chemical WEC Predictor as a measure unifying all of the above chemical aspects and resulting in a good indicator of the likelihood of WEC formation. Results were then tested on a few oil samples, confirming the hypotheses made.
In the future, these studies can be expanded to the question of if and how other factors like temperature and material properties can be valid indicators of WEC and wear. This paper states the dipolar interaction as an attracting principle and a main cause. However, it is reasonable to expand the oil sample to further test the results depicted above under different circumstances and also to take a closer look at other molecular predictors and their role in lubrication. Nevertheless, it is possible to affirm that the current study allows the prediction of WEC vulnerability and empowers lubrication research to sketch newly invented lubricants (e.g., for E-Drives or environmental technologies) with respect to WEC, reducing the necessity of extensive and time-consuming test rig studies. In addition, further research can expand this attempt with respect to
  • Gear oils in general, raising the need to acquire components;
  • A priori risk assessment for Drive Trains.
In particular, evaluating gear oils in general raises the question as to whether and how the chemical structures of the components could be derived since the data are sparse. Given its relevance, this problem is under investigation and will be part of a subsequent attempt. On the other hand, once a gear oil is reconstructed by its components, the overall unexpected risk could be defined as a factor with respect to the composition and used for an a priori risk assessment for drive trains. The latter activity is also an ongoing investigation in current works.

Author Contributions

Conceptualization, W.H. and B.G.; Data curation, L.B., Z.M., J.F., B.G. and B.S.; Formal analysis, L.B., Z.M. and B.S.; Investigation, L.B., Z.M., B.G. and B.S.; Methodology, W.H., L.B. and B.G.; Project administration, J.F.; Software, B.S.; Supervision, J.F.; Writing—original draft, W.H.; Writing—review & editing, L.B. All authors have read and agreed to the published version of the manuscript.

Funding

This research received no external funding.

Data Availability Statement

Data sharing not applicable.

Conflicts of Interest

The authors declare no conflict of interest.

References

  1. Smelova, V.; Schwedt, A.; Wang, L.; Holweger, W.; Mayer, J. Microstructural changes in White Etching Cracks (WECs) and their relationship with those in Dark Etching Region (DER) and White Etching Bands (WEBs) due to Rolling Contact Fatigue (RCF). Int. J. Fatigue 2017, 100, 148–158. [Google Scholar] [CrossRef]
  2. Holweger, W.; Wolf, M.; Merk, D.; Blass, T.; Goss, M.; Loos, J.; Barteldes, S.; Jakovics, A. White Etching Crack Root Cause Investigations. Tribol. Trans. 2015, 58, 59–69. [Google Scholar] [CrossRef]
  3. Gould, B.; Greco, A. Investigating the Process of White Etching Crack Initiation in Bearing Steel. Tribol. Lett. 2016, 62, 26. [Google Scholar] [CrossRef]
  4. Kruhöffer, W.; Loos, J. WEC Formation in Rolling Bearings under Mixed Friction: Influences and “Friction Energy Accumulation” as Indicator. Tribol. Trans. 2017, 60, 516–529. [Google Scholar] [CrossRef]
  5. Manieri, F.; Stadler, K.; Morales-Espejel, G.E.; Kadiric, A. The origins of white etching cracks and their significance to rolling bearing failures. Int. J. Fatigue 2019, 120, 107–133. [Google Scholar] [CrossRef]
  6. Richardson, A.D.; Evans, M.H.; Wang, L.; Wood, R.J.K.; Ingram, M.; Meuth, B. The Evolution of White Etching Cracks (WECs) in Rolling Contact Fatigue-Tested 100Cr6 Steel. Tribol. Lett. 2018, 66, 6. [Google Scholar] [CrossRef] [Green Version]
  7. Richardson, A.; Evans, M.-H.; Wang, L.; Ingram, M.; Rowland, Z.; Llanos, G.; Wood, R. The effect of over-based calcium sulfonate detergent additives on white etching crack (WEC) formation in rolling contact fatigue tested 100Cr6 steel. Tribol. Int. 2019, 133, 246–262. [Google Scholar] [CrossRef]
  8. López-Uruñuela, F.J.; Fernández-Díaz, B.; Pinedo, B.; Aguirrebeitia, J. Early stages of subsurface crack and WEC formation in 100Cr6 bearing steel under RCF and hydrogen influence. Int. J. Fatigue 2022, 155, 106587. [Google Scholar] [CrossRef]
  9. Ruellan, A.; Kleber, X.; Ville, F.; Cavoret, J.; Liatard, B. Understanding white etching cracks in rolling element bearings: Formation mechanisms and influent tribochemical drivers. Part J Proceedings of the Institution of Mechanical Engineers. J. Eng. Tribol. 2015, 229, 886–901. [Google Scholar]
  10. Loos, J.; Bergmann, I.; Goss, M. Influence of Currents from Electrostatic Charges on WEC Formation in Rolling Bearings. Tribol. Trans. 2016, 59, 865–875. [Google Scholar] [CrossRef]
  11. Loos, J.; Bergmann, I.; Goss, M. Influence of High Electrical Currents on WEC Formation in Rolling Bearings. Tribol. Trans. 2021, 64, 708–720. [Google Scholar] [CrossRef]
  12. Holweger, W.; Schwedt, A.; Rumpf, V.; Mayer, J.; Bohnert, C.; Wranik, J.; Spille, J.; Wang, L. A Study on Early Stages of White Etching Crack Formation under Full Lubrication Conditions. Lubricants 2022, 10, 24. [Google Scholar] [CrossRef]
  13. Higginson, D.; Dowson, G.R. A numerical solution to the elasto-hydrodynamic problem. J. Mech. Eng. Sci. 1959, 1, 6–15. [Google Scholar]
  14. Liran, M.A.; Luo, J. Thin film lubrication in the past 20 years. Friction 2016, 4, 280–302. [Google Scholar]
  15. Mathas, D.; Holweger, W.; Wolf, M.; Bohnert, C.; Bakolas, V.; Procelewska, J.; Wang, L.; Bair, S.; Skylaris, C.-K. Evaluation of Methods for Viscosity Simulations of Lubricants at Different Temperatures and Pressures: A Case Study on PAO-2. Tribol. Trans. 2021, 64, 1138–1148. [Google Scholar] [CrossRef]
  16. Fan, F.R.; Xie, S.; Wang, G.; Tian, Z. Tribocatalysis: Challenges and perspectives. Sci. China Chem. 2021, 64, 1609–1613. [Google Scholar] [CrossRef]
  17. Kajdas, C.; Furey, M.J.; Ritter, A.L.; Molina, G.J. Triboemission as a basic part of the boundary friction regime: A review. Lubr. Sci. 2002, 14, 223–254. [Google Scholar]
  18. Nakayama, K. Triboemission, Triboplasma Generation, and Tribochemistry. In Encyclopedia of Tribology; Chung, Q.J., Wang, Y.W., Eds.; Springer: Boston, MA, USA, 2013. [Google Scholar]
  19. Sun, J.; Wood, R.J.K.; Wang, L.; Care, I.; Powrie, H.E.G. Wear monitoring of bearing steel using electrostatic and acoustic emission techniques. Wear 2005, 259, 1482–1489. [Google Scholar] [CrossRef]
  20. Esmaeili, K.; Wang, L.; Terry, J.; Neil, M. White and Walter Holweger. Electrical Discharges in Oil-Lubricated Rolling Contacts and Their Detection Using Electrostatic Sensing Technique. Sensors 2022, 22, 392. [Google Scholar] [CrossRef] [PubMed]
  21. Esmaeili, K.; Zuercher, M.; Wang, L.; Harvey, T.; Holweger, W.; White, N.; Schlücker, E. A Study of White Etching Crack Bearing Failure Detection Using Electrostatic Sensing in Wind Turbine; WCM: London, UK, 2017; pp. 13–16. [Google Scholar]
  22. Wranik, J.; Holweger, W.; Lutz, T.; Albrecht, P.; Reichel, B.; Wang, L. A Study on Decisive Early Stages in White Etching Crack Formation Induced by Lubrication. Lubricants 2022, 10, 2022. [Google Scholar] [CrossRef]
  23. Spille, J.; Wranik, J.; Barteldes, S.; Mayer, J.; Schwedt, A.; Zürcher, M.; Lutz, T.; Wang, L.; Holweger, W. A study on the initiation processes of white etching cracks (WECs) in AISI 52100 bearing steel. Wear 2021, 477, 203864. [Google Scholar] [CrossRef]
  24. Esmaeili, K.; Zuercher, M.; Wang, L.; Harvey, T.; Holweger, W.W.; Neil, S.E. A study of white etching crack bearing failure detection using electrostatic sensing in wind turbine gearboxes. Int. J. Cond. Monit. 2018, 8, 82–88. [Google Scholar] [CrossRef]
  25. Diederichs, A.M.; Schwedt, A.; Mayer, J.; Dreifert, T. Electron microscopy analysis of structural changes within white etching areas. Mater. Sci. Technol. 2016, 32, 1683–1693. [Google Scholar] [CrossRef]
Figure 1. The molecule structure, calculation routine.
Lubricants 11 00045 g001
Figure 2. Molecular Structures–Idealised. (A) Poly-α-Olefine; (B) Alkylnaphtalene; (C) Di-2-ethyl-hexyl-Sebacate; (D) Zinc-2-ethyl-hexyl-dithiophosphate; (E) Boronic Acid Ester; (F) Polymethylmethacrylate–Extracted Idealised Structure Segment; (G) Calciumdodecylsulfonate, overbased–Idealised Structure; (H) Calciumdodecylsulfonate, Neutral–Idealised Structure; (I) Dicyclohexylamine.
Lubricants 11 00045 g002aLubricants 11 00045 g002bLubricants 11 00045 g002c
Figure 3. Relative dipole moment for PAO in x-direction.
Lubricants 11 00045 g003
Figure 4. Relative dipole moment for PAO in y-direction as function of the electrical field.
Lubricants 11 00045 g004
Figure 5. Relative dipole moment for PAO in z-direction as function of the electrical field.
Lubricants 11 00045 g005
Figure 6. Relative Dipole moment for ZndtP (C8) in x-direction as function of the electrical field.
Lubricants 11 00045 g006
Figure 7. Relative Dipole Moment for ZndtP (C8) in y-direction as function of the electrical field.
Lubricants 11 00045 g007
Figure 8. Relative Dipole moment for ZndtP (C8) in z-direction as function of the electrical field.
Lubricants 11 00045 g008
Figure 9. Crossing of PAO and ZndtP in an electrical field (x-direction).
Lubricants 11 00045 g009
Figure 10. PAO and ZndtP in an electrical field (y-direction).
Lubricants 11 00045 g010
Figure 11. PAO and ZndtP in an electrical field (z-direction).
Lubricants 11 00045 g011
Figure 12. Zinc-2-ethylhexyl-dithiophosphate–Calcium-dodecylsulfonate, overbased (x-direction).
Lubricants 11 00045 g012
Figure 13. Zinc-2-ethylhexyl-dithiophosphate–Calcium-dodecylsulfonate, overbased (y-direction).
Lubricants 11 00045 g013
Figure 14. Zinc-2-ethylhexyl-dithiophosphate–Calcium-dodecylsulfonate, overbased (z-direction).
Lubricants 11 00045 g014
Figure 15. Zinc-2-ethylhexyl-dithiophosphate–Calcium-dodecylsulfonate, neutral (x–direction).
Lubricants 11 00045 g015
Figure 16. Zinc-2-ethylhexyl-dithiophosphate–Calcium-dodecylsulfonate, neutral (y -direction).
Lubricants 11 00045 g016
Figure 17. Zinc-2-ethylhexyl-dithiophosphate–Calcium-dodecylsulfonate, neutral (z-direction).
Lubricants 11 00045 g017
Figure 18. Crossing Activity factor A for a binary mixture of Zinc-2-ethylhexyl-dithiophosphate and Calciumdodecylbenzenesulfonate, overbased across the x, y, z space.
Lubricants 11 00045 g018
Figure 19. Crossing Activity factor A for a binary mixture of Zinc-2-ethylhexyl-dithiophosphate and Calciumdodecylbenzenesulfonate, neutral, across the x, y, z space.
Lubricants 11 00045 g019
Table 1. Molecules list.
APoly-a-Olefine (ISO VG 46)Baseoil
BAlkylated NapthaleneBaseoil and Adjuvant
CDi-ethylhexyl-SebacateBaseoil and Adjuvant
DZinc-2-ethylhexyl-dithiophosphateAnti Wear Additive
EBoronic Acid EsterAnti Wear Additive
FPoly-methyl.methacrylate Viscosity Improver
GCalcium-dodecylsulfonate, overbasedCorrosion Inhibitor
HCalcium-dodecylsulfonate, neutral Corrosion Inhibitor
IDi-CyclohexylamineCorrosion Inhibitor
Table 2. Different oil compositions and their chemical WEC factor.
Oil/Oil Number123456789
PAOx xxxxxx
Alkylnaphtalene x
ZndtP x xxxx
Boronic Acid Ester x
Ca-Sulfonate neutral x
Ca-Sulfonate overbased x
Polymethylmethacrylate x
Dicyclohexylamine x x
Perfluorinated Oil x
WEC Predictor000.0400.152.965.014.719.30
Reference result[12] [3] [12][25]
Table 3. Comparison between WEC predictor and conducted tests.
OilPurposePredictorWECSIF/ Pitting
YesNo
L1R&D0 xx
L2R&D6.6x
L3R&D0.15 x
L4R&D0.016 x
L5R&D0.007 x
L6R&D1.43 x
L7R&D4.7x
L8R&D0.176 x
L9R&D5.01x
L10R&D0
L11R&D0 x
L12R&D4.71x
L13I7.6x
L14I6.7x
L15I6.06x
L16R&D4.71
L17R&D4.71
L18R&D4.71x
L19I0 x
L20I0.24 x
L21I0.86 x
L22I1.3 x
L23I5.82x x
L24I2.81x x
L25I0.992 x
L26I4.24x
L27I3.85x
L28I1.12 x
Disclaimer/Publisher’s Note: The statements, opinions and data contained in all publications are solely those of the individual author(s) and contributor(s) and not of MDPI and/or the editor(s). MDPI and/or the editor(s) disclaim responsibility for any injury to people or property resulting from any ideas, methods, instructions or products referred to in the content.

