Article

Effect of Varying the Volume Fractions of Ledeburitic Cementite and Graphite on the Tribological Properties of Commercially Used Cast Irons

Faculty of Metals Engineering and Industrial Computer Science, AGH University of Krakow, A. Mickiewicza 30, 30-059 Krakow, Poland
*
Author to whom correspondence should be addressed.
Lubricants 2023, 11(12), 498; https://doi.org/10.3390/lubricants11120498
Submission received: 18 August 2023 / Revised: 14 November 2023 / Accepted: 18 November 2023 / Published: 22 November 2023
(This article belongs to the Special Issue Frictional Behavior and Wear Performance of Cast Irons)

Abstract

:
The types and volume fractions of the carbonaceous phases present in the microstructures of cast irons strongly influence their properties. In the case of materials used commercially for tools, an important parameter with regard to their use is the resistance to abrasion wear. Cementite is the main reinforcing phase in cast irons and is present in significant quantities. In addition, cast irons contain graphite precipitates, which also affect wear by interacting with the matrix of the alloys. In this study, abrasive wear tests were carried out on a group of cast irons with different chemical compositions and, consequently, different microstructural morphologies. Due to the wide scatter of the results and the commercial rather than laboratory nature of the alloys studied, it was decided to use analysis of variance (ANOVA) to determine whether there was a statistically significant difference between the volume fractions of the carbonaceous phases. The volume fractions of graphite and ledeburite were then related to the results of the tribological tests. Statistical analysis confirmed significant differences in the results obtained for the alloys tested. A continuous increase in the volume fractions of both graphite and ledeburitic cementite is unfavourable in terms of the wear resistance and friction coefficient values. Optimum results can be obtained by balancing the volume fractions of the two phases observed. In addition, the phase composition of the material matrix plays an important role in wear, as the differences in the matrix of the tested alloys modify the nature of the influence of cementite and graphite on the wear.

1. Introduction

Carbides play an important role in the microstructures of tool materials. Particularly for materials such as cast iron, it is important to achieve an appropriate volume fraction and morphology in terms of the carbide phases in the alloy. In particular, for materials containing a significant volume fraction of carbide precipitates, their presence should be associated with an increase in wear resistance [1,2,3,4,5].
An analysis of the effect of the carbon content on the wear of high-carbon tool iron alloys shows that for materials containing less than 2.5 wt.% carbon, the wear resistance of the material is largely determined by the matrix of the material being investigated. As the carbon content increases, the importance of the carbides present in the matrix increases. In the case of high-stress rolling–sliding contact, carbon contents close to 2.5% show the best properties. Here, carbides, together with a martensitic matrix and thermodynamically stable retained austenite, effectively increase tribological wear resistance. In contrast, a significant increase in the proportion of the carbide phase in the material leads to cracking of the carbides and their subsequent removal from the matrix, which intensifies the wear processes [6,7,8]. A continuous increase in the volume fraction of carbide precipitates will also create a fracture problem. An increase in the volume fraction of carbides can lead to chipping and cracking, which intensify the wear process. The cracking of carbides precipitated in a complex morphology increases as the forces applied to the material during the test increase. It has been observed that the fracture toughness of the material increases as the heterogeneity of the distribution of the carbides in the microstructure and their size increases [7,9,10,11,12,13,14].
In the case of cast irons containing graphite in the matrix, the main concern is the role of the material matrix in wear. Graphite is considered to be a structural element that, by reducing the carbon concentration, can alter the surrounding matrix and soften the material. It can be observed that, in the case of spheroidal graphite, its effect on material wear is negligible. The deformation of the graphite regions and the surrounding matrix as a result of high stresses during the tribological testing could lead to a reduction in wear resistance. In the case of an impact wear mechanism, graphite areas can provide easy nucleation sites for fracture formation [2,15,16,17,18].
The complexity of the wear processes for high-carbon steels has led to the assumption that it is reasonable to use statistical tools to evaluate the influence of individual material structure elements on the final wear resistance of the material being tested. This approach is already used in various aspects of materials testing. It is often used in the testing of sintered materials, where the microstructure contains significant porosity, which can lead to substantial variations in the results, particularly in terms of the mechanical properties. Statistical analysis of variance (ANOVA) has been used to optimise the sintering process and heat treatment of sintered Fe–Mn–Cr–Mo–C steels. Analysis of variance was used to determine the relationship between the sintering temperature, sintering atmosphere and heat treatment parameters. It was possible to identify the main variables influencing the hardness results obtained [19,20,21]. In tribological studies, ANOVA was also used to determine the effect of lubricants on the microstructure and surface quality of steel after machining. The results of the statistical analysis indicate that the use of the correct amount and type of oil has a significant influence on the tool wear and the condition of the material surface after machining, both from an environmental and economic point of view [22]. ANOVA was also used to evaluate the results of tribological tests on aluminium matrix composites, where the influence of manufacturing parameters on the tribological properties of these alloys was analysed. The morphology and distribution of the reinforcing phases were analysed and confirmed as the main parameters affecting the wear resistance and friction coefficient values [23].
In order to describe the influence of the carbides and graphite present in high-carbon materials, it was decided to use commercially available cast irons and to obtain test material from decommissioned metallurgical rolls. All the alloys studied are designed for use in severe abrasive wear conditions, so describing the influence of their microstructures on tribological wear is an interesting issue. In addition, material obtained from tools in industrial use allows the actual state of the microstructure to be studied, rather than material produced in a laboratory under controlled conditions.
As the alloys studied are commercial alloys, it was important to confirm the significance of the differences observed in the microstructures of the studied materials. In addition, the chemical compositions of the materials tested are similar, so it is important to confirm the statistical differences between them. The use of analysis of variance (ANOVA) provides an indication of the extent to which a variable influences the outcome of the test. ANOVA was used to indicate the statistical significance of the effect of the volume fractions of ledeburitic cementite and graphite on the tribological test results.

2. Materials and Methods

The test materials included seven commercially used cast irons designed for use in steel mill rolls. The materials tested were selected on the basis of their wide range of chemical compositions, all being within the range of sub-eutectic cast irons containing both ledeburitic cementite and graphite. The chemical compositions of the alloys studied are given in Table 1.
The carbon content of the tested materials varies around 3 wt.% (3.04–3.50%). Significant differences can be observed in the contents of other alloying elements, such as nickel (1.23–3.45%), chromium (0.28–1.37%), silicon (0.65–2.19%) and molybdenum (0.17–0.86%). The high carbon, nickel and silicon contents result in the presence of graphite in the microstructures of the alloys tested.
Tribological tests on the alloys studied were carried out using a T-05 tribometer in a block-on-ring friction system (Institute for Sustainable Technologies, Radom, Poland) with a friction distance of 1000 m. The tests were performed under a load of 100 N, without lubricant. A counter sample of 100Cr6 bearing steel, heat-treated to a hardness of 52 ± 2 HRC, was used in the friction node. The tribological tests involved recording changes in the friction force values and measuring the amount of wear, expressed as the mass loss of the specimen after the tribological tests. The specimens used for the tests were 4 × 4 × 20 mm. Six independent wear tests were carried out for each test material. Before and after each test, each specimen was weighed on a laboratory balance (ABP 100-4M balance, MERAZNET, Poznan, Poland).
The next stage of the research was to analyse the microstructure of the material in the cross-section of the worn surface. The microstructure of the material was then documented using a light microscope (AxioVERT 200MAT, Zeiss, Chrzanów, Poland). Photographs of the microstructure were used to carry out a quantitative analysis of the carbide precipitates present in the studied alloys, i.e., the volume fractions of graphite and ledeburite carbides. The volume fraction of the carbide phases was estimated using the SigmaSccan Pro software (SPPSS Inc., San Jose CA, USA, 4.0 Version). Ten independent measurements were performed for each material tested. Each measurement was performed on the new area of the material. Hardness tests were also carried out using a Vickers indenter with a load of 294 N (SHV-5000M, PowerTech S.C., Grojec, Poland). The high load during the test allowed macroscopic hardness analysis to be carried out, with no significant scatter due to the strengthening phases present in the material. For each sample, three measurements were taken on the surfaces subjected to friction after the tribological tests.
The results of the tribological tests, along with the hardness measurements and the quantitative measurements from the microstructure analysis, were used for statistical analysis. One-factor and two-factor analyses were carried out. The one-factor analysis was carried out to confirm the statistical differences between the materials analysed. The results of the ANOVA analysis, together with the post hoc Tukey test, allowed the grouping of the tested materials according to the statistical differences in the tested parameters. The two-factor analysis showed the influence of the material microstructure on the tribological test results and the role of the material hardness in the wear process. A confidence level of α = 0.05 was used to verify the statistical hypotheses. Statistical analysis was performed using Minitab software (distributed by TQMSoft, Kraków, Poland) (https://www.minitab.com/en-us/support/minitab/minitab-software-updates/).

3. Results

3.1. Tribological Tests Results and Microstructure of the Investigated Material

The first stage of the research was to carry out tribological tests on the analysed materials. The results of the tribological tests for all the alloys studied are presented in Table 2. The table also includes the average hardness of each of the cast irons.
The tests carried out show noticeable differences in the tribological test results for each of the cast irons. To better illustrate the differences between the alloys tested, the measurement results are shown in Figure 1.
Analysing the results obtained, it can be concluded that the materials tested show an observable difference in terms of the mass loss, coefficient of friction and hardness. The correlation between the parameters tested is not easy to establish. It can be observed that in the case of the P4, P5 and P6 alloys, an increase in the mass loss is observed as the hardness of the materials decreases. Simultaneously, the hardness similarity of alloys P1, P2, P3 and P6 does not correspond to their wear resistance. As a result, the hardness of the materials tested could not be considered the most important factor in determining the wear resistance of the materials. Similarly, the friction coefficient averages obtained during testing do not directly correlate with the observed bulk wear values of the alloys or their hardness. It was decided to correlate the results of the tribological tests with the microstructures of the materials. In order to characterise the microstructure, it was decided to carry out a quantitative analysis of the precipitates present in the material, which are expected to play an important role in the wear [24,25,26,27]. The first stage of this research was to document the microstructures of the alloys studied. Images of the microstructure of each of the cast irons are shown in Figure 2.
The results of the microstructural documentation showed that all the materials tested were characterised by the presence of both eutectic carbides and graphite precipitates in their microstructure. The cementite and graphite precipitates were identified in the representative microstructure photographs. The first cast iron is characterised by a pearlitic matrix with precipitates of ledeburitic cementite and spheroidal graphite. The clear dendritic character of the material microstructure is observed. Clear bands of segregated ledeburitic carbides are observed. A similar composition in terms of the material microstructure can be observed for the second alloy, although the graphite precipitates are larger than for the first alloy. The volume fraction of ledeburitic cementite in the P2 alloy microstructure is lower compared to alloy P1. Alloy P3 is characterised by a pearlitic matrix with spheroidal graphite and ledeburitic cementite precipitates. The cementite precipitates are smaller than in P1 and P2. In the case of the P4 cast iron, the matrix of the material is bainite. The morphology of the precipitates in this alloy is similar to the P1 alloy. Alloy P5 is characterised by a pearlitic–bainitic matrix, which is morphologically similar to the microstructure of alloy P3. Compared to the third cast iron, the cementite precipitates in the microstructure of alloy P5 are larger. In contrast, cast irons P6 and P7 are characterised by the flake-like morphology of the graphite and bainitic matrix observed for alloy P6 and pearlitic for alloy P7, respectively. In addition, the volume fraction of ledeburitic cementite precipitates in the material matrix is higher in alloy P7 than in alloy P6.
Analysis of the microstructures of the alloys studied reveals significant differences between them. The different phases observed in the matrix influence the hardness of the alloys studied. It can be observed that the hardness of the materials increases with the appearance of bainite in the microstructure (P4−Figure 2). However, this relationship does not apply to all the materials. In the case of alloy P6, the hardness of the material is similar to that of materials P1–P3, although the matrix of material P6 is bainite and that of P1–P3 is perlite.

3.2. Quantitative Analysis of Precipitate Volume Fractions in the Microstructures of Materials under Investigation

The quantitative analysis of the microstructures of the alloys studied was focused on when determining changes in the volume fractions of carbon-containing phases in the alloys studied. The main parameter was the volume fractions of cementite and graphite. The studied parameter was determined from randomly taken photographs of the microstructures of the analysed materials. The results of the quantitative analysis of the changes in the volume fractions of ledeburitic cementite and graphite are presented in Table 3.
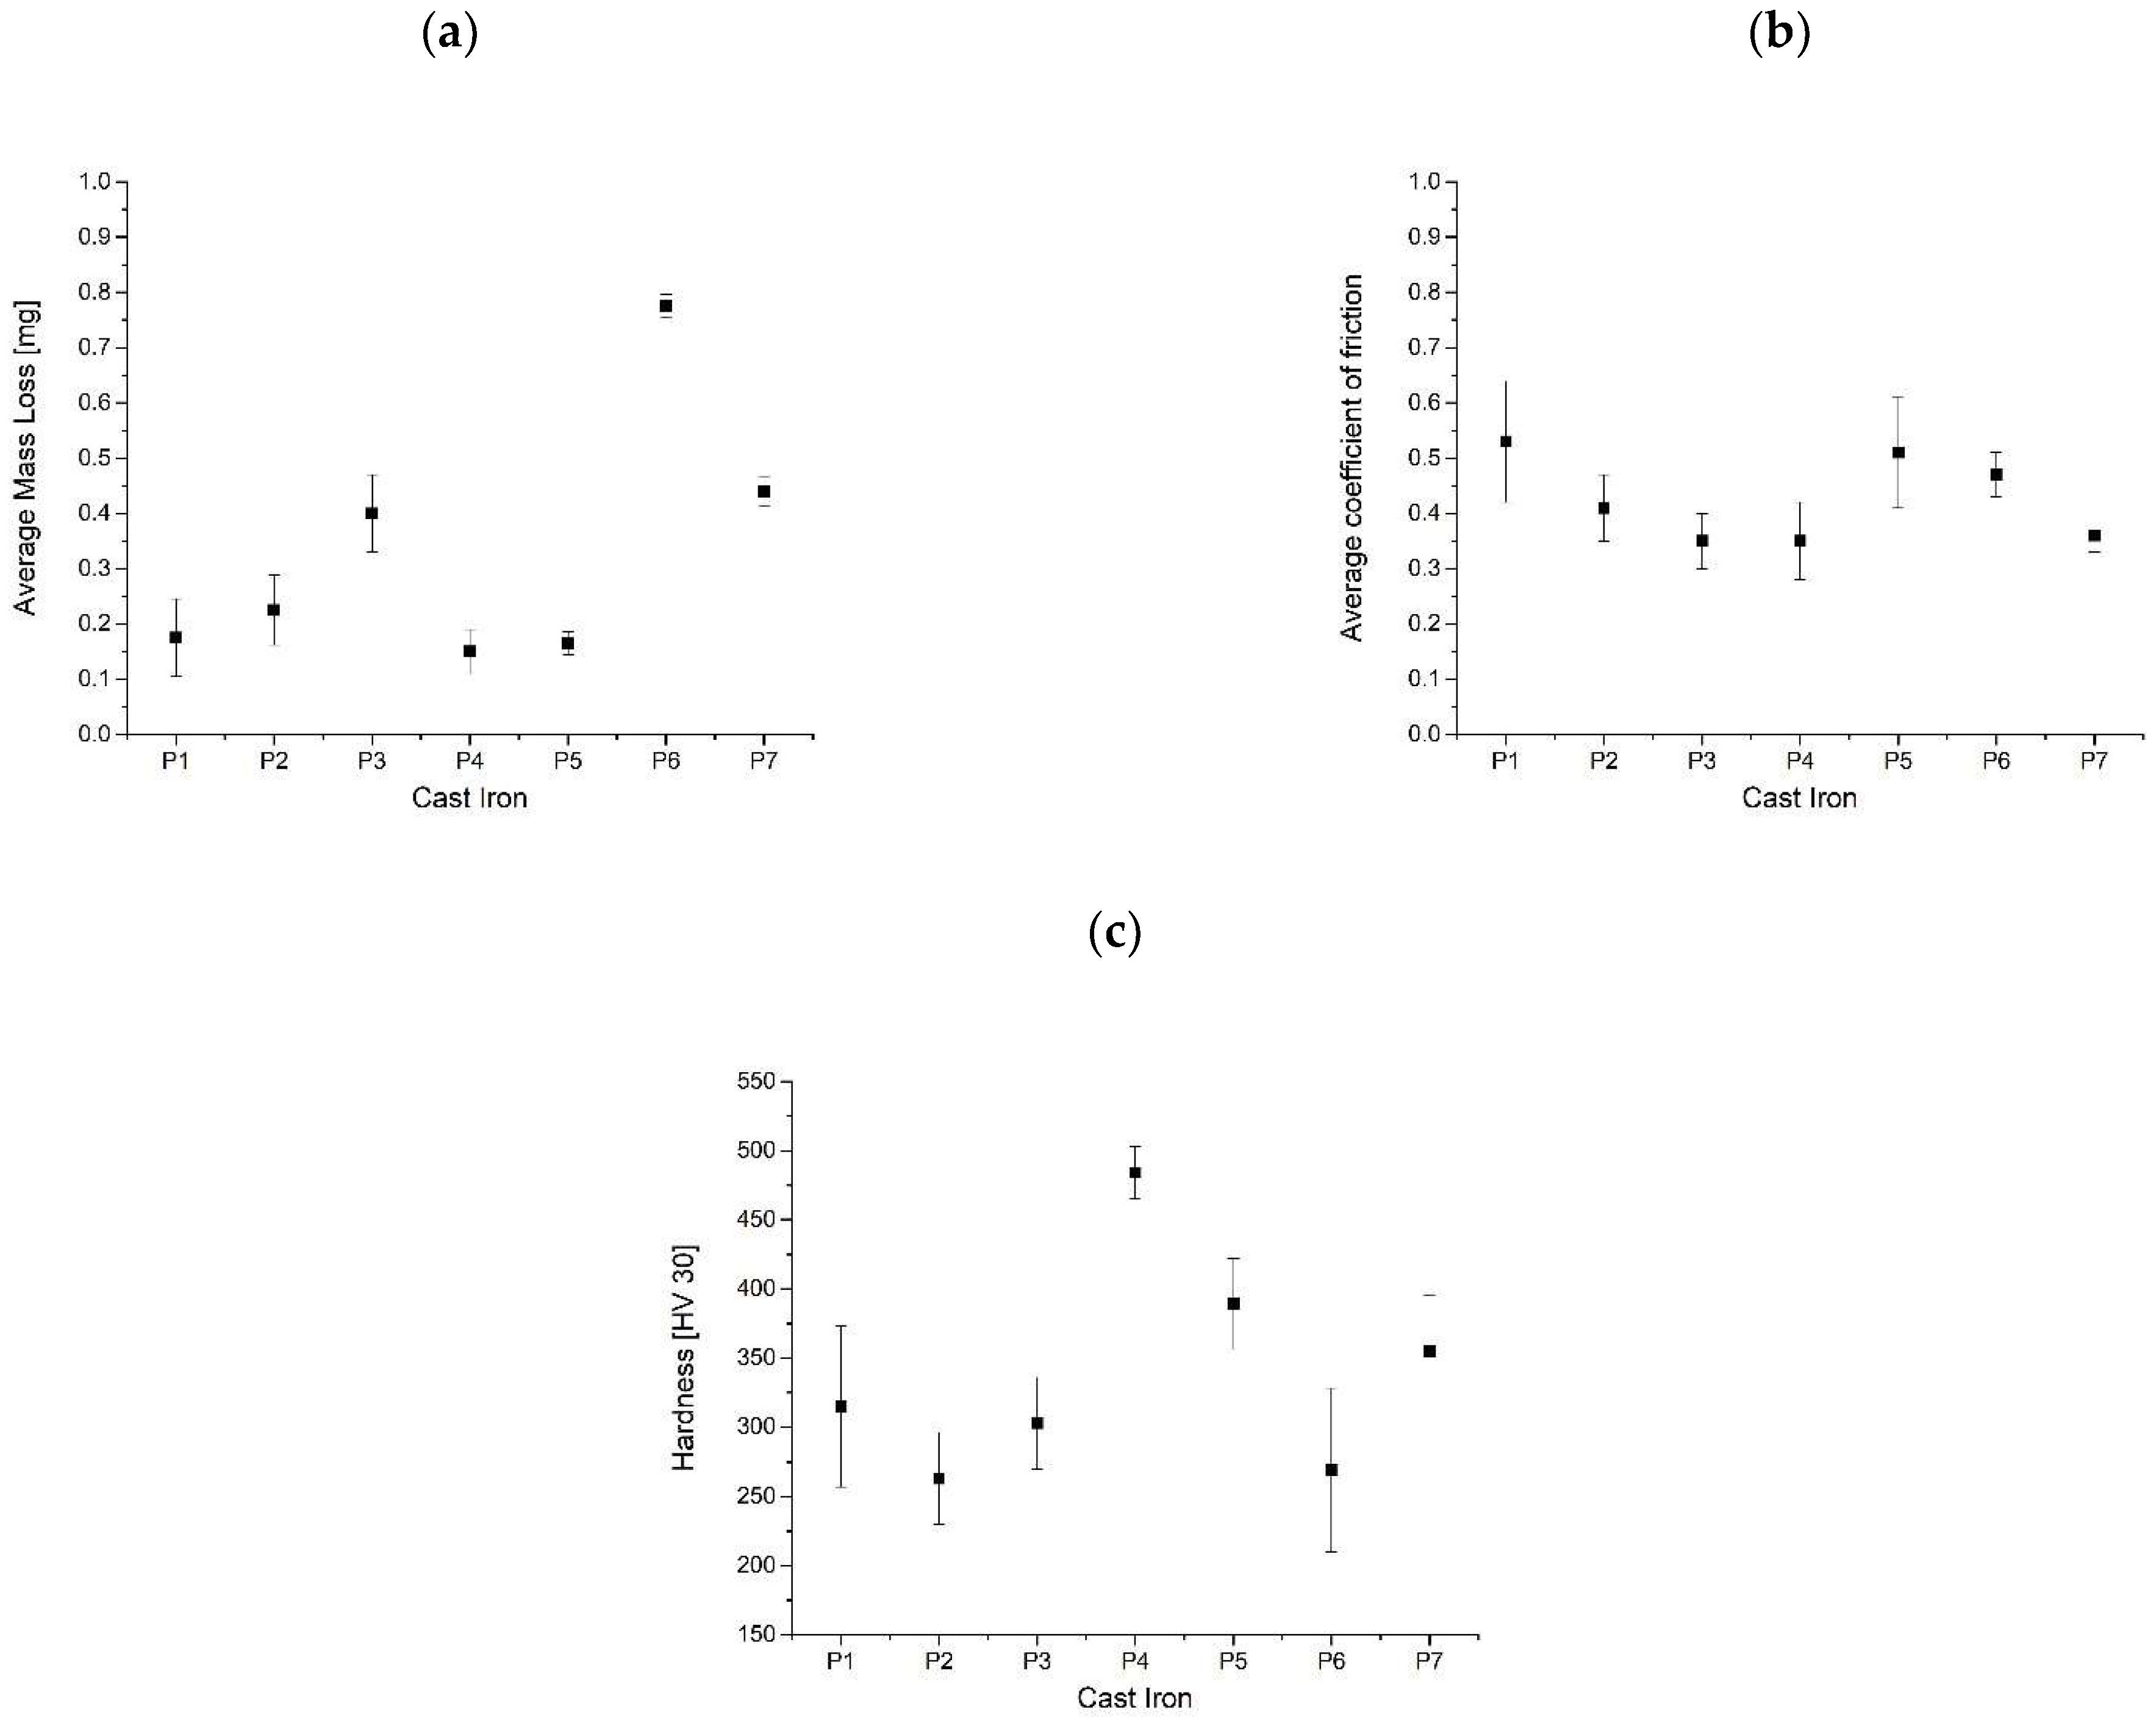
Analysis of the changes in the graphite content and ledeburite precipitates shows some correlation between their volume fractions. When comparing the P1 and P2 alloys, an increase in the graphite content can be observed. The graphite content then decreases in the P3 and P4 cast irons compared to P2. Cast irons P5 and P6 have a higher graphite content, reaching a value similar to that of cast iron P2. Sample P7 has a lower volumetric graphite content than P6, comparable to material P4. An inverse relationship is observed for the ledeburitic cementite content. Changes in the cementite volume fraction are the inverse of changes in the graphite content, with the magnitude of the changes in the ledeburitic cementite volume fraction being greater than the changes in the graphite content. Larger changes in the cementite content are associated with lower carbon concentrations in cementite compared to graphite.

3.2.1. Analysis of Variance (ANOVA) for the Investigated Materials

The results of the microstructure and hardness tests were analysed by means of ANOVA (both one-factor and two-factor) using Minitab statistical software. One-factor ANOVA was used to evaluate the significance of the differences in the materials tested-percentage of graphite and ledeburitic cementite and hardness. A two-factor ANOVA was used to assess the dependence of the tribological parameters-mass loss and coefficient of friction-on the microstructure (volume fractions of graphite and ledeburitic cementite) and hardness of the cast irons tested.
The results of the one-factor analysis of variance, carried out using the Minitab statistical program, are presented in Table 4. The results of the analysis are limited to the F-statistic (F-value), p-value for ANOVA, R2 and p-value for Leven’s test.
The ANOVA performed for the graphite, ledeburitic cementite volume fraction and hardness (Table 4) showed that, in all cases, the null hypothesis of the equality of the means for individual cast irons should be rejected. A p-value of 0.00 at an assumed significance level of 0.05 indicates that at least some of the cast irons tested differ significantly in terms of the parameters analysed. Based on the results obtained, it can be observed that the factors that most significantly influence the properties of the alloys studied are the cementite content and hardness. The strength of the influence of the factors was assessed via the value of the R2 coefficient. The weakest relationship is observed for the percentage of graphite. The hardness of the alloys tested is influenced by the other factors analysed and therefore further analysis was required. As the null hypothesis of the equality of the means at all levels was rejected, Tukey’s post hoc tests were performed and the results are shown in Table 5.
Based on the results of the Tukey tests, the cast irons were divided into five groups for each phase (% graphite, % cementite, hardness). Each group is characterised by a different volume fraction of the examined phase or hardness. The differences between the groups are statistically significant. For example, the volume fractions of graphite for the P6, P2 and P5 cast irons are statistically the same but different from group B, which contains the P5, P1 and P3 alloys, although from the statistical point of view, the P5 cast iron is not statistically different from the P2 and P1 alloys. However, there is a statistical difference between the P1 and P2 alloys.
For the volume fraction of graphite, the greatest differences in the mean values are between groups A (represented by samples P6 and P2) and C (represented by samples P7 and P4). In the case of the cementite percentage, samples P7, P4 and P1, labelled A, B and C, respectively, are statistically different from the others, which significantly affects the result of the analysis. In the case of hardness in the Tukey test, its value for cast iron P4 is the only one that does not repeat throughout the test.

3.2.2. Two-Way ANOVA for the Investigated Materials

In order to evaluate the influence of carbide precipitates on the hardness and tribological properties of the cast irons tested, a two-factor analysis of variance was carried out, which required appropriate data preparation.
Based on the results of the Tukey test (Table 5), the cast irons were divided into groups that differed (statistically) in the volume fractions of graphite (Table 6) and ledeburitic cementite (Table 7).
Based on the data presented in Table 5 and Table 6 above, two-dimensional matrices were constructed showing the average values of the hardness (Table 8), friction coefficient (Table 9) and mass loss (Table 10) for each group of cast irons. To facilitate visual assessment of the results, the lowest values have been highlighted in green and the highest in red Intermediate colours between red and green indicate intermediate measurement values.
The matrices prepared in this way (Table 8, Table 9 and Table 10) were used to perform a two-factor ANOVA where the first factor was the graphite content of the cast irons and the second factor was the volume fraction of cementite. The results of the analysis are shown in Table 11.
The two-factor analysis of variance performed showed a relationship between the volume fractions of ledeburitic cementite and graphite as well as the tribological properties and hardness. The numerical values obtained from the analysis show that the carbide phases have the strongest effect on the friction coefficient and hardness of the material. The R2 coefficient for these variables is the highest. In contrast, the lowest value of the R2 coefficient was obtained for the mass loss.
On the basis of the results obtained from the two-factor analysis of variance and the values obtained for the R2 coefficients of determination, it was decided to analyse the relationship between the hardness of the materials tested and the values of the coefficient of friction and mass loss for the cast irons investigated. The linear regression plot for this comparison, together with the marked confidence interval (green area) and prediction interval (purple area) for a statistical probability value of 95%, are shown in Figure 3.
Analysis of the results obtained shows that the coefficient of friction determined for the materials tested does not depend on the hardness of the materials tested. The regression results obtained show that the goodness of fit R2 is only 7%. Similarly, in the case of the Pearson coefficient, the value is around 0.26. These values are small and there is a risk that the hardness of the tested materials does not have a significant effect on the observed friction coefficient values, which depend on other material parameters. As in the case of the coefficient of friction, it is also observed that the mass loss of the test specimens decreases with increasing hardness. However, the coefficient of determination R2 is only 26.6%, indicating that the observed relationship is also weak. Based on these analyses, it can be concluded that material hardness is not the main parameter responsible for the tribological properties of the tested alloys (Figure 3).
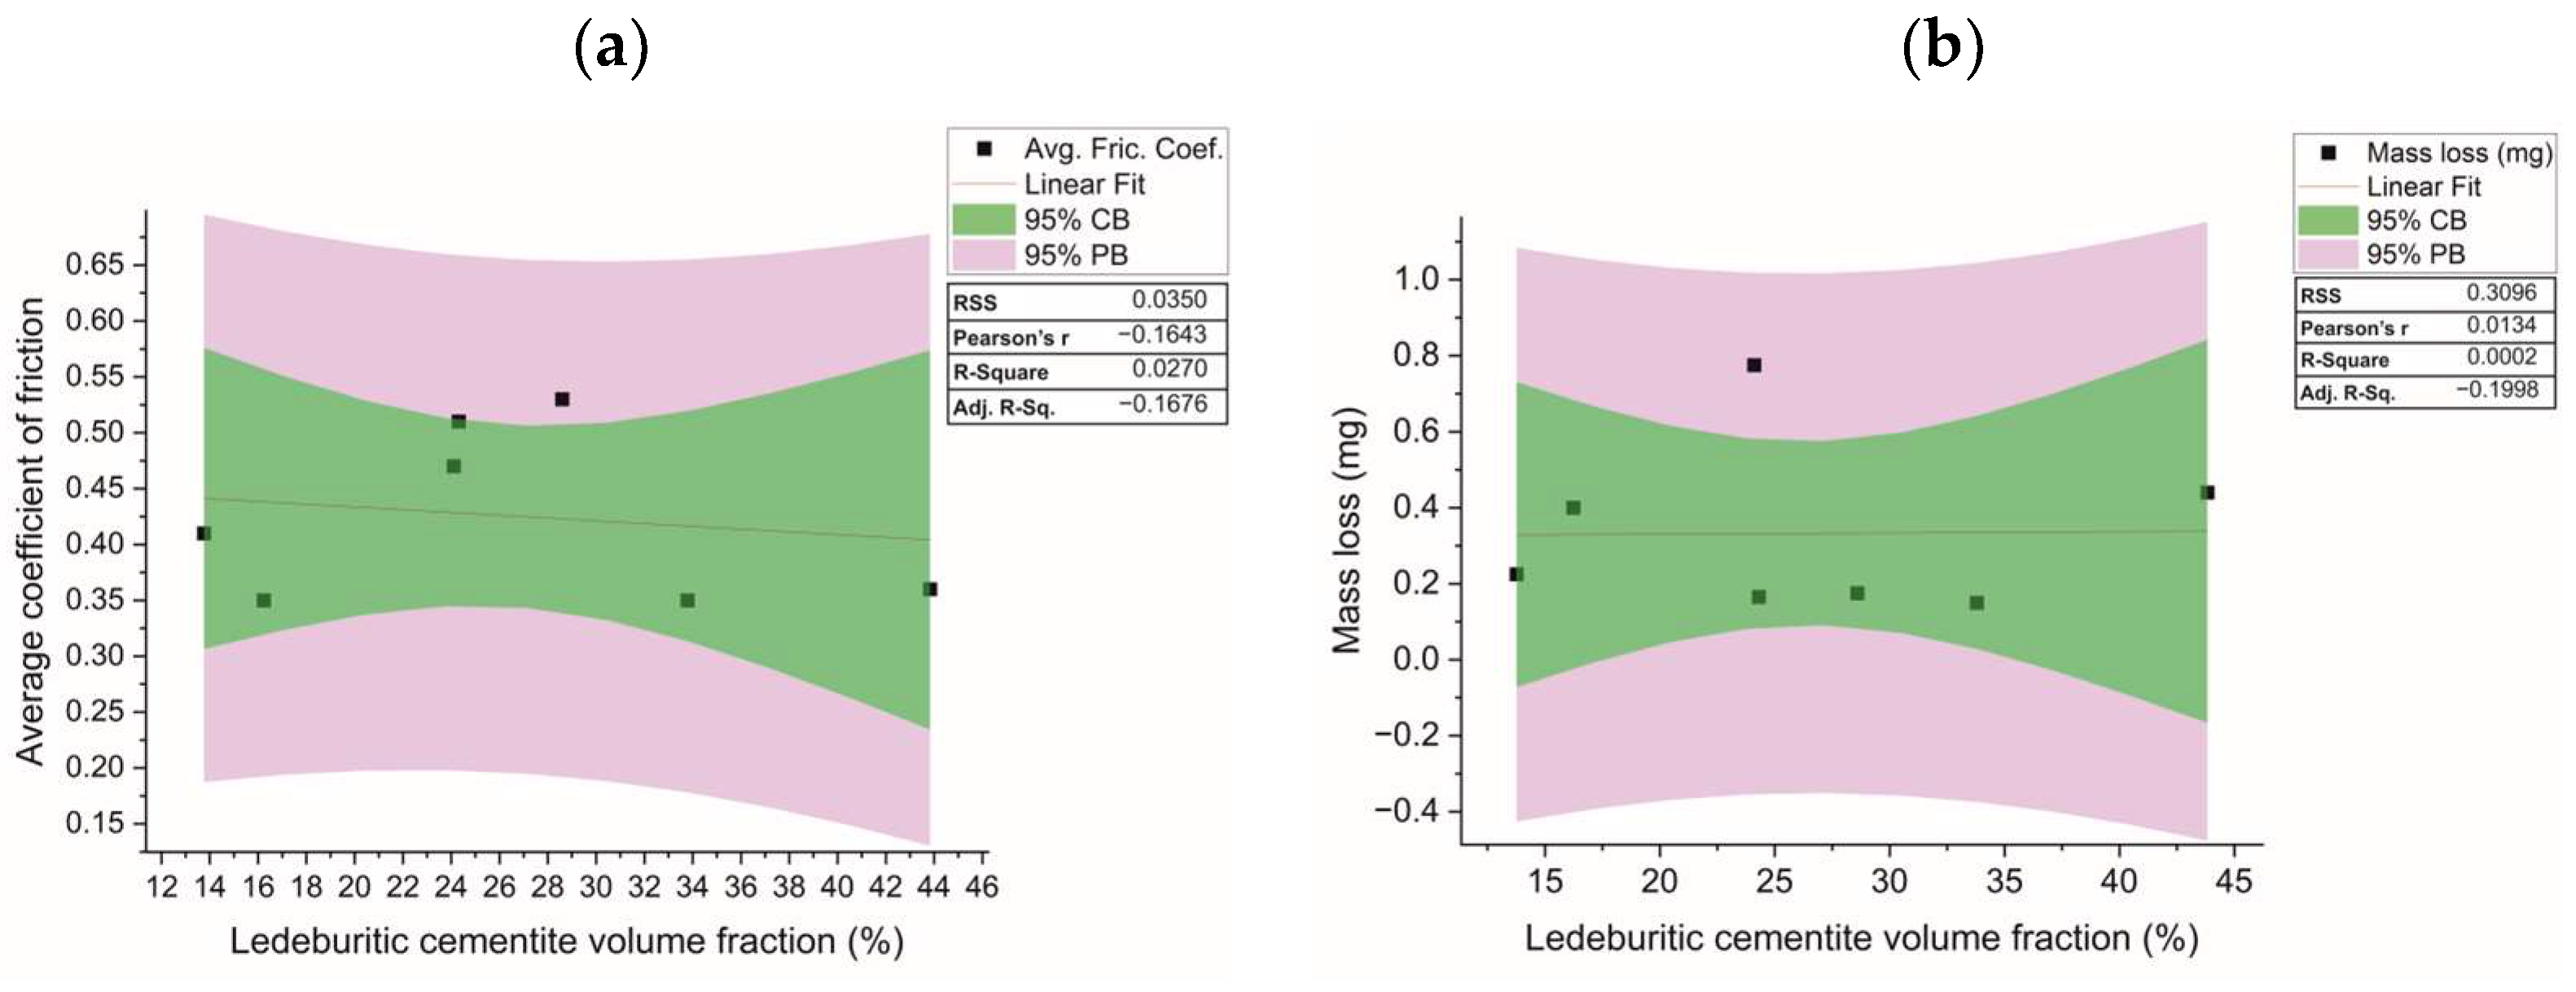
The next comparison was to relate the mass loss values and the friction coefficient to the ledeburitic cementite volume fraction for the materials tested. The regression curve with the prediction lines and confidence interval is shown in Figure 4.
Similarly, when analysing the effect of hardness on the average friction coefficient and mass loss of the samples, it can be observed that an increase in the volume fraction of ledeburitic cementite in the materials studied does not show a simple linear correlation with either the friction coefficient value or the mass loss of the samples. The correlation coefficient R2 is approximately 2.7% for the average friction coefficient and 0.2% for the mass loss of the samples. As in the case of hardness, the influence of the changes in the volume fraction of ledeburitic cementite on the results of the tribological tests cannot be explained by a linear relationship.
The regression curve with the prediction ranges for the effect of the changes in the volume fraction of graphite on the average coefficient of friction and mass loss of the samples is shown in Figure 5.
By analysing the correlations between the changes in the volume fraction of graphite and the value of the friction coefficient and mass loss, it can be observed that both parameters from the tribological test increase as the volume fraction of graphite increases. The value of the correlation coefficient R2 is 28.8% for the friction coefficient and 12.3% for the mass loss, respectively. The strength of the correlation, as in the case of hardness and the changes in the volume fraction of cementite, is very weak.
However, this is a comparison of the effect of one parameter on the studied variable. It was therefore decided to compare the results of the tribological tests with the results of the graphite and ledeburitic cementite volume fractions for each of the alloys analysed. The results of the comparison of the effects of the ledeburitic cementite and graphite contents on the mass loss and friction coefficient are shown in Figure 6. The value of the friction coefficient is presented in the form of a colour map, as same as in Table 8, Table 9 and Table 10.
If the results of the tribological tests are compared with the volume fractions of cementite and graphite, it can be seen that the lowest mass loss values are observed for alloys P1, P2, P4 and P5. These alloys are characterised by a practically linear relationship of change between the cementite and graphite volume fractions. As the volume fraction of graphite increases, a gradual decrease in the cementite content is observed. In contrast, in materials such as P6 and P7, where extreme values for the proportion of graphite and ledeburite are observed, the values are higher (Figure 6a). The higher ledeburitic cementite content has a greater influence on the increase in the wear resistance of the material. Conversely, the highest volume fraction of graphite results in the lowest wear resistance.
Analysing the changes in the coefficient of friction, it can be seen that the highest value of this parameter is observed for alloys P1 and P5. On the other hand, the lowest value is observed for alloys P3, P4 and P7. Alloys P2 and P6 have intermediate values (Figure 6b). No direct relationship is observed between the amount of graphite or ledeburitic cementite and the change in the coefficient of friction during the test. It can also be observed that the coefficient of friction is not related to the wear resistance of the material. For the two lowest values of mass loss (P4 and P5 alloys), the values of the coefficient of friction are extremely different.

4. Discussion

The research carried out shows the high complexity of the friction process of the cast irons studied. The study of the materials used commercially in industry poses some problems due to their considerable diversity. It is not possible, as in the case of materials obtained under laboratory conditions, to specify a single parameter to be analysed. Therefore, the use of statistical tools in the analysis of commercial materials is highly justified. The use of ANOVA made it possible to confirm the significance of the differences observed in the materials. The results of the microstructure and hardness analyses differed significantly for each of the cast irons tested. This was particularly significant in terms of the significant scatter in the results resulting from the non-equilibrium nature of the material crystallisation. It was subsequently demonstrated that the volume fraction of carbon-rich phases has a statistically significant influence on the tribological properties and hardness of the alloys tested. However, clear conclusions regarding the differences observed cannot be drawn from the use of statistical tools. It has been shown that the hardness of the material, which is usually considered to be a determinant of wear resistance, does not show a strong correlation with the results obtained from the tribological tests. For the volume fractions of cementite and graphite, similar results were obtained. The relation between the changes in the volume fraction of the phases tested and the tribological test results cannot be accurately described by a simple linear relationship. However, the influence of the volume fractions of graphite and ledeburitic cementite on the tribological test results was confirmed to be statistically significant. Therefore, the observed differences in the tribological test results may be related to changes in the volume fractions of the two microstructural components considered in terms of balancing their volume fractions in the material. In particular, it can be observed that this is relevant for the mass loss of the specimens after the tribological test. The lowest values of mass consumption are observed for a linear relationship between the volume fractions of ledeburitic cementite and graphite. When this dependence is close to linear, the lowest wear values are observed (Figure 6a). At the same time, a significant decrease in the amount of cementite results in the more intensive wear of the sample (alloy P2). When there are significantly more carbides in the microstructure (alloy P7), the increase in the mass loss of the sample is related to the presence of large areas of cementite that can fracture during the test. When the carbide content is lower than the assumed linear relationship (alloy P3), they do not effectively strengthen the alloy to improve its wear resistance. This is related to the morphology of the carbide precipitates in the material. For materials containing a significant amount of cementite, a smaller size of precipitates is conducive to improved wear resistance. On the other hand, with a higher graphite content, the presence of larger cementite precipitates effectively reduces the wear resistance of the material. It can be seen that at the highest graphite content (around 14%), a reduction in the carbide content is more favourable in terms of abrasive wear. In the case of the similar graphite content observed in the P2 and P6 materials, the higher cementite content did not improve the wear resistance. The matrix of the material tested is also important. It can be observed that, in the case of samples with a pearlitic matrix, the highest wear resistance is exhibited by material P1, which is characterised by the highest content of ledeburitic cementite. On the other hand, where the proportion of this structural component is comparable to that of the P2 and P3 alloys, the size of the cementite precipitates is important, with larger precipitates leading to a greater improvement in wear resistance. In the case of the bainitic specimens, their mass loss is at a very low level, although a higher volume fraction of ledeburite reduces the mass loss, albeit only slightly. As the ledeburitic cementite content increases, the wear resistance of the material improves.
It is not possible to draw such far-reaching conclusions when analysing the changes in the coefficient of friction values. It can be assumed that the tested materials can be divided into three groups with regard to the value of the coefficient of friction. The first group is characterised by a low coefficient of friction. The second group is characterised by an average value of the coefficient of friction and the third group by the highest value of this parameter. The presence of a large number of fine cementite precipitates is significant in the first group. An increase in the graphite content does not cause any changes in the coefficient of friction, as long as it is compensated for by a decrease in the proportion of ledeburite of about the same size. In the second group, intermediate friction coefficient values are observed for the alloys with the largest areas of ledeburitic cementite and high graphite contents. The spherical morphology of graphite is conducive to lower friction coefficient values, probably related to the more homogeneous strengthening of the material (Figure 1c). In the third group, both a high graphite content and ledeburitic cementite content are observed, which may be reflected in a high coefficient of friction value.

5. Conclusions

As a result of this research work, the following conclusions can be drawn:
  • The commercial cast irons studied, which are characterised by a sub-eutectic chemical composition, show both statistically significant differences in the volume fractions of ledeburitic cementite and graphite present in the microstructure. Differences are also observed in the matrix of the alloys studied.
  • Using two-factor analysis of variance, it can be seen that the volume fraction of ledeburitic cementite, the volume fraction of graphite and the hardness of the alloy have a statistically significant effect on the mass loss of the test specimens and the coefficient of friction value obtained during the test.
  • The relationship between the hardness of the tested material and the mass loss of the specimens and the average value of the coefficient of friction shows a small R2 value. Therefore, a simple relationship between the hardness of the tested alloys and the results of the tribological test cannot be established. The influence of the hardness of the tested alloy is related to the material strengthening via ledeburitic cementite precipitation and the material matrix.
  • A comparison of the volume fractions of graphite and ledeburitic cementite with the coefficient of friction and mass loss also shows no clear relationship. It can be observed that the dependence of the mass loss of the samples and the friction coefficient on the volume fraction of graphite shows a more linear character than for the volume fraction of cementite. However, it is still a very weak correlation. An increase in the volume fraction of graphite should be compensated for by a decrease in the proportion of cementite. An increase in the cementite content will result in an increase in the coefficient of friction. Spheroidal graphite precipitation will reduce the coefficient of friction.
  • In the case of the sample mass loss, the main influencing factor is the morphology of the cementite and the balanced volume fractions of graphite and cementite. It is observed that, in the case of a high ledeburitic cementite content, its smaller precipitates effectively improve the wear resistance of the material. On the other hand, when there is a high amount of graphite in the microstructure, an alloy with a lower volume fraction of ledeburitic cementite shows higher wear resistance. A higher amount of cementite results in higher material wear for a high volume fraction of graphite and comparable alloy hardness., which may be related to the chipping of the ledeburitic cementite particles during friction testing.

Author Contributions

Conceptualisation, J.K.; investigation, P.M.; methodology, Ł.F.; software, P.M.; supervision, J.K.; validation, Ł.F. and P.M.; writing—original draft, Ł.F.; writing—review and editing, Ł.F. and J.K. All authors have read and agreed to the published version of the manuscript.

Funding

The research was financed by the Ministry of Education and Science (AGH – research subsidy No. 16.16.110.663).

Data Availability Statement

Not applicable.

Acknowledgments

The authors would like to thank Bartosz Sanicki and Tomasz Ratajski for their support with the research.

Conflicts of Interest

The authors declare no conflict of interest.

References

  1. Powell, G.L.F.; Laird, G. Structure, Nucleation, Growth and Morphology of Secondary Carbides in High Chromium and Cr-Ni White Cast Irons. J. Mater. Sci. 1992, 27, 29–35. [Google Scholar] [CrossRef]
  2. Coronado, J.J.; Sinatora, A. Load Effect in Abrasive Wear Mechanism of Cast Iron with Graphite and Cementite. Wear 2009, 267, 6–11. [Google Scholar] [CrossRef]
  3. Wang, J.; Li, C.; Liu, H.; Yang, H.; Shen, B.; Gao, S.; Huang, S. The Precipitation and Transformation of Secondary Carbides in a High Chromium Cast Iron. Mater. Charact. 2006, 56, 73–78. [Google Scholar] [CrossRef]
  4. Wang, H.; Yu, S. Influence of Heat Treatment on Microstructure and Sliding Wear Resistance of High Chromium Cast Iron Electroslag Hardfacing Layer. Surf. Coat. Technol. 2017, 319, 182–190. [Google Scholar] [CrossRef]
  5. Zheng, B.; Xing, J.; Li, W.; Tu, X.; Jian, Y. Effect of Chromium-Induced (Fe, Cr)3C Toughness Improvement on the Two-Body Abrasive Wear Behaviors of White Cast Iron. Wear 2020, 456–457, 203363. [Google Scholar] [CrossRef]
  6. Ji, Y.P.; Wu, S.J.; Xu, L.J.; Li, Y.; Wei, S.Z. Effect of Carbon Contents on Dry Sliding Wear Behavior of High Vanadium High Speed Steel. Wear 2012, 294–295, 239–245. [Google Scholar] [CrossRef]
  7. Xu, L.; Wei, S.; Xing, J.; Long, R. Effects of Carbon Content and Sliding Ratio on Wear Behavior of High-Vanadium High-Speed Steel (HVHSS) under High-Stress Rolling-Sliding Contact. Tribol. Int. 2014, 70, 34–41. [Google Scholar] [CrossRef]
  8. Pawar, S.; Jha, A.K.; Mukhopadhyay, G. Effect of Different Carbides on the Wear Resistance of Fe-Based Hardfacing Alloys. Int. J. Refract. Metals Hard Mater. 2019, 78, 288–295. [Google Scholar] [CrossRef]
  9. Kootsookos, A.; Gates, J.D. The Role of Secondary Carbide Precipitation on the Fracture Toughness of a Reduced Carbon White Iron. Mater. Sci. Eng. A 2008, 490, 313–318. [Google Scholar] [CrossRef]
  10. Tressia, G.; Sinatora, A.; Goldenstein, H.; Masoumi, M. Improvement in the Wear Resistance of a Hypereutectoid Rail via Heat Treatment. Wear 2020, 442–443, 203122. [Google Scholar] [CrossRef]
  11. Xi, Z.-J.; Koyama, M.; Yoshida, Y.; Yoshimura, N.; Ushioda, K.; Noguchi, H. Effects of Cementite Morphology on Short-Fatigue-Crack Propagation in Binary Fe–C Steel. Philos. Mag. Lett. 2015, 95, 384–391. [Google Scholar] [CrossRef]
  12. Lv, Z.Q.; Wang, B.; Wang, Z.H.; Sun, S.H.; Fu, W.T. Effect of Cyclic Heat Treatments on Spheroidizing Behavior of Cementite in High Carbon Steel. Mater. Sci. Eng. A 2013, 574, 143–148. [Google Scholar] [CrossRef]
  13. Pirtovšek, T.V.; Kugler, G.; Terčelj, M. The Behaviour of the Carbides of Ledeburitic AISI D2 Tool Steel during Multiple Hot Deformation Cycles. Mater. Charact. 2013, 83, 97–108. [Google Scholar] [CrossRef]
  14. Marui, E.; Hasegawa, N.; Endo, H.; Tanaka, K.; Hattori, T. Research on the Wear Characteristics of Hypereutectoid Steel. Wear 1997, 205, 186–199. [Google Scholar] [CrossRef]
  15. Deshpande, S.; Anekar, N.; Vagge, S.; Joshi, A. Wear Behavior of Spheroidal Graphite Cast Iron in Biodiesel Blends. J. Bio- Tribo-Corros. 2020, 6, 4. [Google Scholar] [CrossRef]
  16. Soiński, M.S.; Jakubus, A. Initial Assessment of Abrasive Wear Resistance of Austempered Cast Iron with Vermicular Graphite. Arch. Metall. Mater. 2014, 59, 1073–1076. [Google Scholar] [CrossRef]
  17. Muchammad; Syafa’at, I.; Hilmy, F.; Tauviqirrahman, M. Jamari Wear Analysis of Spherical Graphite Cast Iron Using Pin-on Disc Tribotester. J. Phys. Sci. 2018, 29, 15–26. [Google Scholar] [CrossRef]
  18. Wu, Y.; Li, J.; Chen, H.; Yang, Z.; Guo, Y.; Liang, M. Study on the Impact Wear Mechanism and Damage Modes of Compacted Graphite Cast Iron. J. Mater. Res. Technol. 2022, 21, 4002–4011. [Google Scholar] [CrossRef]
  19. Sułowski, M.; Matusiewicz, P.; Kij, P. Optimization of the Manufacturing Process of Sintered Fe-Mn-Cr-Mo-C Steels Using ANOVA. In Materials Science Forum; Trans Tech Publications Ltd.: Baech, Switzerland, 2023; Volume 1081, pp. 131–136. [Google Scholar]
  20. Sułowski, M.; Jordan, A.; Czarski, A.; Matusiewicz, P. Estimation of the Effect of Production Parameters on Mechanical Properties of Sintered Steels Using ANOVA. Arch. Metall. Mater. 2017, 62, 571–576. [Google Scholar] [CrossRef]
  21. Ahmed, A.N.; Rashed, H.M.M.A. ANOVA Modeling on Sintering Parameters and Frequencies, Affecting Microstructure and Dielectric Constant of Nb Doped BaTiO3. Procedia Eng. 2014, 90, 72–77. [Google Scholar] [CrossRef]
  22. Natesh, C.P.; Shashidhara, Y.M.; Amarendra, H.J.; Shetty, R.; Harisha, S.R.; Shenoy, P.V.; Nayak, M.; Hegde, A.; Shetty, D.; Umesh, U. Tribological and Morphological Study of AISI 316L Stainless Steel during Turning under Different Lubrication Conditions. Lubricants 2023, 11, 52. [Google Scholar] [CrossRef]
  23. Saxena, P.; Bongale, A.; Kumar, S.; Suresh, R. Tribological and Hardness Analyses of Friction-Stir-Processed Composites Using the Taguchi Approach. Materials 2023, 16, 420. [Google Scholar] [CrossRef] [PubMed]
  24. Krawczyk, J.; Rożniata, E.; Pacyna, J. The Influence of Hypereutectoid Cementite Morphology upon Fracture Toughness of Chromium–Nickel–Molibdenium Cast Steel of Ledeburite Class. J. Mater. Process. Technol. 2005, 162–163, 336–341. [Google Scholar] [CrossRef]
  25. Krawczyk, J.; Rożniata, E.; Dąbrowski, R.; Madej, M.; Pacyna, J. The role of modification processes in ledeburitic class cast steel tribological properties. Trans. Foundry Res. Inst. 2015, 55, 71–79. [Google Scholar] [CrossRef]
  26. Rożniata, E.; Pacyna, J. Hypereutectoid cementite morphology and mechanical properties of Cr-Ni-Mo cast steel. J. Achiev. Mater. Manuf. Eng. 2006, 17, 145–148. [Google Scholar]
  27. Posmyk, A.; Bąkowski, H. Wear the microscale of cast iron piston ring/composite cylinder liner contact. Q. Tribol. 2015, 261, 153–162. [Google Scholar]
Figure 1. Results of the tribological properties and hardness of the materials under investigation: (a) average mass loss, (b) average coefficient of friction, and (c) hardness.
Lubricants 11 00498 g001
Figure 2. Microstructures of investigated materials: (a) P1, (b) P2, (c) P3, (d) P4, (e) P5, (f) P6, and (g) P7.
Lubricants 11 00498 g002
Figure 3. Correlation between material hardness and results of tribological tests for a studied material: (a) friction coefficient, and (b) mass loss.
Lubricants 11 00498 g003
Figure 4. Correlation between volume fraction of ledeburitic cementite and tribological test results for the tested material: (a) coefficient of friction, and (b) mass loss.
Lubricants 11 00498 g004
Figure 5. Correlation between volume fraction of graphite and tribological test results for the tested material: (a) coefficient of friction, and (b) mass loss.
Lubricants 11 00498 g005
Figure 6. Correlation between the volume fractions of graphite and ledeburitic cementite in relation to tribological test results: (a) mass loss-shown as the size of the symbol, and (b) coefficient of friction-shown as the colour of the symbol.
Lubricants 11 00498 g006
Table 1. Chemical compositions of investigated materials (The materials are sourced from M. Buczek Steelworks, Sosnowiec, Poland).
IDMaterialChemical Composition (wt.%)
CMnSiPSCrNiMo
P1EN-GJS-330 NiMoCr8-53.320.721.400.080.010.282.060.52
P2EN-GJS-350 NiCr6-23.460.411.350.040.010.391.460.17
P3EN-GJS-300 SiNiCr8-6-23.040.722.190.100.080.481.320.31
P4EN-GJS-350 NiMoCr12-8-33.450.651.40--0.73.070.86
P5EN-GJS-320 NiSiCrMo14-8-33.220.512.160.060.010.713.450.62
P6EN-GJL-350 NiCrMo13-43.450.530.65--1.033.230.44
P7EN-GJL-350 CrNiMo6-5-33.500.741.220.060.021.371.230.32
Table 2. Results of tribological tests and hardness measurements for the cast irons under investigation.
IDAverage Mass Loss [mg]Average Coefficient of FrictionHardness [HV 30]
P10.175 ± 0.0700.53 ± 0.11315 ± 58
P20.225 ± 0.0630.41 ± 0.06263 ± 33
P30.400 ± 0.0700.35 ± 0.05303 ± 33
P40.150 ± 0.0140.35 ± 0.07484 ± 19
P50.165 ± 0.0210.51 ± 0.10389 ± 33
P60.775 ± 0.0210.47 ± 0.04269 ± 59
P70.440 ± 0.0270.36 ± 0.03355 ± 40
Table 3. Volume fractions of the precipitates studied in the analysed alloys.
Cast iron under investigation
P1P2P3P4P5P6P7
Graphite by volume, %
10.91 ± 2.2914.44 ± 3.1210.23 ± 1.987.98 ± 1.4012.24 ± 1.8114.88 ± 1.288.05 ± 1.51
Volume fraction of ledeburitic cementite, %
28.59 ± 2.6513.76 ± 2.7516.24 ± 1.9933.79 ± 2.8024.31 ± 2.6824.10 ± 2.2443.83 ± 1.82
Table 4. Compilation of one-factor ANOVA results.
Outcome ParameterF-ValueANOVA
p-Value
R2,%Adjusted R2,%p-Value
Levene Test
% graphite19.270.0064.7361.370.437
% cementite176.640.0094.3993.850.847
HV27.820.0077.3174.530.532
Table 5. Results of the Tukey post hoc tests for graphite %, ledeburitic cementite % and hardness of the materials under investigation.
% graphite % led. cementite Hardness, HV
IDMeanGroupingIDMeanGroupingIDMeanGrouping
P614.87A P743.83A P4483.9A
P214.44A P433.79 B P5389.0 B
P512.24AB P128.59 C P7355.8 BC
P110.91 B P524.31 D P1314.5 CD
P310.23 BCP624.11 D P3302.9 CD
P78.05 CP316.23 EP6269.4 D
P47.98 CP213.76 EP2262.6 D
Table 6. Graphite volume fraction groups based on Tukey post hoc test results for the cast irons studied.
Structural ComponentGroupCast Iron
GraphiteI (A)P2, P6
GraphiteII (A, B)P5
GraphiteIII (B)P1
GraphiteIV (B, C)P3
GraphiteV (C)P7, P4
Table 7. Cementite volume fraction groups for the investigated cast irons based on the results of the Tukey post hoc tests.
Structural ComponentGroupCast Iron
CementiteI (A)P7
CementiteII (B)P4
CementiteIII (C)P1
CementiteIV (D)P5, P6
CementiteV (E)P3, P2
Table 8. Matrix of hardness values for each cast iron, sorted to the corresponding volume fractions of graphite and cementite.
Graphite
I (A)II (A, B)III (B)IV (B, C)V (C)
CementiteI (A)296372335329420
II (B)339436399393420
III (C)282352315309385
IV (D)307329324320375
V (E)278318293283351
Table 9. Matrix of friction coefficient values for each cast iron, sorted to the corresponding volume fractions of graphite and cementite.
Graphite
I (A)II (A, B)III (B)IV (B, C)V (C)
CementiteI (A)0.410.440.450.360.36
II (B)0.410.430.440.350.36
III (C)0.470.520.530.440.41
IV (D)0.460.490.500.440.42
V (E)0.410.420.430.380.37
Table 10. Matrix of mass loss after the tribological tests for each cast iron, sorted to the corresponding volume fractions of graphite and cementite.
Graphite
I (A)II (A, B)III (B)IV (B, C)V (C)
CementiteI (A)0.490.310.320.430.30
II (B)0.390.160.170.280.30
III (C)0.400.180.180.290.26
IV (D)0.390.480.380.450.39
V (E)0.470.270.270.320.31
Table 11. Compilation of two-factor ANOVA results.
Outcome
Parameter
ANOVA
p-Value
R2, %
Friction coef.0.0096.74
Mass loss 0.0079.89
Hardness, HV0.0093.08
Disclaimer/Publisher’s Note: The statements, opinions and data contained in all publications are solely those of the individual author(s) and contributor(s) and not of MDPI and/or the editor(s). MDPI and/or the editor(s) disclaim responsibility for any injury to people or property resulting from any ideas, methods, instructions or products referred to in the content.

