The Influence of Scratches on the Tribological Performance of Friction Pairs Made of Different Materials under Water-Lubrication Conditions

 , ,
, ,
Abstract
:1. Introduction
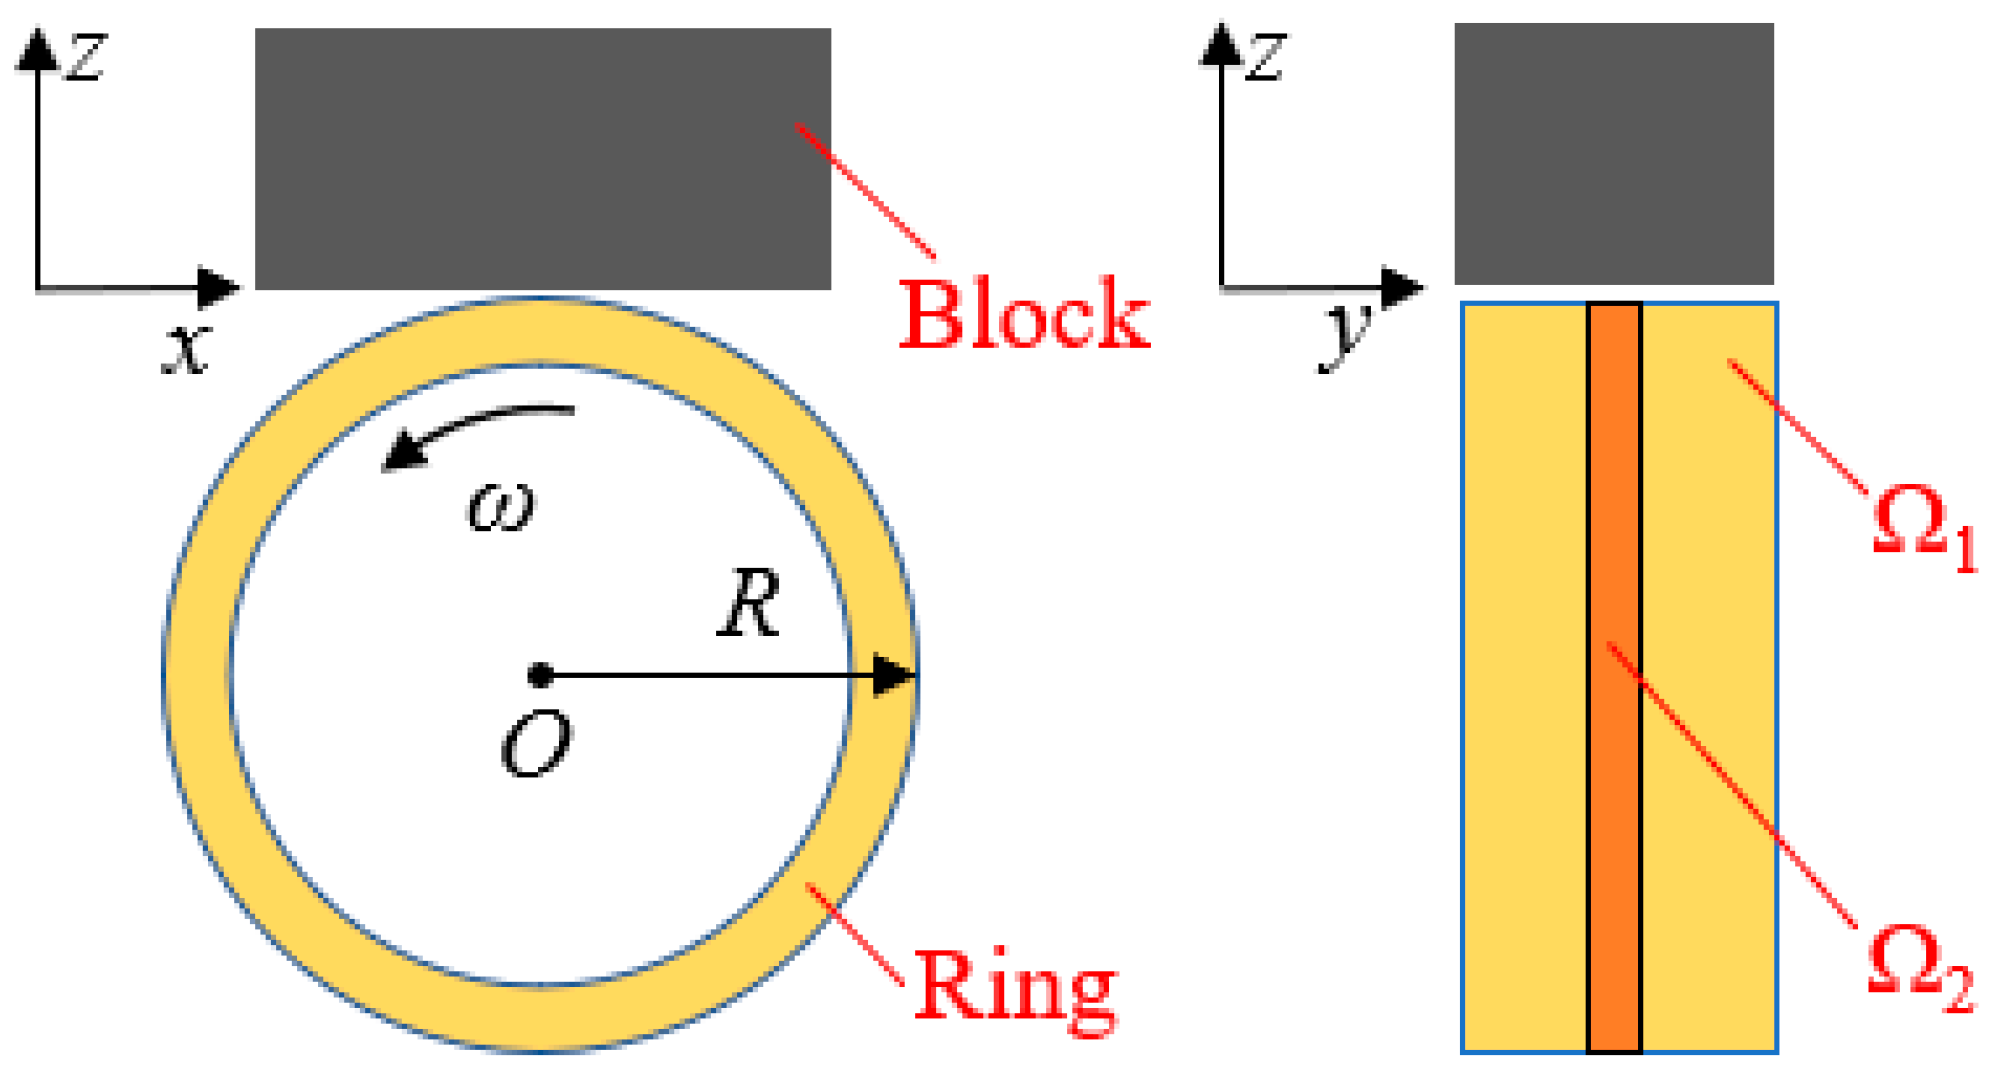
2. Theoretical Model
2.1. Average Flow Reynolds Equation
2.2. Film Thickness Equation
2.3. Asperity Contact Model
2.4. Load Capacity Equation
2.5. Friction Coefficient Equation
2.6. Boundary Conditions
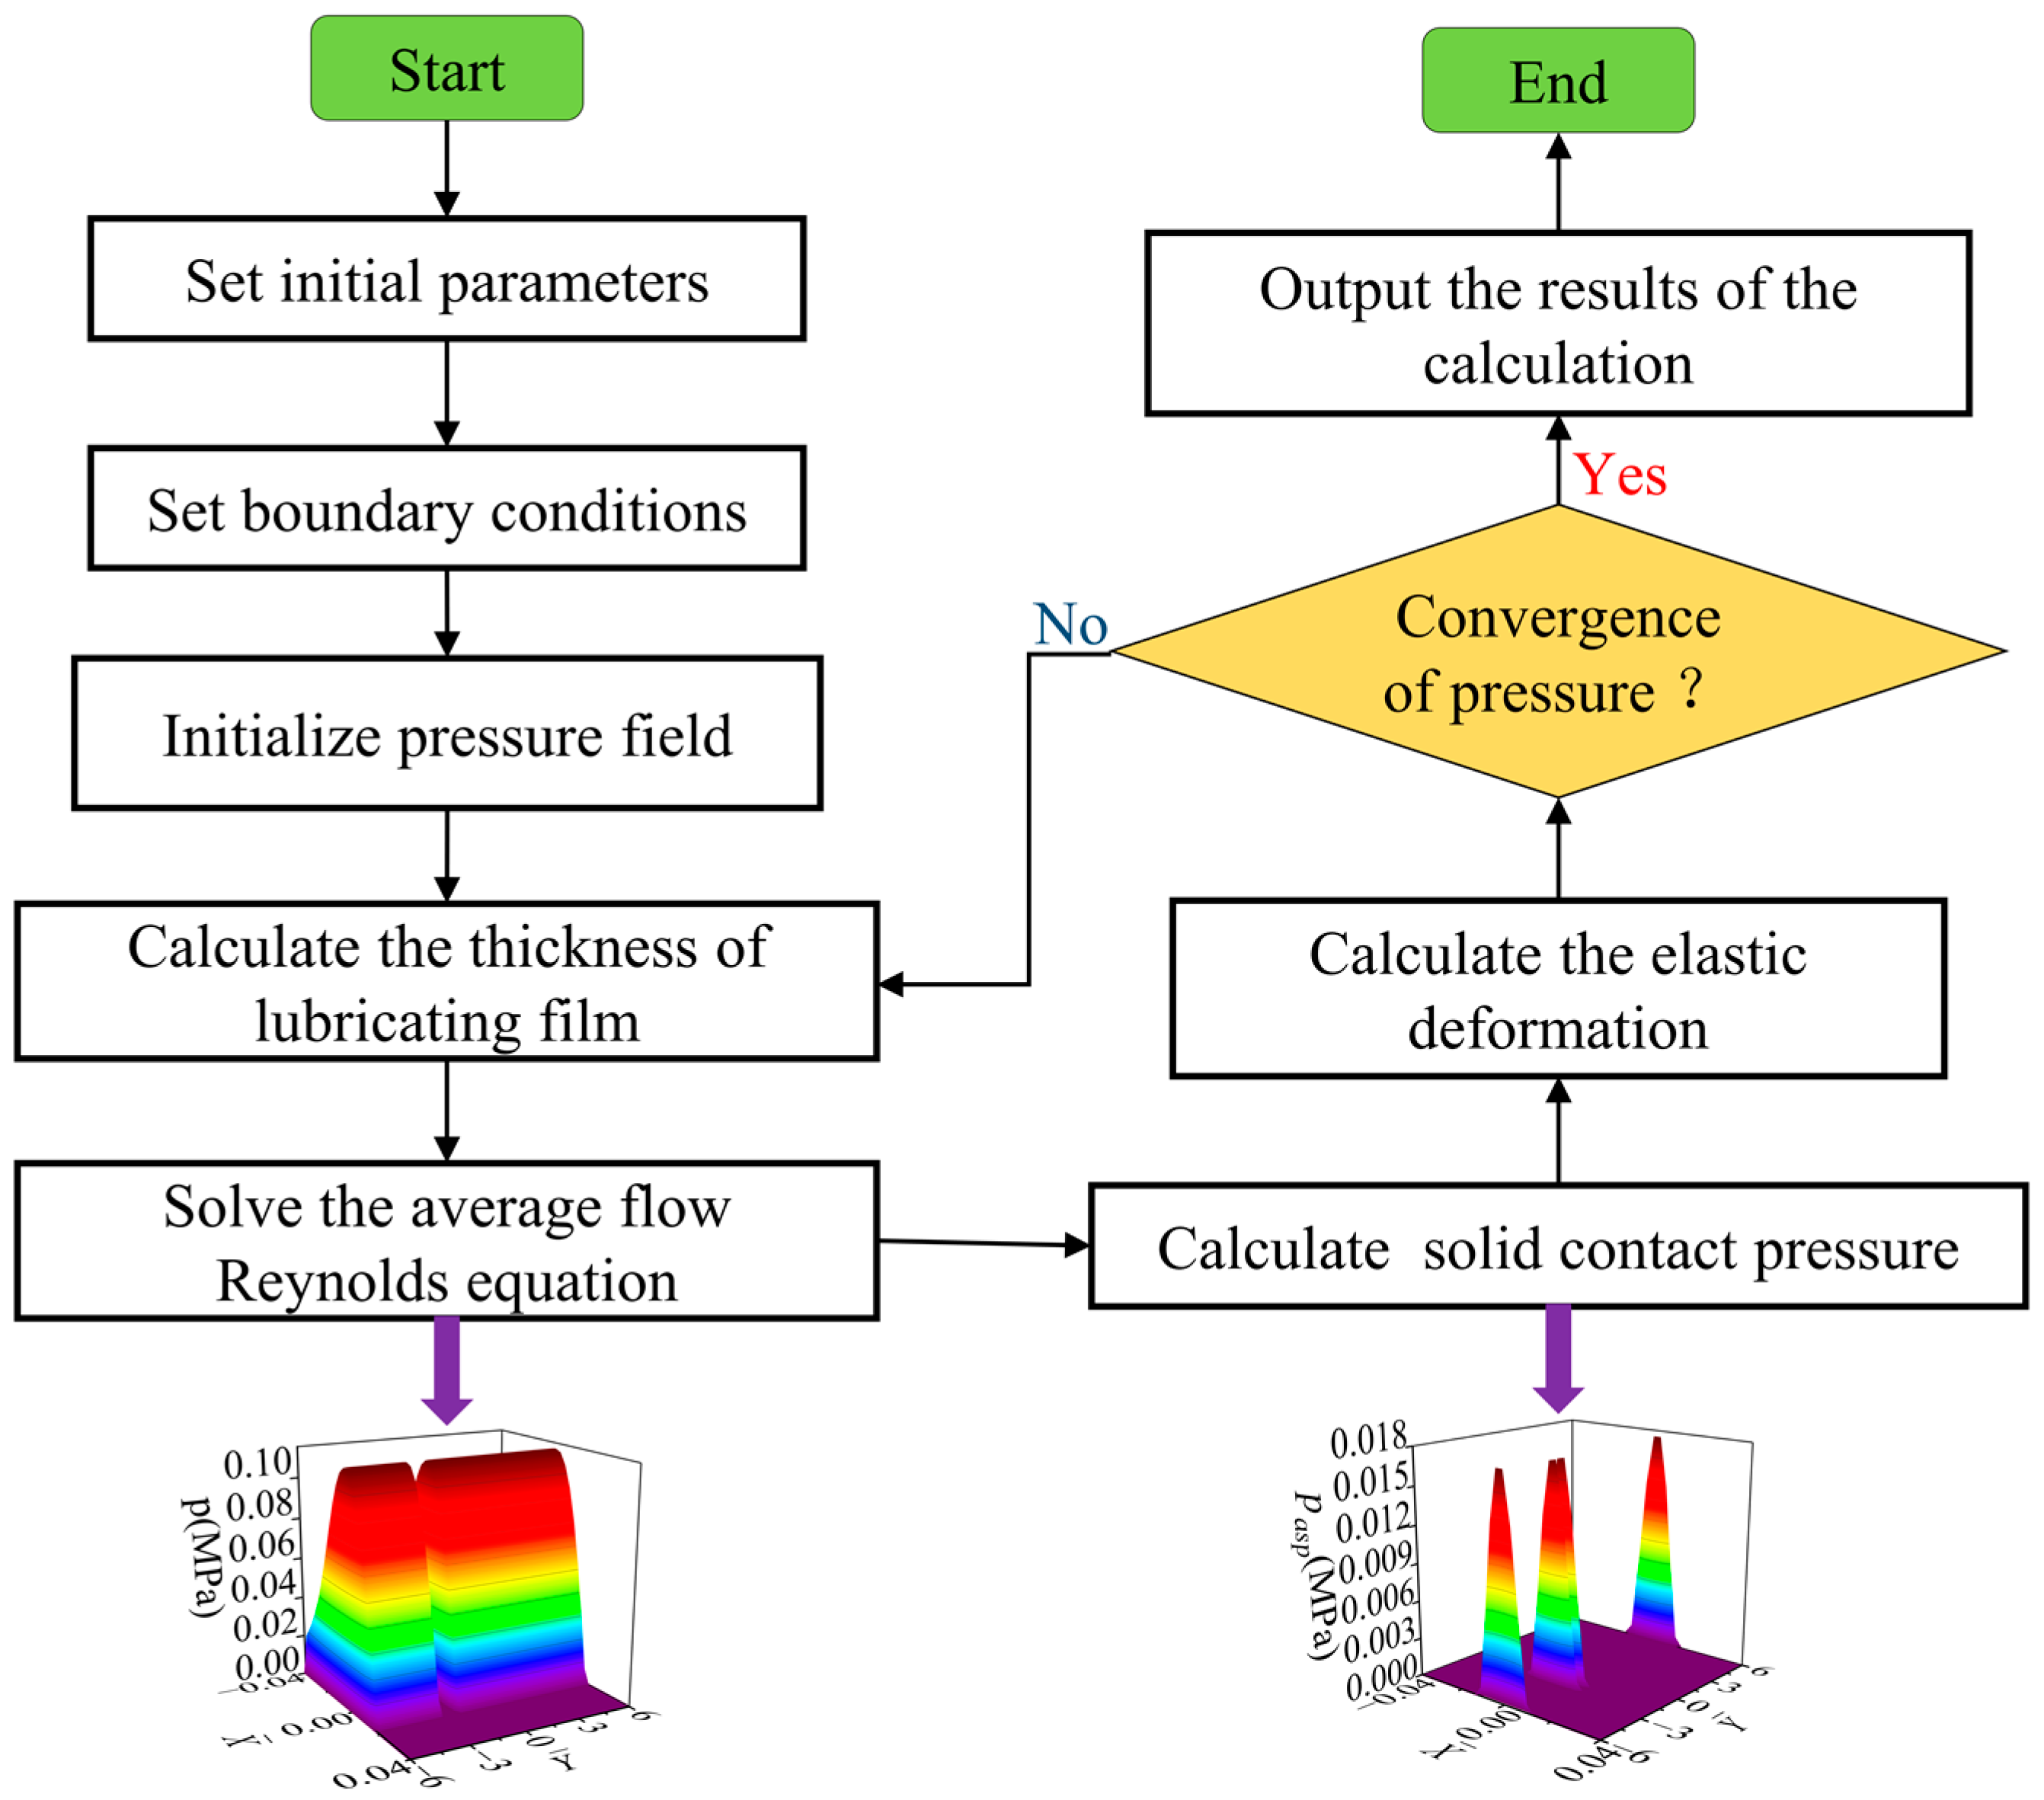
2.7. Numeric Calculation Scheme
3. Experimental Equipment and Model Validation
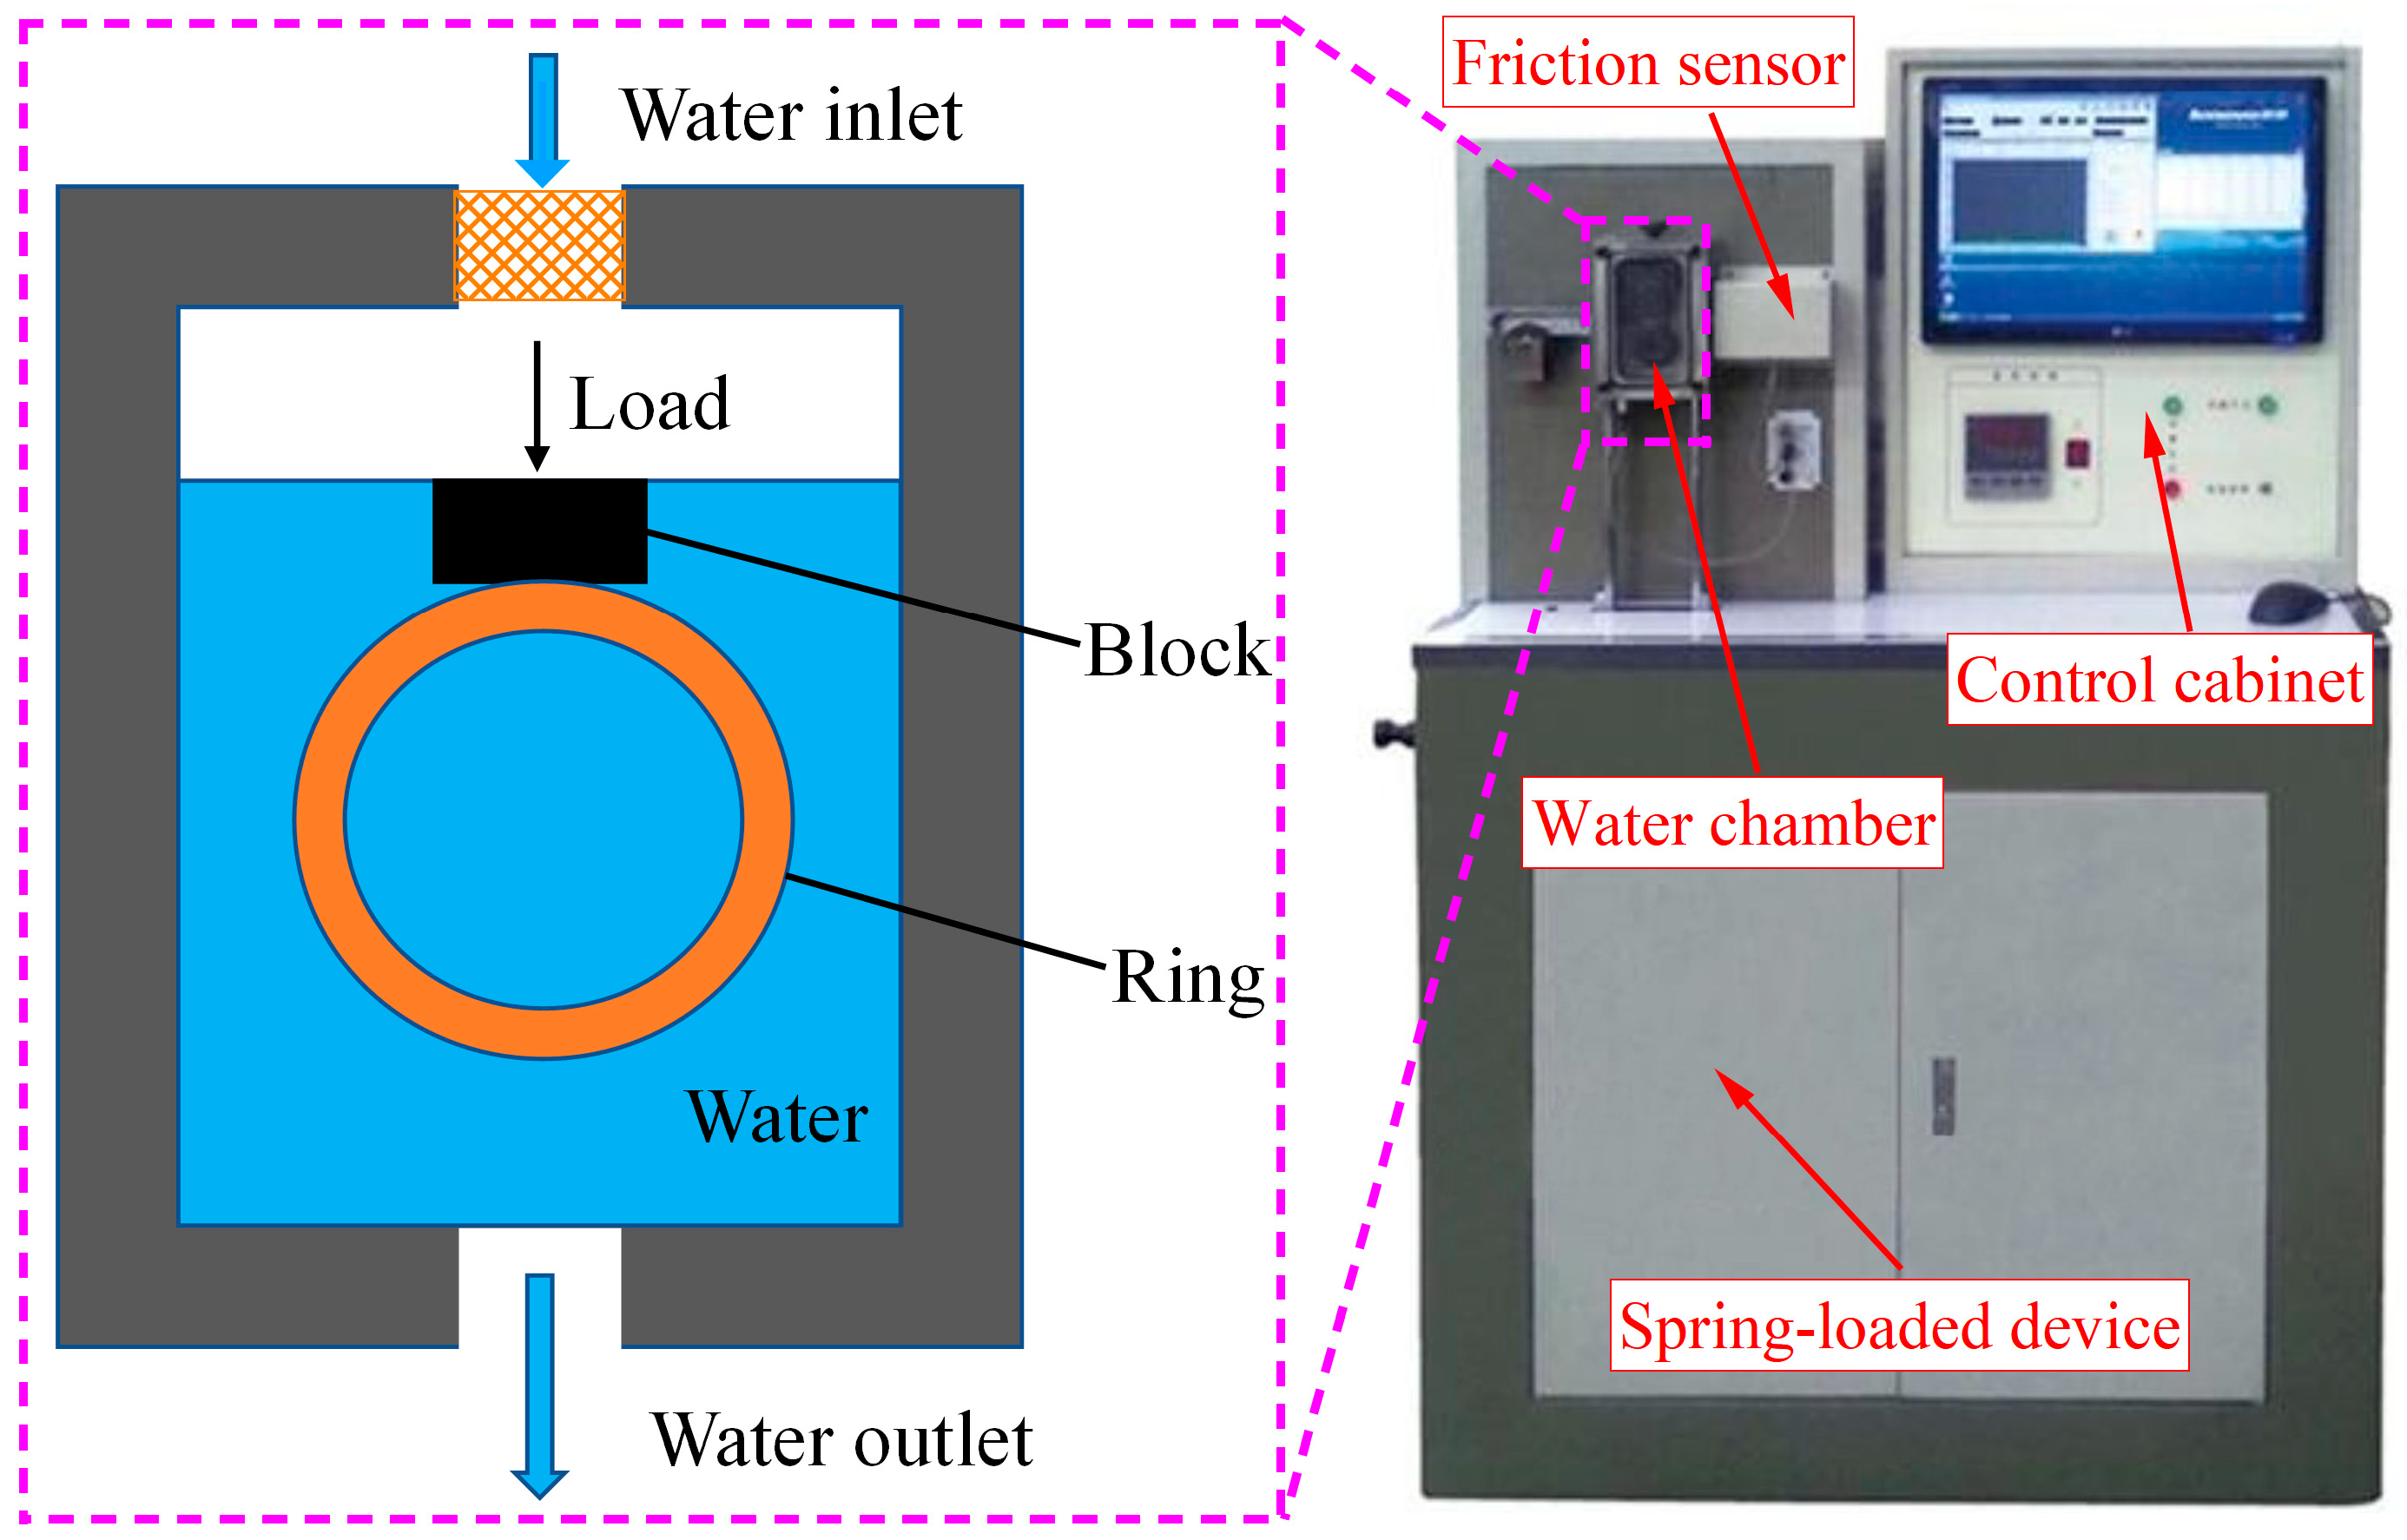
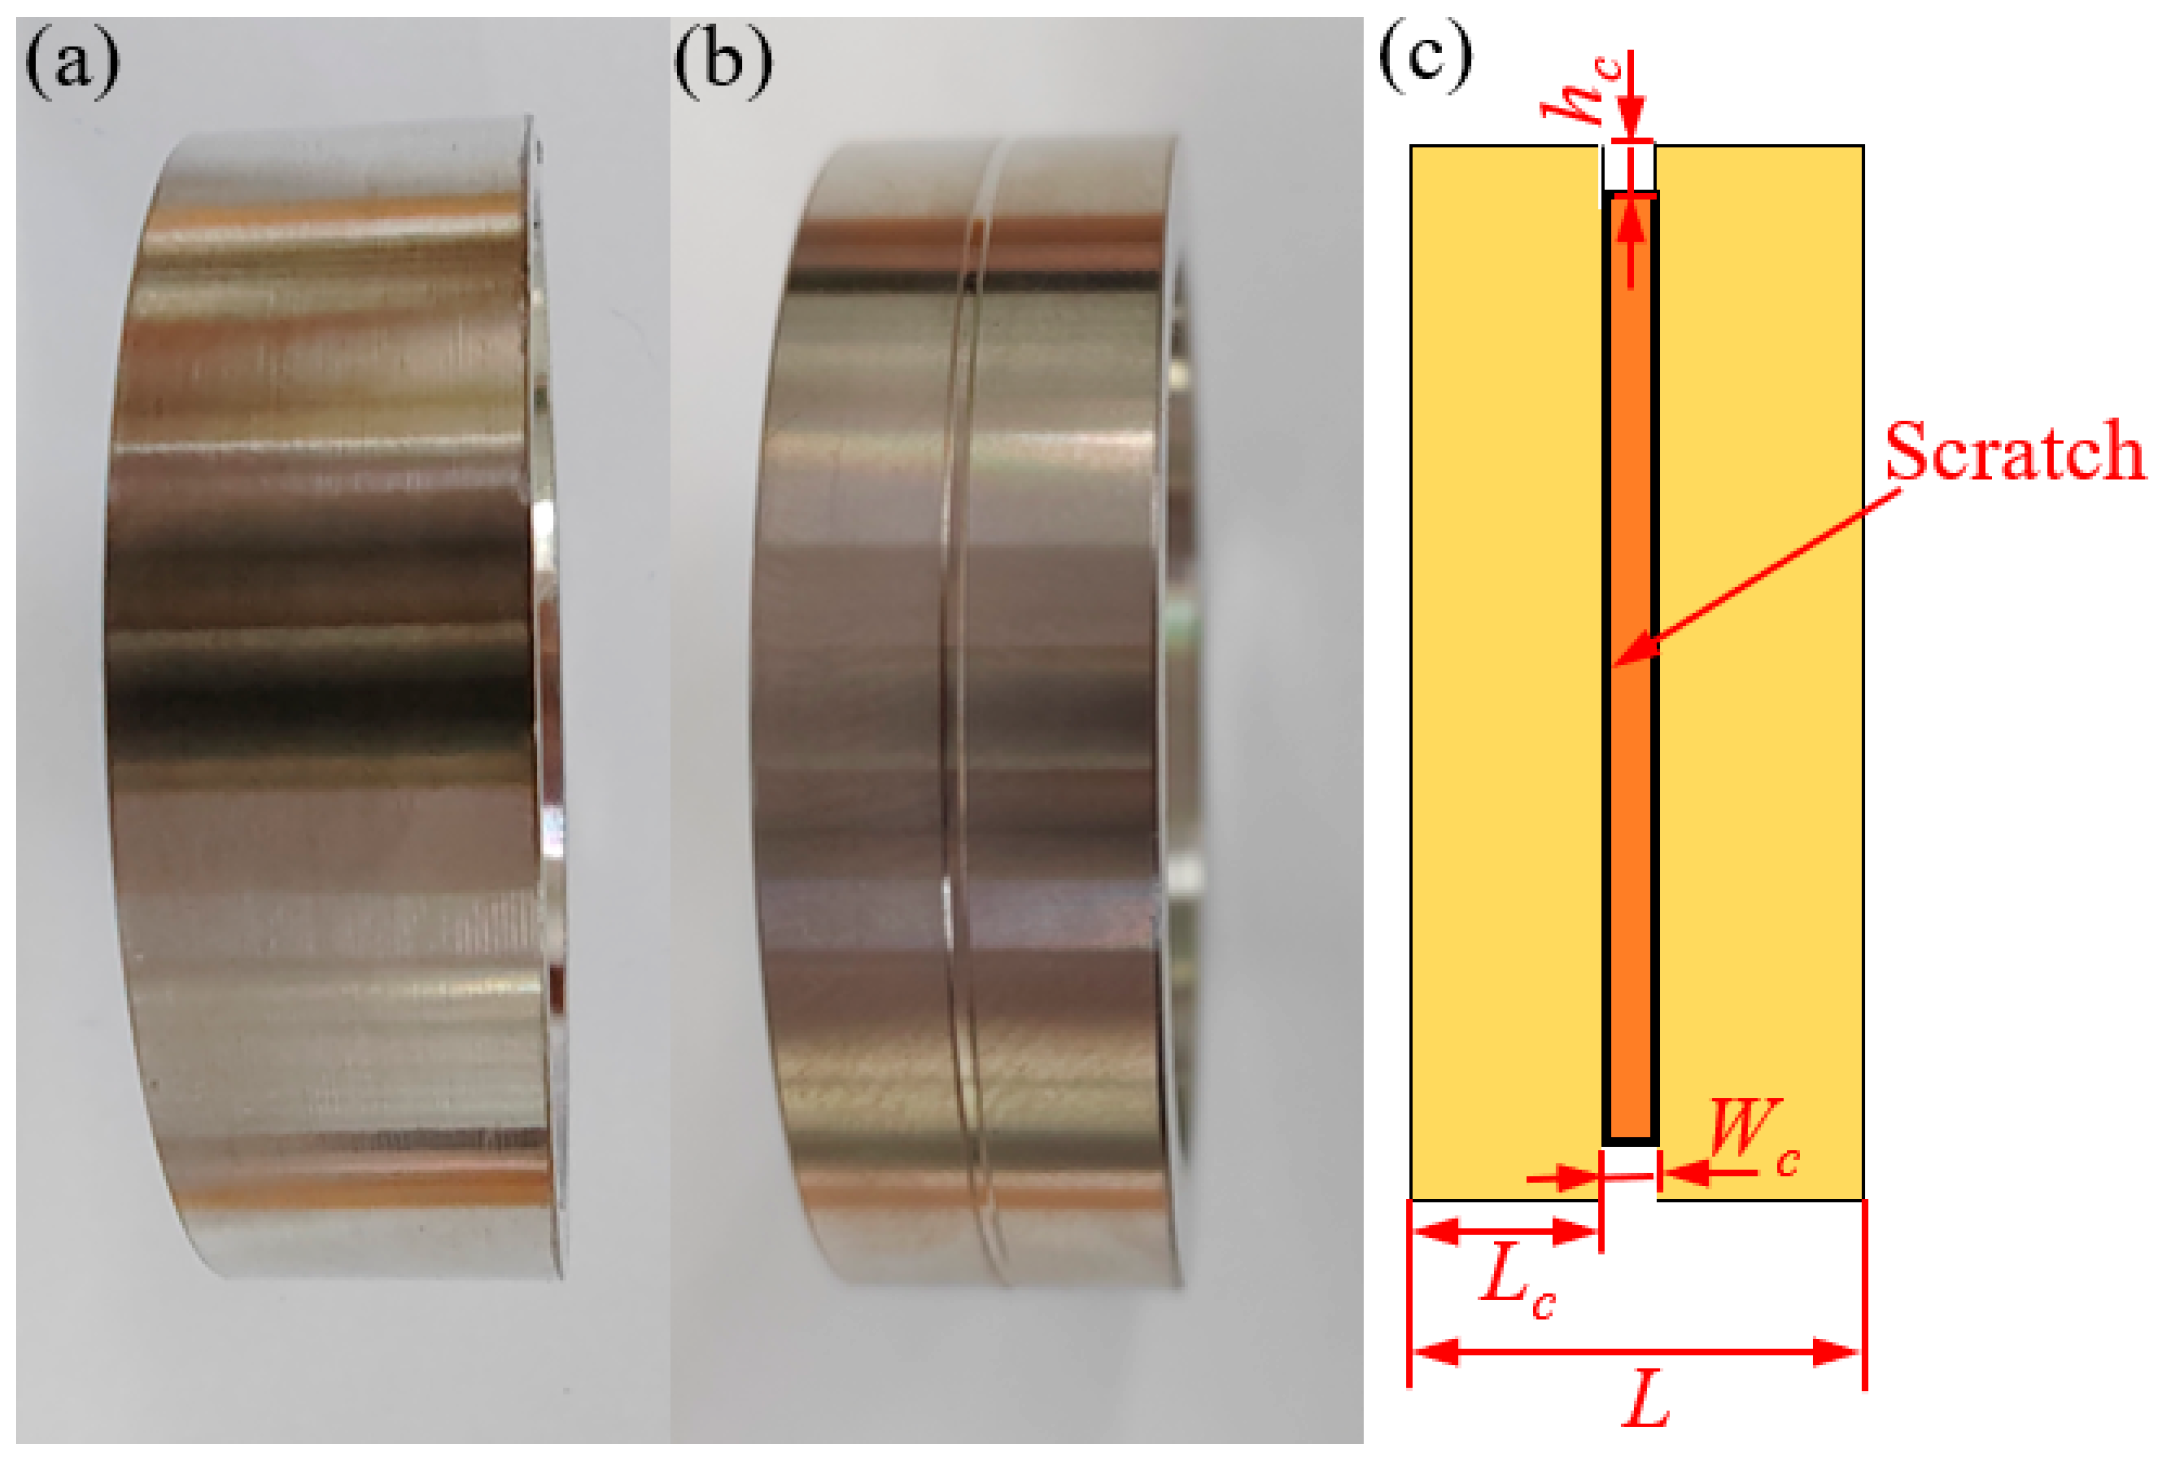
3.1. Experimental Equipment
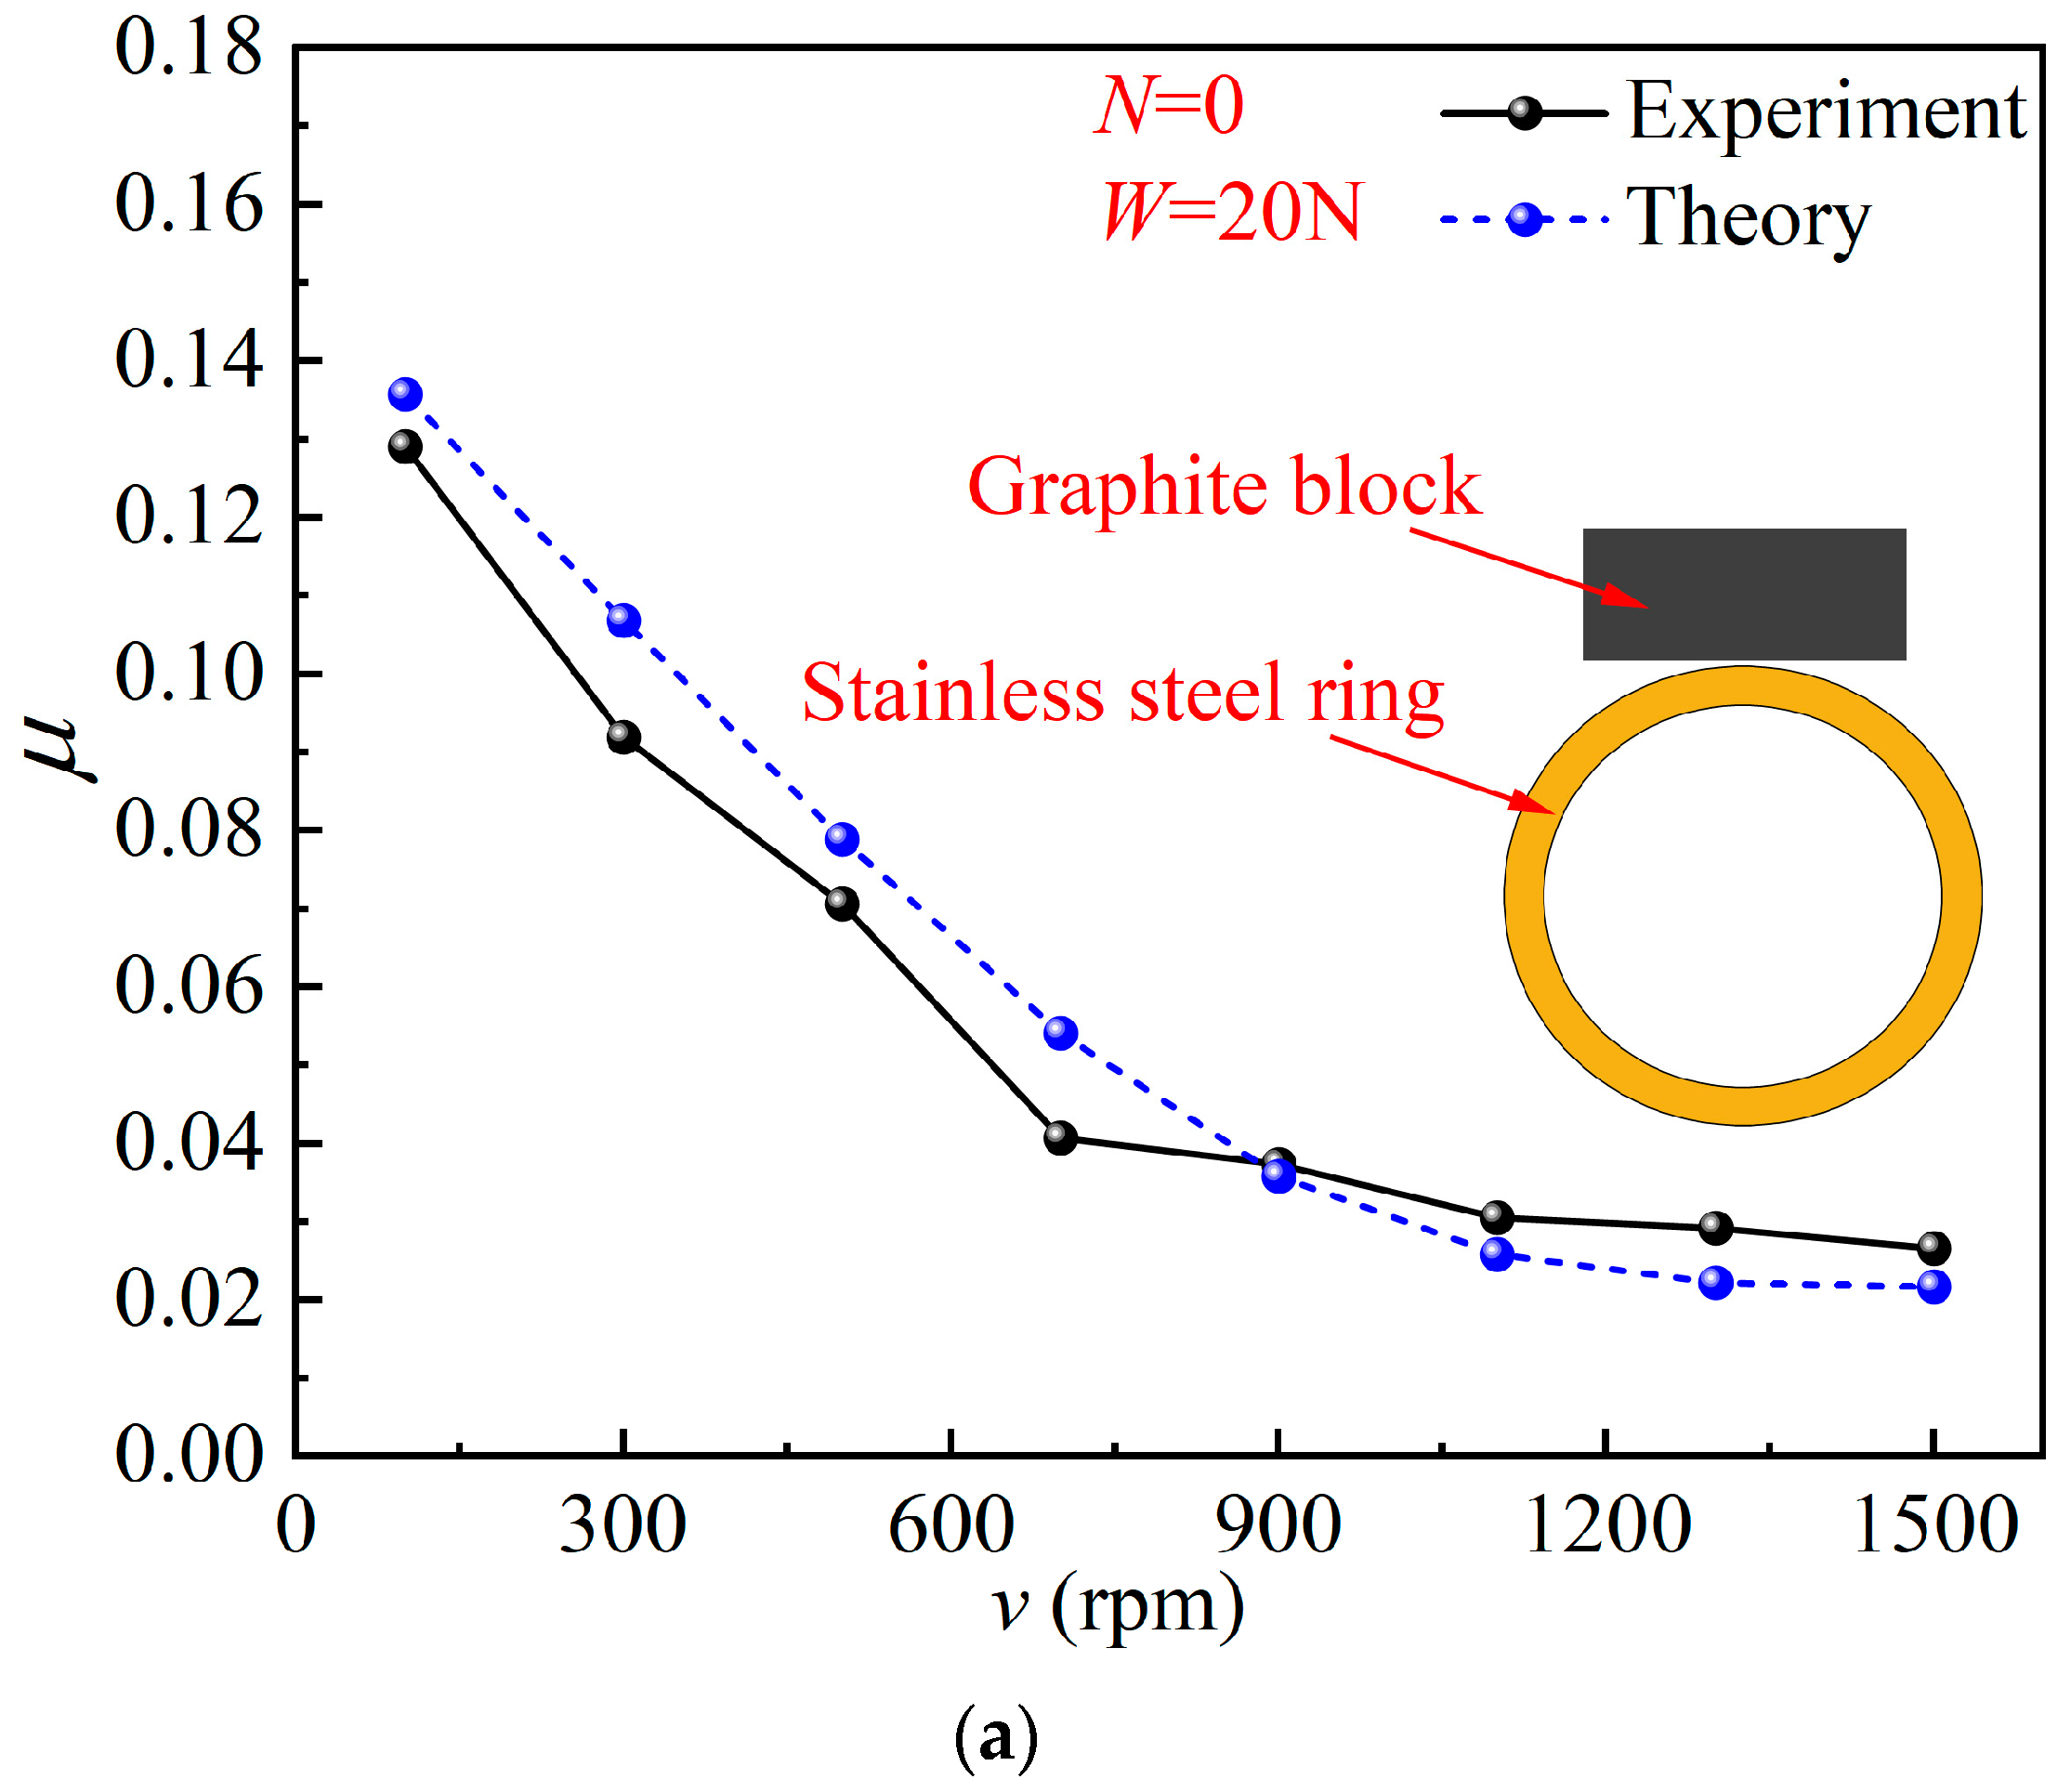
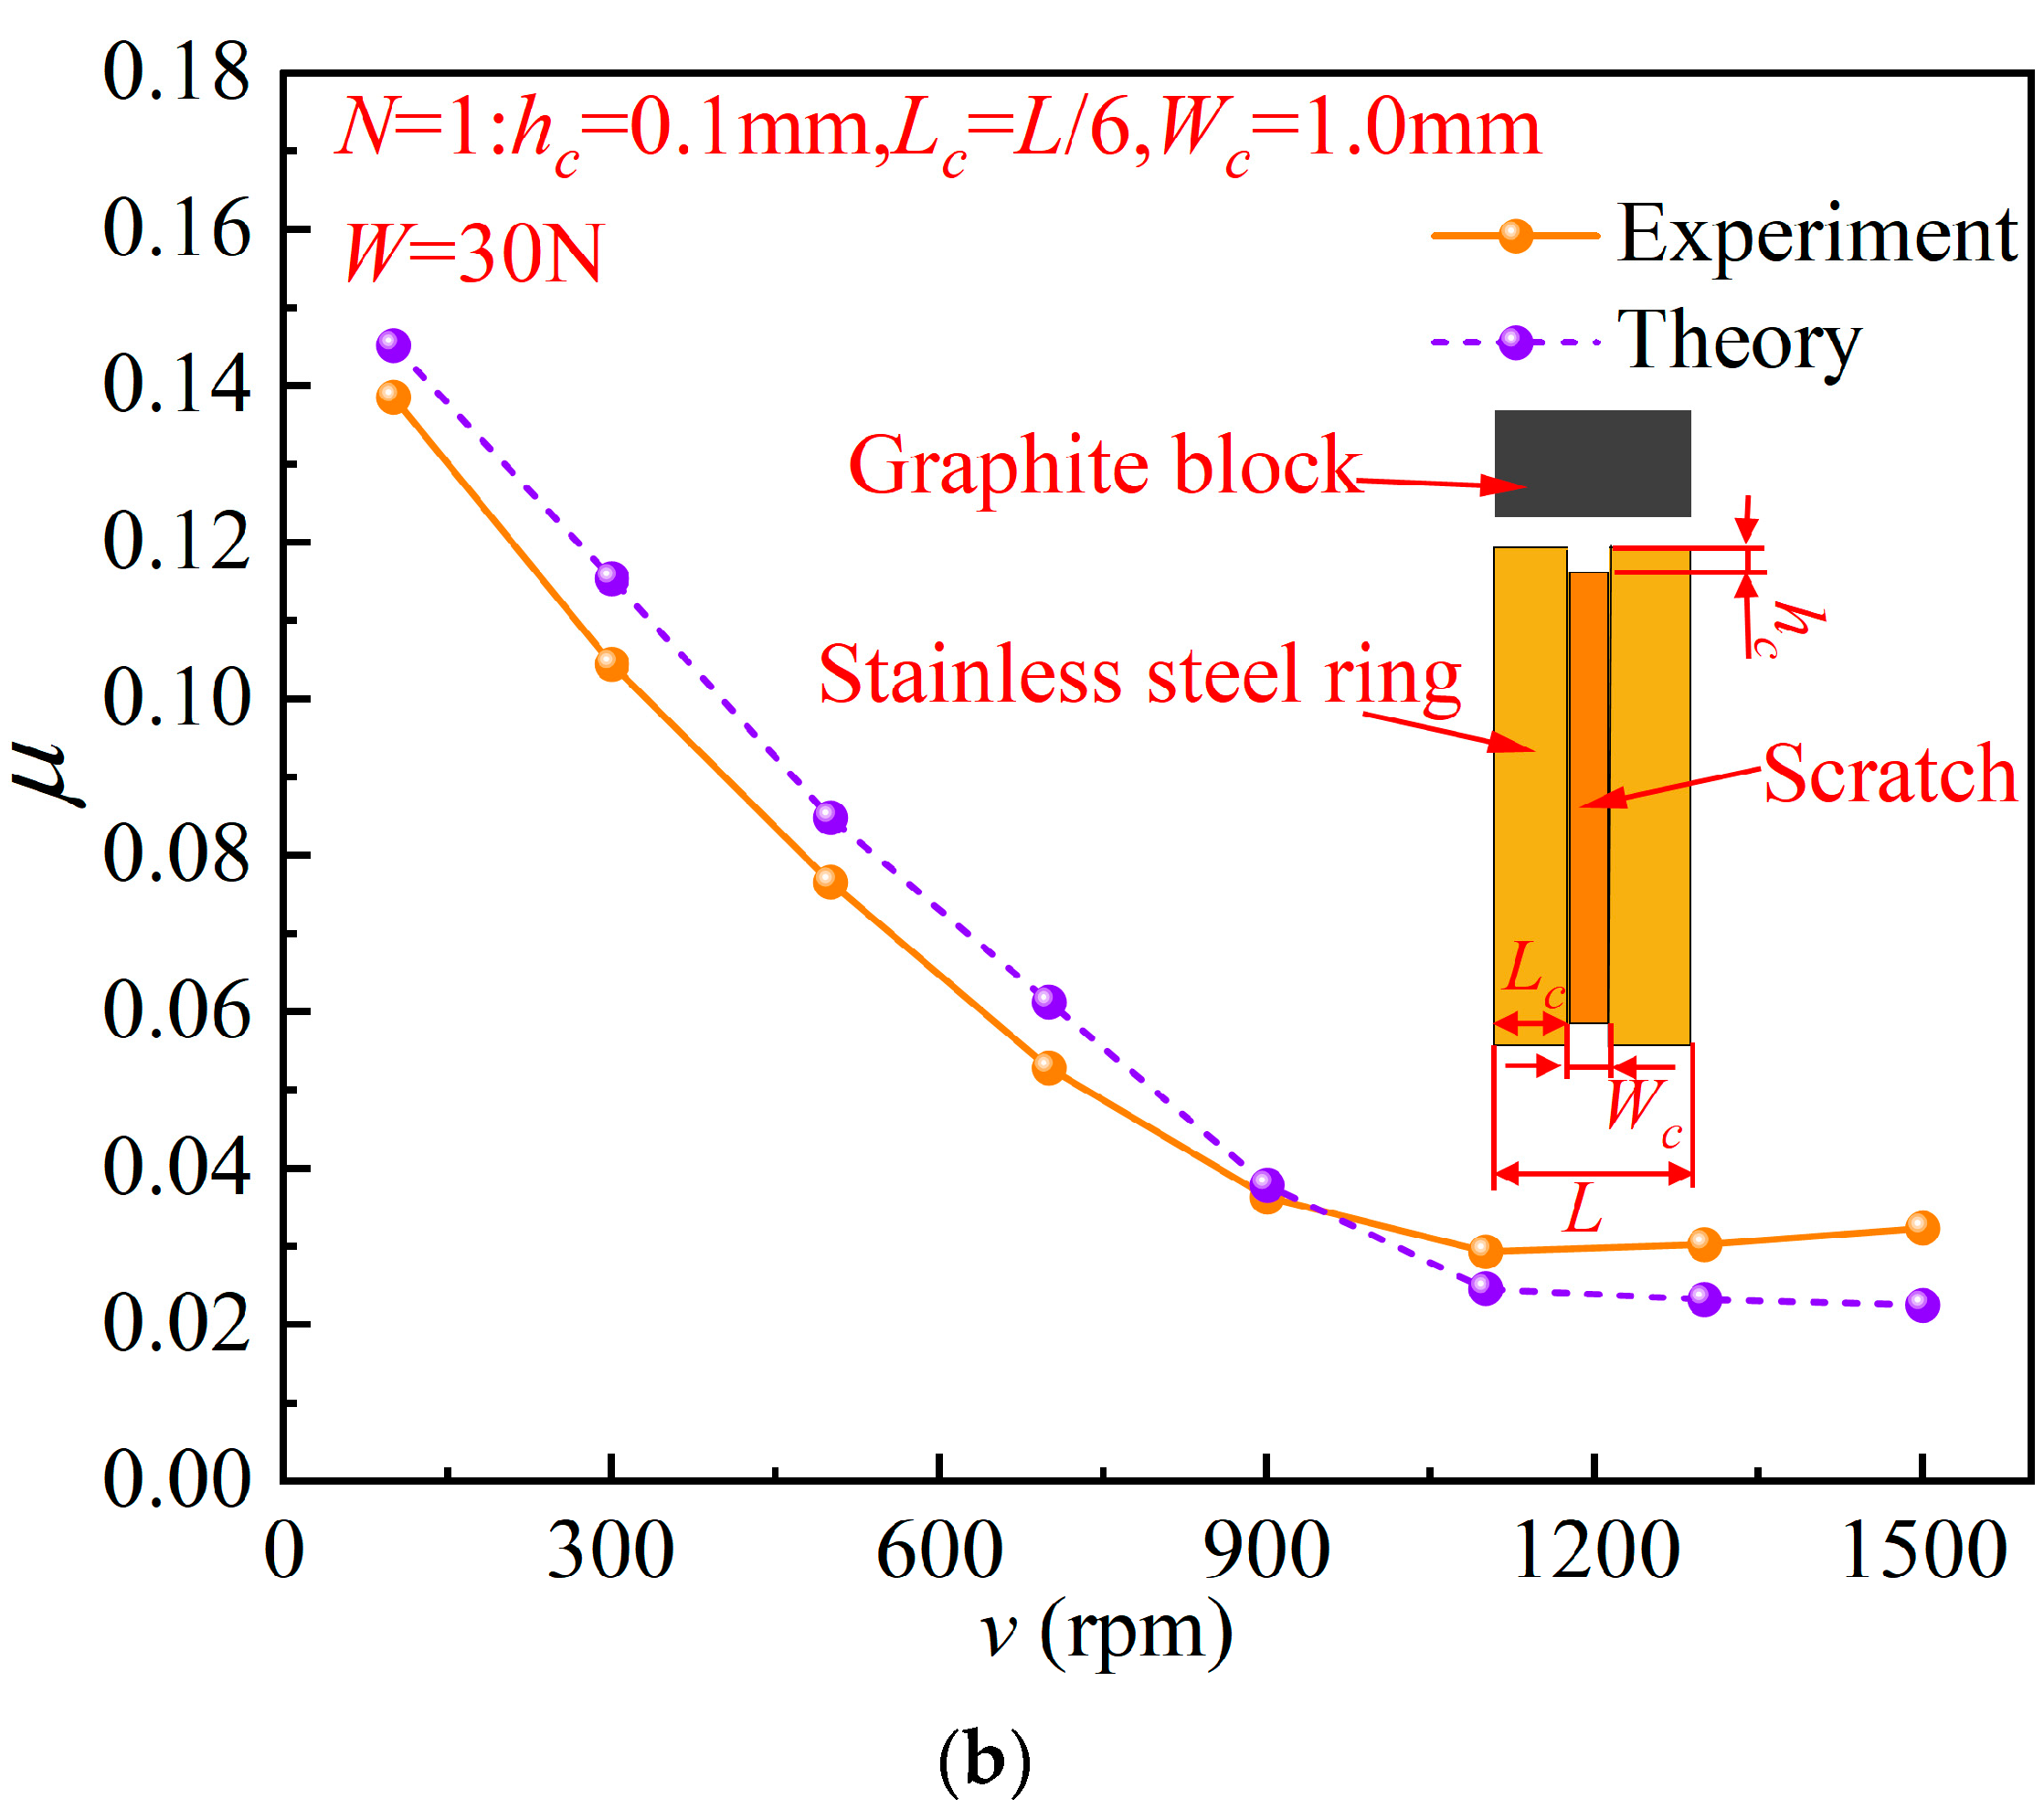
3.2. Model Validation
4. Results and Discussion
4.1. Sensitivity of Tribological Performance of Test Blocks Made of Different Materials to Scratches
4.2. The Effect of Scratch Parameters on the Tribological Performance of Block-on-Ring System
4.3. The Effect of Scratch Width on the Tribological Performance and Wear Performance of Block-on-Ring System
5. Conclusions
- (1)
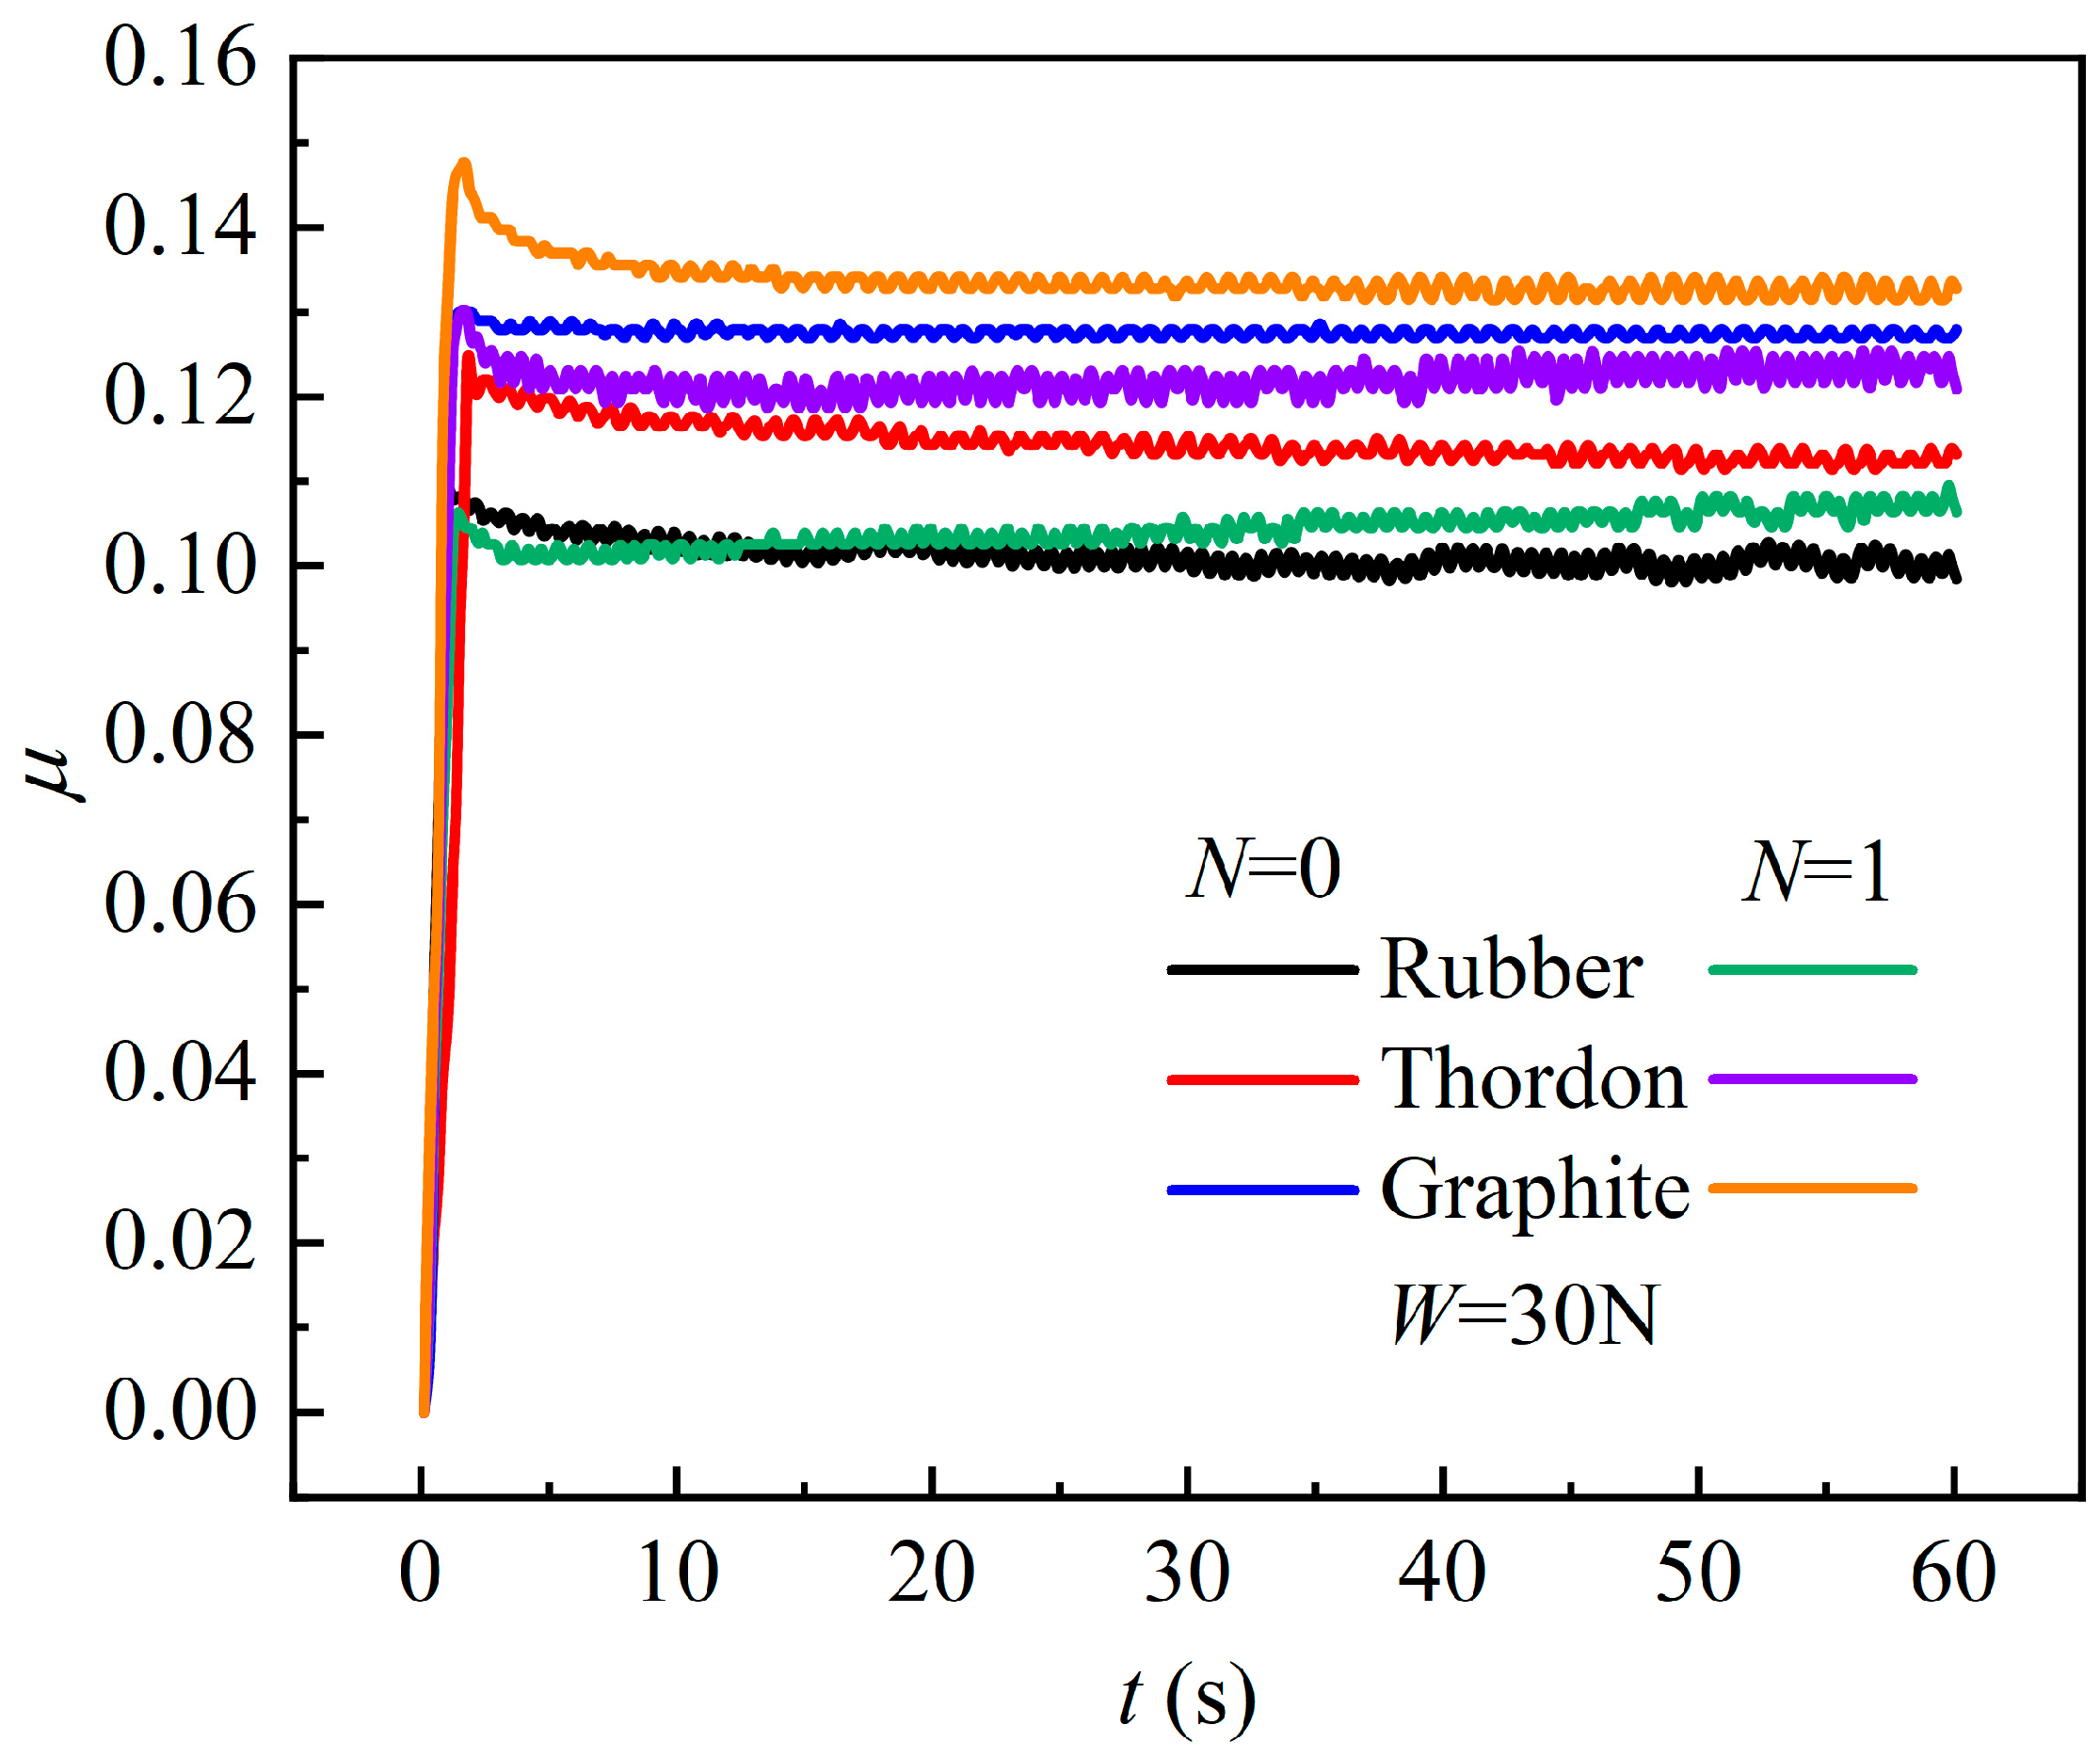
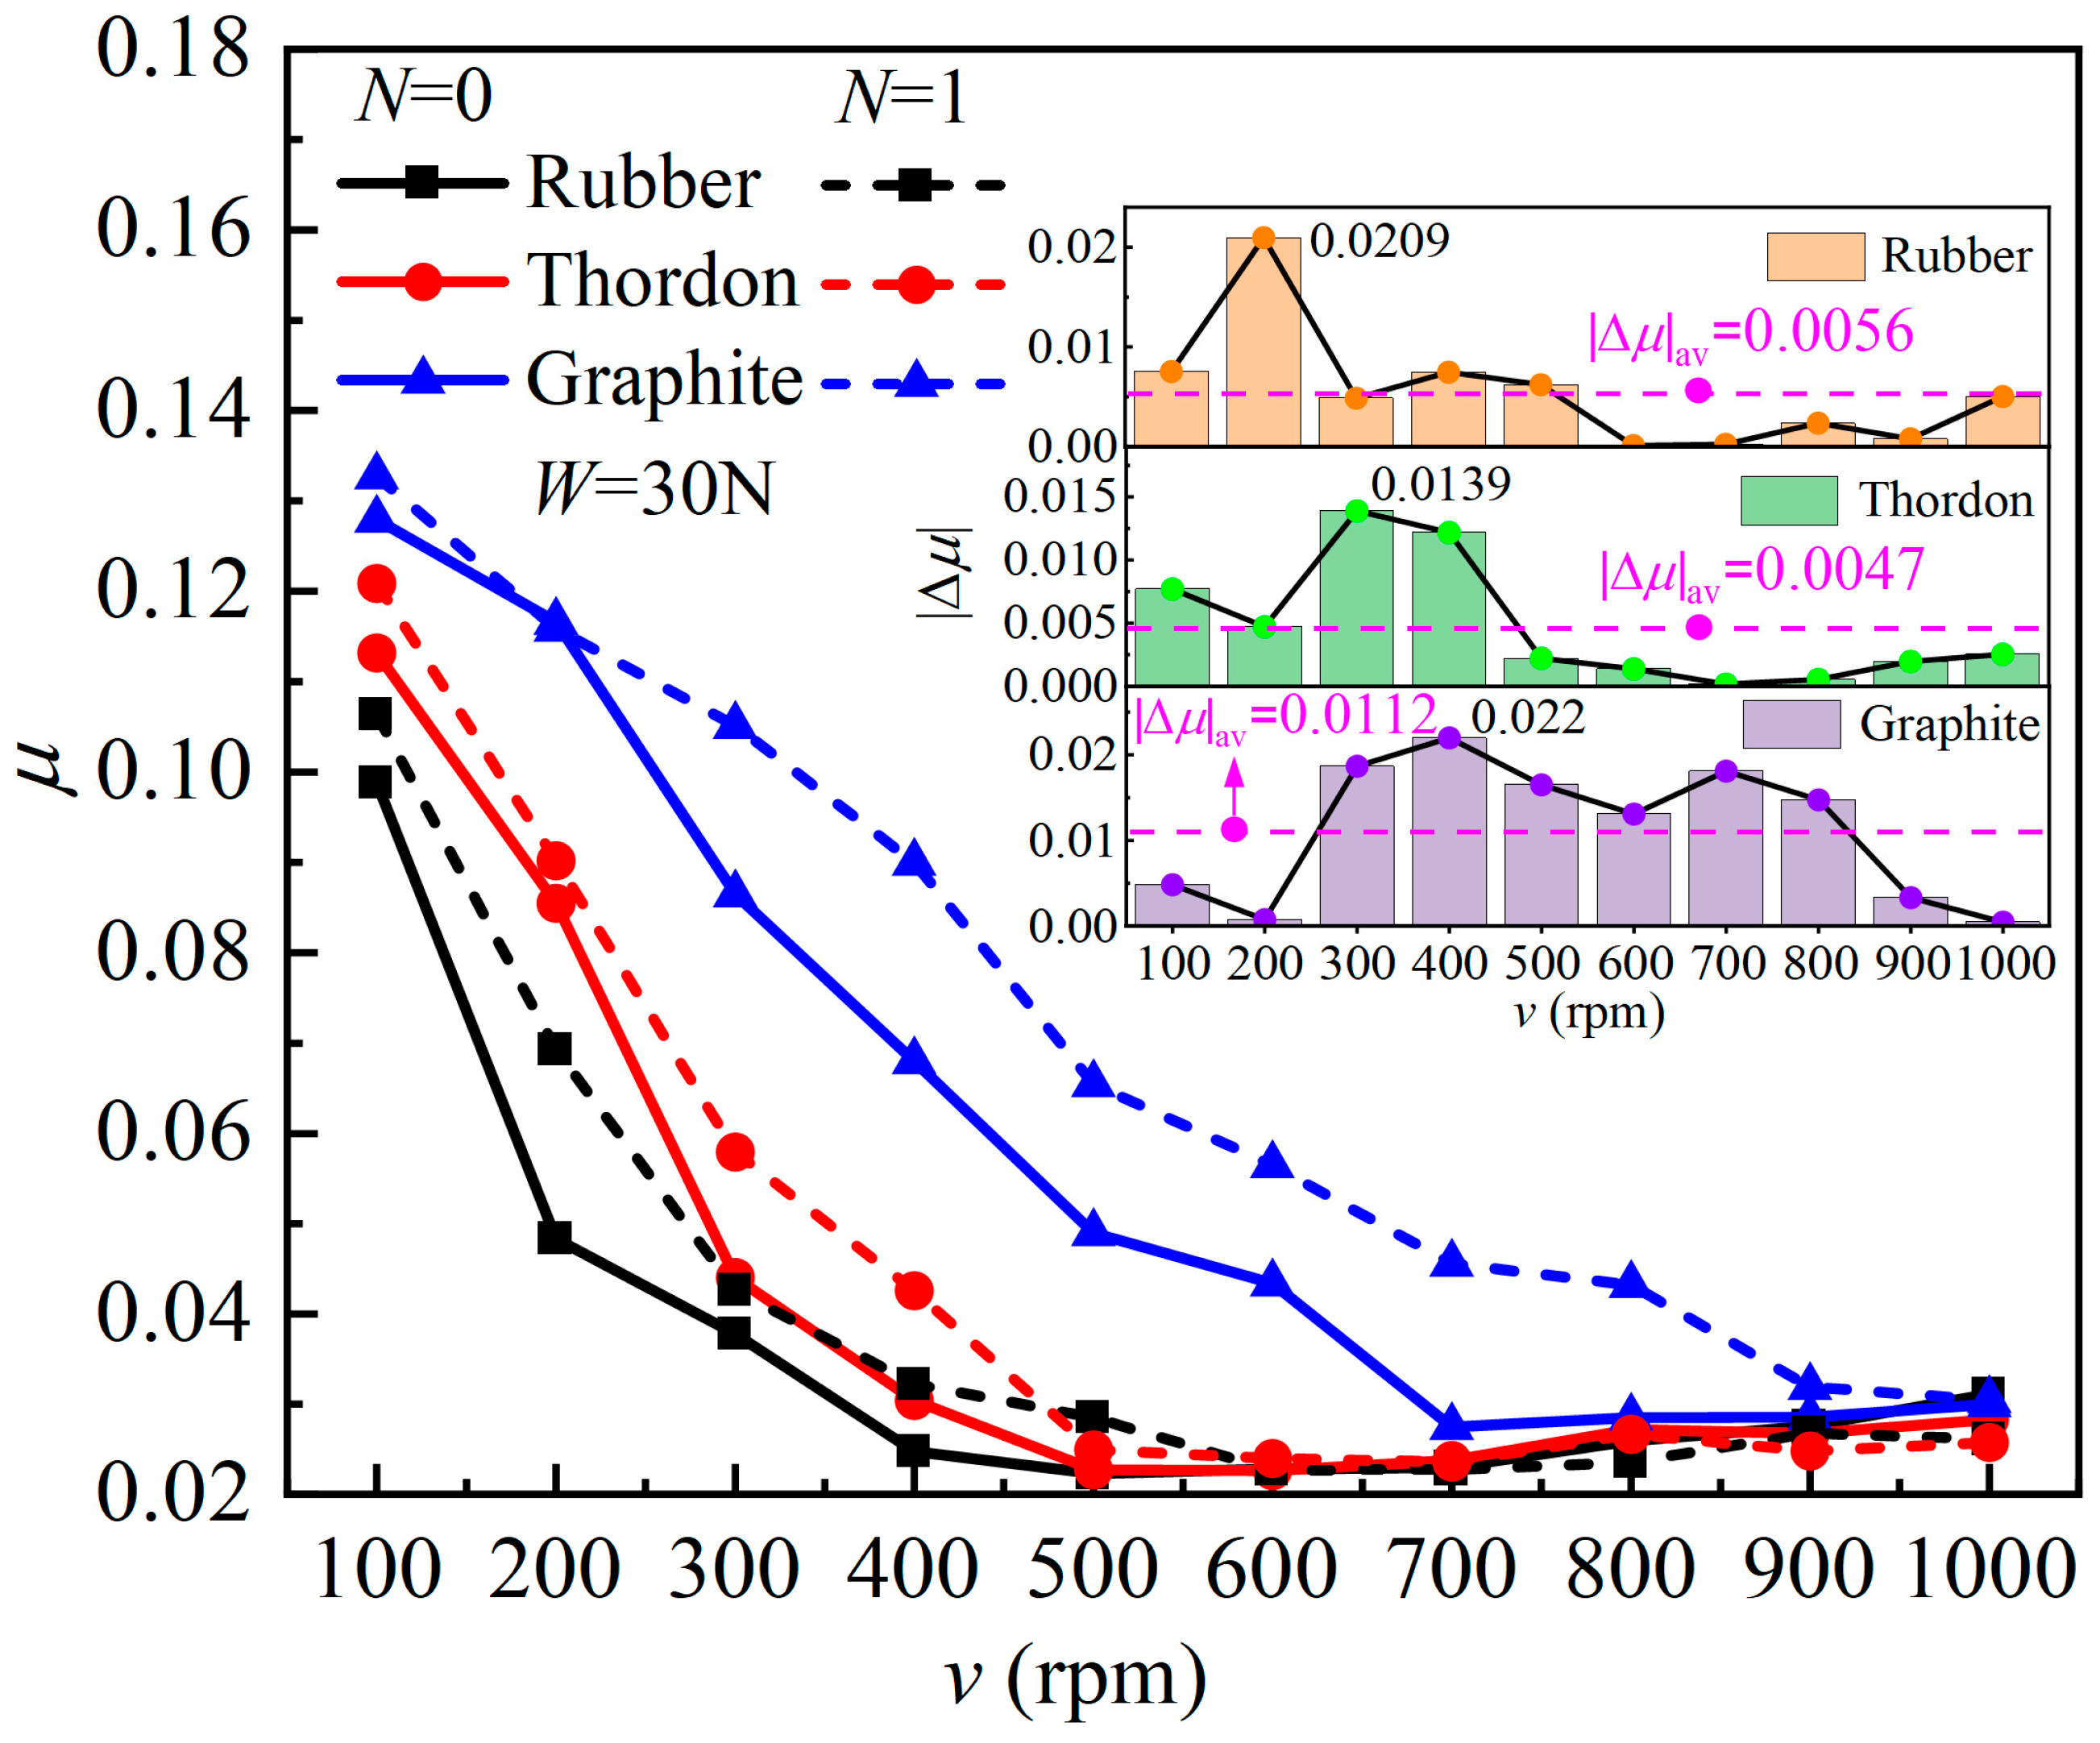
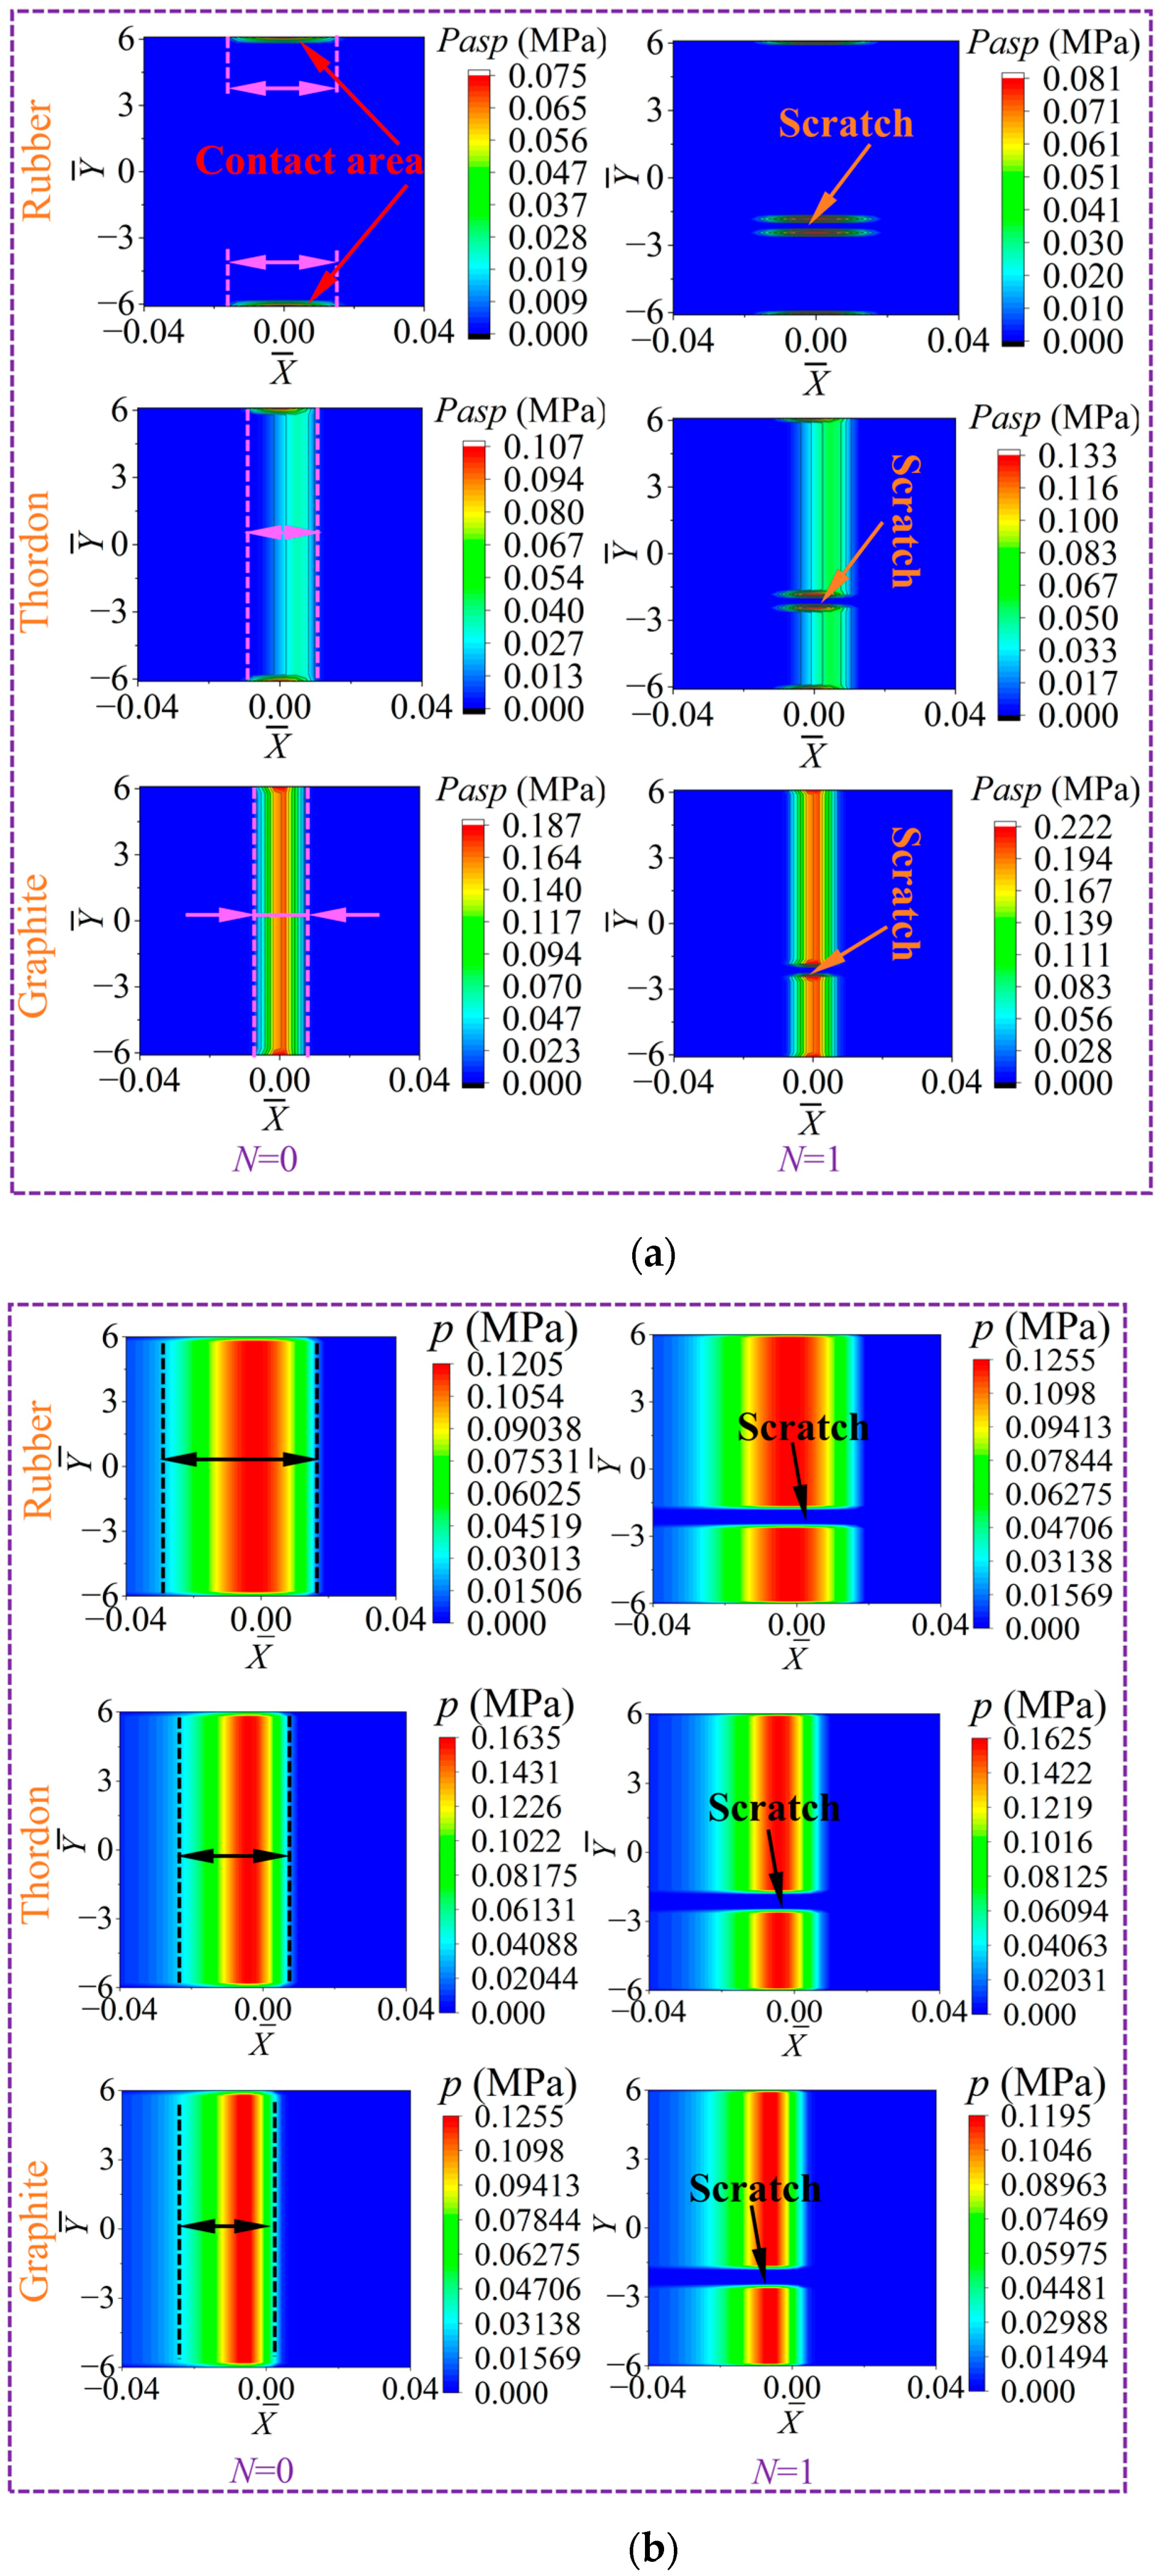
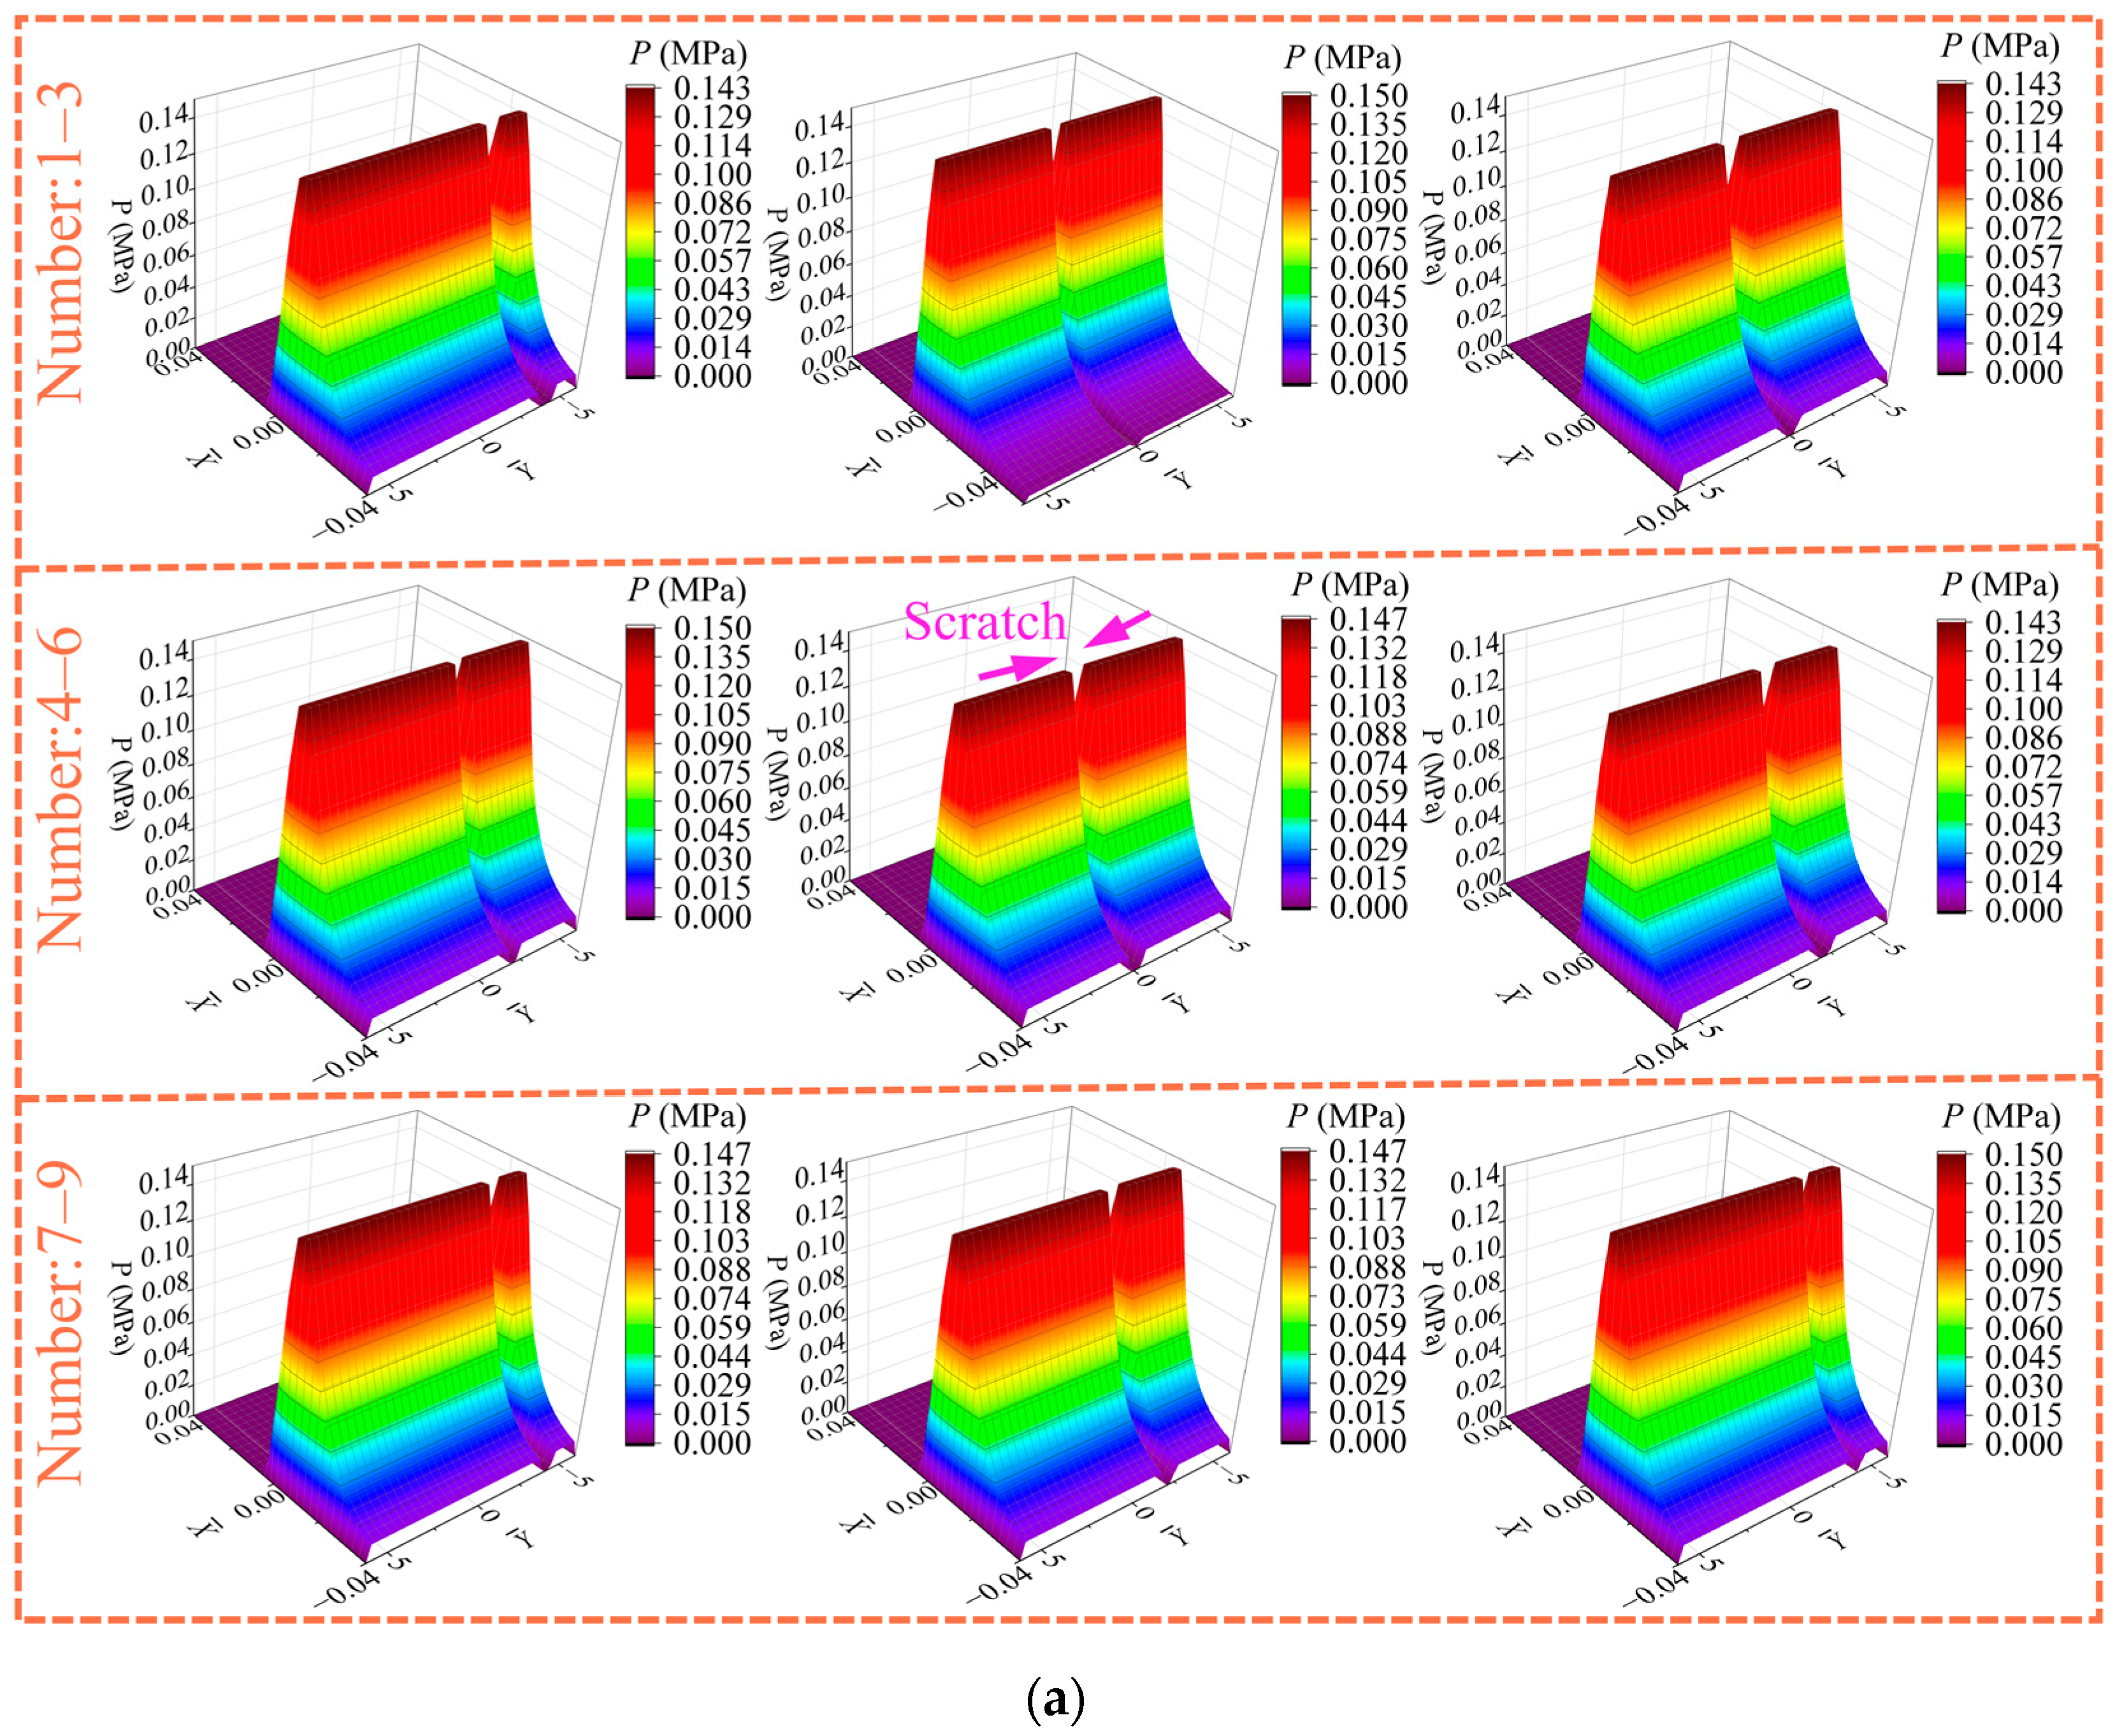
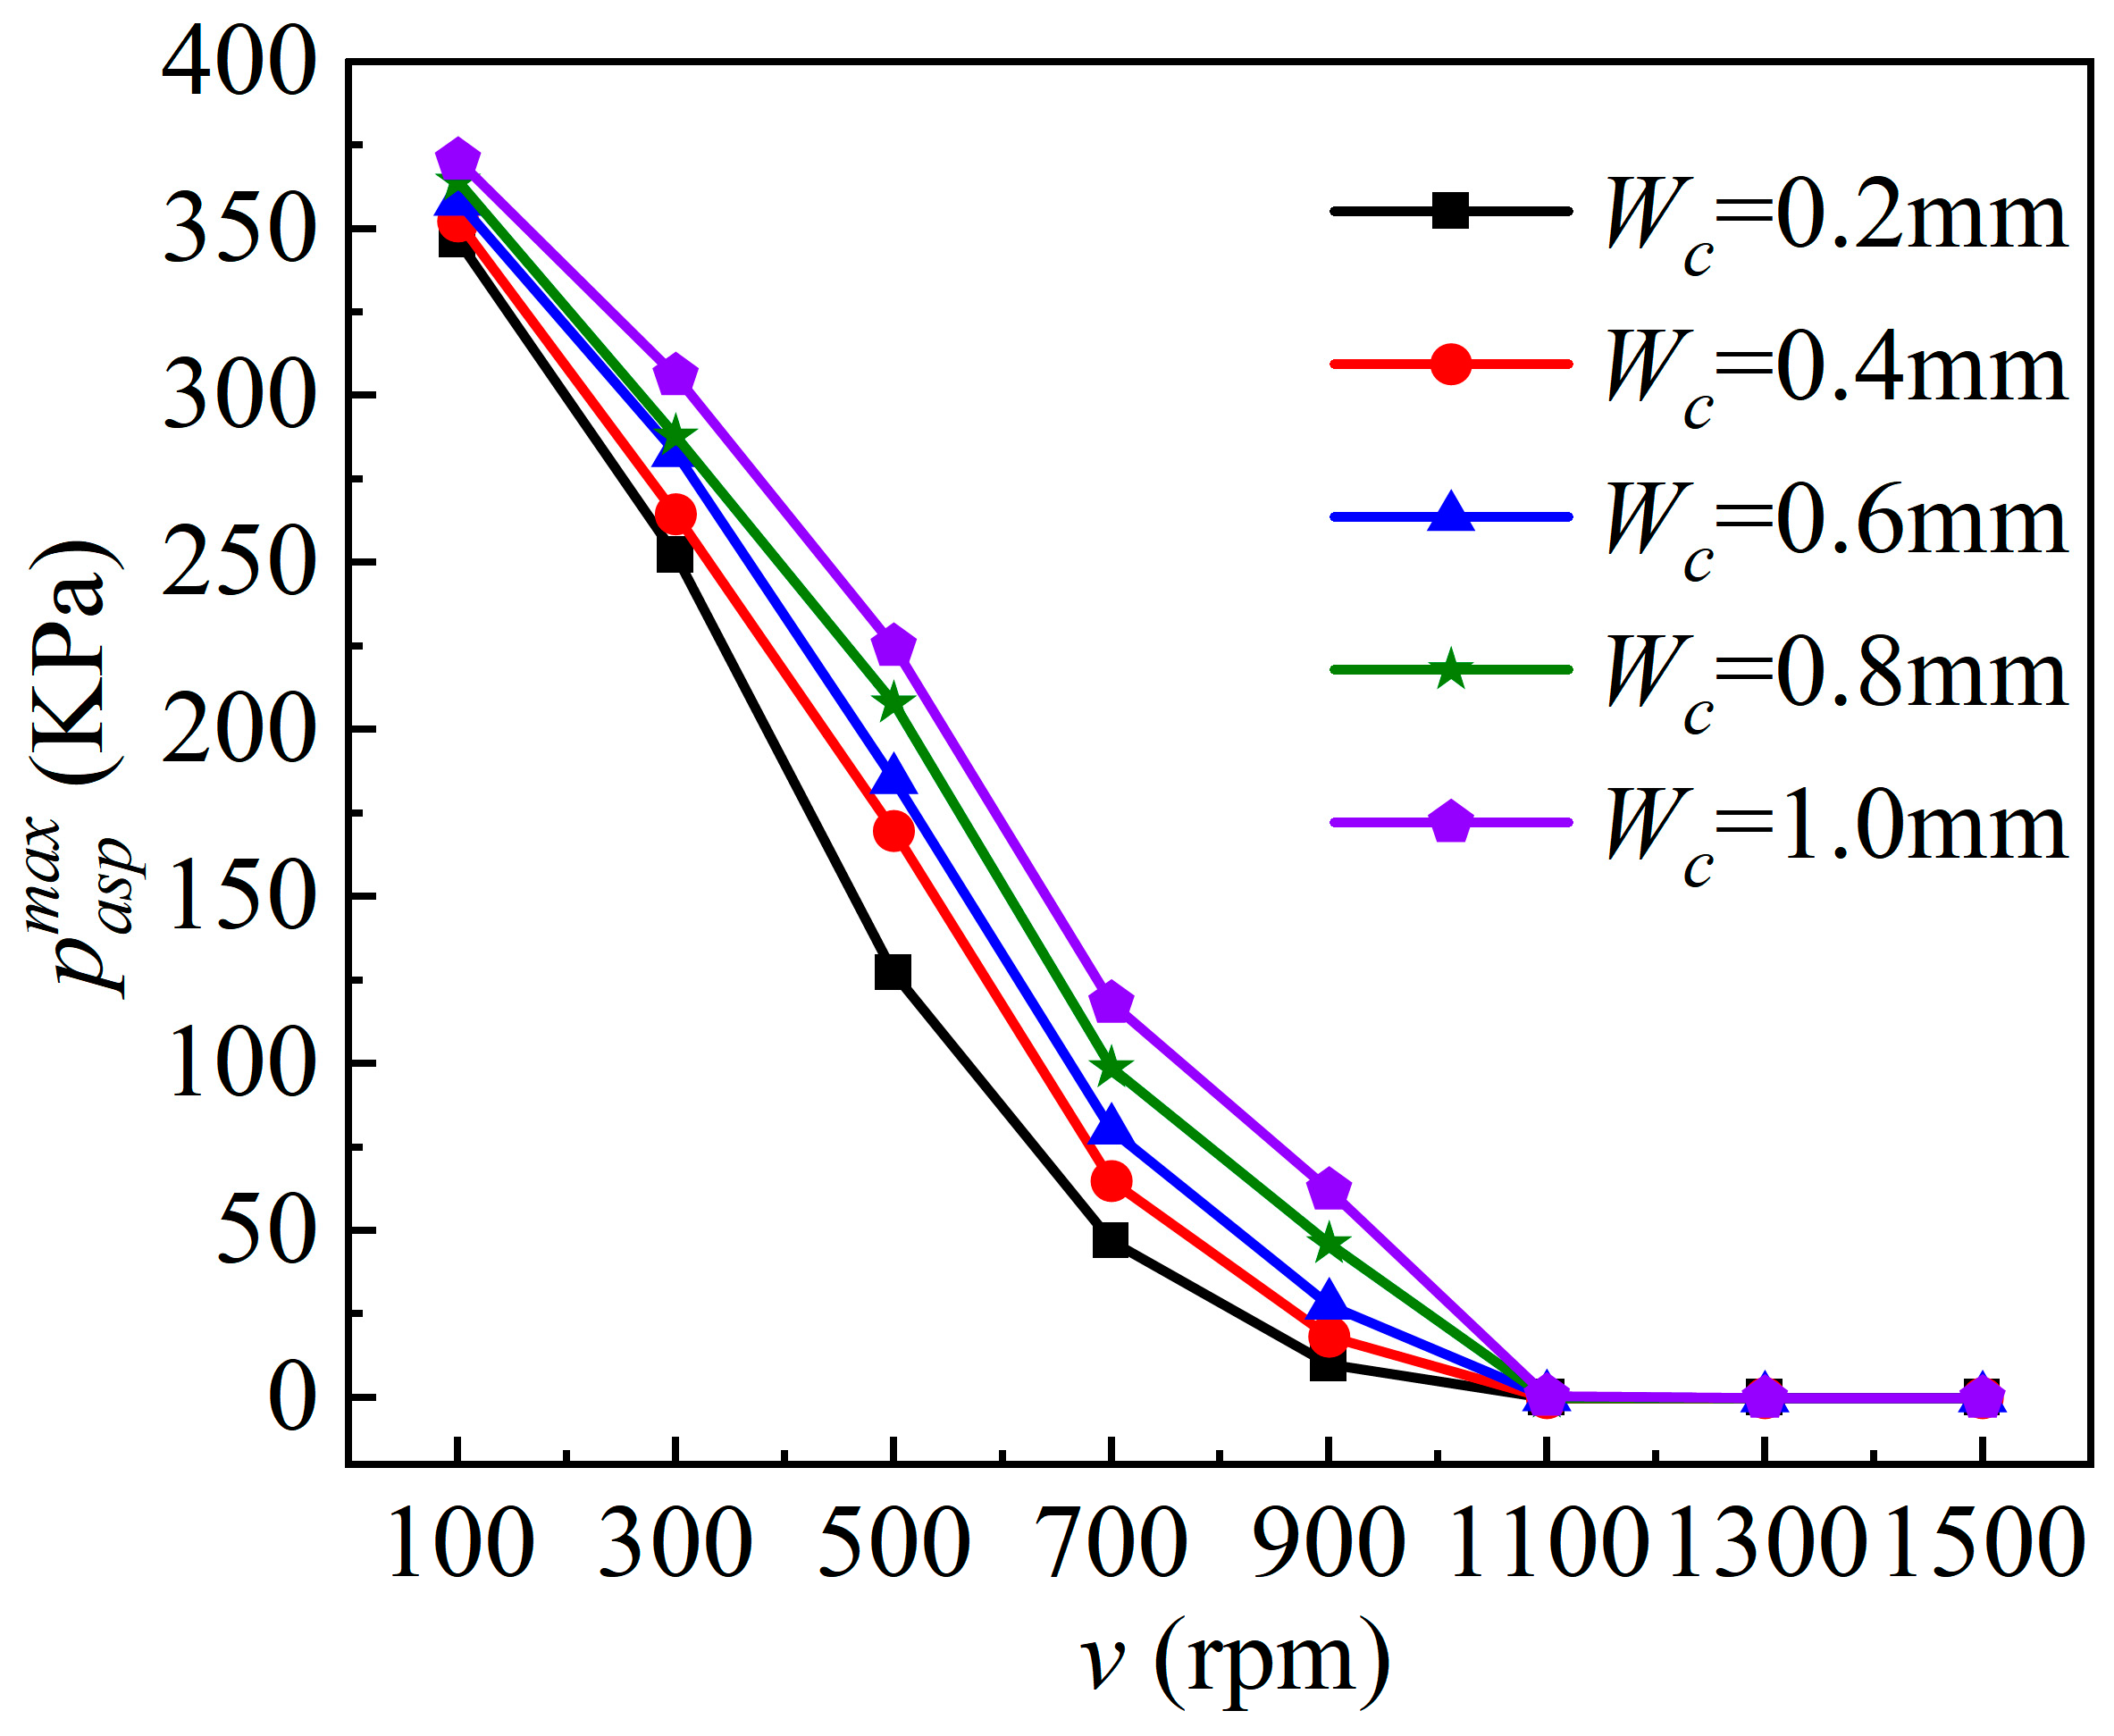
- Among the three types of test blocks, the tribological performance of the graphite block is the most sensitive to scratches. Scratches have a great effect on the friction coefficient of the graphite block, and the existence of scratches aggravates the microconvex contact and wear, which can severely reduce the service life of the friction pairs. Under the condition of one scratch (N = 1), the loading area of water film pressure is divided into two separate zones, i.e., a trapezoidal pressure zone and an extremely low-pressure zone. In addition, the variation of maximum water film pressure is determined by the positive effect (hydrodynamic pressure effect of fluid) and negative effect (“piercing effect” of the asperities).
- (2)
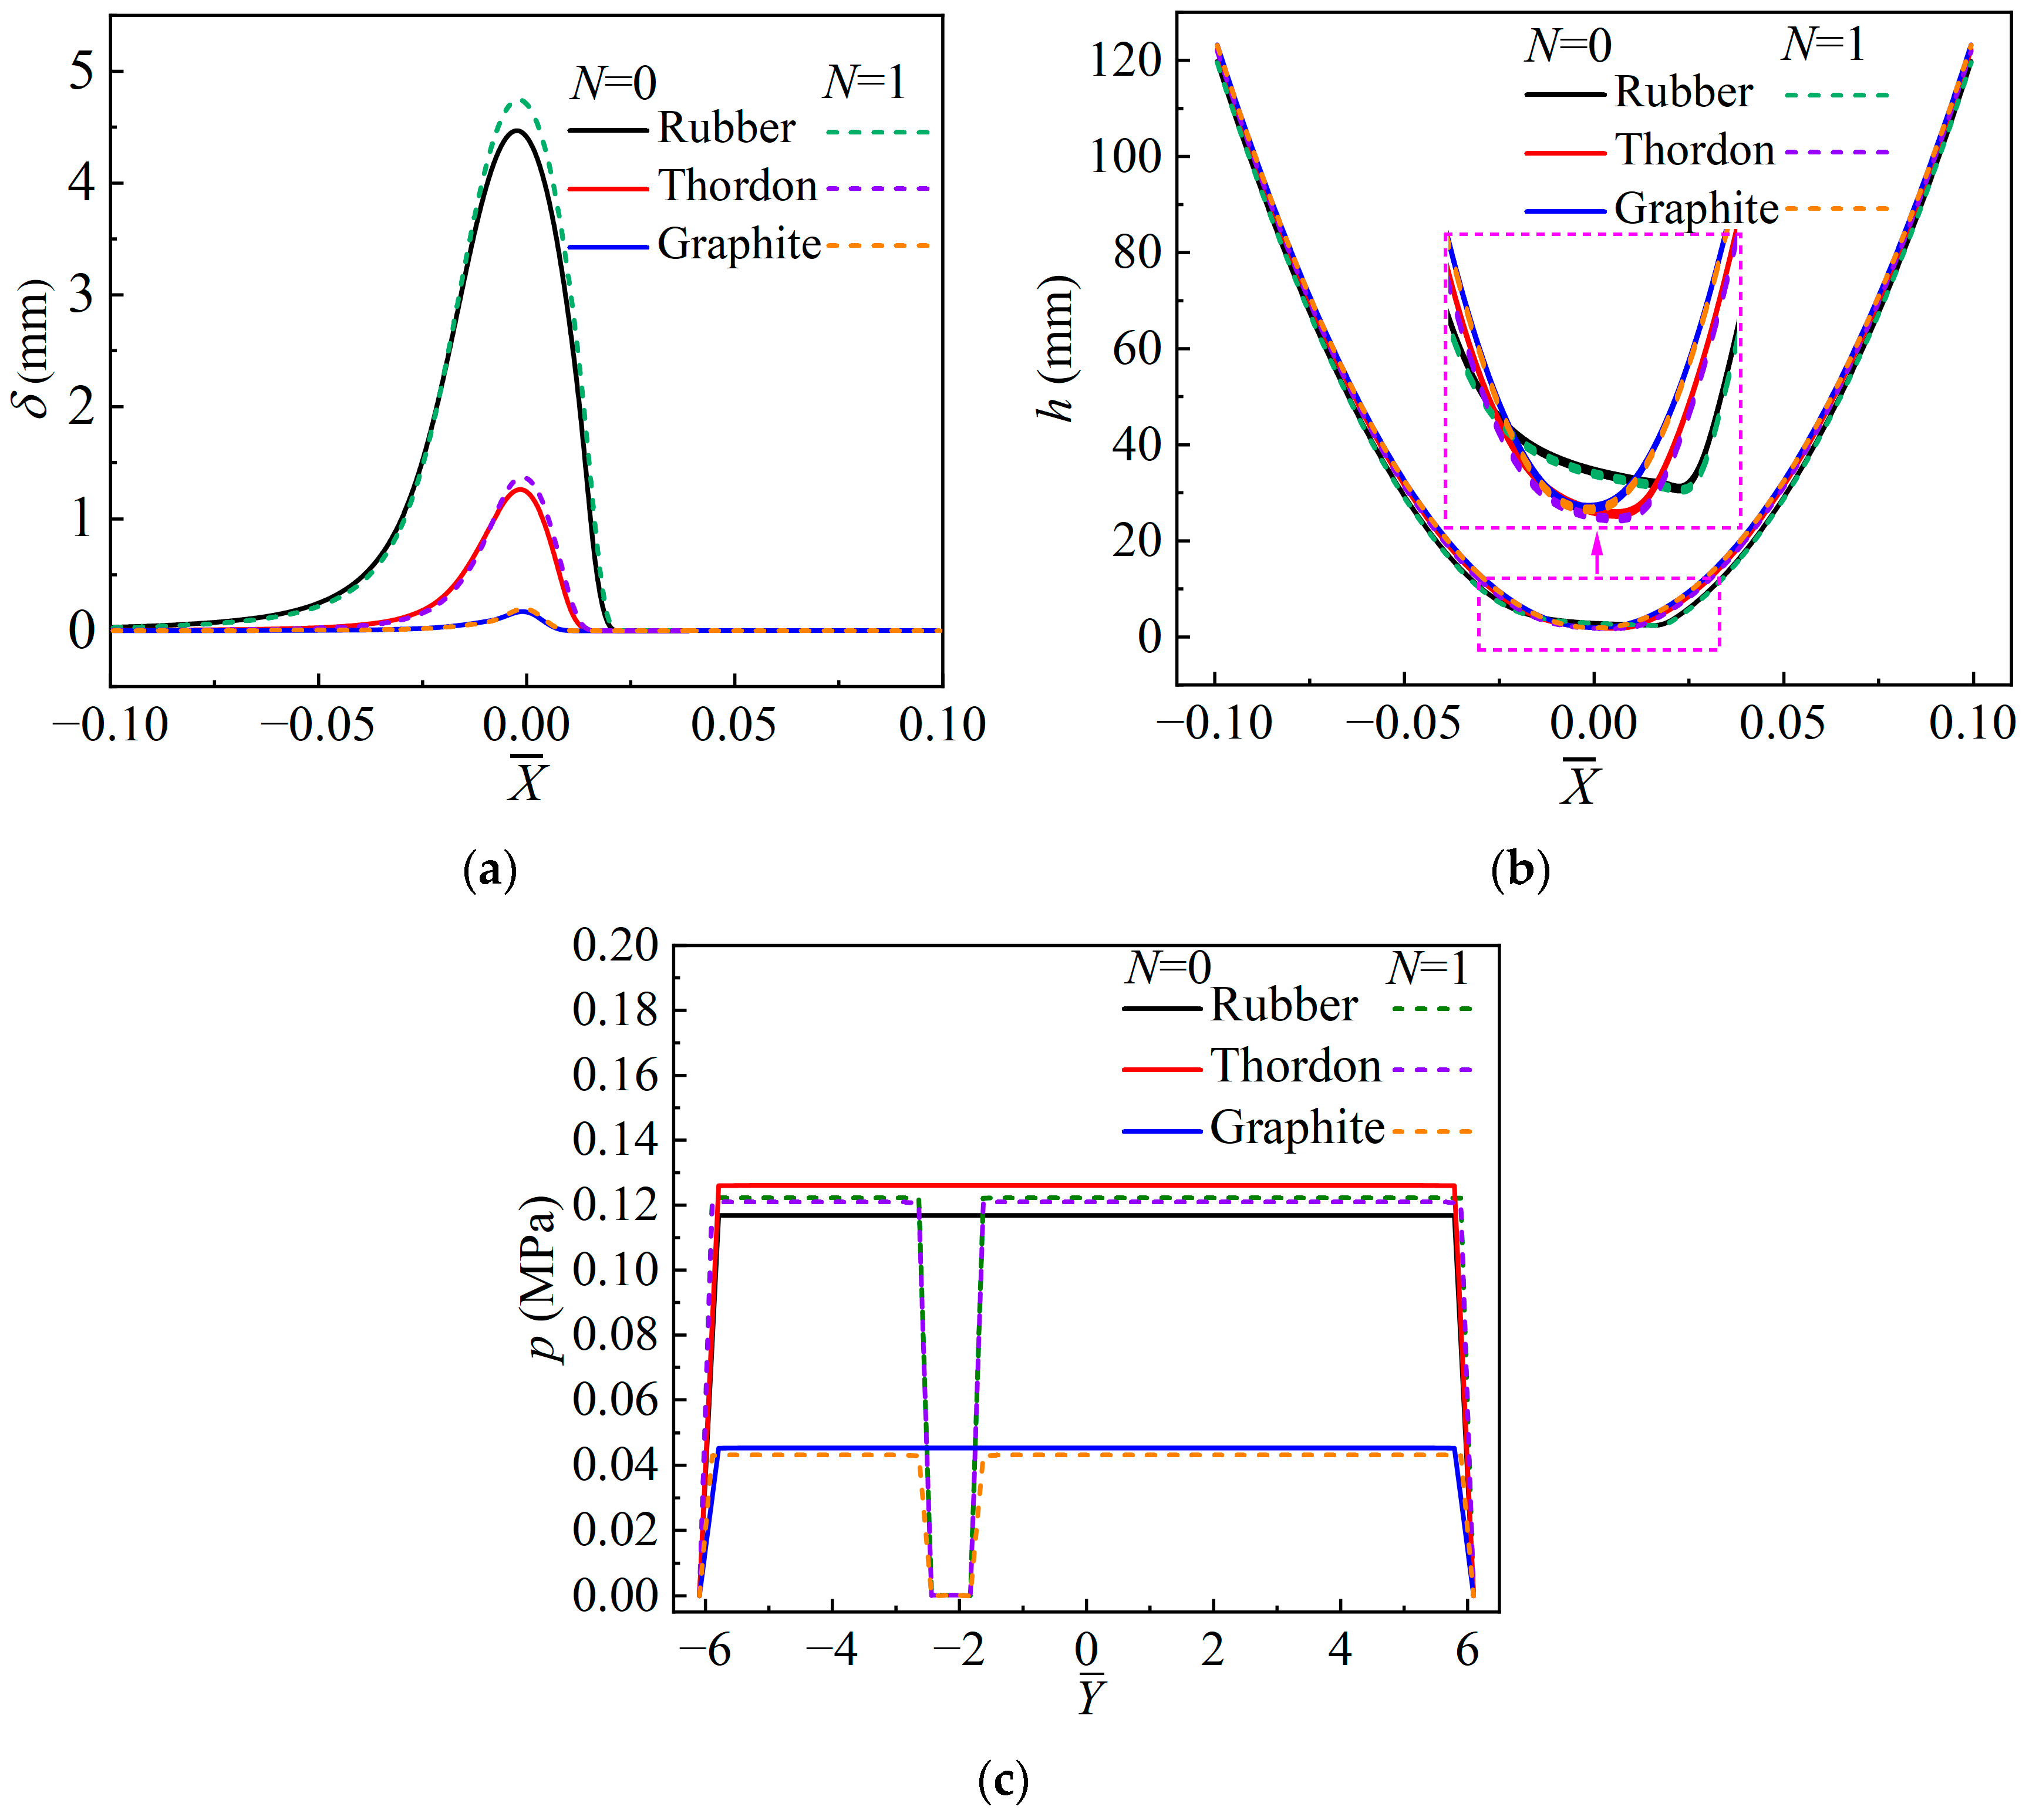
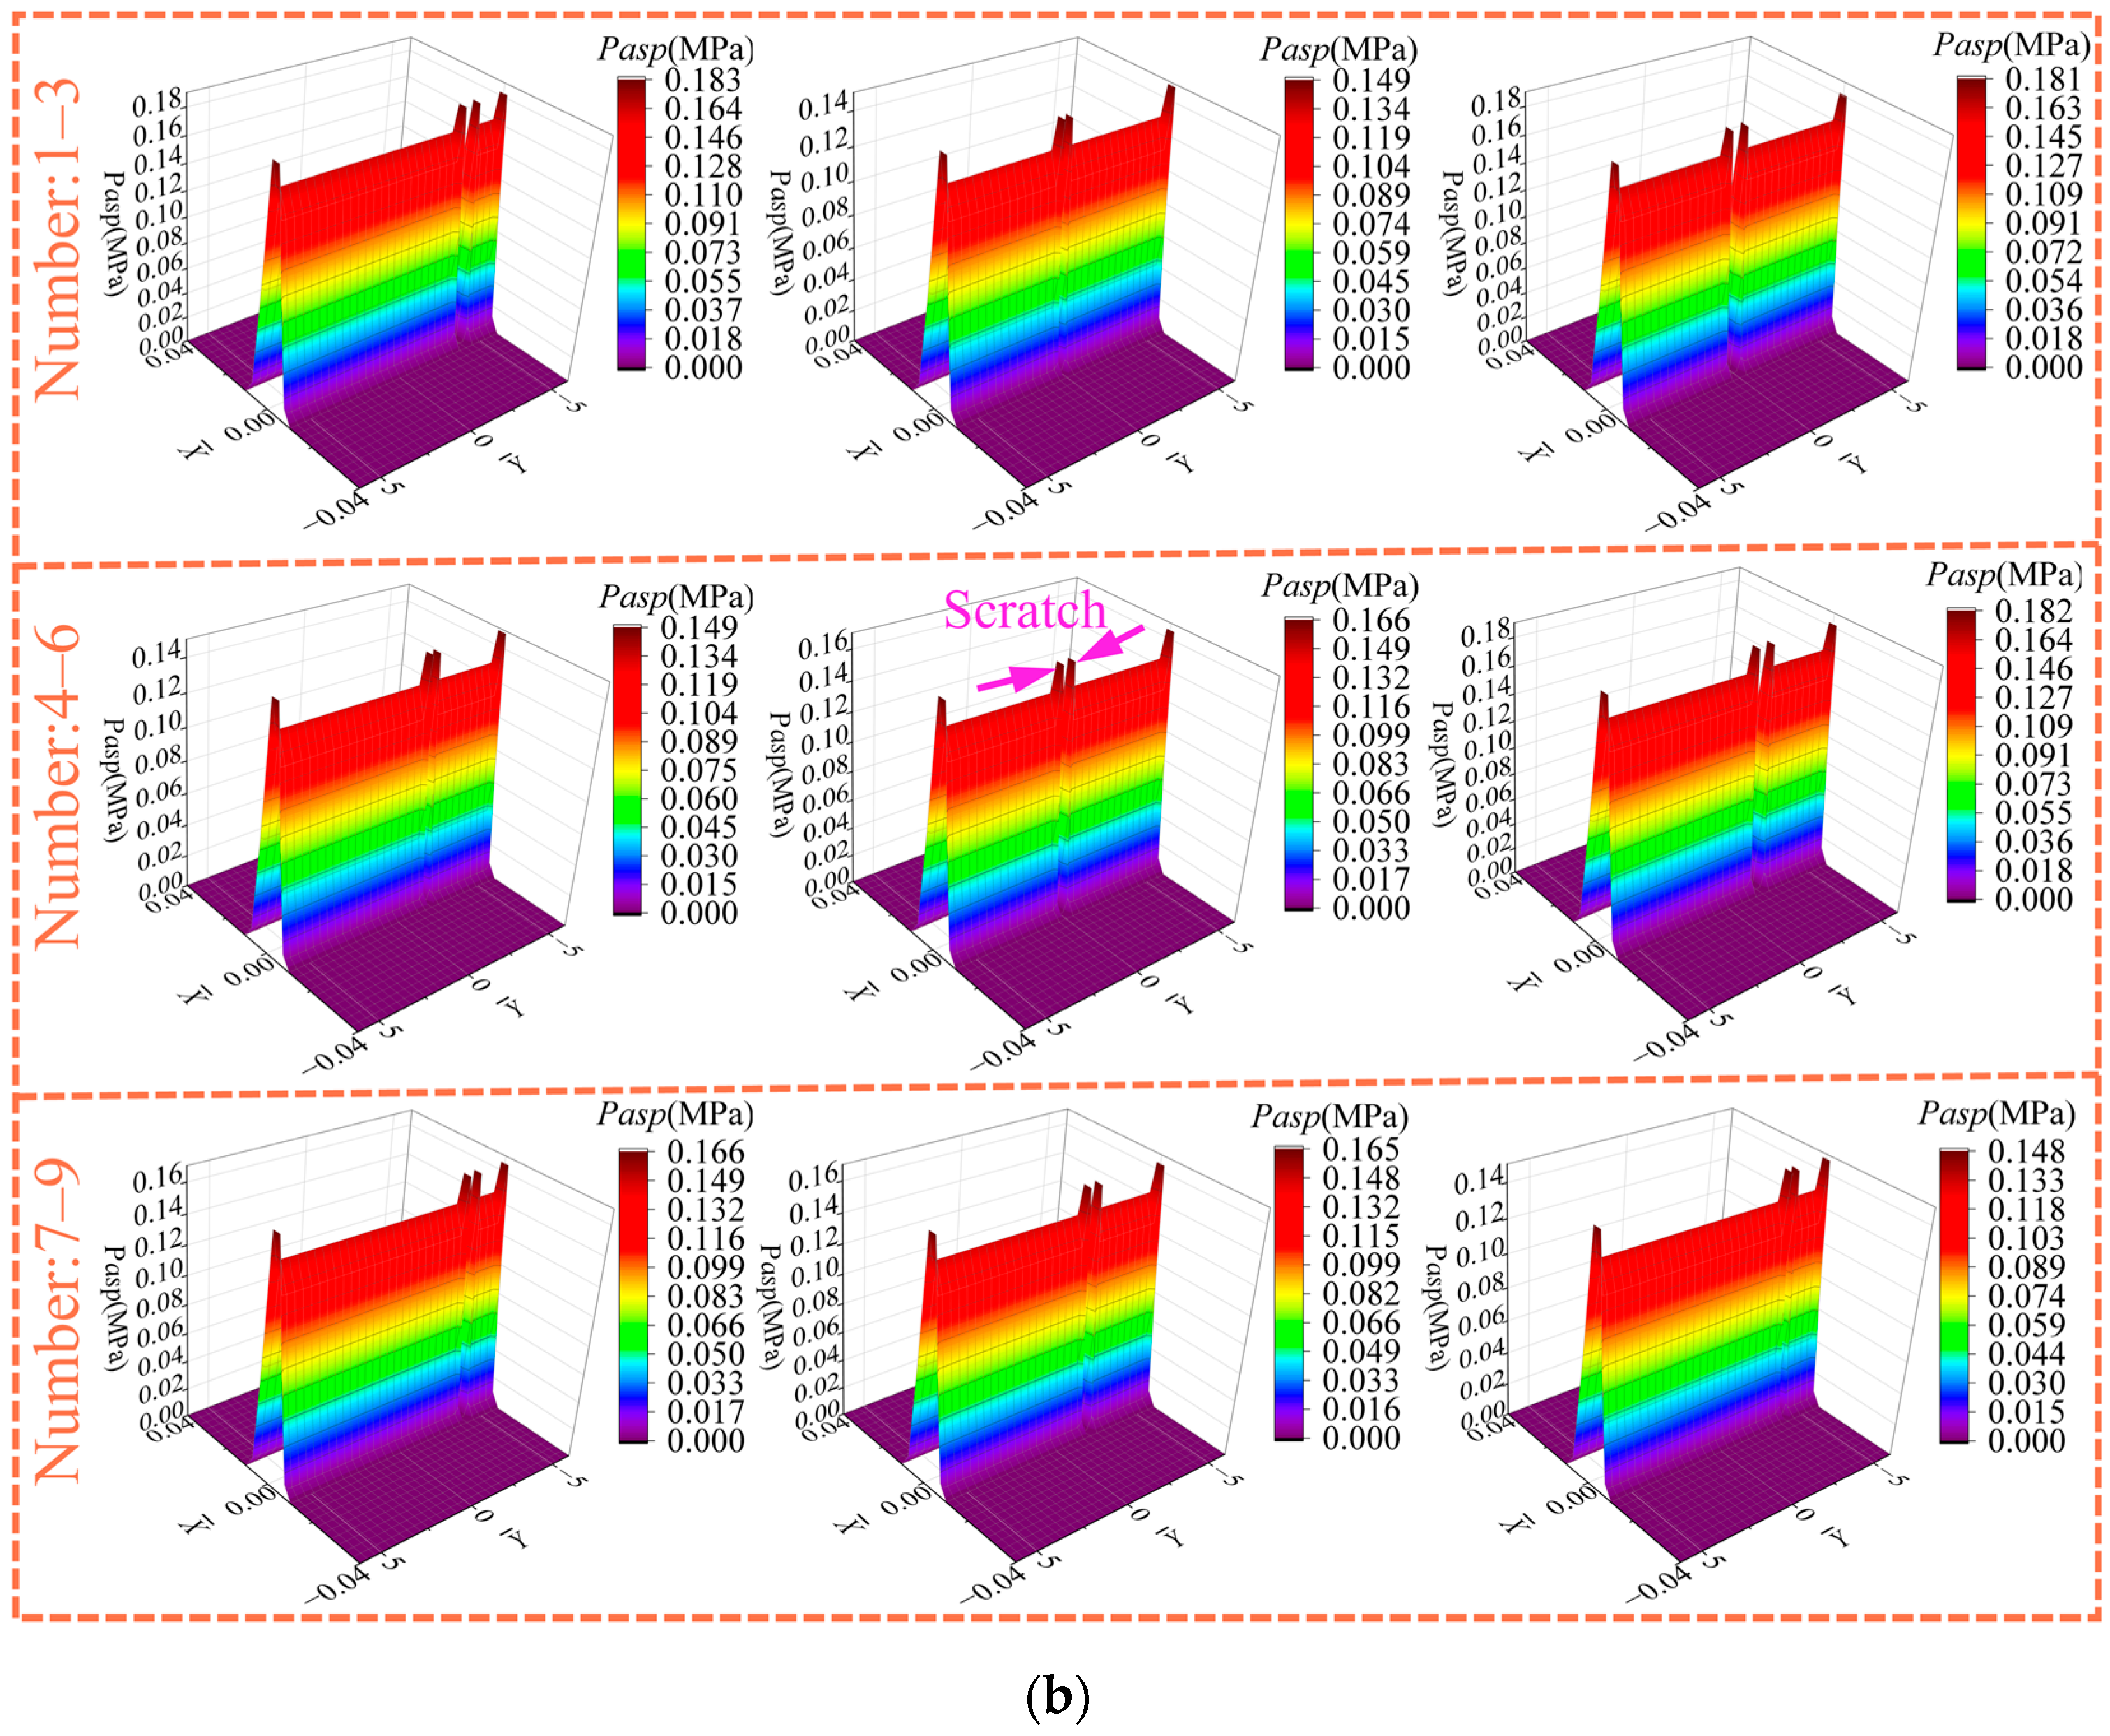
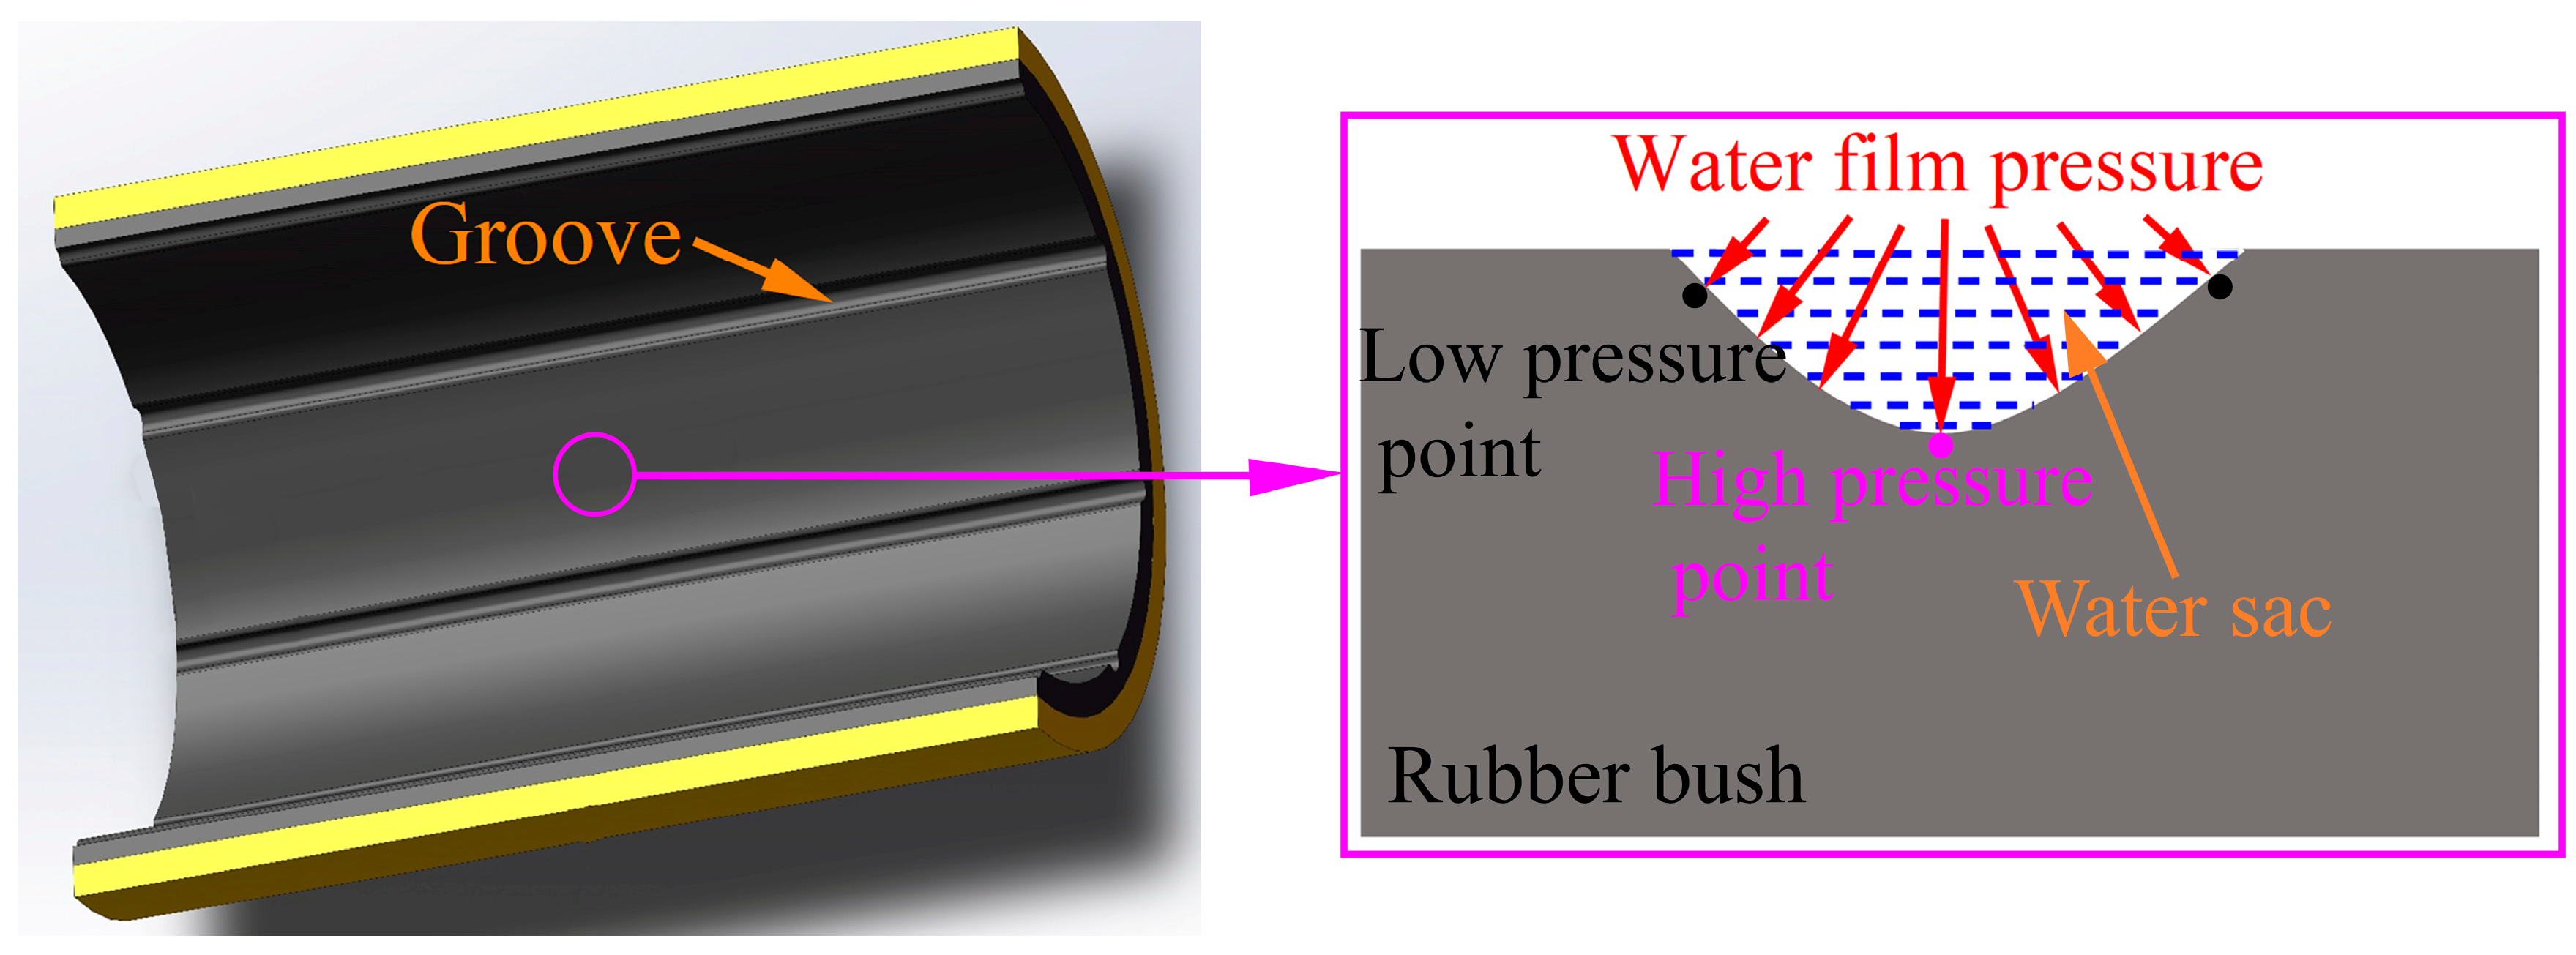
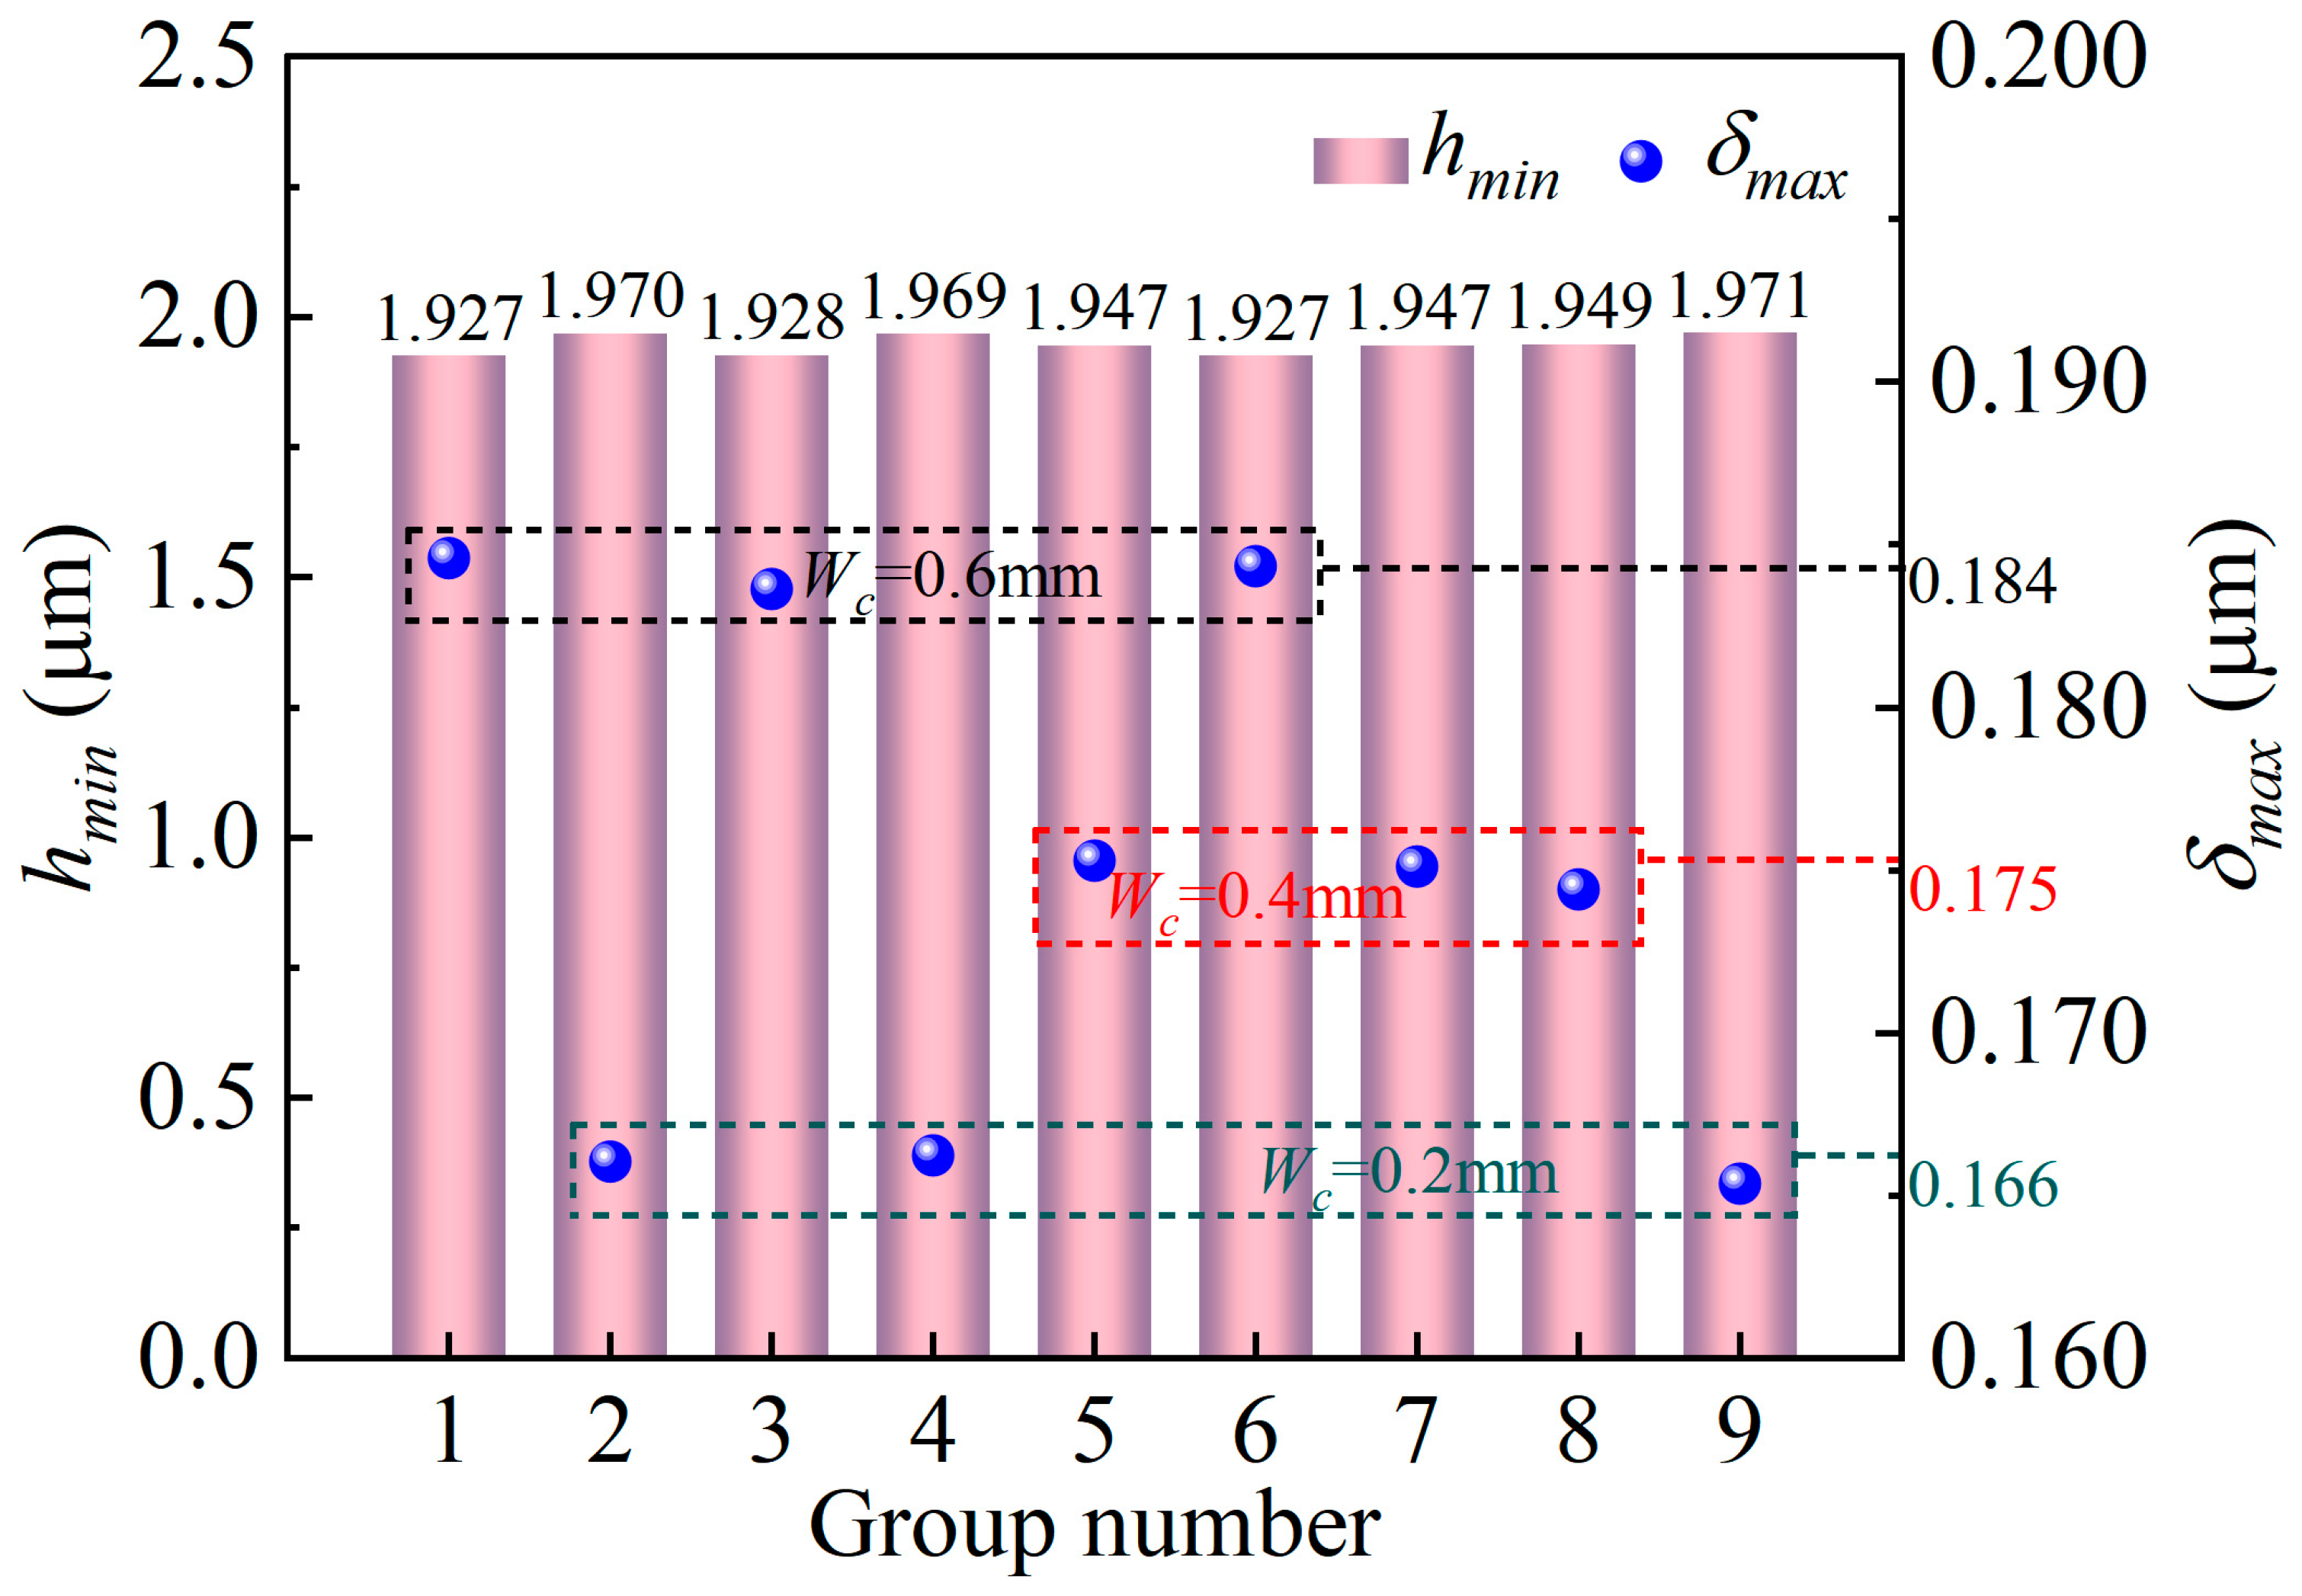
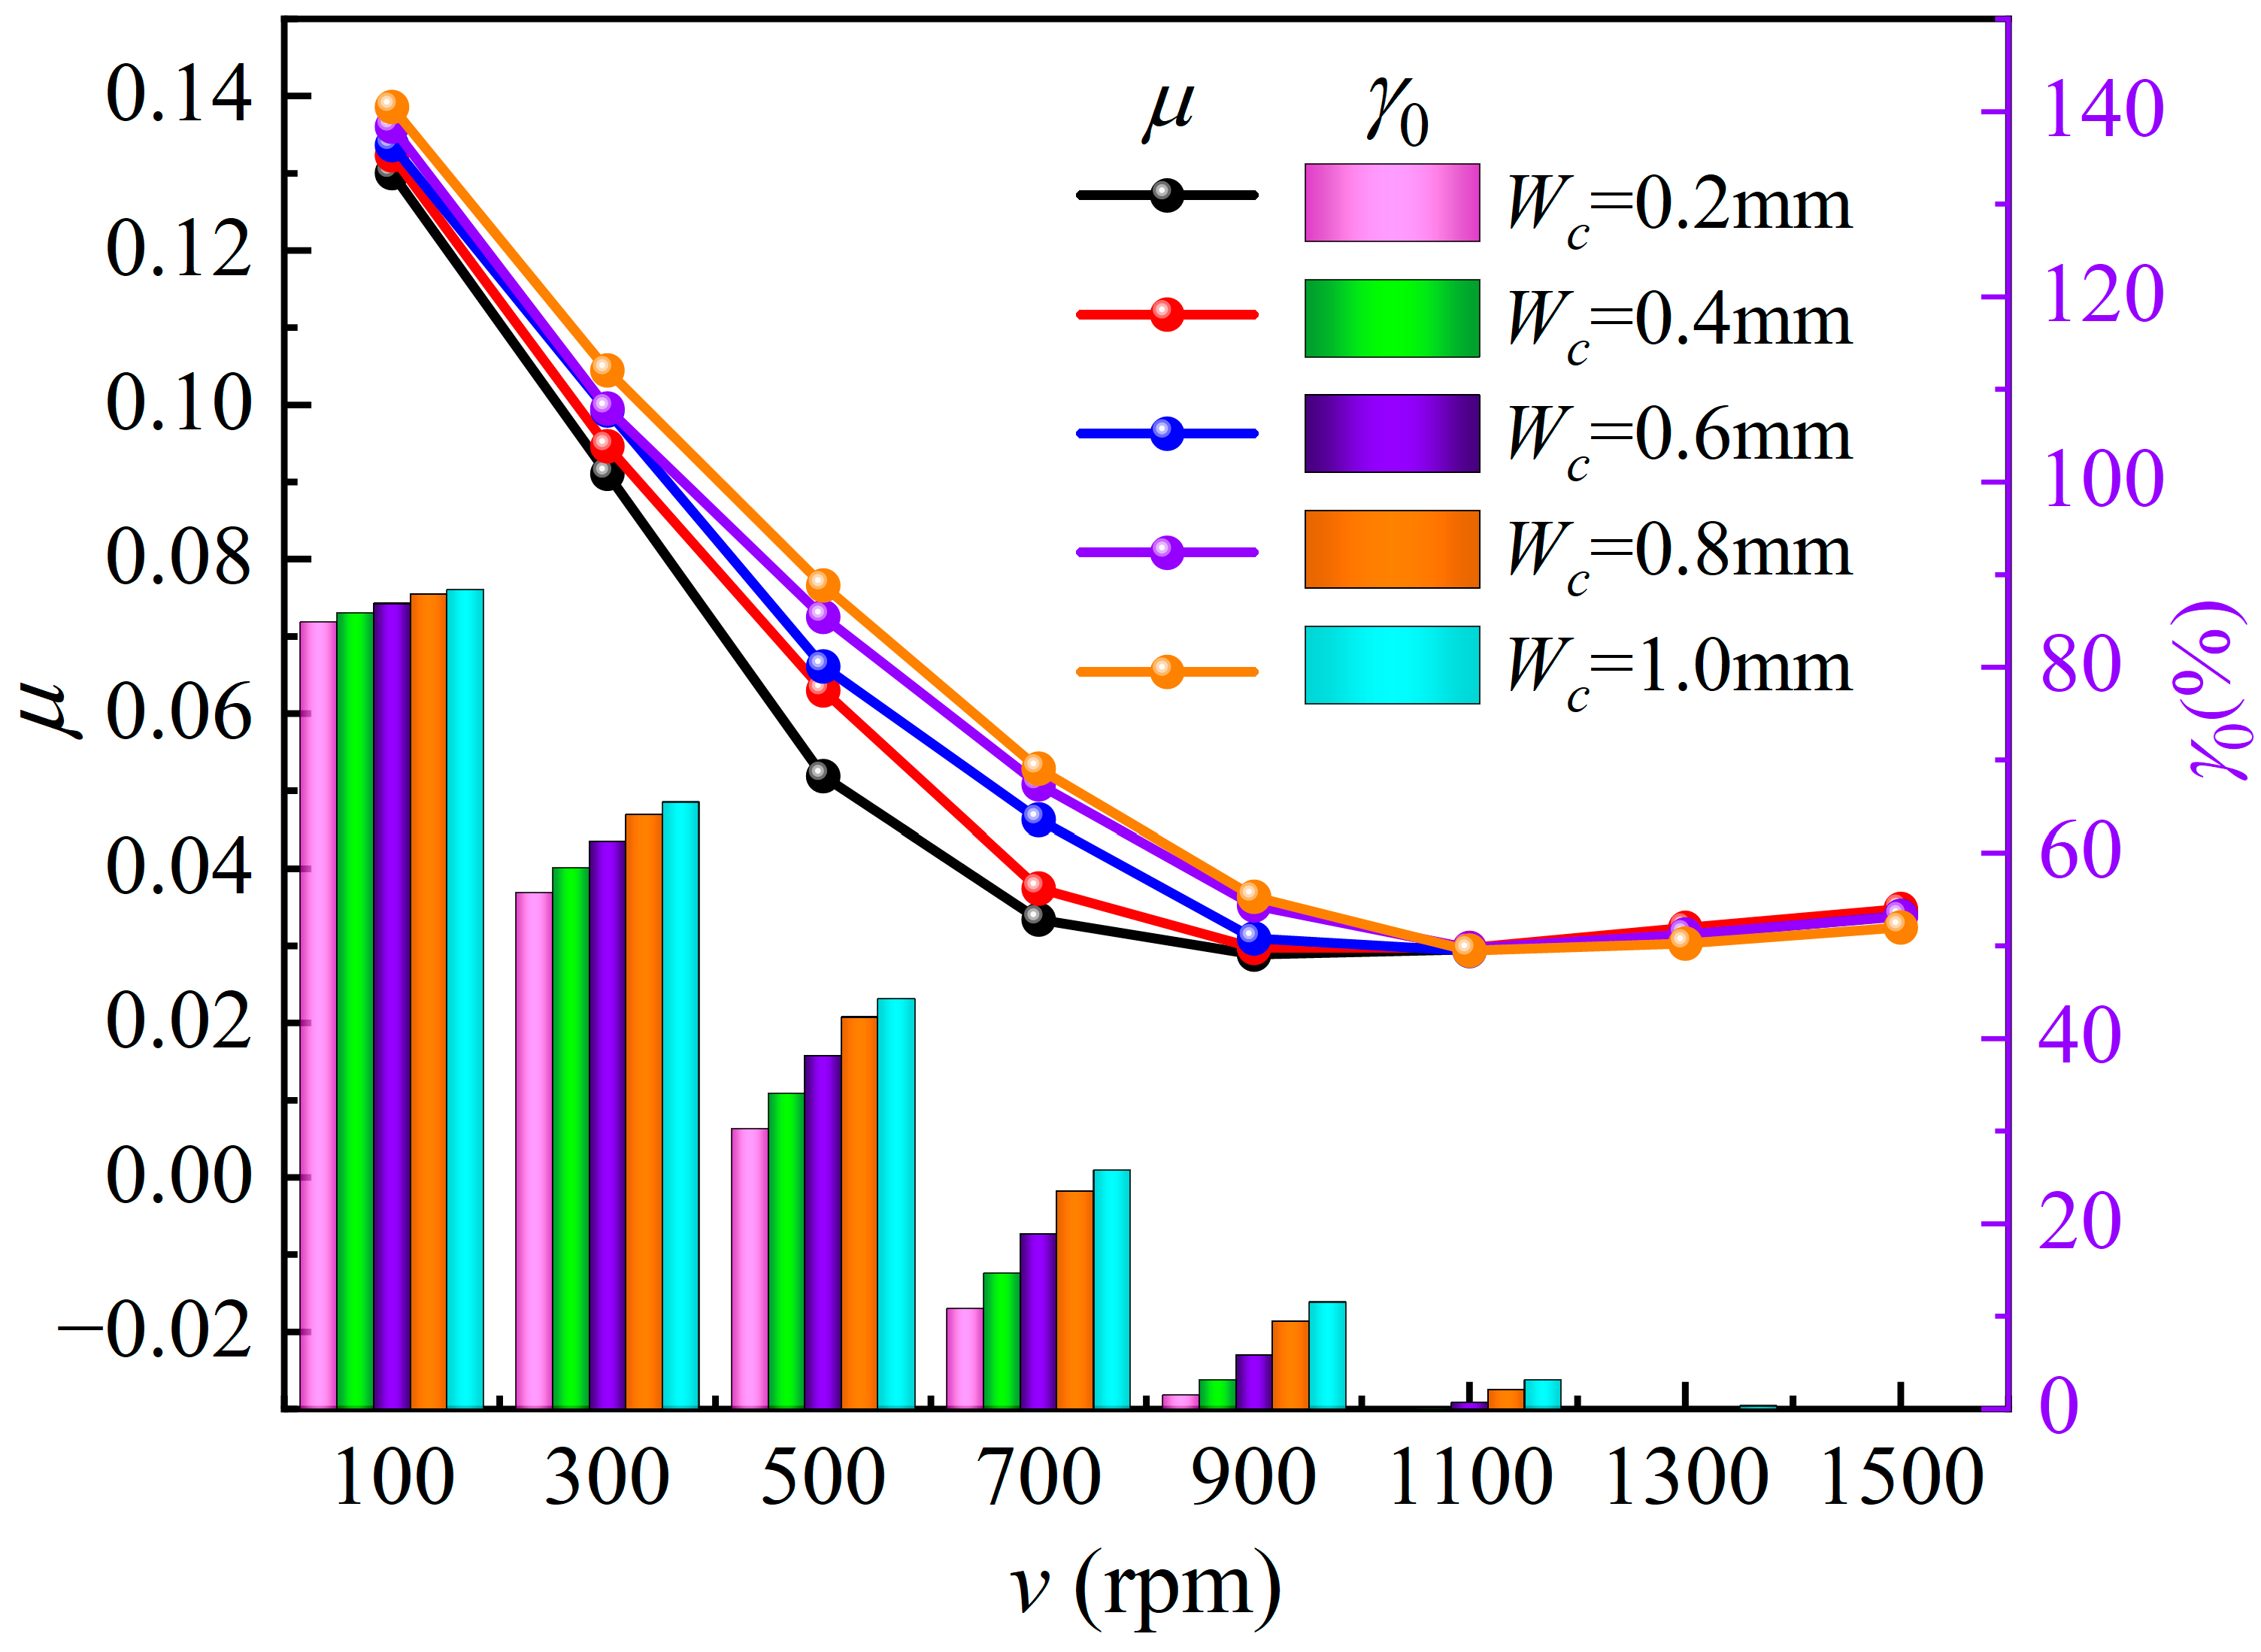
- Compared with scratch depth and scratch location, the scratch width has the greatest influence on the tribological performance of the graphite block, especially on the friction coefficient. This is because a widening scratch can reduce the loading area of water film and solid contact. Supporting the load needs a smaller film thickness and a stronger asperity contact, and thus, the friction coefficient will significantly go up. The scratch depth and the scratch location have little influence on tribological performance (minimum film thickness, maximum deformation, maximum water film pressure, maximum contact pressure). The maximum contact pressure is located at both edges of the scratch due to the formation of a water sac structure.
- (3)
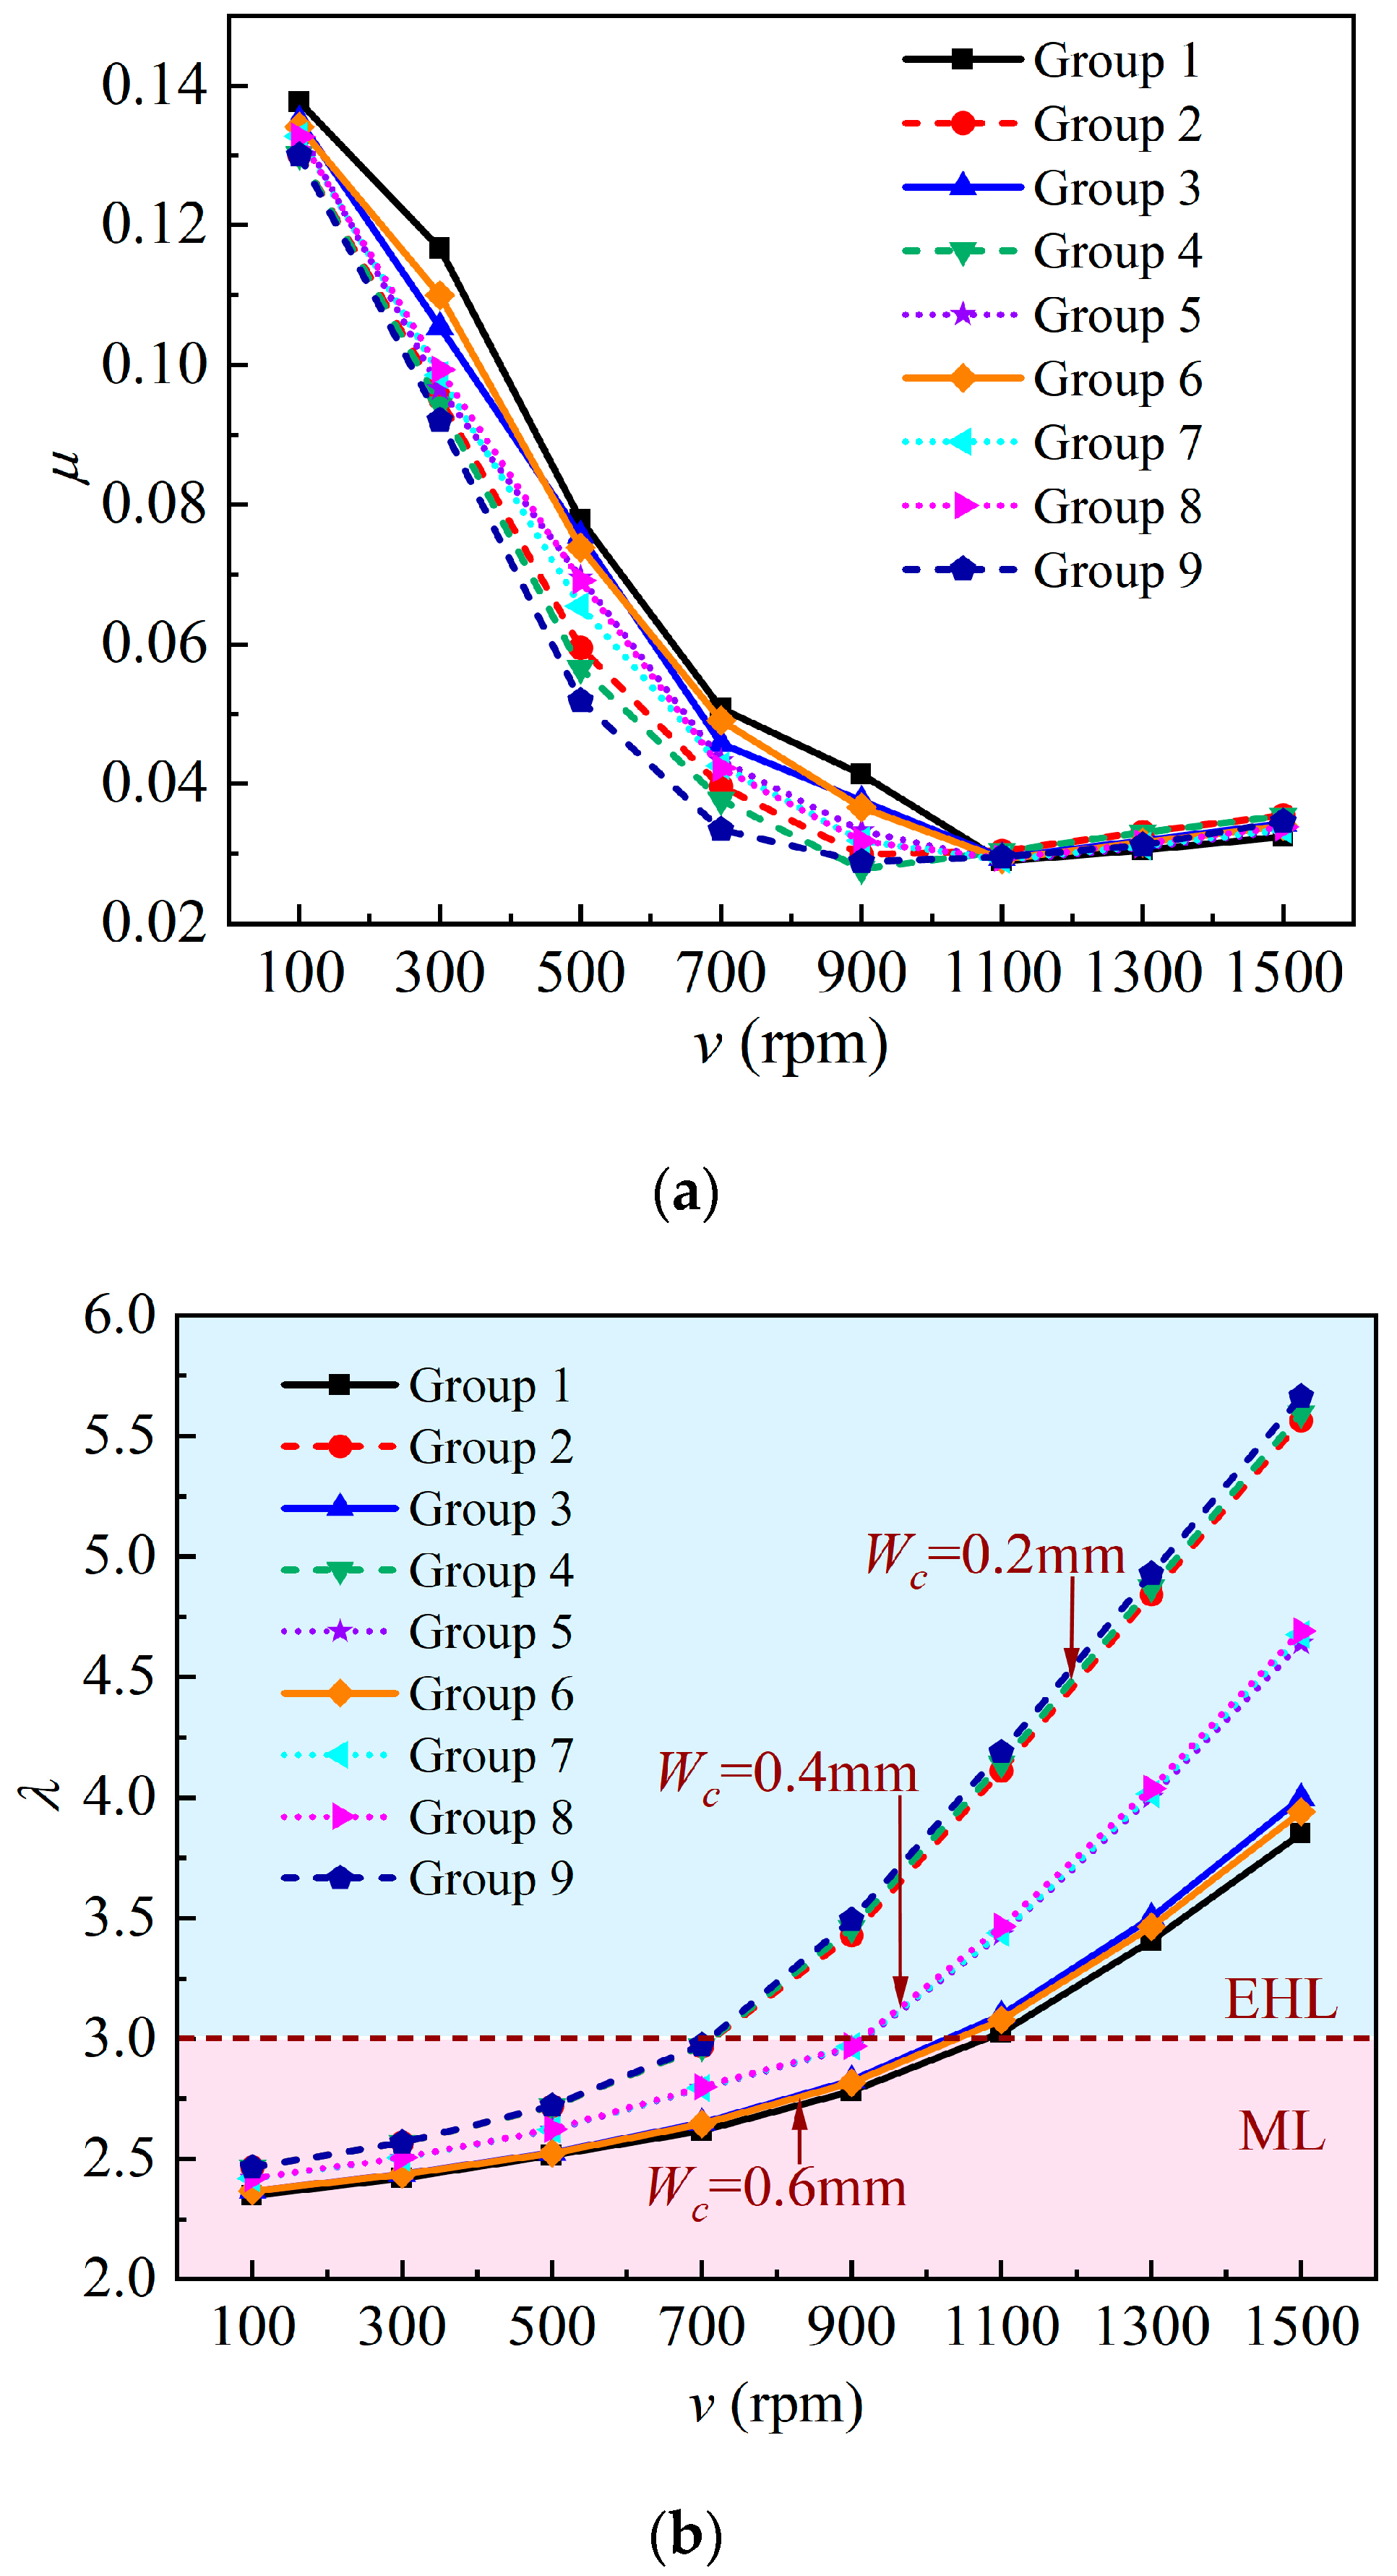
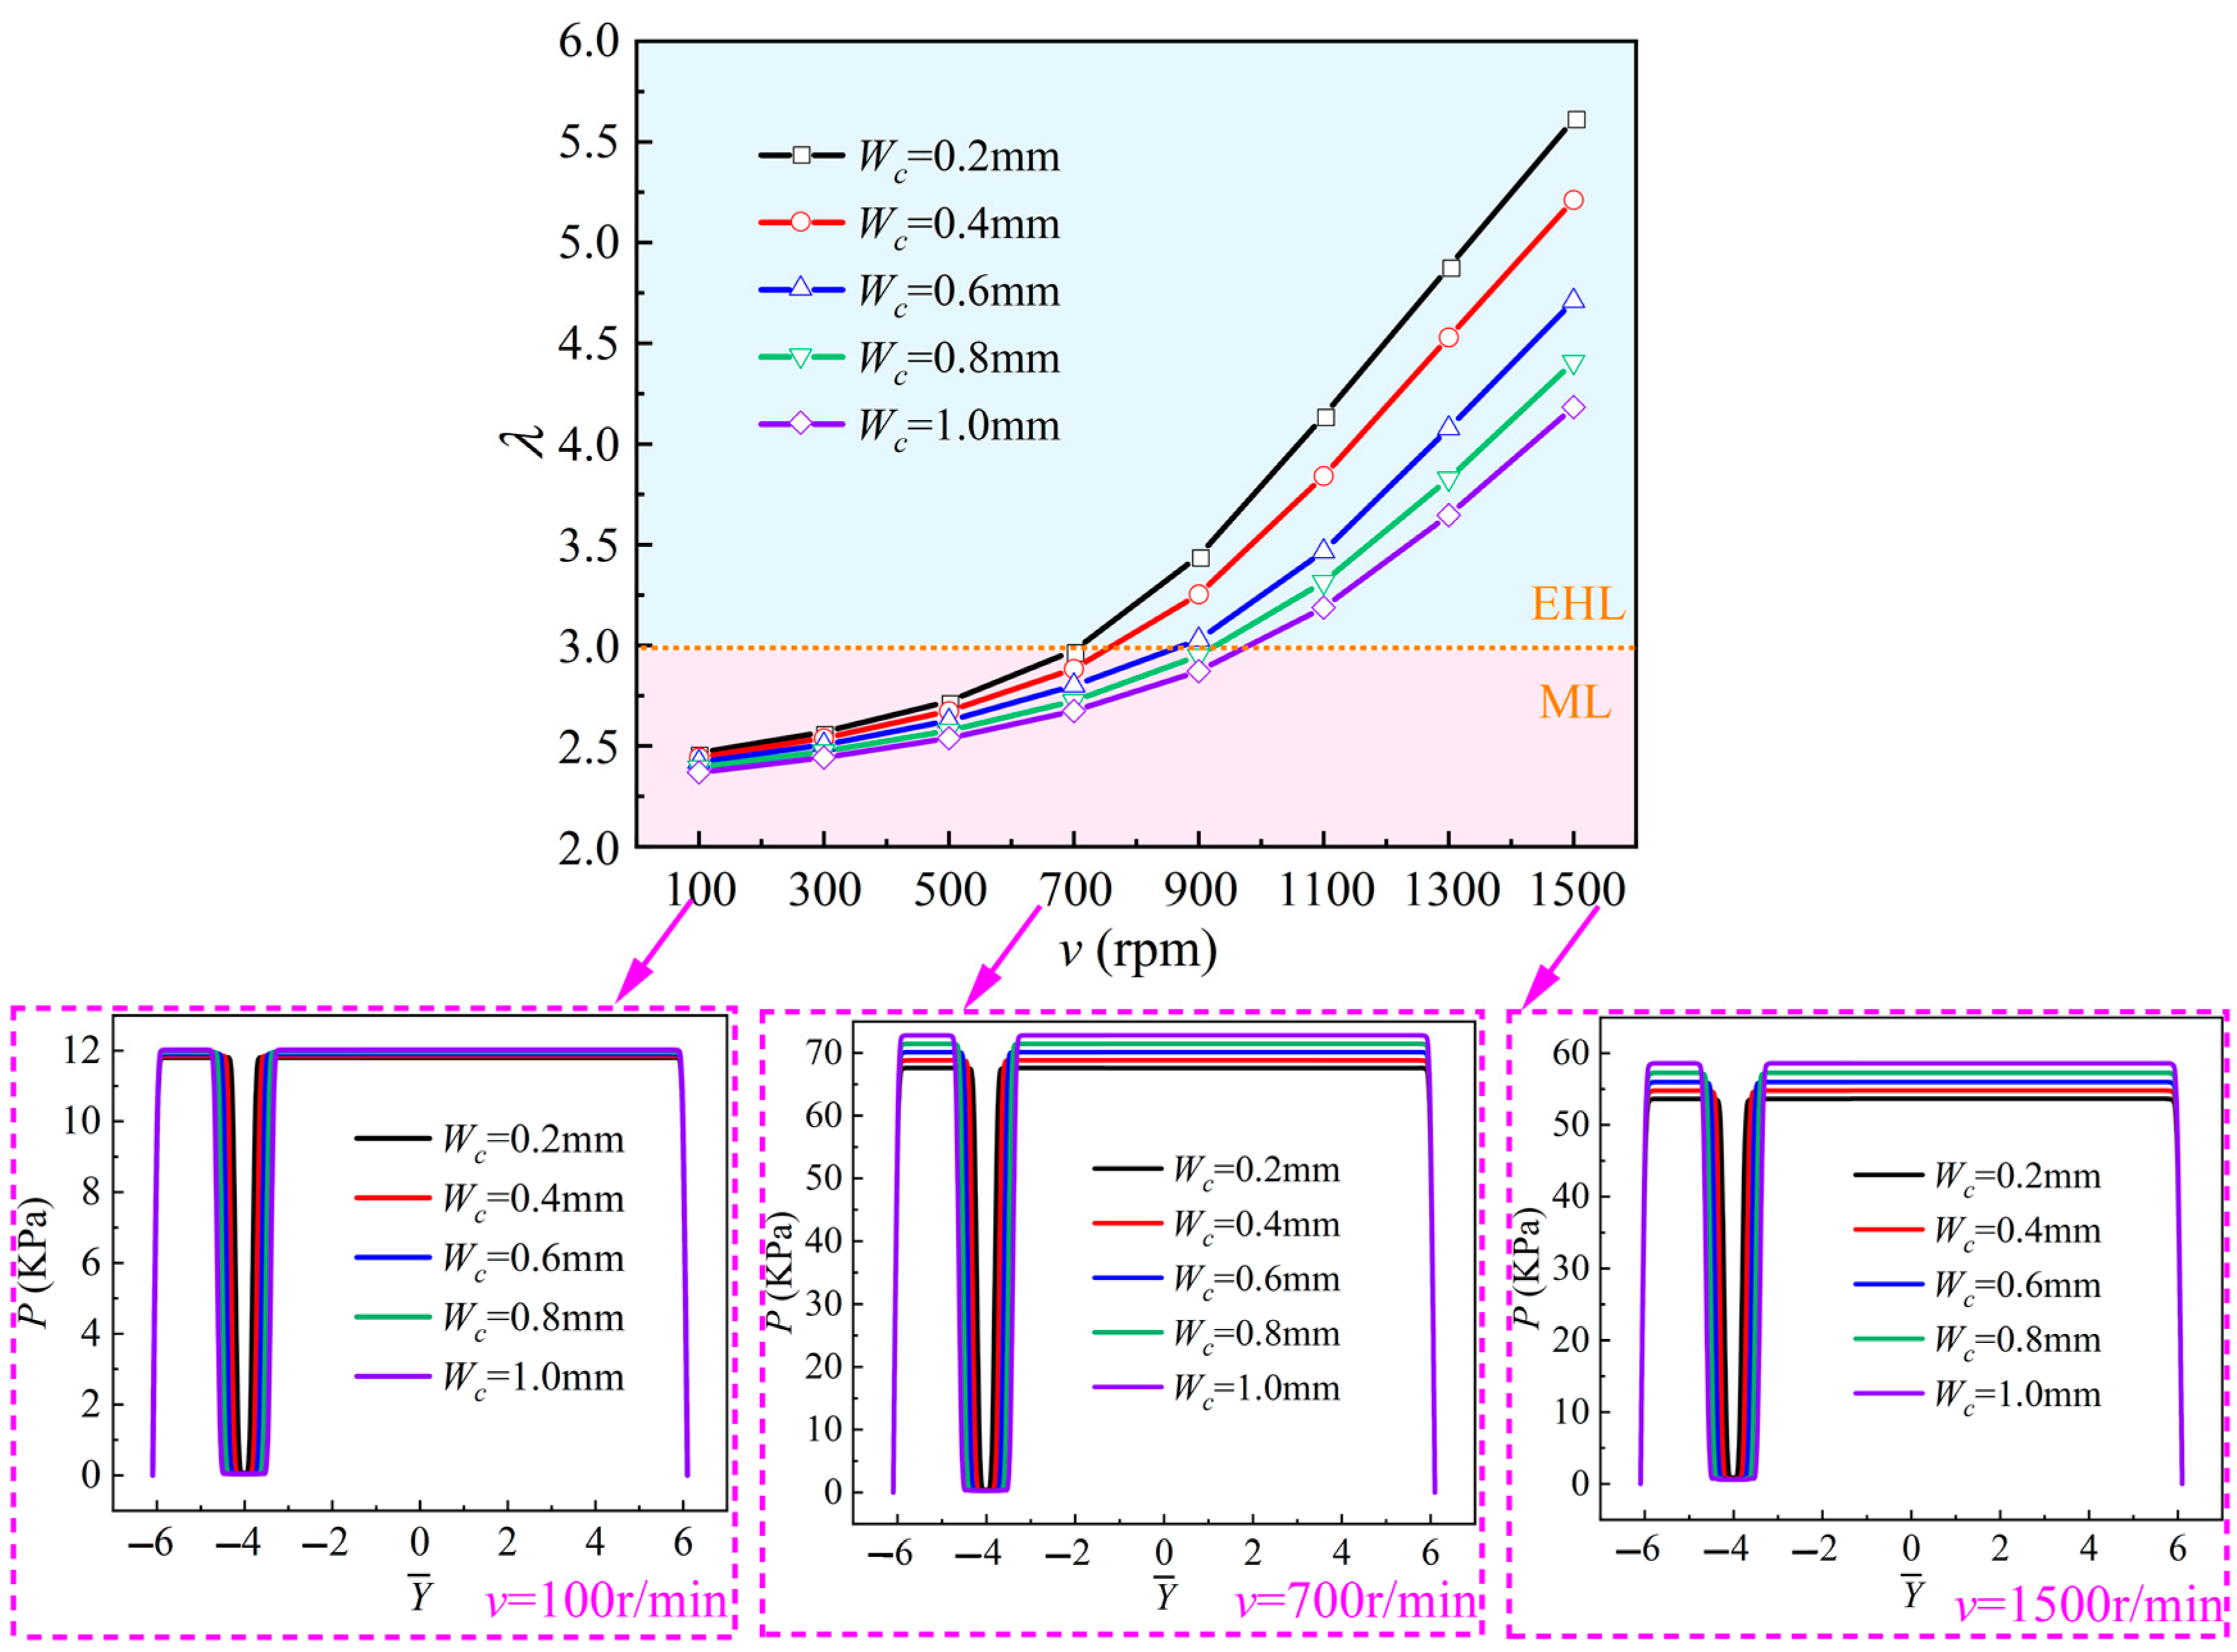
- The scratch has a great influence on the transition of the lubrication state of the block-on-ring system. The existence of scratches increases the critical speed at which the block-on-ring system transits from the mixed-lubrication state to the elastohydrodynamic lubrication (EHL) state. For the stainless-steel ring-graphite block frictional pairs, the system enters the EHL state at the speed of 700 r/min when there are no scratches on the ring surface. However, when there is one scratch on the ring surface, the system does not enter the EHL state until the speed reaches 1100 r/min. The critical speed is directly proportional to the scratch width. A widening scratch will markedly weaken the hydrodynamic pressure effect.
Author Contributions
Funding
Data Availability Statement
Conflicts of Interest
Abbreviations
| Nomenclature | |
| O | center of the test ring |
| R | outer radius of the test ring, mm |
| ω | angular velocity, s−1 |
| Ω1 | unscratched area |
| Ω2 | scratched area |
| ƞ | viscosity of water, Pa s |
| p | film pressure, MPa |
| h | nominal film thickness, mm |
| us | velocity of outer surface of shaft, m s−1 |
| σ | combined surface roughness, μm |
| σb | roughness of test block, μm |
| σr | roughness of test ring, μm |
| μ | friction coefficient |
| ρ | density of water, kg m−3 |
| h00 | rigid central film thickness, mm |
| (kx, ky) | turbulence factors |
| f | friction, N |
| pressure flow factors | |
| shear flow factor | |
| contact factor | |
| hc | scratch depth, mm |
| E′ | composite elastic modulus, MPa |
| Er | elastic modulus of ring, MPa |
| Eb | elastic modulus of block, MPa |
| νr | Poisson ratio of ring |
| νb | Poisson ratio of block |
| pasp | contact pressure, MPa |
| β | curvature radius of asperities on either surface, μm |
| D | number of asperities per unit contact area |
| Ac | real contact area, mm2 |
| A0 | nominal contact area, mm2 |
| W | synthetic load capacity, N |
| Fh | load capacity generated by water film, N |
| Fc | load capacity generated by asperity contact, N |
| Subscripts and superscripts | |
| r | ring |
| b | block |
| asp | asperity contact |
References
- Ouyang, W.; Zhang, X.; Jin, Y.; Yuan, X. Experimental study on the dynamic performance of water-lubricated rubber bearings with local contact. Shock Vib. 2018, 2018, 6309727. [Google Scholar] [CrossRef]
- Guo, Z.; Yuan, C.; Liu, A.; Jiang, S. Study on tribological properties of novel biomimetic material for water-lubricated stern tube bearing. Wear 2017, 376, 911–919. [Google Scholar] [CrossRef]
- Shen, Y.; Zhang, Y.; Zhang, X.; Zheng, H.; Wei, G.; Wang, M. A Fluid-Structure Interaction Method for the Elastohydrodynamic Lubrication Characteristics of Rubber-Plastic Double-Layer Water-Lubricated Journal Bearings. Lubricants 2023, 11, 240. [Google Scholar] [CrossRef]
- Litwin, W. Influence of local bush wear on water lubricated sliding bearing load carrying capacity. Tribol. Int. 2016, 103, 352–358. [Google Scholar] [CrossRef]
- Zhou, G.; Wang, J.; Han, Y.; Wei, B.; Tang, B.; Zhong, P. An experimental study on film pressure circumferential distribution of water-lubricated rubber bearings with multiple grooves. Tribol. Trans. 2017, 60, 385–391. [Google Scholar] [CrossRef]
- Li, X.; Guo, Z.; Huang, Q.; Yuan, C. Insight into the Lubrication Performance of Biomimetic Porous Structure Material for Water-lubricated Bearings. J. Bionic Eng. 2023, 20, 1905–1916. [Google Scholar] [CrossRef]
- Yu, T.; Guo, F.; Zhang, X.; Ji, H.; Duan, W.; Liang, P. Water lubrication assisted by small-quantity silicone oil. Tribol. Int. 2022, 173, 107619. [Google Scholar] [CrossRef]
- Wu, K.; Zhou, G.; Mi, X.; Zhong, P.; Wang, W.; Liao, D. Tribological and vibration properties of three different polymer materials for water-lubricated bearings. Materials 2020, 13, 3154. [Google Scholar] [CrossRef]
- Zhang, X.; Yu, T.; Guo, F.; Liang, P. Analysis of the influence of small quantity secondary lubricant on water lubrication. Tribol. Int. 2021, 159, 106998. [Google Scholar] [CrossRef]
- Wang, C.; Bai, X.; Guo, Z.; Dong, C.; Yuan, C. Friction and wear behaviours of polyacrylamide hydrogel microsphere/UHMWPE composite under water lubrication. Wear 2021, 477, 203841. [Google Scholar] [CrossRef]
- Jia, J.; Zhou, H.; Gao, S.; Chen, J. A comparative investigation of the friction and wear behavior of polyimide composites under dry sliding and water-lubricated condition. Mater. Sci. Eng. A 2003, 356, 48–53. [Google Scholar] [CrossRef]
- Chen, B.; Wang, J.; Yan, F. Comparative investigation on the tribological behaviors of CF/PEEK composites under sea water lubrication. Tribol. Int. 2012, 52, 170–177. [Google Scholar] [CrossRef]
- Zhao, G.; Wang, T.; Wang, Q. Friction and wear behavior of the polyurethane composites reinforced with potassium titanate whiskers under dry sliding and water lubrication. J. Mater. Sci. 2011, 46, 6673–6681. [Google Scholar] [CrossRef]
- Xiao, B.; Zheng, X.; Zhou, Y.; Yao, D.; Wan, Y. Tribological behaviors of the water-lubricated rubber bearings under different lubricated conditions. Ind. Lubr. Tribol. 2020, 73, 260–265. [Google Scholar] [CrossRef]
- Huang, S.; Wang, Z.; Xu, L.; Huang, C. Friction and Wear Characteristics of Aqueous ZrO2/GO Hybrid Nanolubricants. Lubricants 2022, 10, 109. [Google Scholar] [CrossRef]
- Wang, L.; Guan, X.; Zhang, G. Friction and wear behaviors of carbon-based multilayer coatings sliding against different rubbers in water environment. Tribol. Int. 2013, 64, 69–77. [Google Scholar] [CrossRef]
- Xiong, D. Friction and wear properties of UHMWPE composites reinforced with carbon fiber. Mater. Lett. 2005, 59, 175–179. [Google Scholar] [CrossRef]
- Nobili, L.; Magagnin, L. DLC coatings for hydraulic applications. Trans. Nonferrous Met. Soc. China 2009, 19, 810–813. [Google Scholar] [CrossRef]
- Xu, H.; Feng, Z.; Chen, J.; Zhou, H. Tribological behavior of the carbon fiber reinforced polyphenylene sulfide (PPS) composite coating under dry sliding and water lubrication. Mater. Sci. Eng. A 2006, 416, 66–73. [Google Scholar] [CrossRef]
- Du, F.; Li, D.; Sa, X.; Li, C.; Yu, Y.; Li, C.; Wang, J.; Wang, W. Overview of friction and wear performance of sliding bearings. Coatings 2022, 12, 1303. [Google Scholar] [CrossRef]
- Rezaei, A.; Paepegem, W.V.; Baets, P.D.; Ost, W.; Degrieck, J. Adaptive finite element simulation of wear evolution in radial sliding bearings. Wear 2012, 296, 660–671. [Google Scholar] [CrossRef]
- Dobrica, M.B.; Fillon, M. Influence of scratches on the performance of a partial journal bearing. In Proceedings of the STLE/ASME, International Joint Tribology Conference, Miami, FL, USA, 20–22 October 2008; pp. 359–361. [Google Scholar] [CrossRef]
- Dobrica, M.B.; Fillon, M. Performance degradation in scratched journal bearings. Tribol. Int. 2012, 51, 1–10. [Google Scholar] [CrossRef]
- Chatterton, S.; Pennacchi, P.; Vania, A.; Hassini, M.A.; Kuczkowiak, A. Effect of Scratches on a Tilting-Pad Journal Bearing. In Proceedings of the ASME Turbo Expo 2020, Power for Land, Sea, and Air, Montreal, QC, Canada, 21–25 September 2020; p. V10BT29A006. [Google Scholar] [CrossRef]
- Vo, A.T.; Fillon, M.; Bouyer, J. Numerical Study of a Journal Bearing with Scratches: Validation with Literature and Comparison with Experimental Data. Lubricants 2021, 9, 61. [Google Scholar] [CrossRef]
- Chasalevris, A.C.; Nikolakopoulos, P.G.; Papadopoulos, C.A. Dynamic effect of bearing wear on rotor-bearing system response. J. Vib. Acoust. 2013, 135, 011008. [Google Scholar] [CrossRef]
- Nicodemus, E.R.; Sharma, S.C. Influence of wear on the performance of multirecess hydrostatic journal bearing operating with micropolar lubricant. J. Tribol. 2010, 132, 021703. [Google Scholar] [CrossRef]
- Cai, J.; Han, Y.; Xiang, G.; Wang, J.; Wang, L. Effects of wear and shaft-shape error defects on the tribo-dynamic response of water-lubricated bearings under propeller disturbance. Phys. Fluids 2022, 34, 077118. [Google Scholar] [CrossRef]
- Lin, Y.; He, S.; Lai, D.; Wei, J.; Ji, Q.; Huang, J.; Pan, M. Wear mechanism and tool life prediction of high-strength vermicular graphite cast iron tools for high-efficiency cutting. Wear 2020, 454, 203319. [Google Scholar] [CrossRef]
- Fan, B.; Yuan, K.; Chen, W.; Qi, S.; Liu, Y.; Liu, H. A numerical model with nonuniform grids for the analysis of dynamic characteristics of scratched tilting-pad bearings. Ind. Lubr. Tribol. 2023, 75, 817–829. [Google Scholar] [CrossRef]
- Bouyer, J.; Fillon, M.; Helene, M.; Beaurain, J.; Giraudeau, C. Behavior of a two-lobe journal bearing with a scratched shaft: Comparison between theory and experiment. J. Tribol. 2019, 141, 021702. [Google Scholar] [CrossRef]
- Bouyer, J.; Alexandre, Y.; Fillon, M. Experimental investigation on the influence of a multi-scratched shaft on hydrodynamic journal bearing performance. Tribol. Int. 2021, 153, 106543. [Google Scholar] [CrossRef]
- Branagan, L.A. Influence of Deep, Continuous Circumferential Scratches on Radial Fluidfilm Bearings. In Proceedings of the 61st STLE Annual Meeting & Exhibition, Calgary, AB, Canada, 7–11 May 2006; pp. 15–21. [Google Scholar]
- Branagan, L.A. Survey of damage investigation of babbitted industrial bearings. Lubricants 2015, 3, 91–112. [Google Scholar] [CrossRef]
- Giraudeau, C.; Bouyer, J.; Fillon, M.; Hélène, M.; Beaurain, J. Experimental study of the influence of scratches on the performance of a two-lobe journal bearin. Tribol. Trans. 2017, 60, 942–955. [Google Scholar] [CrossRef]
- Yan, X.; Fan, C.; Wang, W.; Liu, X.; Chen, B. Experimental and simulation study of the dynamic characteristics of friction force under third-body intrusion behaviour. Mech. Syst. Signal Process. 2022, 168, 108726. [Google Scholar] [CrossRef]
- Dong, C.L.; Yuan, C.Q.; Bai, X.Q.; Yang, Y.; Yan, X. Study on wear behaviours for NBR/stainless steel under sand water-lubricated conditions. Wear 2015, 332, 1012–1020. [Google Scholar] [CrossRef]
- Liang, P.; Li, X.; Guo, F.; Zhang, X.; Jiang, F. Influence of shaft scratch on static and transient behavior of water-lubricated bearing. J. Tribol. 2023, 146, 012201. [Google Scholar] [CrossRef]
- Li, X.; Liang, P.; Guo, F.; Liang, Q.; Li, X.; Zhang, X.; Liu, X.; Jiang, F. Effect of shaft scratches on the dynamic performance of bearing systems resist to multiple load impacts. Tribology. 2022, accepted. Available online: https://kns.cnki.net/kcms2/article/abstract?v=3uoqIhG8C45S0n9fL2suRadTyEVl2pW9UrhTDCdPD65olJTg3HQUF-xFhvAzkRg0r3za3dOD2XspSWeDR0zAdVi0fDNI1O2a&uniplatform=NZKPT (accessed on 27 July 2023).
- Patir, N.; Cheng, H. An average flow model for determining effects of three-dimensional roughness on partial hydrodynamic lubrication. J. Tribol. 1978, 100, 12–17. [Google Scholar] [CrossRef]
- Patir, N.; Cheng, H. Application of average flow model to lubrication between rough sliding surfaces. J. Tribol. 1979, 101, 220–229. [Google Scholar] [CrossRef]
- Du, Y.; Lan, J.; Quan, H.; Sun, C.; Liu, X.; Yang, X. Effect of different turbulent lubrication models on the lubrication characteristics of water-lubricated rubber bearings at a high Reynolds number. Phys. Fluids 2021, 33, 065118. [Google Scholar] [CrossRef]
- Liu, H.; Zhang, B.; Bader, N.; Guo, F.; Poll, G.; Yang, P. Crucial role of solid body temperature on elastohydrodynamic film thickness and traction. Tribol. Int. 2019, 131, 386–397. [Google Scholar] [CrossRef]
- Taylor, G.I. VIII. Stability of a viscous liquid contained between two rotating cylinders. Philos. Trans. R. Soc. Ser. A 1923, 223, 289–343. [Google Scholar] [CrossRef]
- Wang, Y.; Yin, Z.; Gao, G.; Zhang, X. Analysis of the performance of worn hydrodynamic water-lubricated plain journal bearings considering cavitation and elastic deformation. Mech. Ind. 2017, 18, 508. [Google Scholar] [CrossRef]
- Ng, C.W.; Pan, C.H.T. A linearized turbulent lubrication theory. J. Basic Eng. 1965, 87, 675–682. [Google Scholar] [CrossRef]
- Wu, C.; Zheng, L. An average Reynolds equation for partial film lubrication with a contact factor. J. Tribol. 1989. [CrossRef]
- Greenwood, J.A.; Tripp, J.H. The contact of two nominally flat rough surfaces. Proc. Inst. Mech. Eng. 1970, 185, 625–633. [Google Scholar] [CrossRef]
- Greenwood, J.A.; Williamson, J.B.P. Contact of nominally flat surfaces. Proc. R. Soc. Ser. A 1966, 295, 300–319. [Google Scholar] [CrossRef]
- Liang, P.; Li, X.; Guo, F.; Cao, Y.; Zhang, X.; Jiang, F. Influence of sea wave shock on transient start-up performance of water-lubricated bearing. Tribol. Int. 2022, 167, 107332. [Google Scholar] [CrossRef]
- Li, Y.; Wang, Q.; Wang, T.; Pan, G. Preparation and tribological properties of graphene oxide/nitrile rubber nanocomposites. J. Mater. Sci. 2012, 47, 730–738. [Google Scholar] [CrossRef]
- Orndorff Jr, R.L. WATER-LUBRICATED rubber bearings, history and new developments. Nav. Eng. J. 1985, 97, 39–52. [Google Scholar] [CrossRef]
- Wang, Y.; Zhang, L. Characteristics and outline of water-lubricated thordon bearing. Adv. Mater. Res. 2012, 496, 355–358. [Google Scholar] [CrossRef]
- Wang, J.; Zhang, C.; Wang, Y.; Wang, D.; Jia, Q.; Cui, Y.; Yuan, X. Preparation and Experimental Study of Graphite Material for Water Lubricated Thrust Bearing of Nuclear Main Pump. Mater. Sci. Forum 2018, 932, 102–106. [Google Scholar] [CrossRef]
- Clarke, C.G.; Allen, C. The water lubricated, sliding wear behaviour of polymeric materials against steel. Tribol. Int. 1991, 24, 109–118. [Google Scholar] [CrossRef]
- Lu, X.; Khonsari, M.M.; Gelinck, E.R.M. The Stribeck curve: Experimental results and theoretical prediction. J. Tribol. 2006, 128, 789–794. [Google Scholar] [CrossRef]
- Wang, Z.; Liu, Y.; Wang, Y.; Liu, X.; Wang, Y. Influence of squeezing and interface slippage on the performance of water-lubricated tilting-pad thrust bearing during start-up and shutdown. Lubr. Sci. 2018, 30, 137–148. [Google Scholar] [CrossRef]
- Zhang, H.; Yuan, C.; Tan, Z. A novel approach to investigate temperature field evolution of water lubricated stern bearings (WLSBs) under hydrodynamic lubrication. Adv. Mech. Eng. 2021, 13, 1514–1519. [Google Scholar] [CrossRef]
- Xing, H.; Duan, S.; Wu, Z. Bearing lubrication optimization for diesel engine based on orthogonal design method. In Proceedings of the 2011 Third International Conference on Measuring Technology and Mechatronics Automation, Shanghai, China, 6–7 January 2011; Volume 1, pp. 633–636. [Google Scholar] [CrossRef]
- Xie, Z.; Rao, Z.; Ta, N.; Liu, L. Investigations on transitions of lubrication states for water lubricated bearing. Part II: Further insight into the film thickness ratio lambda. Ind. Lubr. Tribol. 2016, 68, 416–429. [Google Scholar] [CrossRef]
- Galda, L.; Sep, J.; Olszewski, A.; Zochowski, T. Experimental investigation into surface texture effect on journal bearings performance. Tribol. Int. 2019, 136, 372–384. [Google Scholar] [CrossRef]
- Peng, E.; Liu, Z.; Lan, F.; Zhang, S.; Dai, M. Research on noise generation mechanism of rubber material for water-lubricated bearings. Appl. Mech. Mater. 2011, 84–85, 539–543. [Google Scholar] [CrossRef]
- Xiang, G.; Yang, T.; Guo, J.; Wang, J.; Liu, B.; Chen, S. Optimization transient wear and contact performances of water-lubricated bearings under fluid-solid-thermal coupling condition using profile modification. Wear 2022, 502, 204379. [Google Scholar] [CrossRef]
- Nwaneshiudu, A.; Kuschal, C.; Sakamoto, F.H.; Anderson, R.R.; Schwarzenberger, K.; Young, R.C. Introduction to confocal microscopy. J. Investig. Dermatol. 2012, 132, 1–5. [Google Scholar] [CrossRef]


| Parameters | Value |
|---|---|
| Maximum load (N) | 3000 |
| Speed range (r/min) | 10~3000 |
| Accuracy of pressure sensor | 0.03%FS |
| Accuracy of friction torque sensor | 0.2%FS |
| Sampling frequency of data acquisition card (KS/s) | 500 |
| Test Ring | Test Block | |||
|---|---|---|---|---|
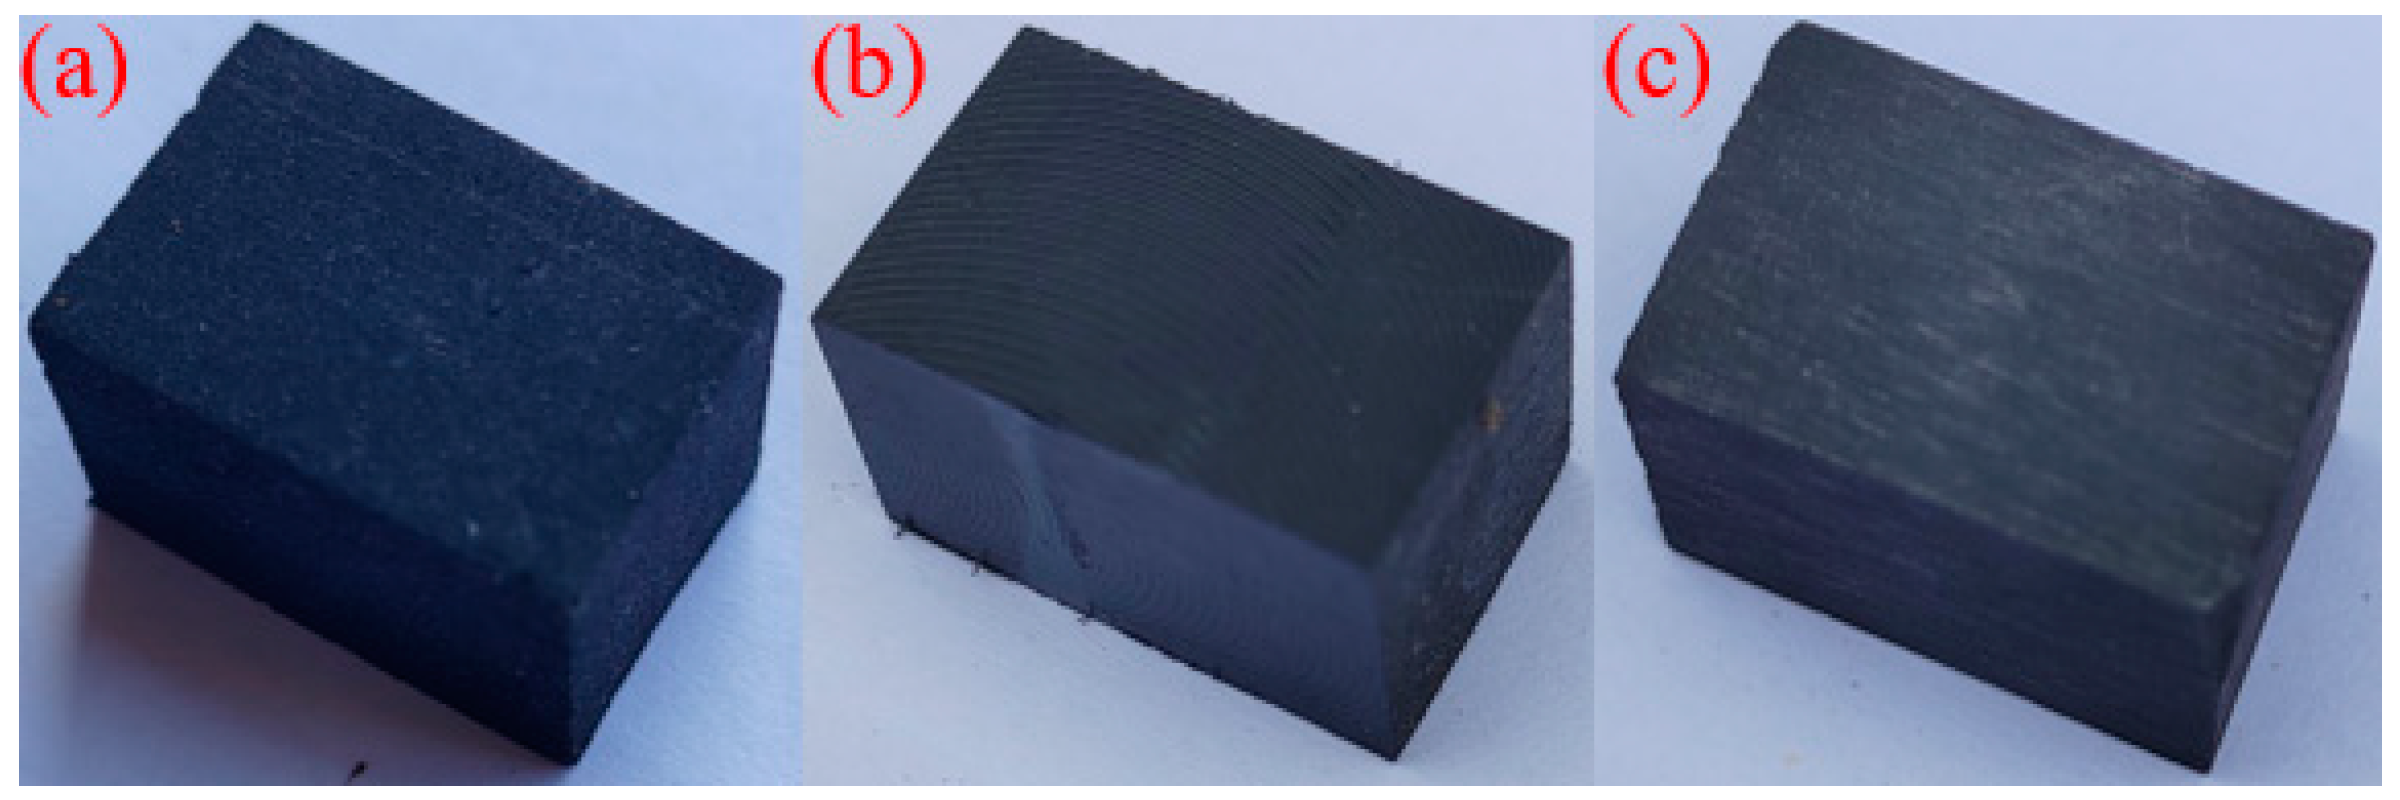
| Material | 316 Stainless steel | Nitrile rubber | Thordon | Graphite |
| Size (mm) | Outside diameterΦ49.00 Width 13.65 | Length 19.05, width 12.32, thickness 12.32 | ||
| Roughness (μm) | Ra0.4 | Ra0.6 | Ra0.6 | Ra0.6 |
| Elastic modulus | 210 GPa | 6.1 MPa | 490 MPa | 7800 MPa |
| Poisson ratio | 0.30 | 0.49 | 0.36 | 0.19 |
| Influence Factor | Level Value | ||
|---|---|---|---|
| 1 | 2 | 3 | |
| Scratch depth hc (mm) | 0.1 | 0.2 | 0.3 |
| Scratch width Wc (mm) | 0.2 | 0.4 | 0.6 |
| Scratch location Lc | 1/6L | 1/3L | 1/2L |
| Group Number | hc (mm) | Wc (mm) | Lc | Friction Coefficient |
|---|---|---|---|---|
| 1 | 0.3 | 0.6 | 1/6L | 0.078 |
| 2 | 0.2 | 0.2 | 1/2L | 0.059 |
| 3 | 0.1 | 0.6 | 1/2L | 0.076 |
| 4 | 0.3 | 0.2 | 1/3L | 0.057 |
| 5 | 0.3 | 0.4 | 1/2L | 0.070 |
| 6 | 0.2 | 0.6 | 1/3L | 0.074 |
| 7 | 0.2 | 0.4 | 1/6L | 0.065 |
| 8 | 0.1 | 0.4 | 1/3L | 0.069 |
| 9 | 0.1 | 0.2 | 1/6L | 0.052 |
| Adjoint probability (P) | 0.596 | 0.030 | 0.528 | |
| Importance of influence | Wc > Lc > hc | |||
Disclaimer/Publisher’s Note: The statements, opinions and data contained in all publications are solely those of the individual author(s) and contributor(s) and not of MDPI and/or the editor(s). MDPI and/or the editor(s) disclaim responsibility for any injury to people or property resulting from any ideas, methods, instructions or products referred to in the content. |
© 2023 by the authors. Licensee MDPI, Basel, Switzerland. This article is an open access article distributed under the terms and conditions of the Creative Commons Attribution (CC BY) license (https://creativecommons.org/licenses/by/4.0/).
Share and Cite
Liang, Q.; Liang, P.; Guo, F.; Li, S.; Zhang, X.; Jiang, F. The Influence of Scratches on the Tribological Performance of Friction Pairs Made of Different Materials under Water-Lubrication Conditions. Lubricants 2023, 11, 449. https://doi.org/10.3390/lubricants11100449
Liang Q, Liang P, Guo F, Li S, Zhang X, Jiang F. The Influence of Scratches on the Tribological Performance of Friction Pairs Made of Different Materials under Water-Lubrication Conditions. Lubricants. 2023; 11(10):449. https://doi.org/10.3390/lubricants11100449
Chicago/Turabian StyleLiang, Qingchen, Peng Liang, Feng Guo, Shuyi Li, Xiaohan Zhang, and Fulin Jiang. 2023. "The Influence of Scratches on the Tribological Performance of Friction Pairs Made of Different Materials under Water-Lubrication Conditions" Lubricants 11, no. 10: 449. https://doi.org/10.3390/lubricants11100449