1. Introduction
Bearings are part of any common drive train in various industrial and automotive applications. As a part of a drive train, they are important components in the service life cycle reliability. Bearings carry high loading magnitudes effectively and due to this aspect they need to be designed very precisely, with high reliability and durability, respectively [
1].
SAE 52100 through-hardened steel is a martensitic hardened steel which, due to its high hardness, is typically used for rolling contact applications in order to withstand high cycle fatigue [
2]. Plenty of investigations have been carried out in order to predict the reliability of the SAE 52100 martensitic steel in service life as a matter of its microstructure.
The effect of heat treatment on the surface fatigue crack initiation of SAE 52100 martensitic hardened steel was analyzed by Beswick [
3]. Lundberg and Palmgren [
4] and Ioannides and Harris [
5] described predictive methods, which are used to calculate the lifetime of the bearing components numerically. It has been proposed by Sadeghi et al. [
6] and Walveker et al. [
7] that for the ball and roller bearings, under proper loading condition and lubrication, correct installation of all the bearing components, and without contamination, the main cause of the failure is material fatigue phenomena. It is shown that the main reason for the limited life of bearing elements is subsurface initiated fatigue spallation and subsurface porosities [
7].
Spriesterbach et al. [
2] investigated the effect of inclusions with different chemical compositions and the fatigue crack initiation induced by them.
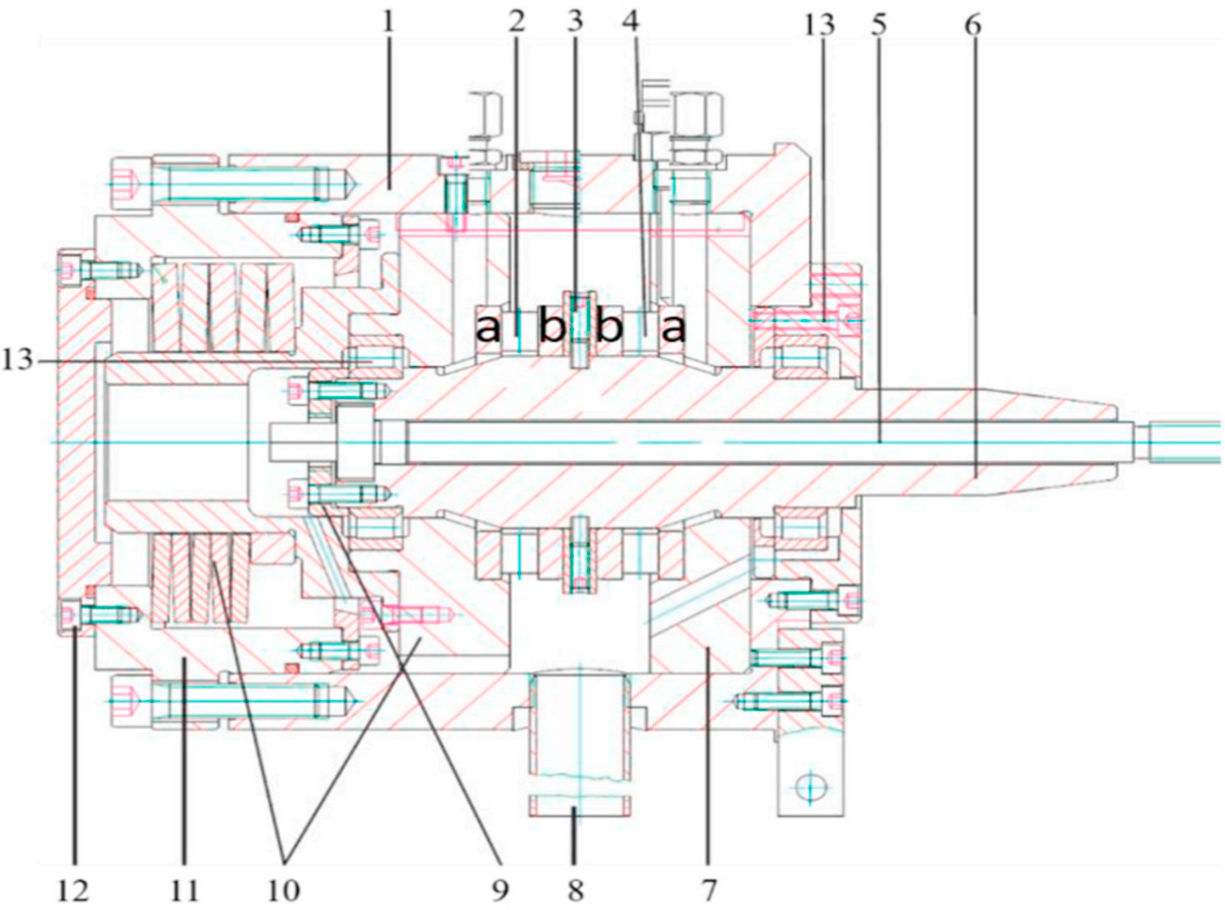
Spille et al. [
8] studied the initiation processes of White Etching Cracks (WECs) on an FE8 test rig (
Figure 1, Schaeffler) in SAE 52100 martensitic hardened steel.
Generally, in order to increase the reliability of the system as well as preventing wear, which is caused by uncontrolled mixed friction especially within the contact area, the implementation of a lubricant in the test bench is necessary. However, lubrication of the component has a huge effect on its mechanical performance due to the formation of WEC caused by chemical reactions [
9]. The existence of pores within the microstructure of samples that are prone to WEC formation was proven by Spille et al. [
8]. Further investigations employing Electron Backscatter Diffraction (EBSD) showed microstructural changes such as the formation of new grain boundaries in area close to the pores, which has a big effect on the mechanical behaviour of the bearings, especially from a fatigue life point of view.
Another investigation of the same working bench at reference [
8] is done by Holweger et al. [
10]. In this work, the fatigue performance of the bearing components is investigated in two modes: Rolling Contact Fatigue (RCF) and Electrical charged Contact Fatigue (ECCF). It is observed that under the standard operating condition (called RCF), the bearing has reached up to 10
9 cycles without failure, while exposing it to a different lubricant combined with electrical charging (ECCF mode) led to spalling caused by WEC after 10
8 load cycles, proving the fact that fatigue may be severely driven by external factors rather than pure mechanical loading.
So far, all investigations on the fatigue life of roller bearings mainly focused on the propagation of existing cracks within the microstructure. In a study by Murakami et al. [
11], it is shown that due to the stress concentrations near pores, the stress values in these areas are a function of the distance from the pore surface. The value of the stress intensity factor (
K) for an existing crack near a spherical pore under stress
can be obtained by:
in which
is the crack length,
is the radius of the spherical pore, and
Y is a geometry factor which is a function of
/
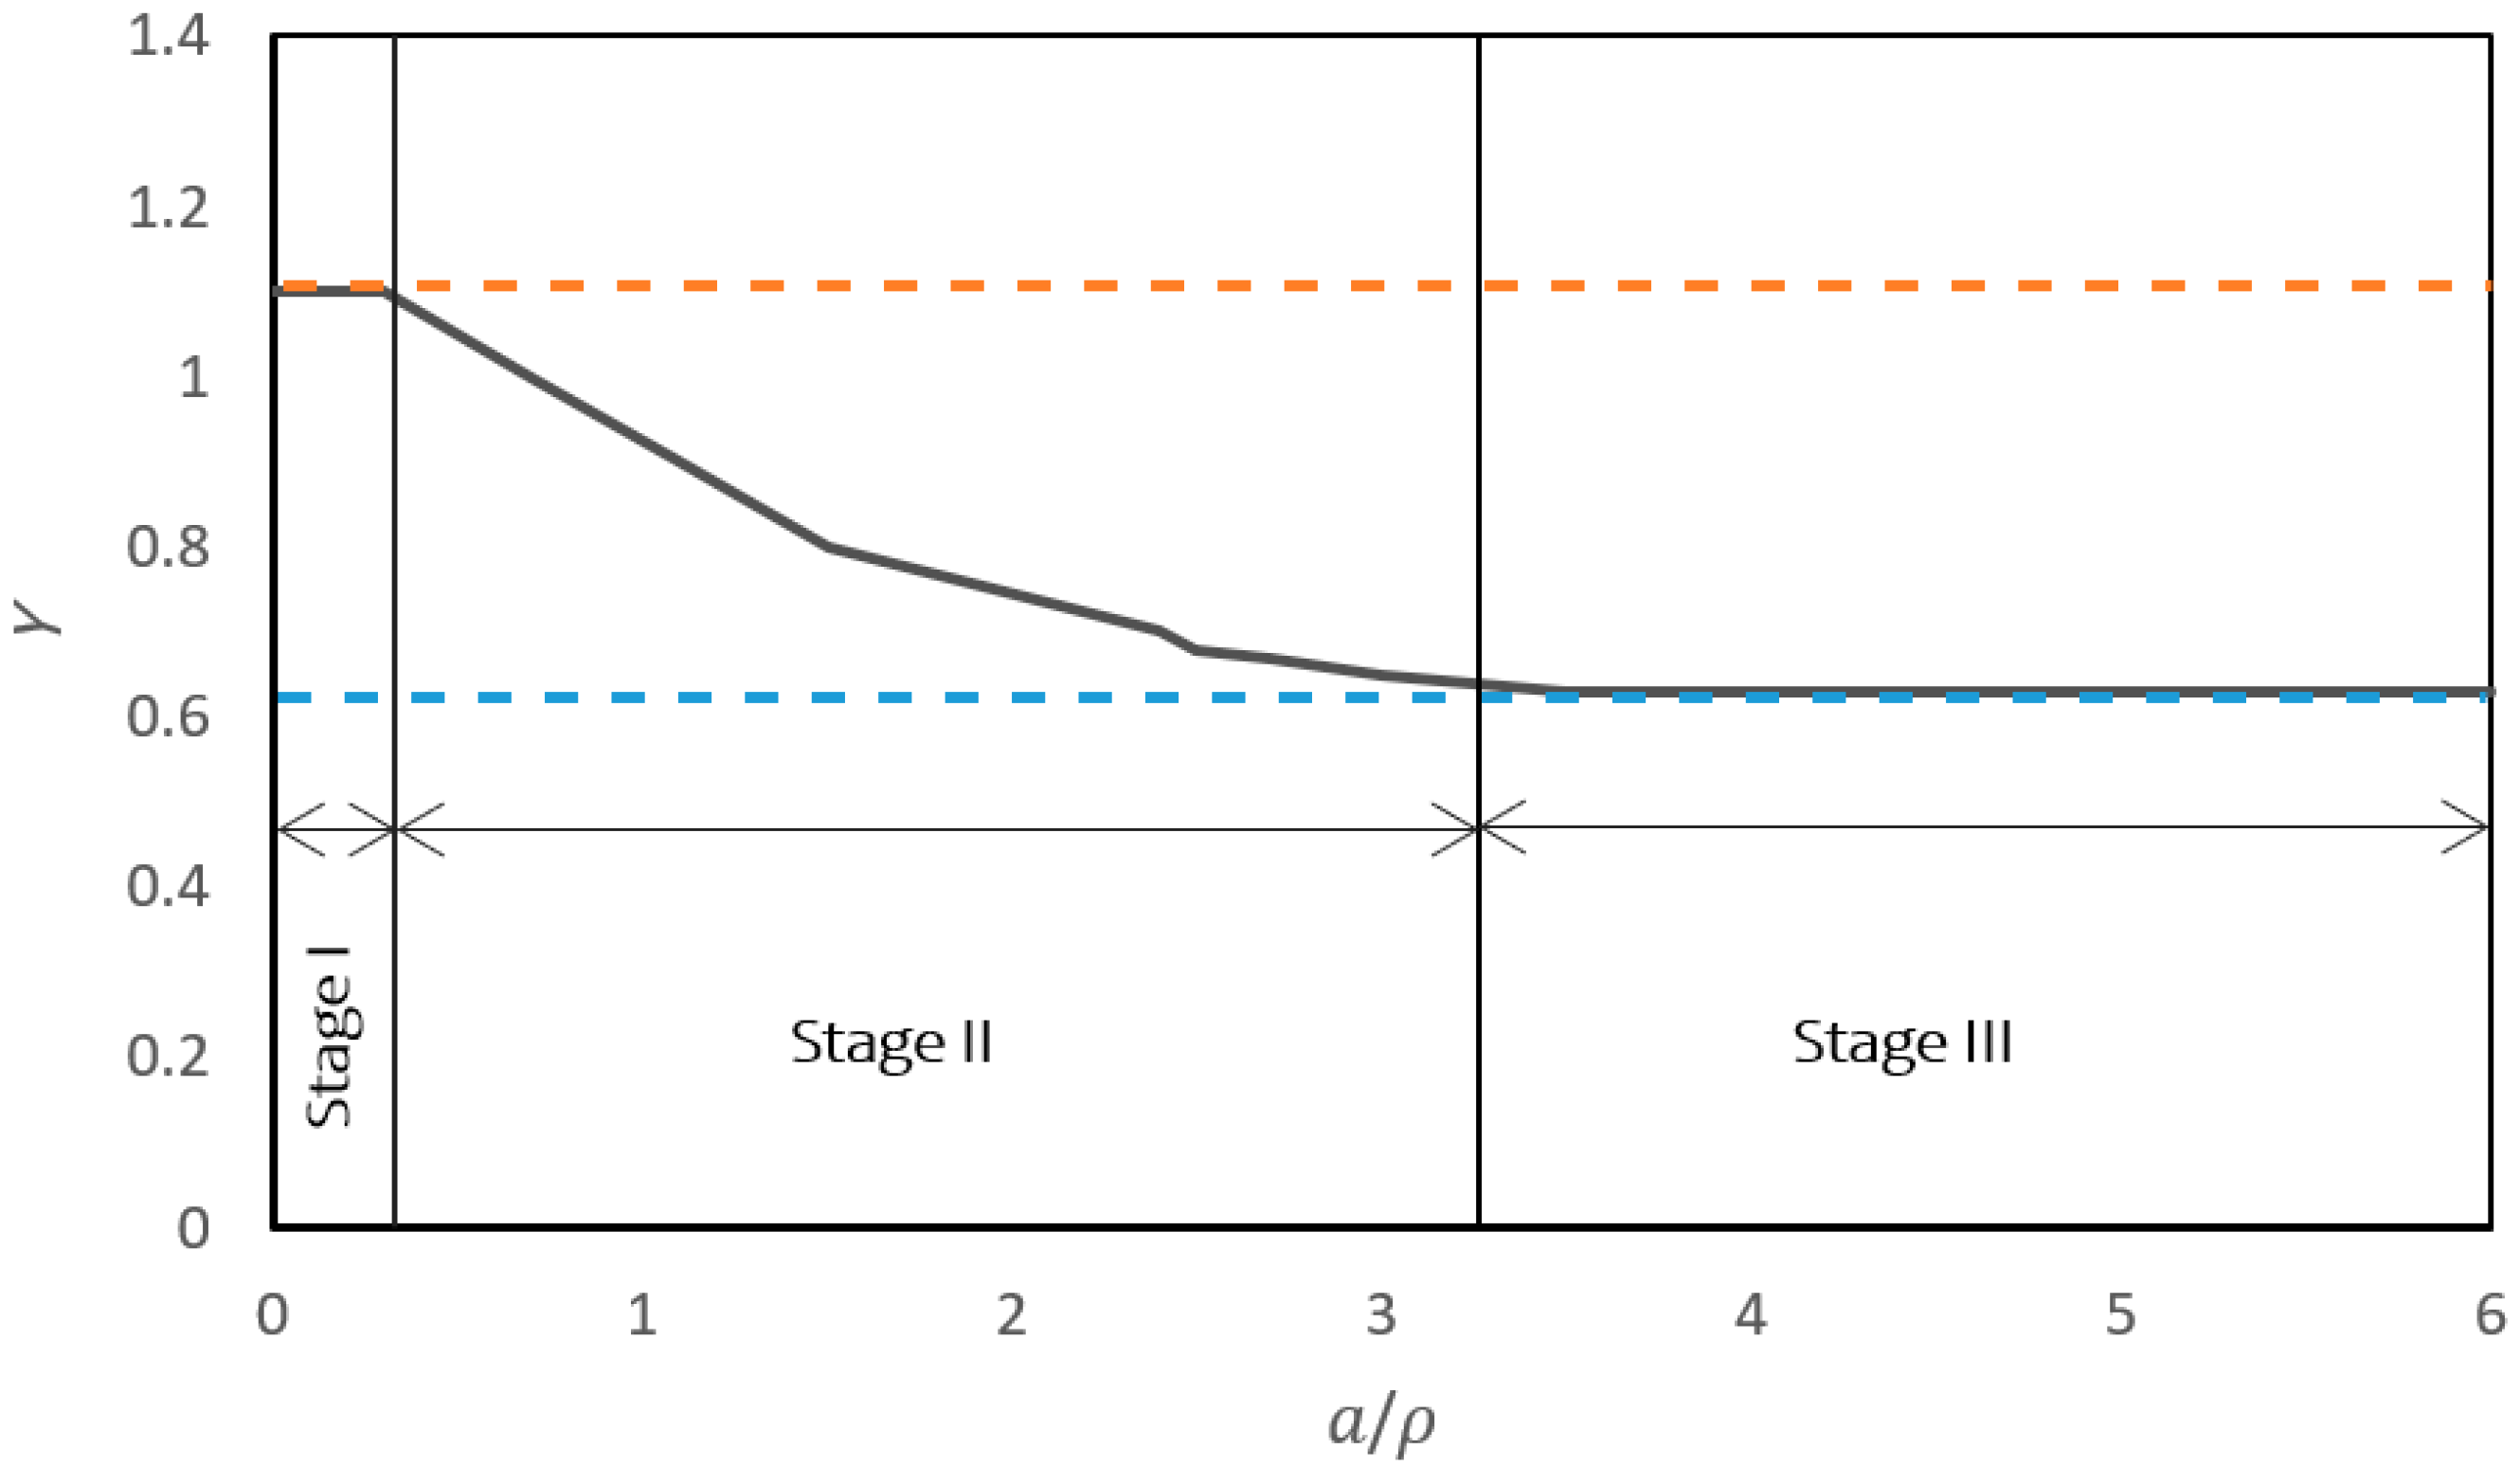
. Lai et al. [
12] divided the crack growth from the edge of a spherical pore into three stages (
Figure 2). In stage I, the crack is smaller than the radius of the pore and
Y shows its own maximum value (orange dashed line). In stage II,
Y starts to decrease by increasing the
/
ratio due to the beginning of crack propagation. In stage III, the crack finally behaves like a penny-shaped crack and
Y approaches its minimum value (blue dashed line).
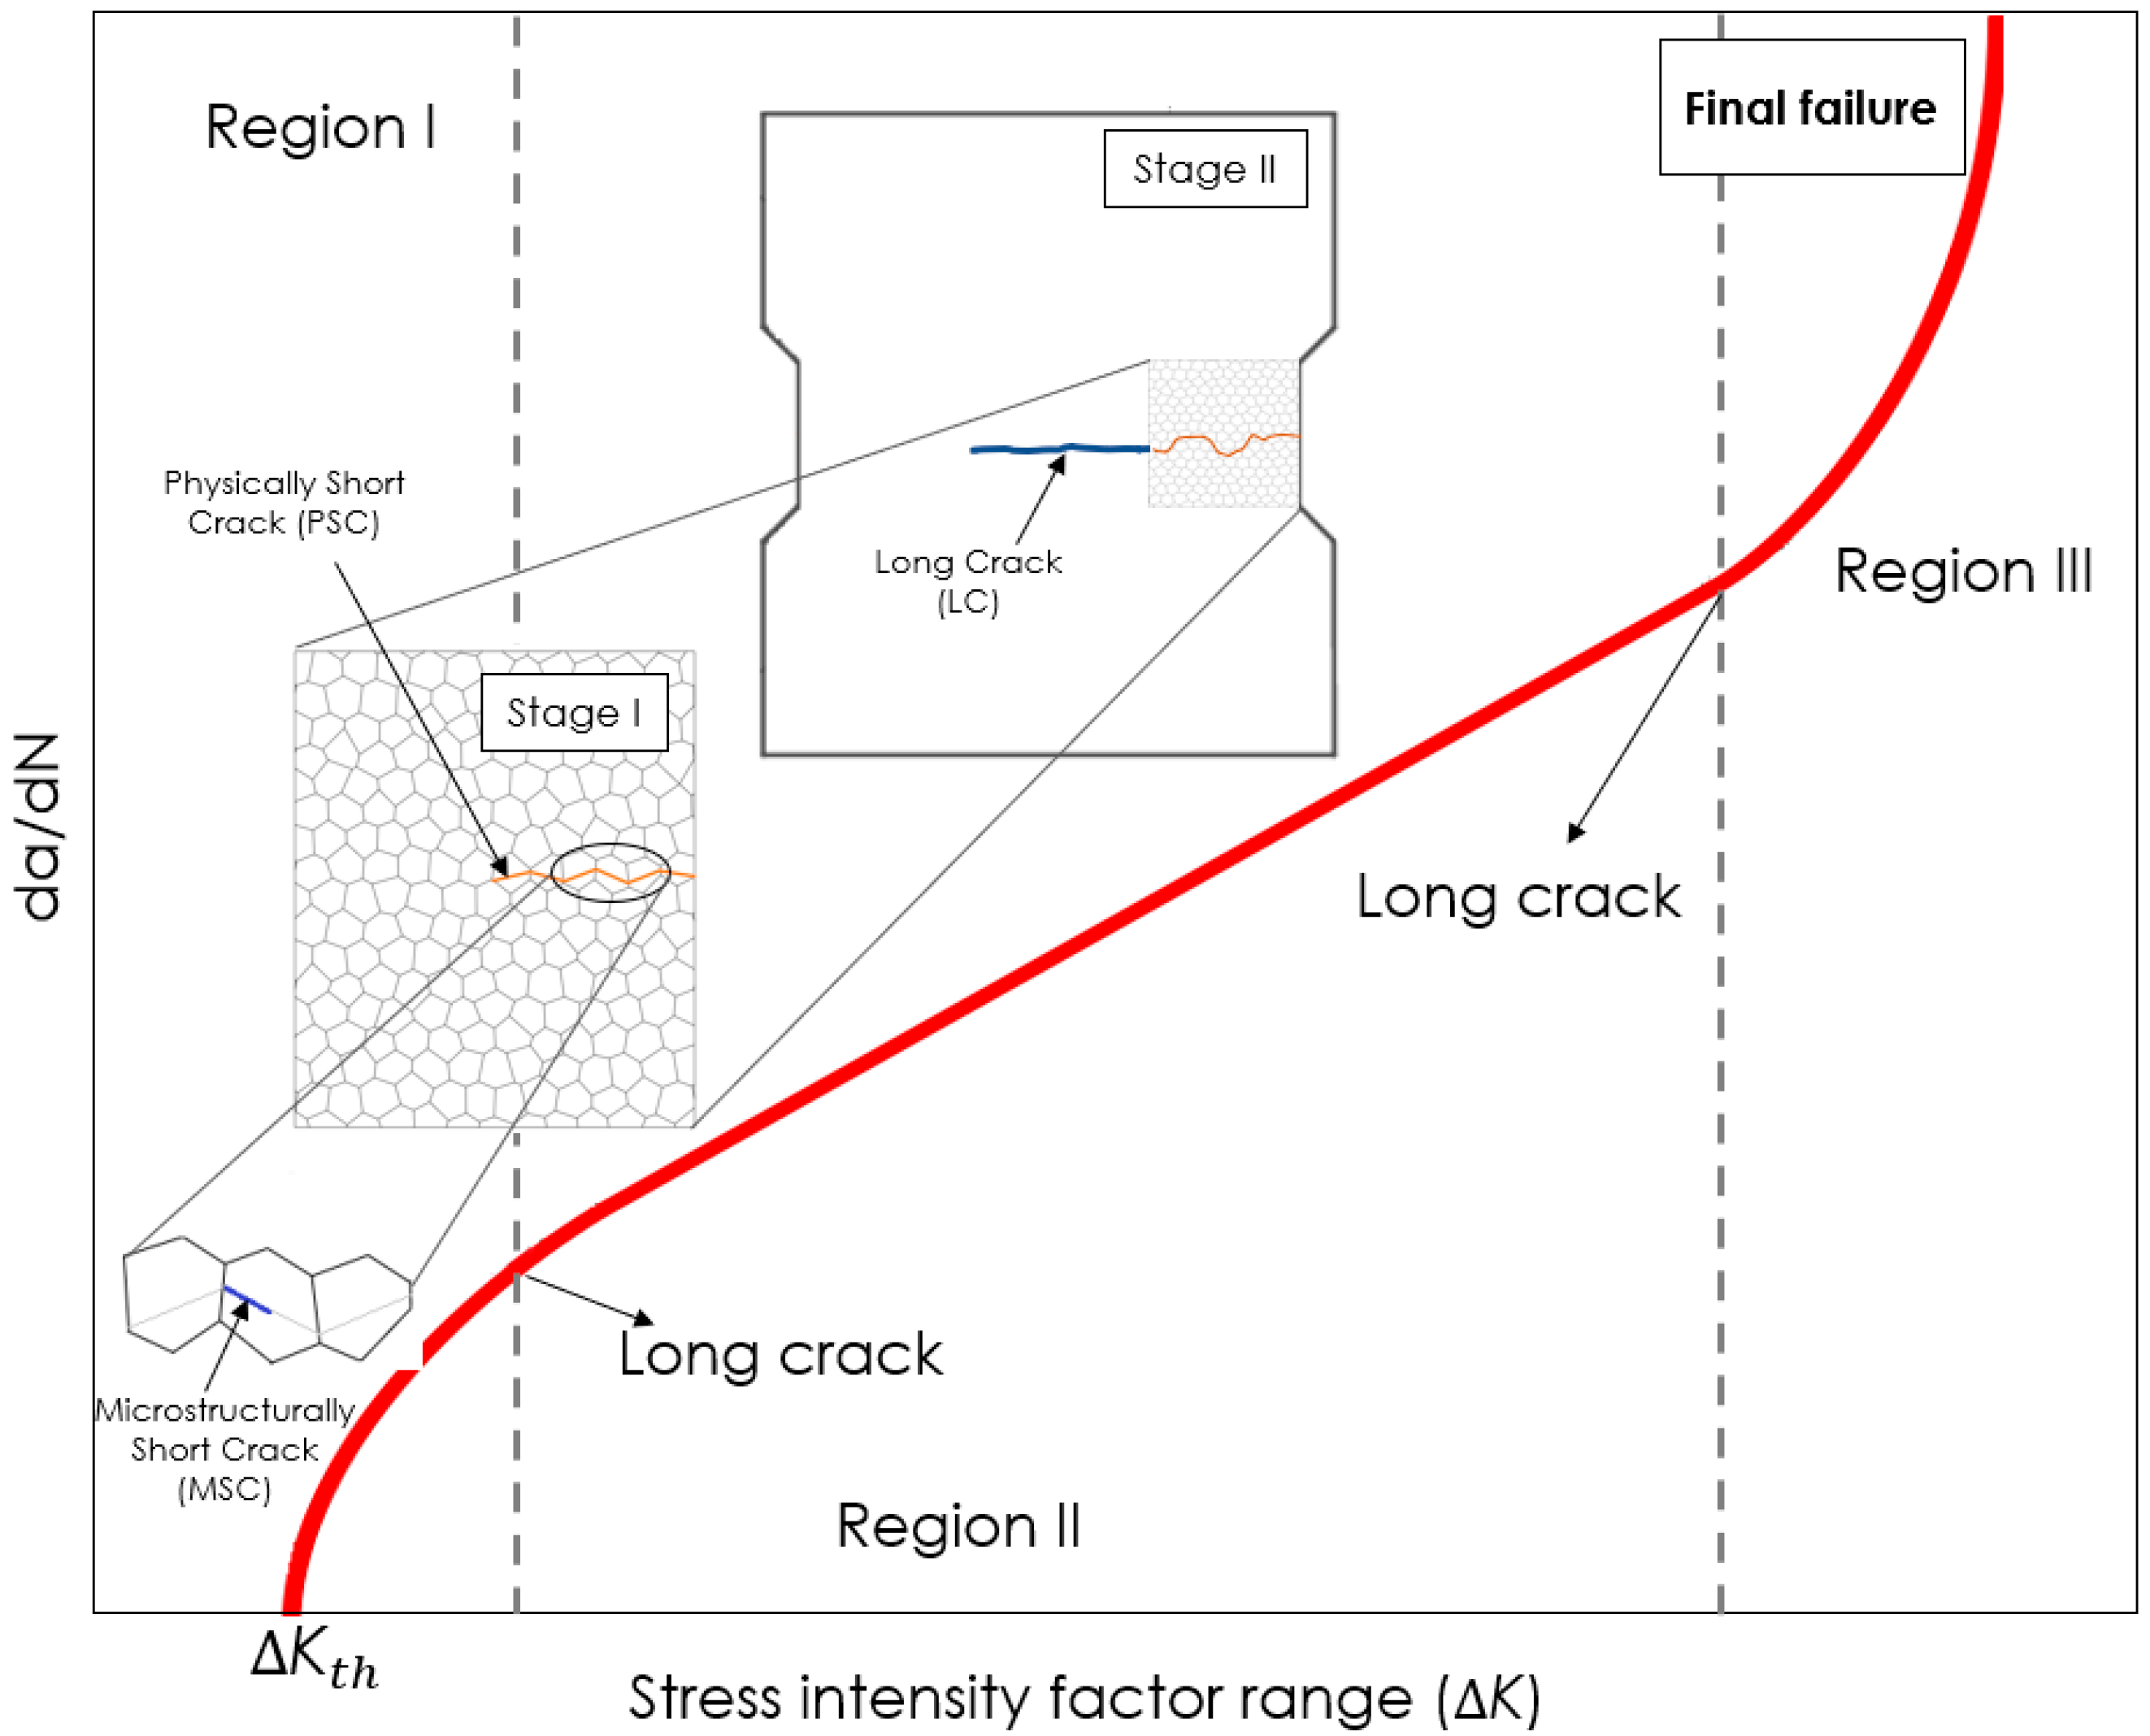
A conventional fatigue crack growth curve, also known as da/dN vs.
curve, is shown in
Figure 3. The curve is generally characterized by three stages: stage I, II, and III. It is worth mentioning that the stages I, II, and III in this sense are different with those at
Figure 2.
During the course of fatigue life, after the fatigue cracks nucleation due to the cyclic slip, within the early stages, the nucleated cracks start growing as Microstructurally Short Cracks (MSCs). In this case, the formed MSCs are in the order of the material’s grain size. Due to the effect of microstructural barriers such as grain boundaries within the metallic material’s microstructure, MSCs generally grow along the crystallographic planes in a disordered pattern.
After the growth of the MSCs through several grains, they are considered as Physically Short Cracks (PSCs). The material’s microstructure has a big influence on the crack growth at this stage (region I).
By reaching the end of the PSC stage, the crack develops into a Long Crack (LC) in region II. In this situation, the influence of the microstructure becomes negligible, and the crack starts propagating in a continuous manner in a perpendicular direction to the loading, which continues up to the final failure in region III.
The paper presented here refers to the earlier investigations on White Etching Cracks (WECs) which is done by Holweger et al. [
9], Loos et al. [
14], Stadler et al. [
15], and Wang et al. [
16]. Although within all the mentioned investigations WEC does appear as a sudden failure, the question still remains about how it starts. So far, the experimental investigation on the WEC initiation has been kept in the investigation of Rumpf et al. [
17]. The detection of the initiation of WEC is done by suspending bearings on the mentioned test rig in narrow time stamps, beginning with a determination of the failure as the first result, shown by Rumpf et al. [
17].
In the present work, which is based on the experimental research work of Spille et al. [
8], the authors went one step ahead, by investigating the effect of the porosities on fatigue crack initiation of SAE 52100 martensitic hardened steel in a very early damage stage with respect to the bearing components, e.g., rings, rollers, and washers. Therefore, the number of cycles for crack initiation and subsequent propagation in two assumed microstructures—with and without pores—is calculated using the physically-based Tanaka–Mura (TM) equation. Moreover, the interaction between pores and cracks is investigated. Indeed, the paper enlightens the fact that pores may to WEC. By pointing out the early stage key parameters, it is leading to valuable predictions for WEC in an premature stage, presumably leading to an early state counter measure.
2. Material
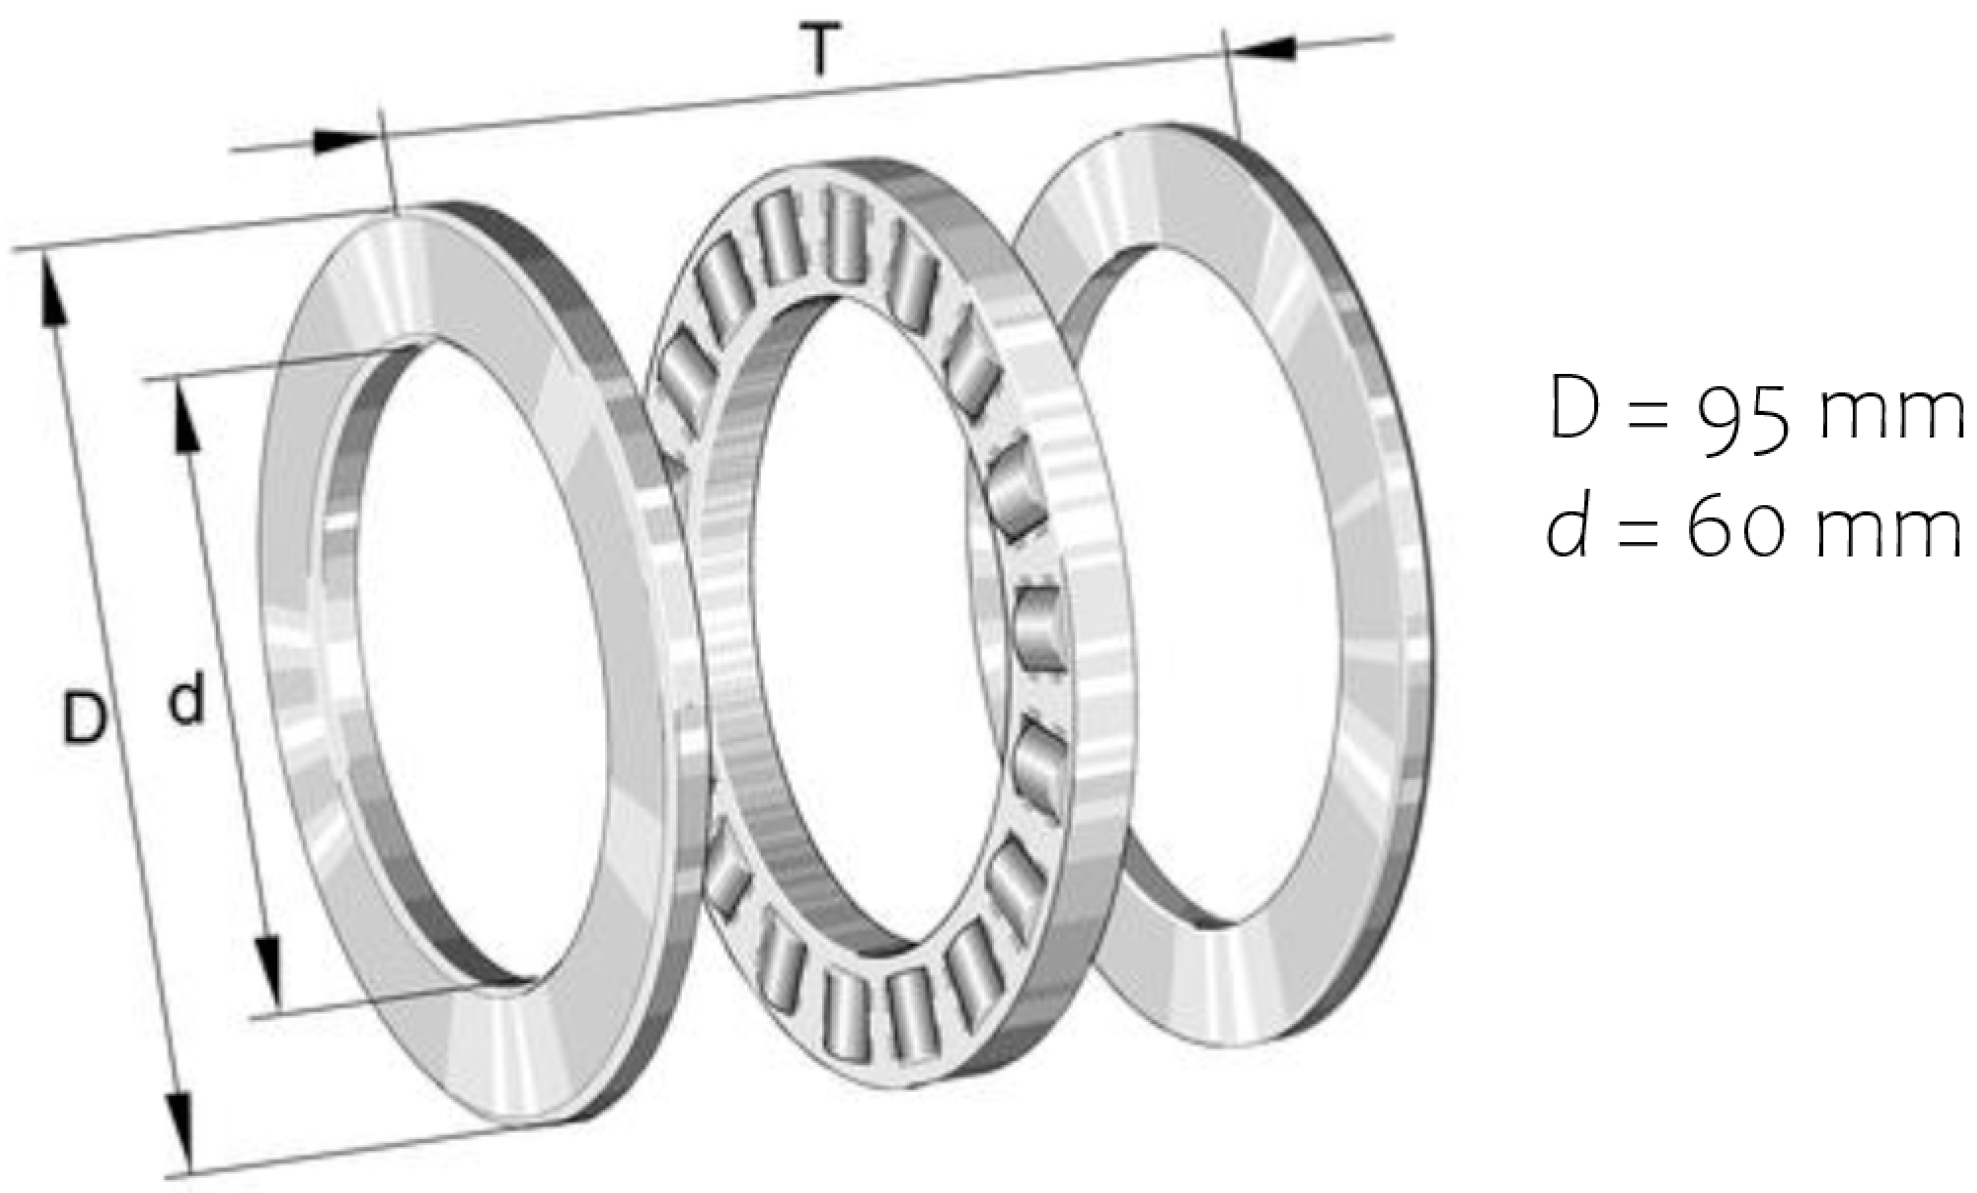
The investigations are carried out on the contact area between the cylinders and rings of an axial cylindrical roller bearing (type 81212; Schaeffler) (
Figure 4), which is the area with the highest stress concentration. Typically, such roller bearings are applied as components in wind turbines.
The bearing is made of SAE 52100 martensitic hardened steel. The chemical composition is shown in
Table 1. The samples were subjected to a standard heat treatment including austenitization for 20 min at 845 °C, oil quenching to 60 °C, cooling down to room temperature, and finally tempering at 180 °C for 2 h [
18].
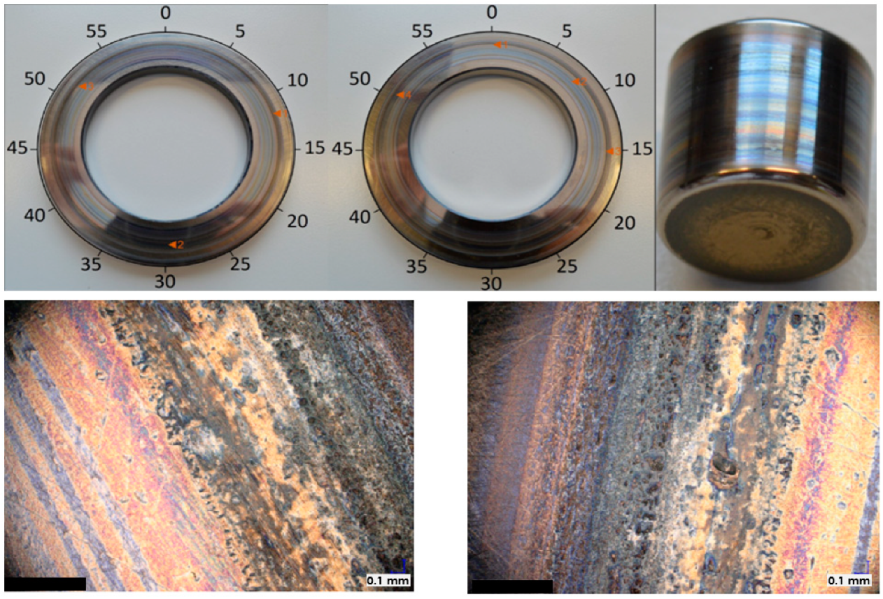
Samples were tested on the FE8 testing (
Figure 1) until the fracture occured, then a careful material study of the failure components was done by Spille et al. [
8], which led to the observation that in a pre-damaged state where no spalling was observed visibleon the raceway, alterations are visible on the raceway surface (
Figure 5).
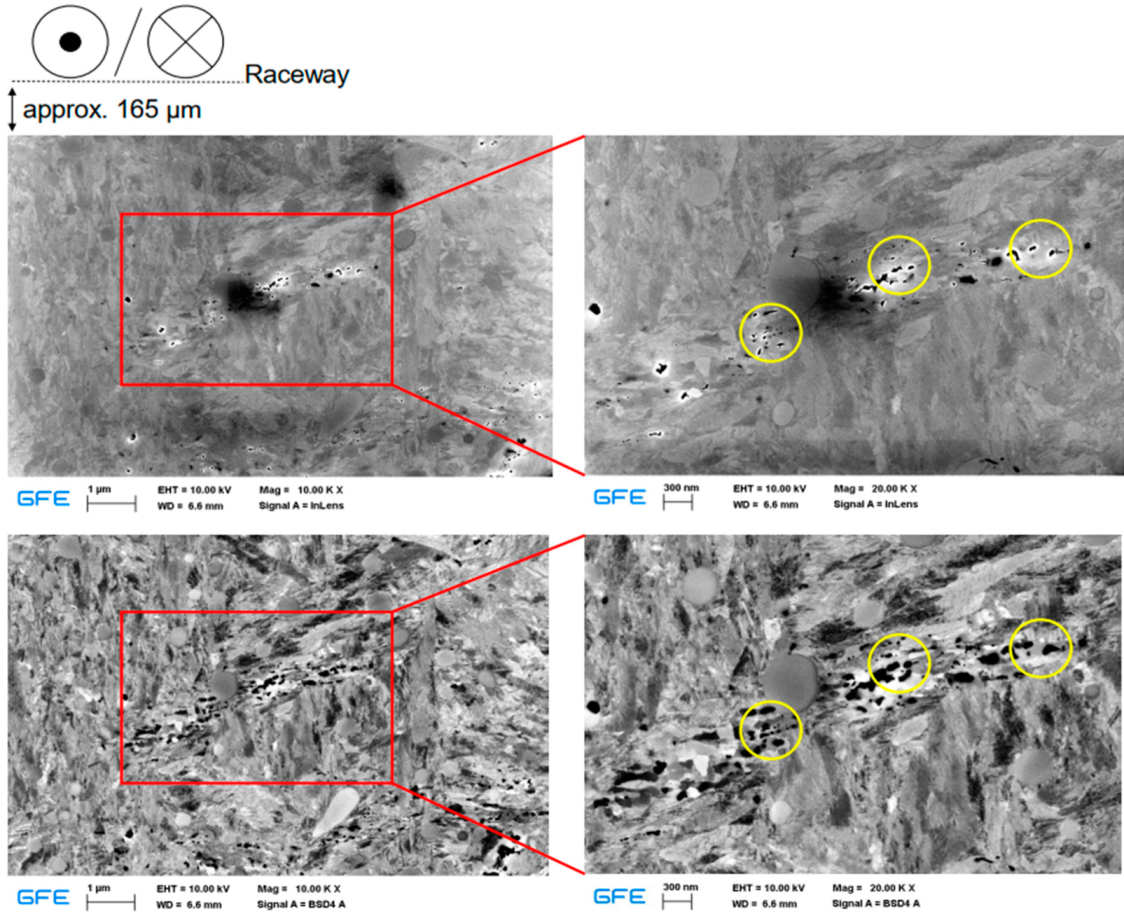
In the sub-surface area below the alterations, seen at the raceway surface (see
Figure 5) at a depth of 80–180 µm, arrays of micropores were identified together with newly formed gains and grain boundaries (here at a depth of 165 µm) as it is shown in
Figure 6 (yellow circles). These observations in the experiment lead to the assumption that failure in an early stage can be related to the presence of these voids.
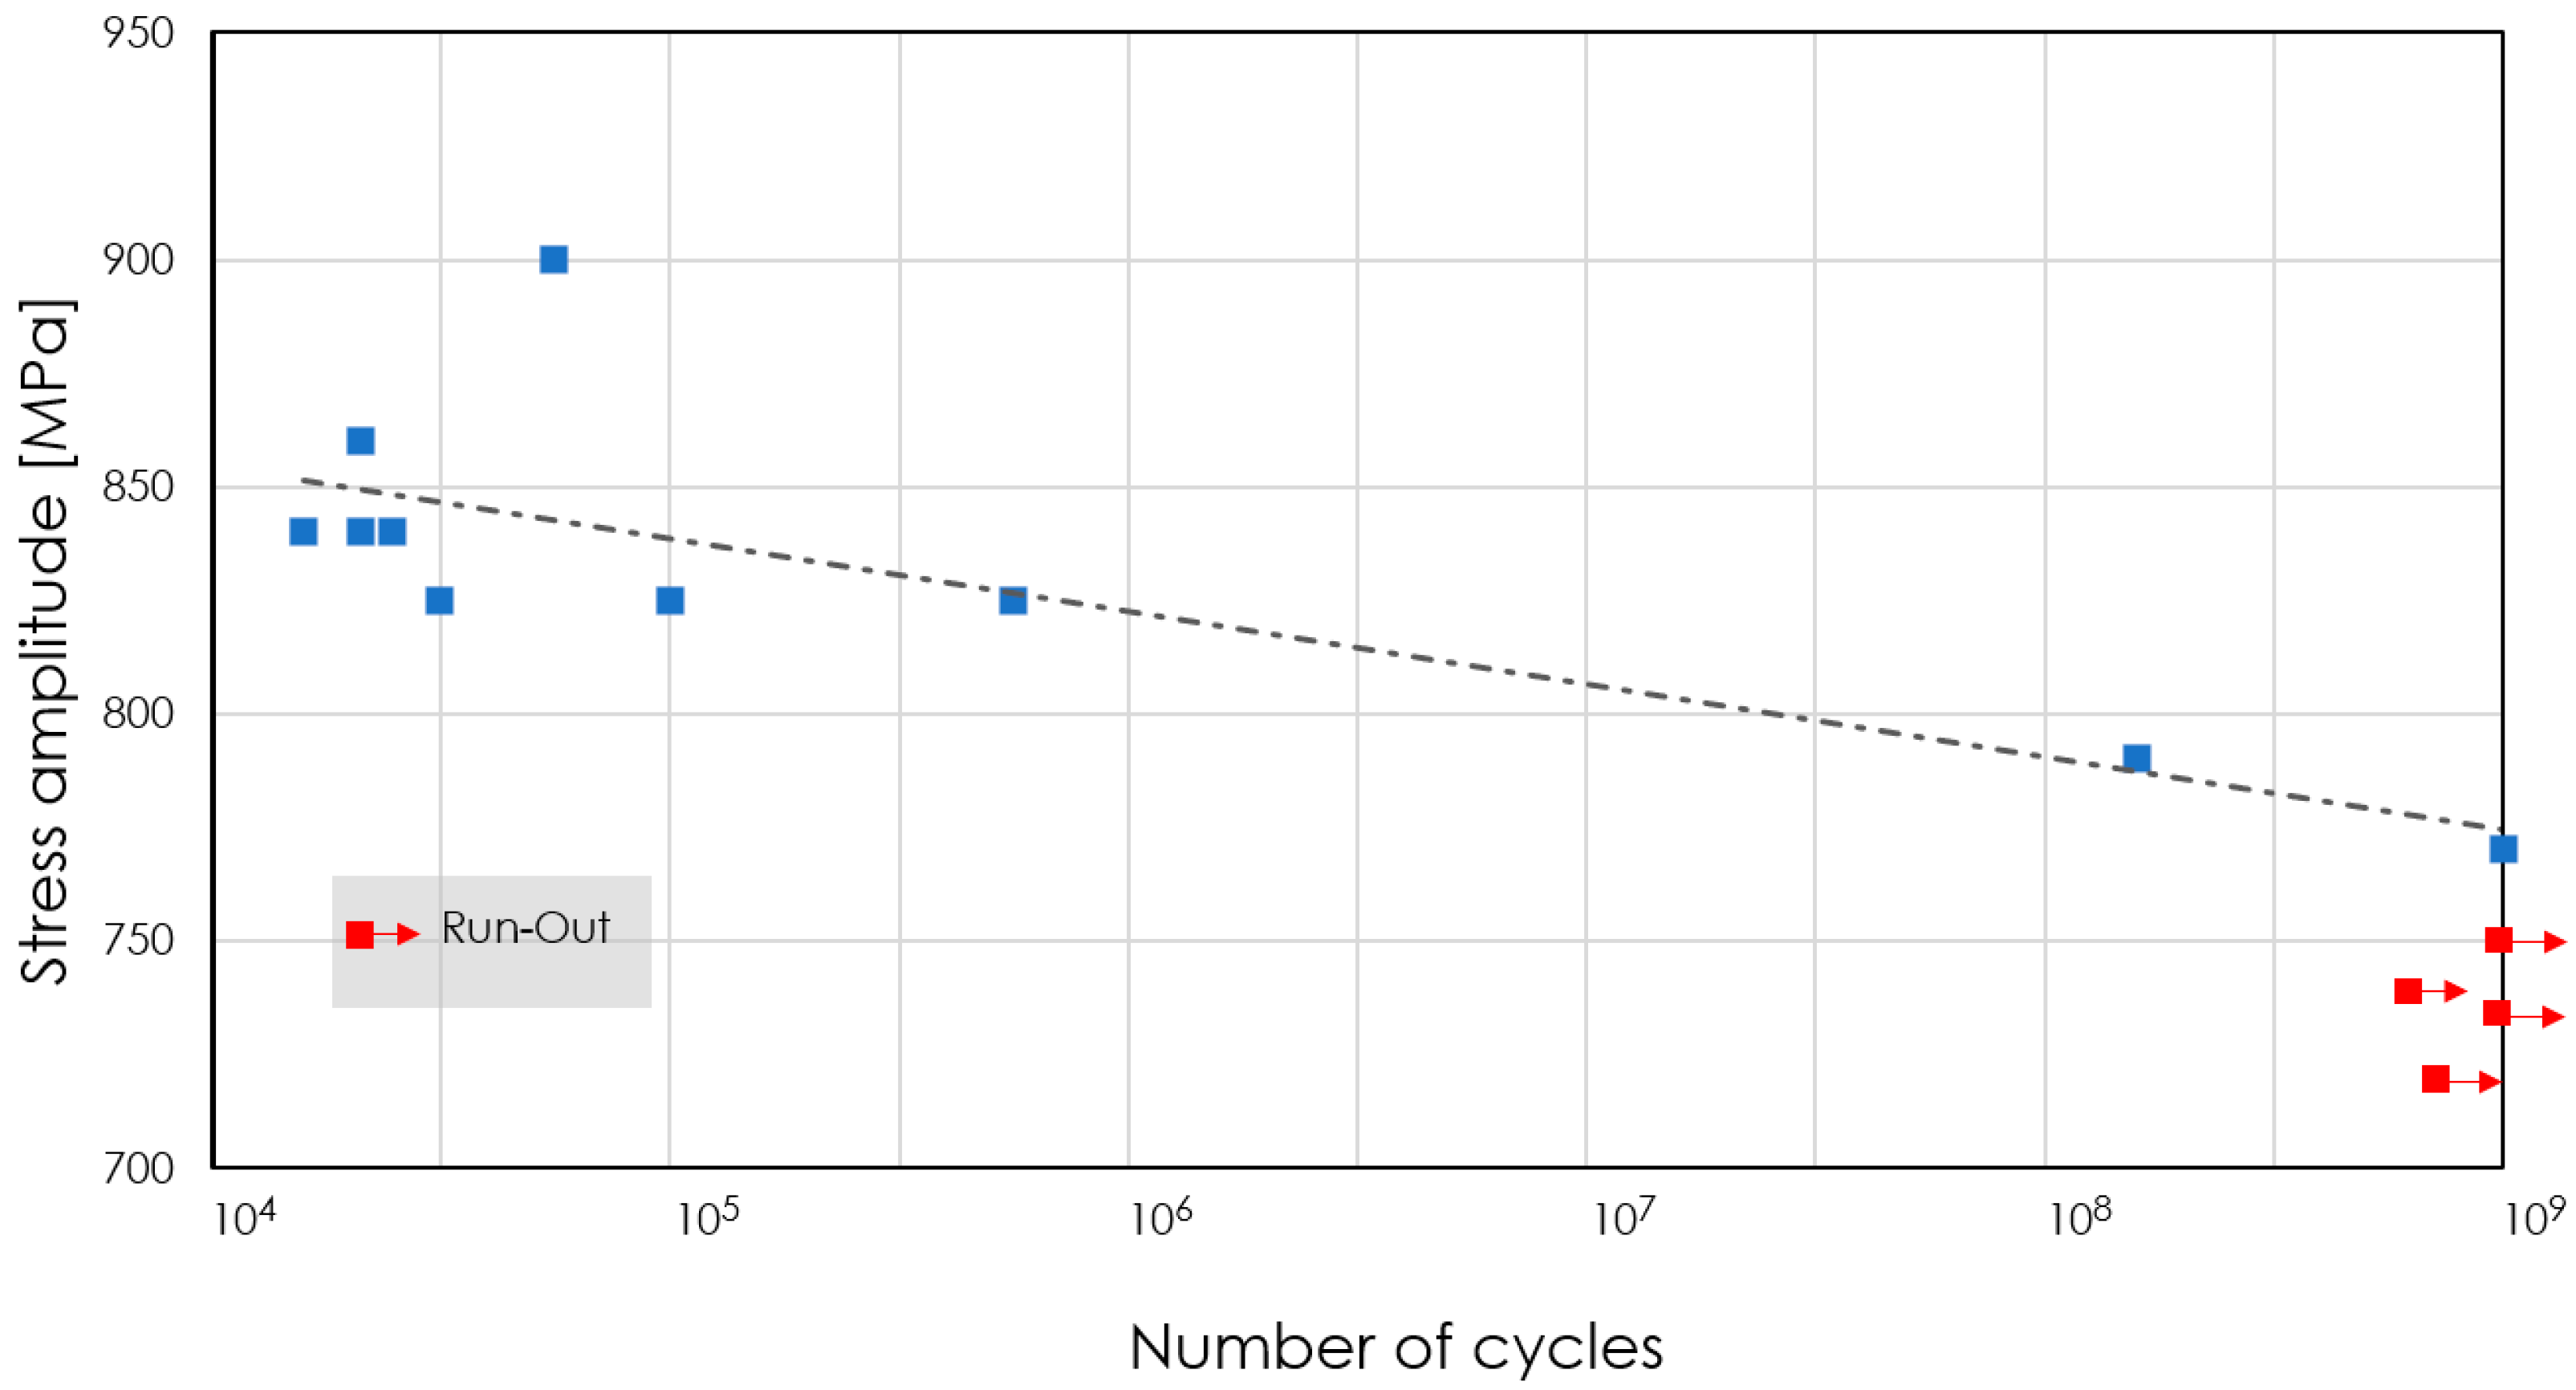
The S-N diagram of SAE 52100 martensitic hardened steel is shown in
Figure 7 [
19]. As it can be seen within the S-N diagram, the stress amplitudes below 750 MPa are under the fatigue endurance limit, and SAE 52100 martensitic hardened bearing steel is supposed to undergo an infinite number of cycles at these stress amplitudes. In order to evaluate the relevance of the voids with respect to early failures, the calculations are made on the stress amplitude level of 750 MPa.
3. Simulation
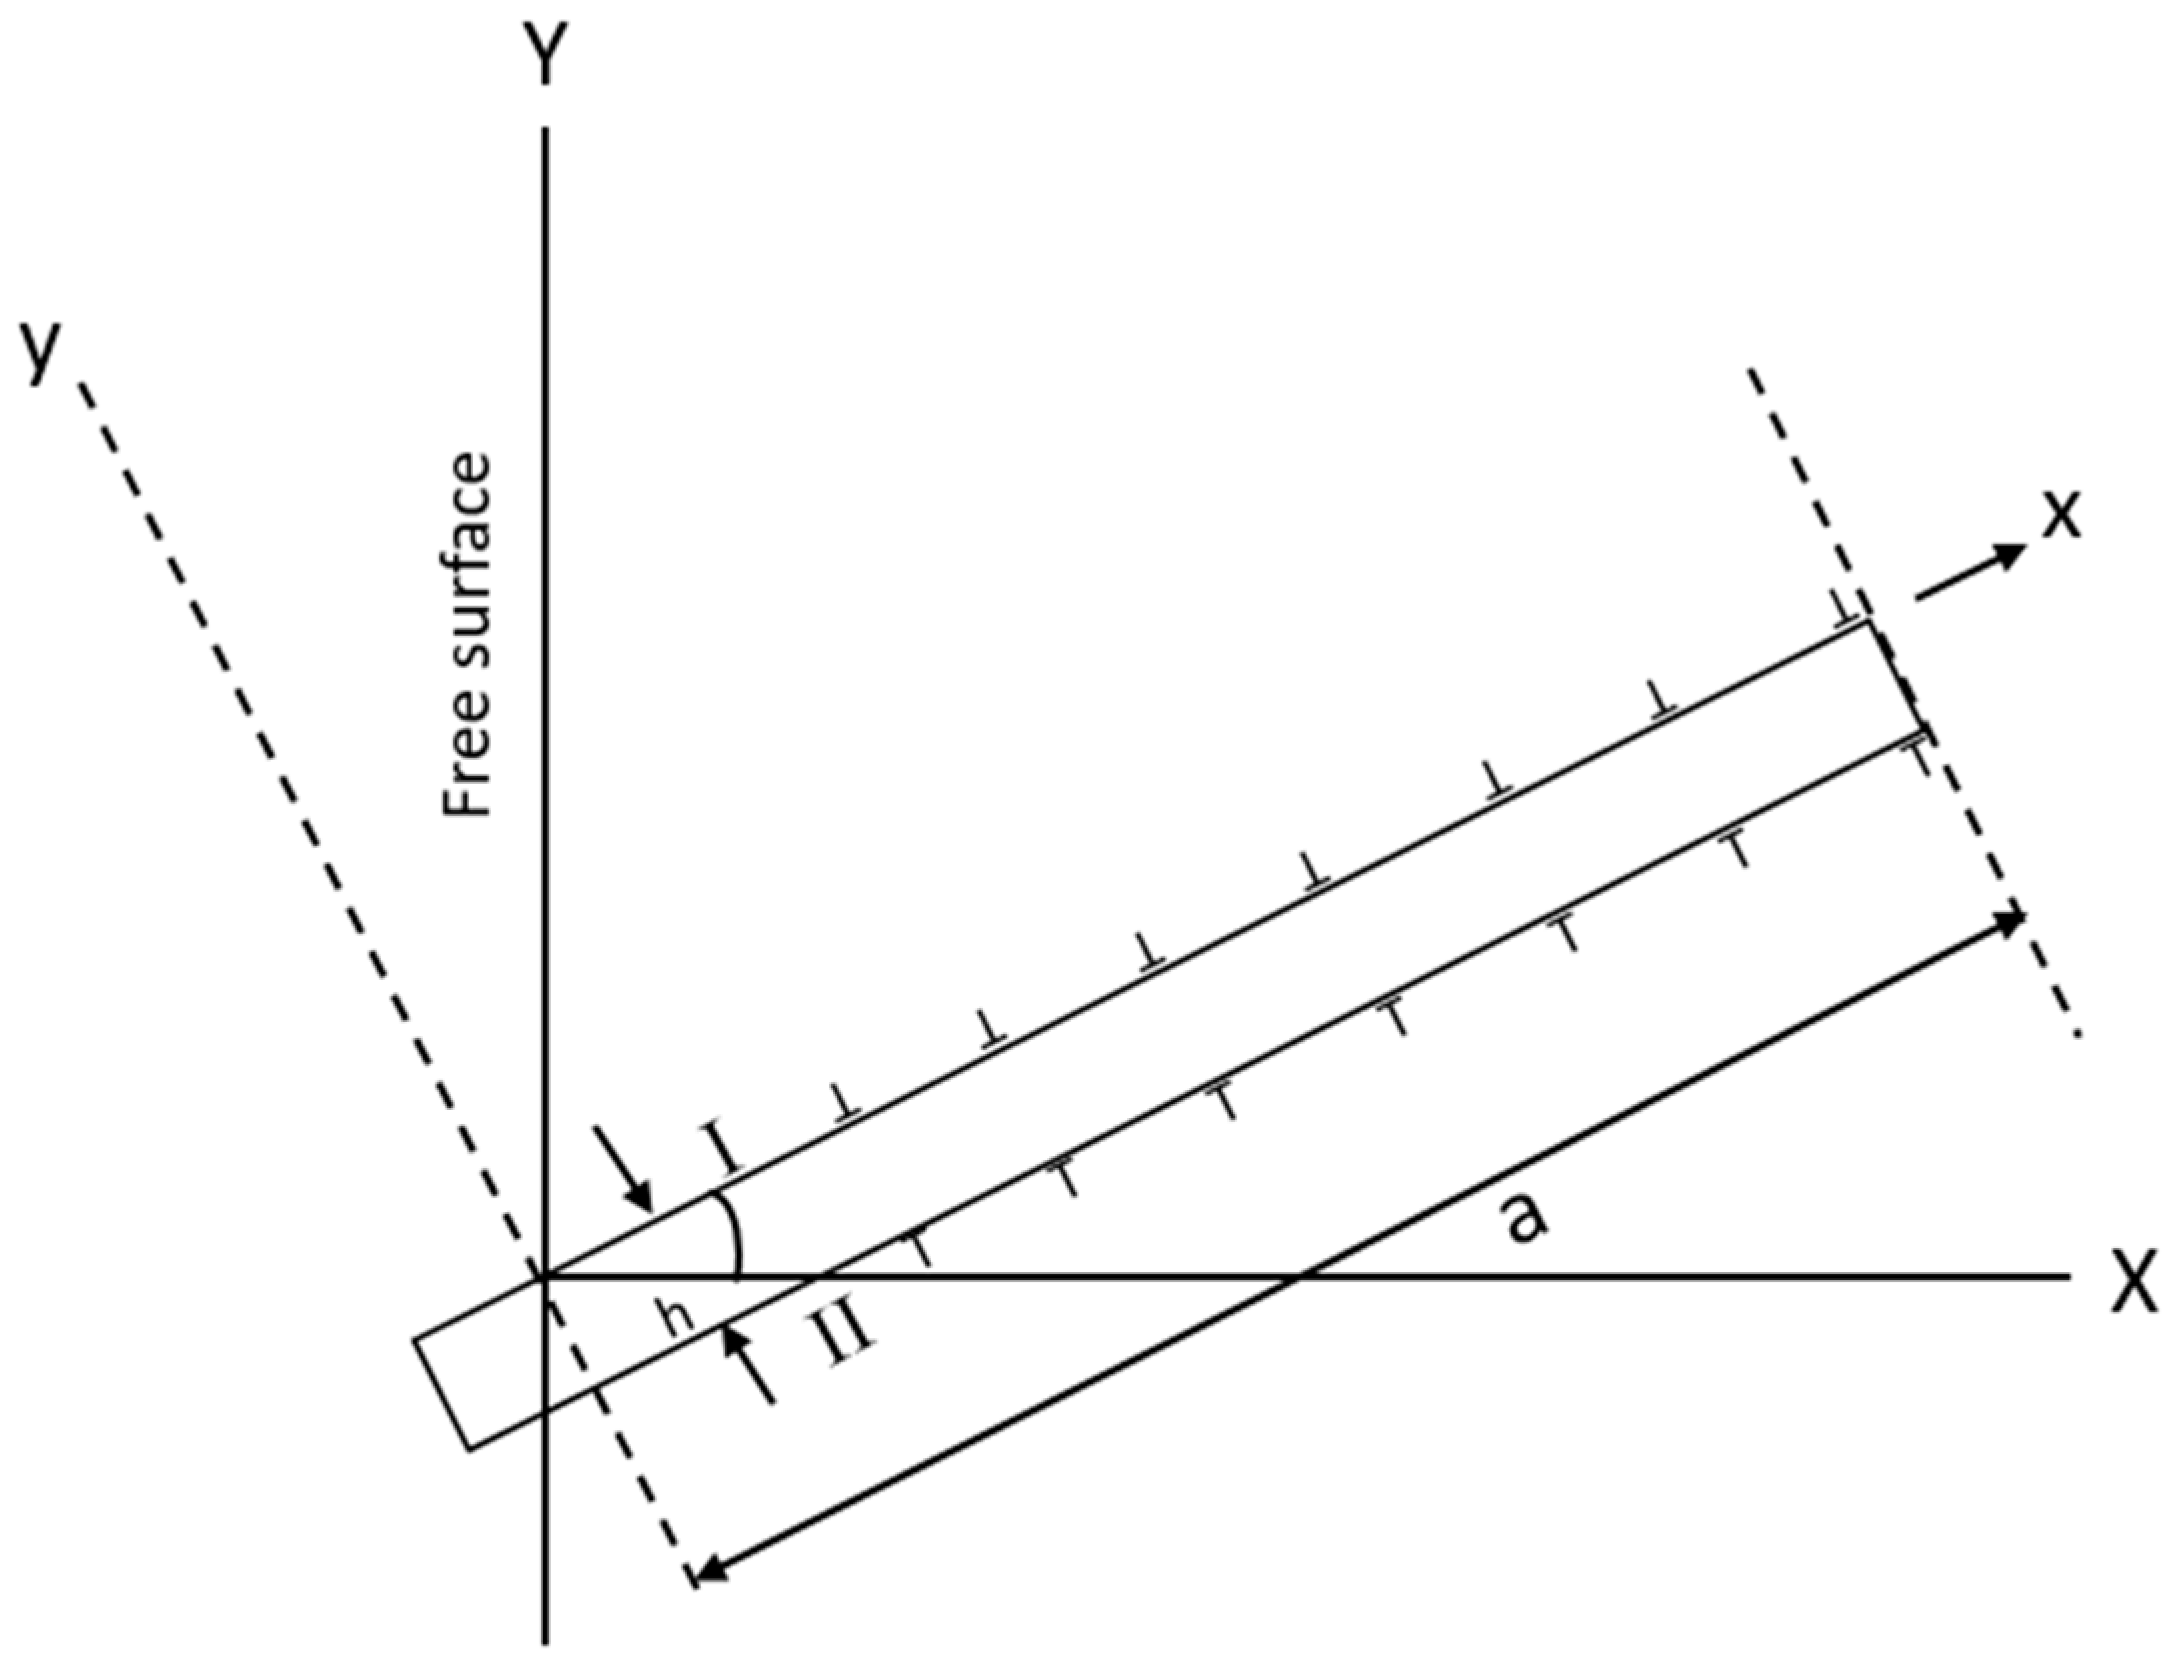
In order to calculate the required number of cycles for crack initiation under cyclic loading conditions, the physically-based Tanaka–Mura (TM) equation is employed [
20,
21]. The TM equation is a powerful micro-mechanical model for crack initiation on the slip band of metallic materials under cyclic loading. This method suggests an energy balance of the dislocation structure on the slip bands inside the most favorable oriented grains. The slip band consists of two series of dislocations on layers located in opposite directions to each other, which is considered as the main factor for deformation in metallic materials as a result of forward and reverse loading (
Figure 8).
The change in energy
caused by the forwarding loading of dislocations on the layer I, to the reverse loading on layer II, is given by:
where
is the average shear stress on the slip band and
CRSS is the critical resolved shear stress which must be exceeded for the dislocation motion. In the model
>
2CRSS is assumed, which means that the shear stress value on the slip band should be at least twice the value of
CRSS to enable the dislocation movement.
The TM equation enables the calculation of the required number of cycles for crack nucleation inside grains, based on the pile-up of dislocations inside a grain under cyclic loading conditions.
Among the parameters of Equation (3), the shear modulus (G), the Poisson’s ratio (, the fracture energy (Wc), and particularly the critical resolved shear stress (CRSS) for a dislocation along with a slip band in order to start to move, are material-related parameters. These material properties can be obtained experimentally. The segment length (ds) is a model parameter to discretize the slip bands and the average shear stress on the slip band () is calculated by means of finite element method (FEM) simulations.
The uniqueness of the TM model takes the contribution of the dislocation movement and the contribution of the CRSS, needed for their movement, into account.
Table 2 summarizes the mechanical properties of SAE 52100 martensitic hardened steel, which are required for the simulation and the TM equation (Equation (3)).
Within this framework, a macro-model or so-called global model delivers the mechanical boundary conditions for the micro-models which contain the different microstructures. Regarding the material properties, an isotropic elastic behavior with Young’s modulus (
E) of 210 GPa, a shear modulus (
G) of 80 GPa, and a Poisson’s ratio (
) of 0.3 is assigned to the macro-model, whereas a pure elastic orthotropic behavior with material elastic constants C
11 = C
22 = C
33 =
E(1 −
)/(1 −
− 2
2) = 282 GPa, C
12 = C
13 = C
23 =
E/(1 −
− 2
2) = 121 GPa, and C
44 = C
55 = C
66 =
G = 80 GPa is assigned to the micro-model. The comprehensive explanation regarding the employment of the TM formulation in FEM simulations of the crack initiation procedure is provided in the works of Mlikota et al. [
24,
25,
26,
27,
28,
29] and Božić et al. [
30,
31,
32].
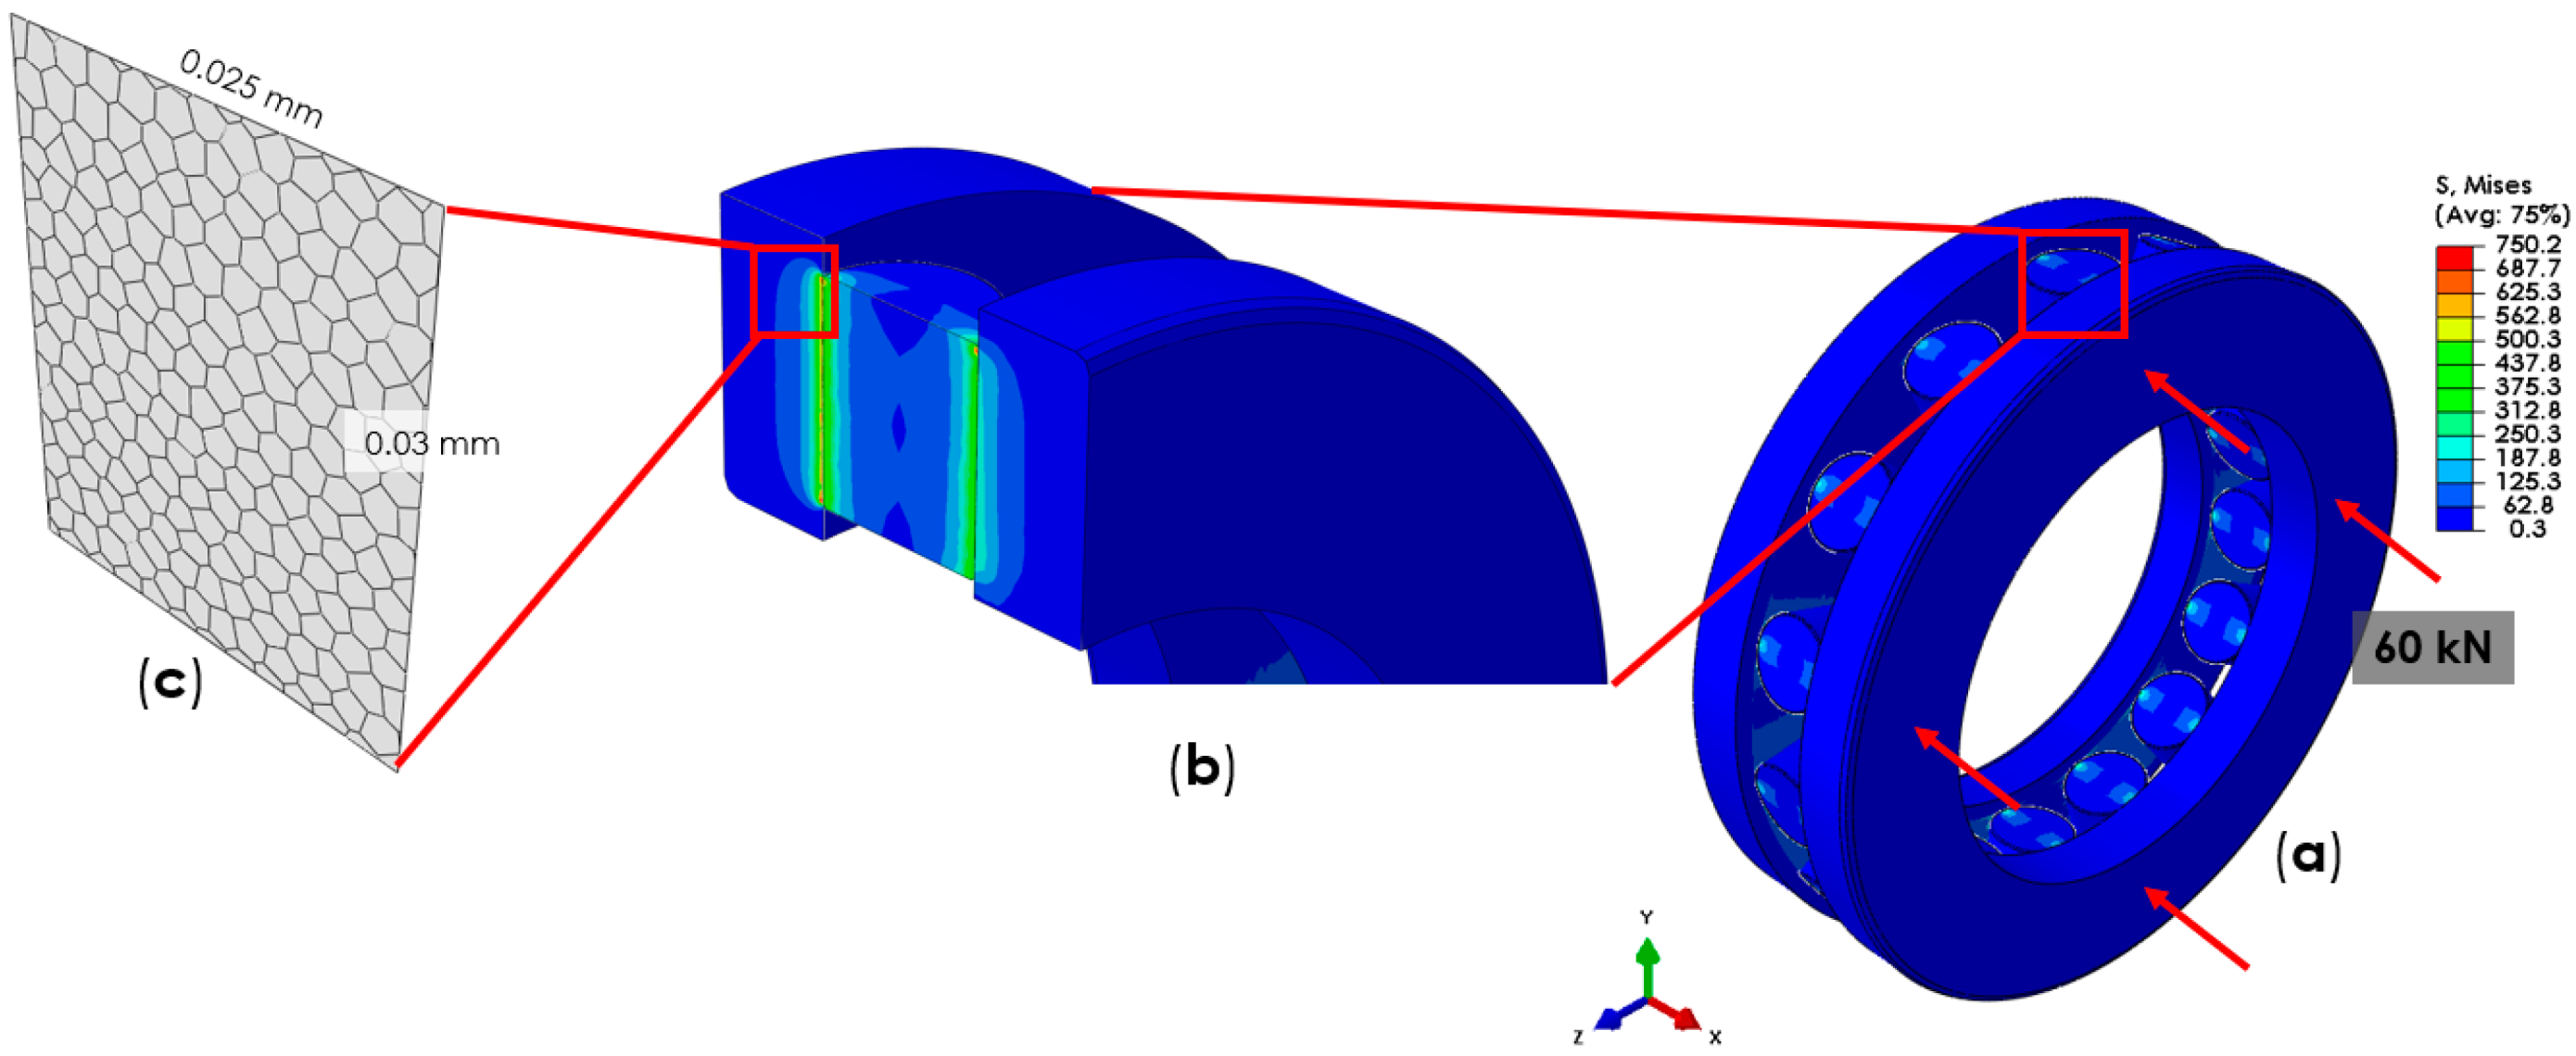
In order to apply realistic loads on the microstructure model, a two-step sub-modelling approach was employed. In this sense, a three-dimensional (3D) macro-model was developed based on Computer-Aided-Design (CAD) data of the cylindrical roller bearing shown in
Figure 3. To represent operational conditions on the surface of one side of the bearing in the macro-model, a compressive load of 60 kN was applied (
Figure 9), carried by 15 rolling elements, which were guided in a brass cage, resulting in a contact pressure of 1900 MPa. This load induces a stress magnitude of 750 MPa in the sub-surface area inside the ring close to the contact region, which is below the critical stress amplitude (see
Figure 7). The other side of the bearing was the constraint. Between the surface of the roller and the inner surface of the rings, a tangential surface to surface contact with a friction coefficient of zero was defined. From the experimental investigations, fatigue was observed due to the dynamic contact of the roller bearings. As it can be seen in the macroscopic simulation results in
Figure 9, the most critical point in the macro-model is the contact area of the cylinders and rings. Therefore, this region was selected for the subsequent sub-modelling procedure. For this purpose, a 3D FE model was generated in this area with fewer discritization. The sub-modelling procedure enables the transfer of mechanical boundary conditions to this smaller 3D FE model. This approach with an intermediate FE model is necessary to obtain an accurate stress distribution at the micro-scale with acceptable computational efforts. Finally, to perform the calculations for the fatigue crack initiation analysis, a 3D shell micro-model was developed in the critical region, which is specified in the red square in
Figure 9 by repeating the sub-modelling technique in ABAQUS. The microstructure of the sample based on the cross-sections in
Figure 6, is developed in the micro-model using the Voronoi tessellation technique [
33,
34]. An average grain size of 1.5 μm is assigned to the micro-model. The size of the micro-model was 25 × 30 μm
2 with a thickness of 0.01 μm. The generated microstructure consists of 236 grains as shown in
Figure 9c. More detailed explanations regarding the sub-modelling technique employed in this work is discussed by Mlikota et al. [
24,
25].
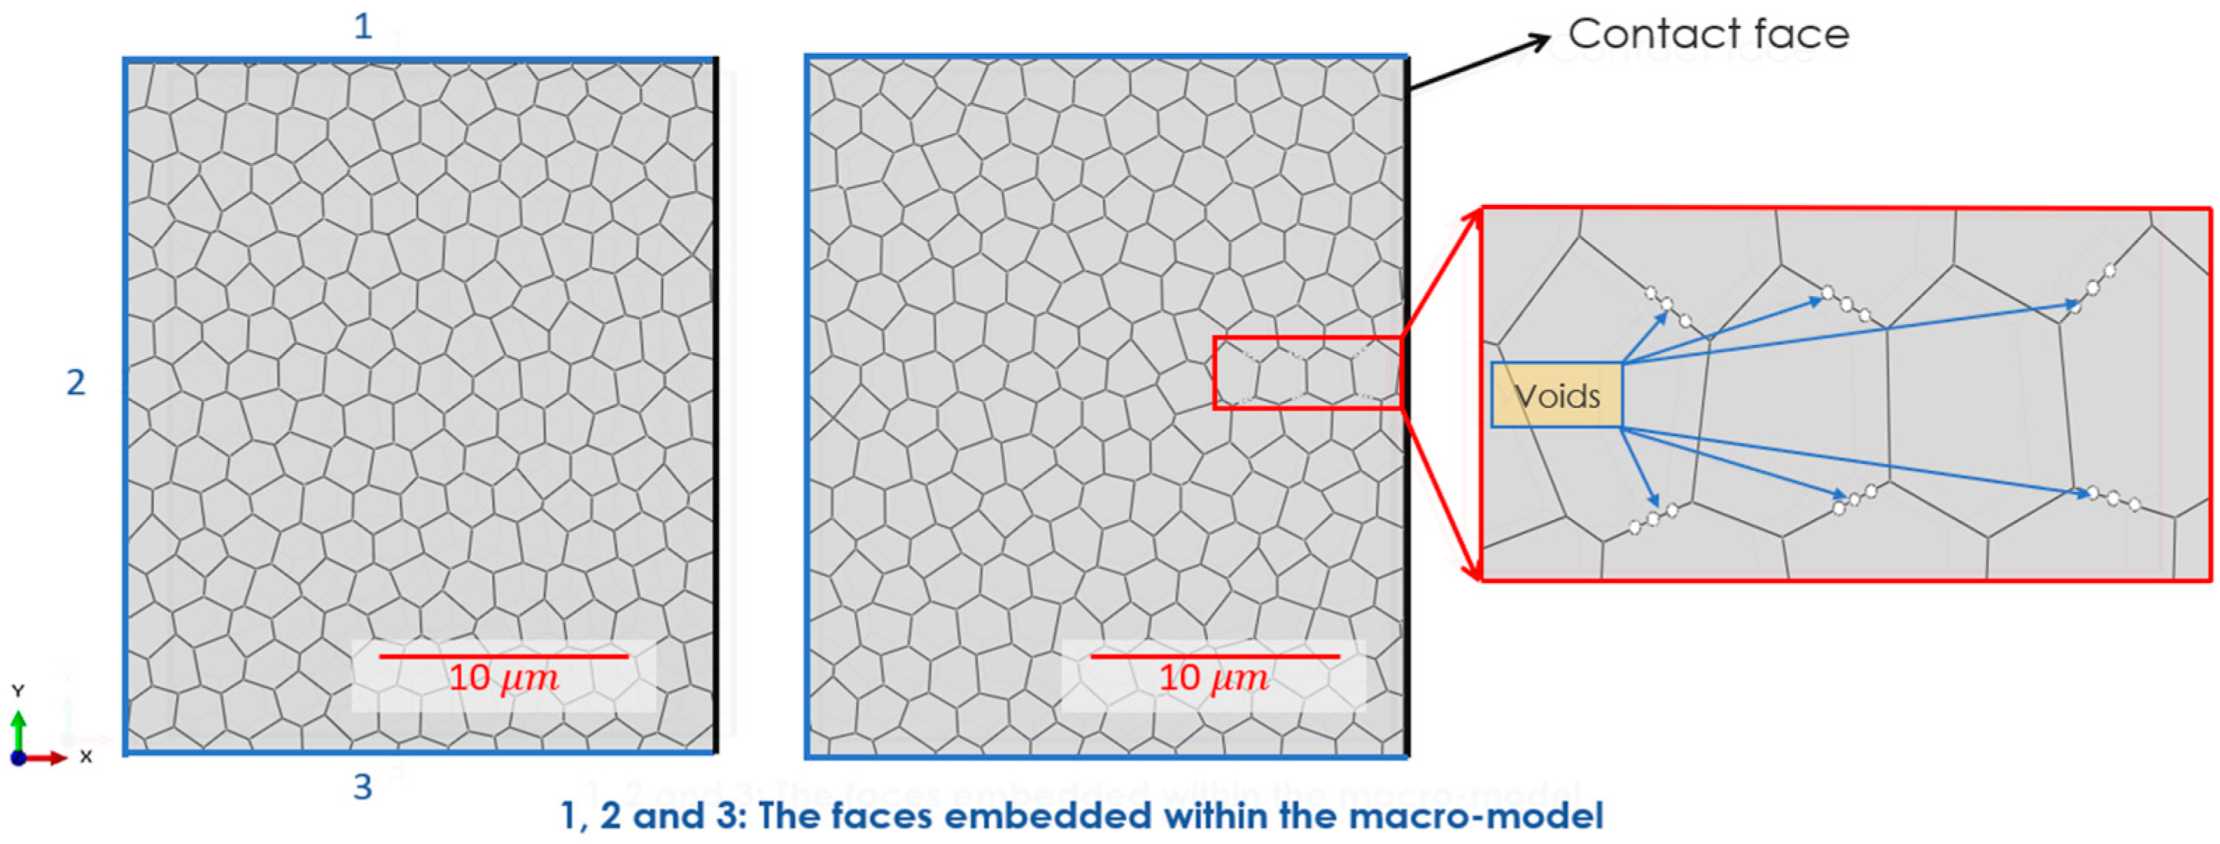
In order to investigate the effect of porosity, two microstructures, with and without voids, are assigned to the micro-model, as shown in
Figure 10. The voids were positioned along the grain boundaries in three grains which are located 1, 4, and 5 µm below the surface (contact face). The average radius of voids is 6 × 10
−2 μm. Since the purpose of this numerical study was the comprehension of the effect of microstructural porosities on the fatigue behaviour of the bearing components, the position, size, and number of the voids is different from the experimental observations in order to reduce the computational time and effort. In this sense, the position of the artificial pores is considered on the grain boundaries which are the boundaries of the different sections in FEM platform. The actual number of porosities in the real microstructure is also expected to be higher, but here, in order just to get an impression about the influence of porosities on the fatigue performance of the component, 18 pores are implemented in the area with higher stress concentration. All the pores have more or less the same size in the numerical modelling.
4. Results and Discussion
By applying the load on one side of the macro-model, it has been shown that the contact area between the rollers and the rings possesses the highest stress concentration (see
Figure 9). Hence, the crack initiation is likely to raise from that area.
After obtaining the stress magnitudes inside the global model from a quasi-static simulation, the subsequent simulations for both microstructures with and without voids were carried out up to 50 iterations. In each step, the shear stress was evaluated and the number of cycles until crack nucleation was calculated for each segment according to Equation (3). Then the segment with the lowest number of cycles was determined and was forced to fail. Therefore, the number of cycles obtained in each iteration is the number of cycles that is required for breaking one segment inside the microstructure. In the simulation model, a microcrack appears, which changes the shear stress distribution within the model. This whole procedure was repeated until the final iteration or the transition to the next stage was reached (
Figure 3). Due to the stress concentrations at the crack tips, the crack can grow. However, it is even possible that in the next step one segment belonging to another grain breaks, which depends on the grain orientations with respect to the loading condition, and if the shear stress of that segment has already surpassed the
CRSS value [
23].
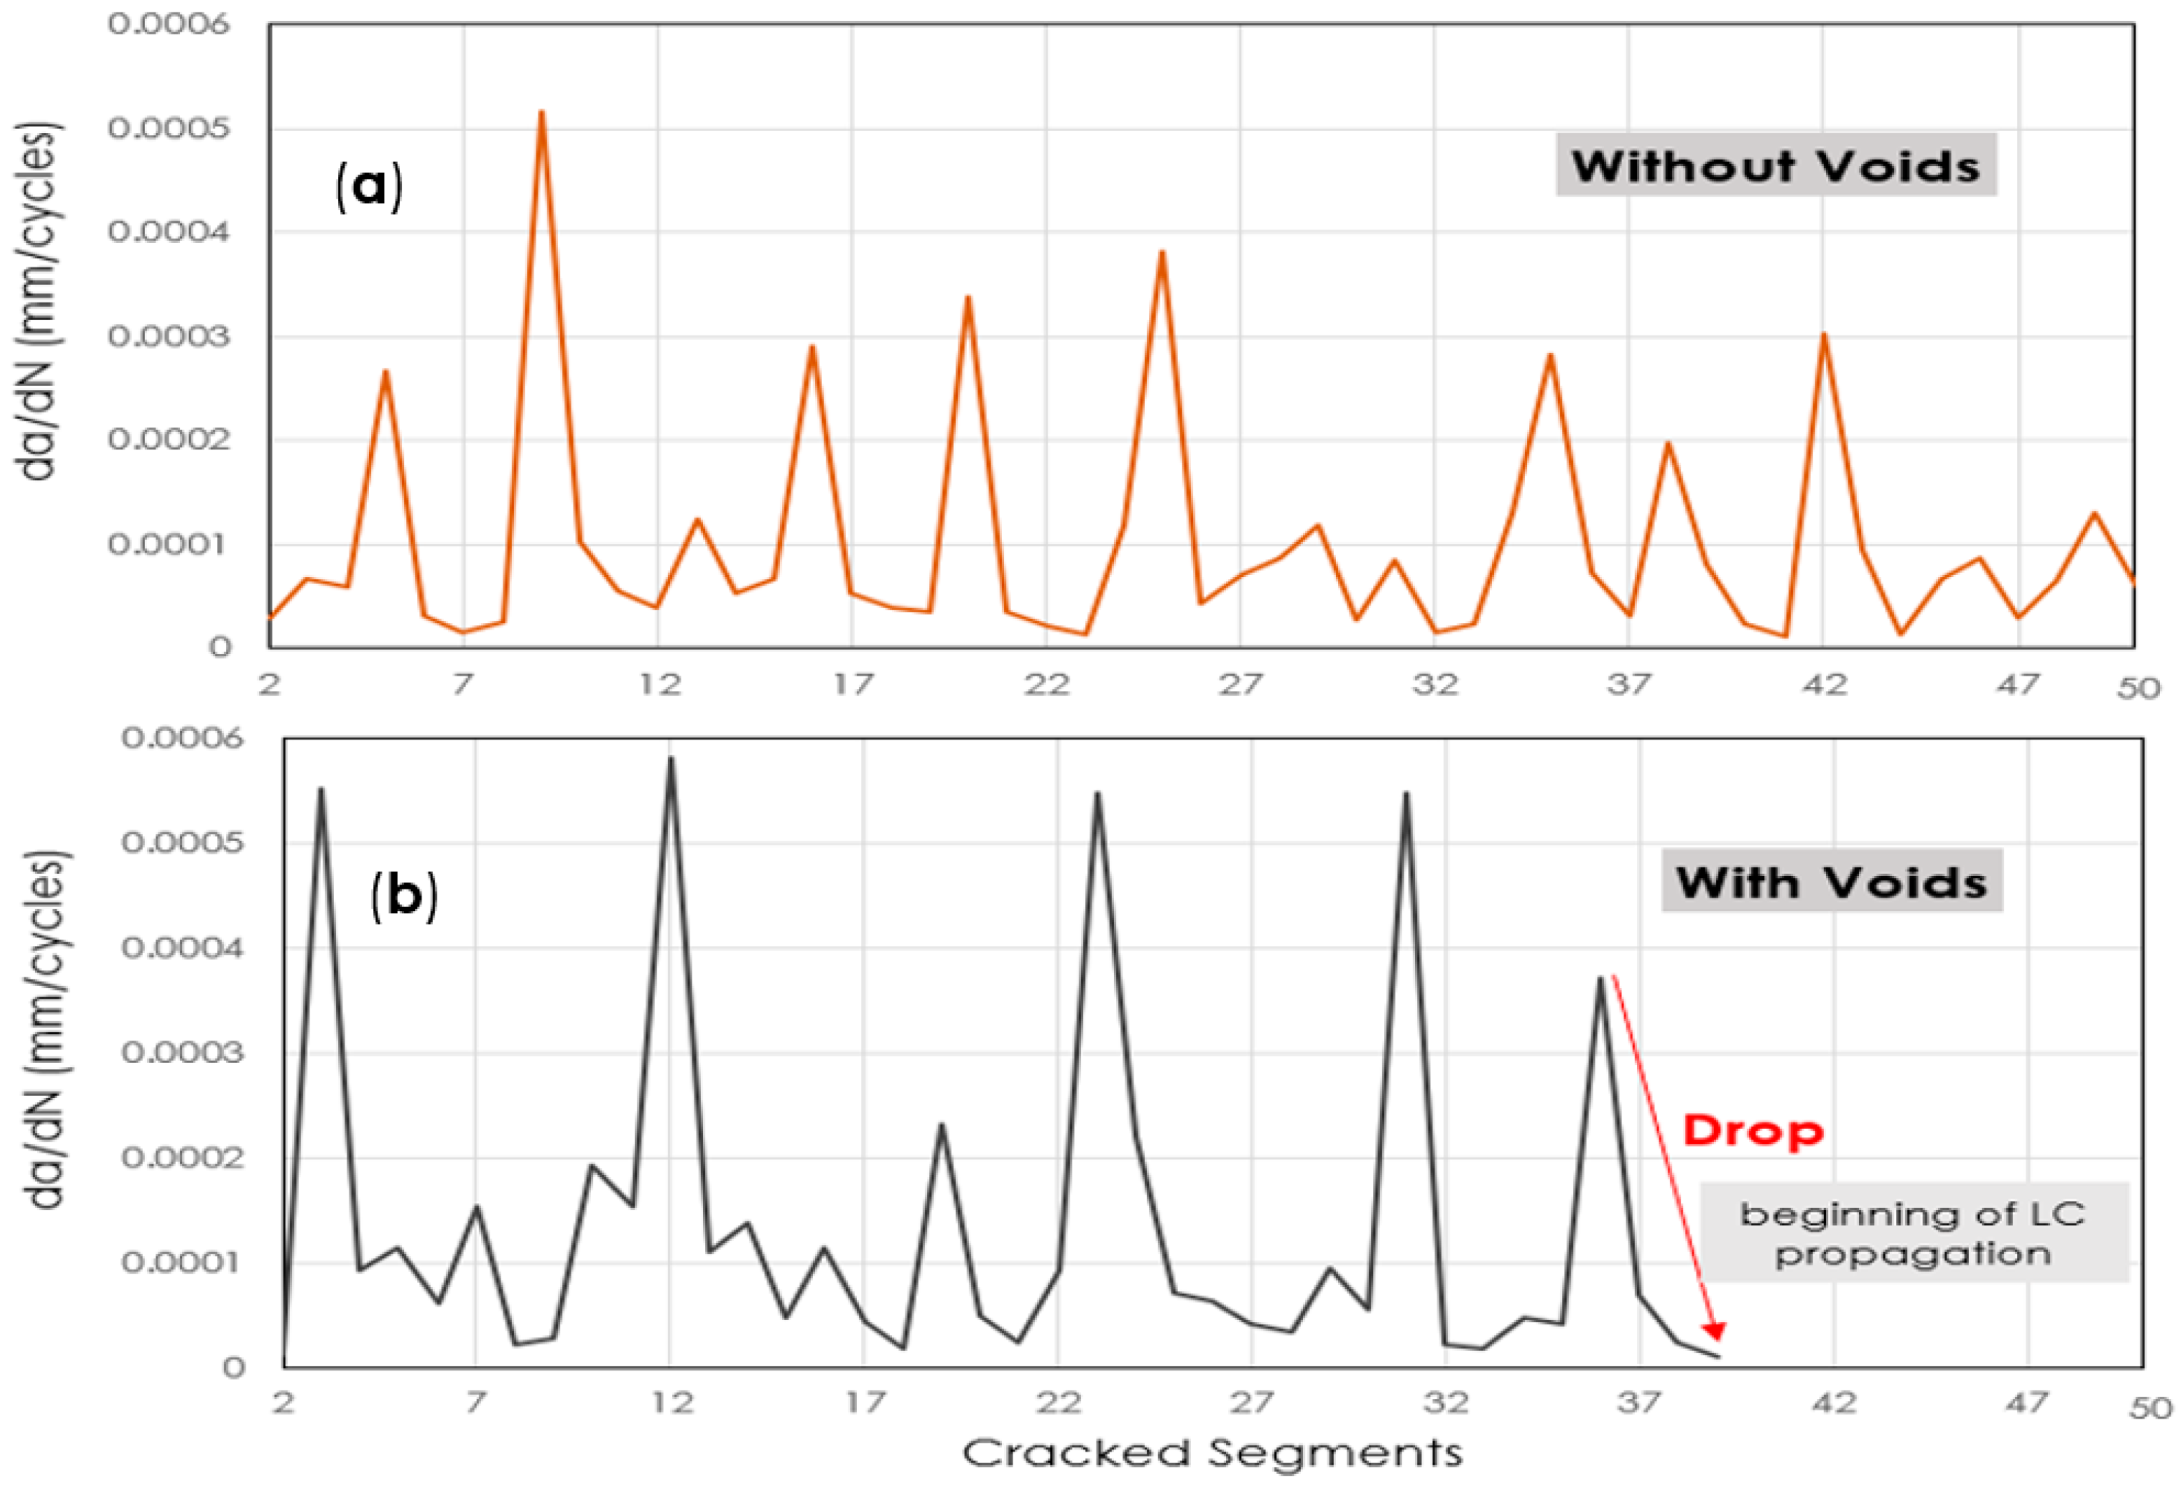
Generally, in the current modelling approach, every MSC that is formed inside the microstructural model possesses a change of the crack length (
da) and the corresponding additional cycles (formation lifetime) (
dN) within an iteration. By dividing the two outputs, one can obtain the crack growth rate (
da/dN) curve as a function of broken segments inside the microstructural model. As seen in
Figure 11, the crack growth rate inside the microstructural model follows an oscillating pattern and drops after breaking a certain number of segments. For the model with voids, a steep drop after 36 iterations was observed (
Figure 11b). This drop specifies the end of crack initiation and the beginning of the long crack (LC) propagation (region 2, see
Figure 3). A similar experimental observation regarding the descending of the short crack growth rate was reported by Newman et al. [
35]. As it is depicted in
Figure 3, for the short crack (PSC) growth there is a high growth rates at Δ
K values, less than the LC threshold value,
. By increasing the loading magnitudes as the crack length increases, the fatigue short crack data points approach towards LC curve and coincide with it [
35]. For the lower stress amplitudes, the short crack even stopped growing.
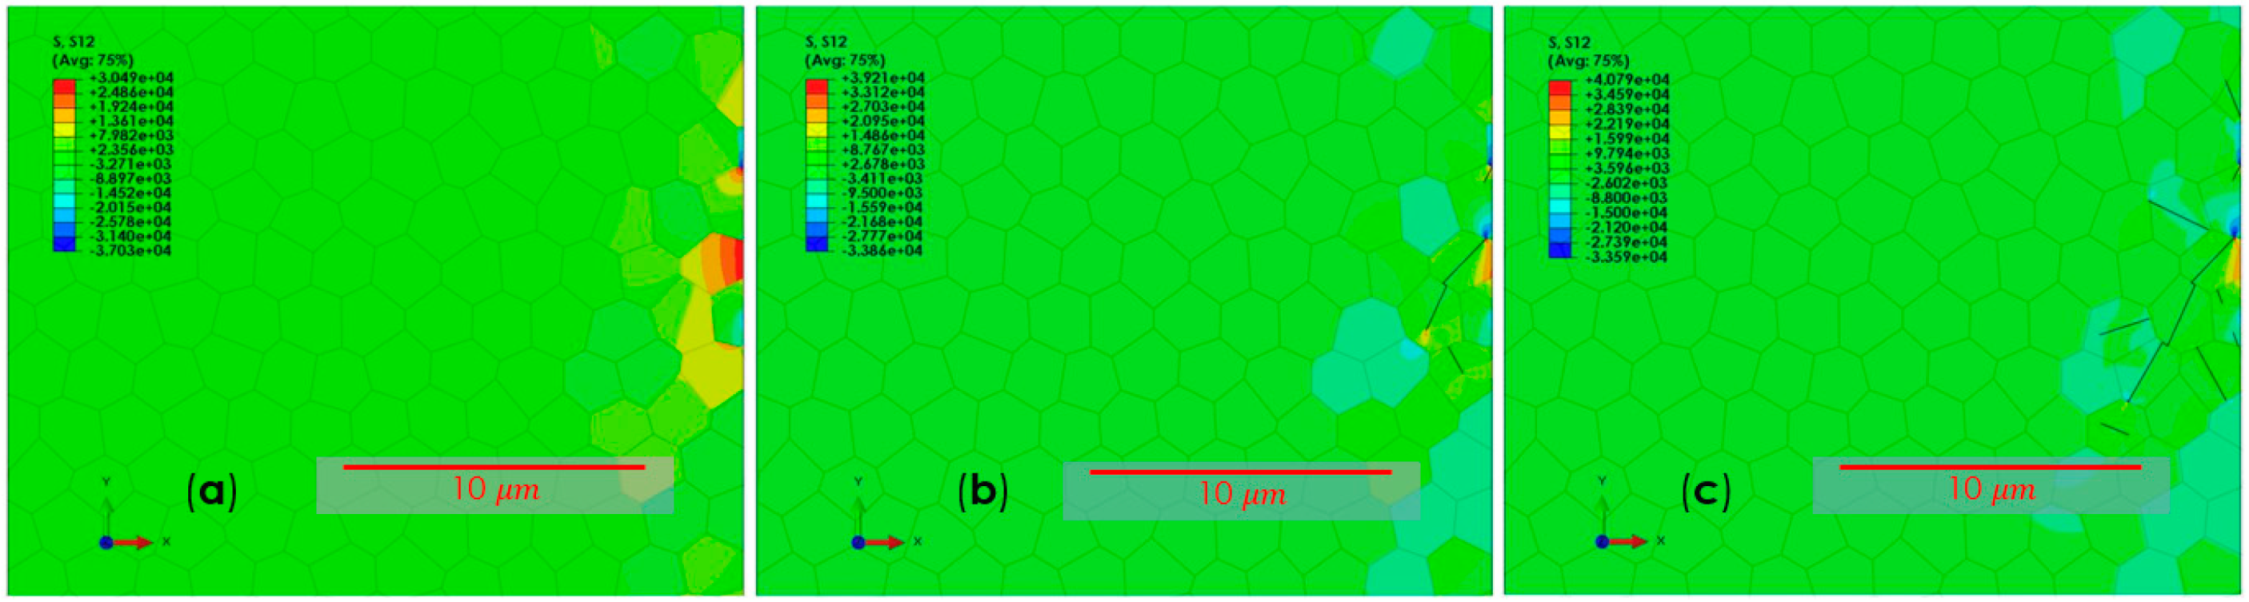
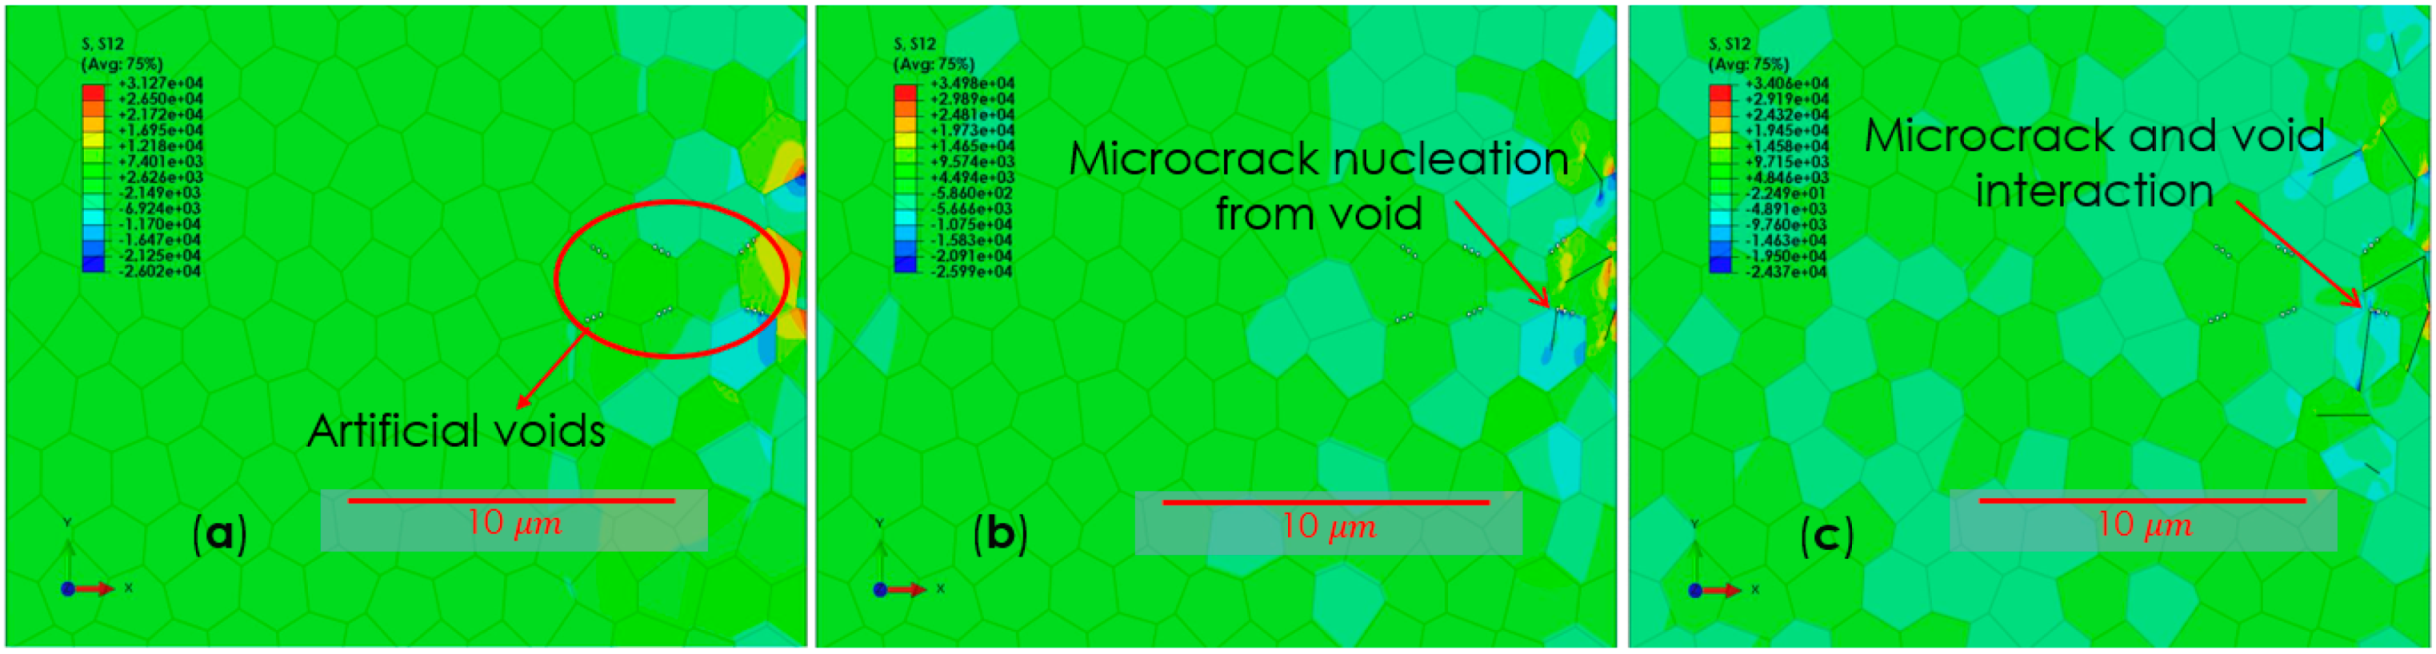
Figure 12 and
Figure 13 show the shear stress contour plot in the micro-model of the samples with and without voids for steps 1, 10, and 38 (at which the fatigue crack initiation stopped and the long crack propagation occurs for the microstructure with voids). This happens when no more micro-cracks can be formed based on the TM equation (Equation (3)), due to the higher actual shear stress distribution inside the microstructure. It was noticed that due to the transfer of the mechanical boundary conditions from the global model to the microstructure model the stresses increased strongly, which was related to a numerical artefact. Obviously, this artificial high-stress level leads to a decrease in the calculated fatigue lifetime compared to experimental values. However, both microstructural simulations show the same numerical effect. Thus, at least a qualitative comparison of the effect of porosity is reasonable.
As can be seen in
Figure 12 and
Figure 13, the voids have a strong effect on the damage initiation pattern within the subsurface microstructure. Although the shear stress magnitude at the beginning was almost equal for both structures, it is visible that the shear stress attains higher values in the microstructure without voids in comparison to the microstructure with voids. This leads to the conclusion that the initiation of the same number of cracks, in the presence of voids within the microstructure, lowers the shear stress values that are required. Moreover, the crack initiation in the location given by the voids is clearly observable (
Figure 13b), continuing until the end of the procedure (
Figure 13c). It is observed that the crack pattern for the model without pores has a clear path that starts from the surface area, which possesses the highest stress magnitudes. On the other hand, for the microstructure with pores, since the porosities are the potential places for stress concentration, the crack initiation can also happen subsurface inside the microstructure.
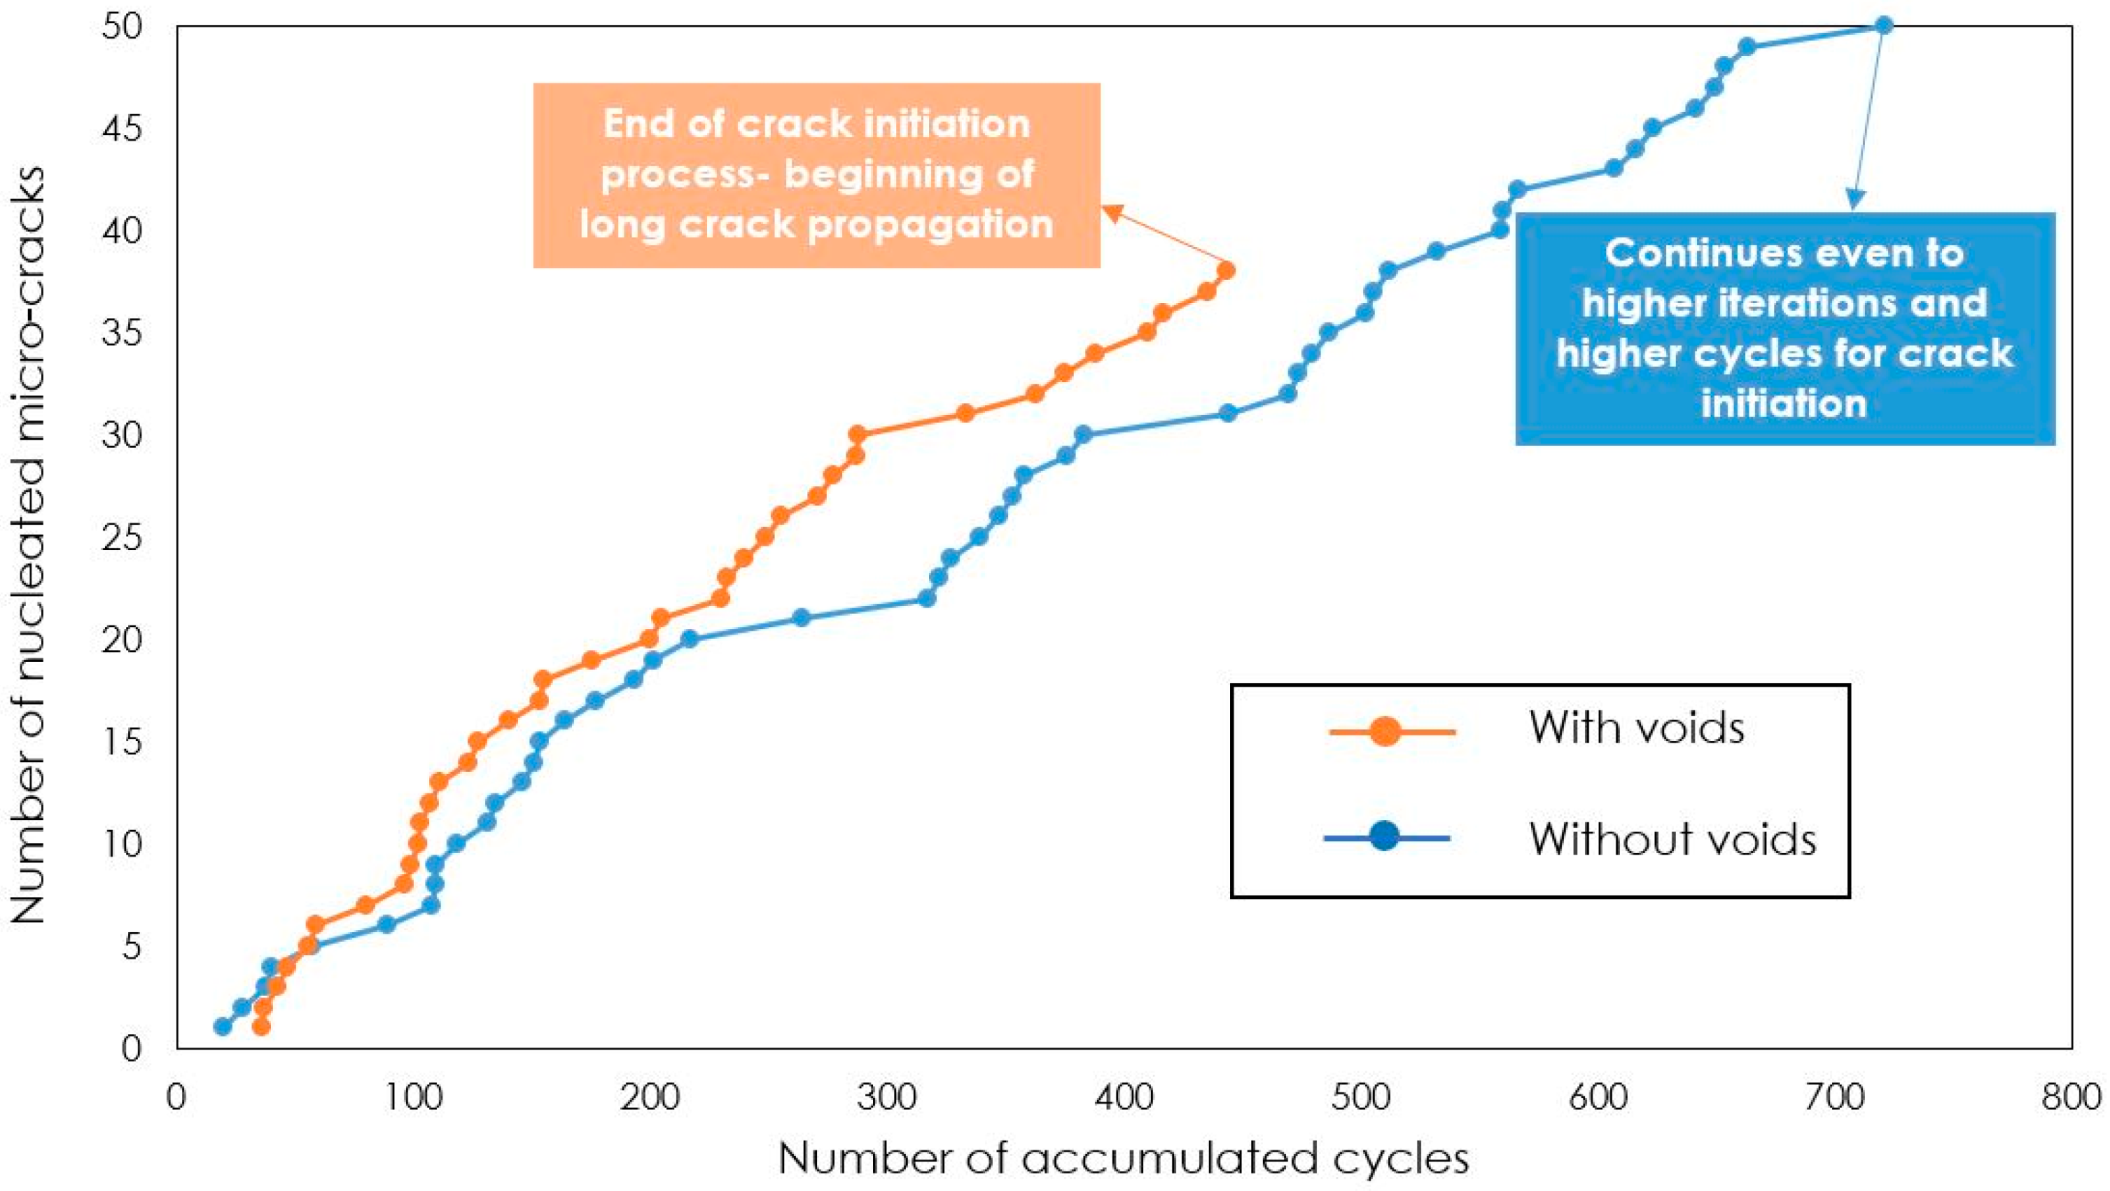
To be able to analyze the effect of the pores on the fatigue behavior, the number of calculated cycles according to Equation (3) were accumulated and plotted against and the number of failed segments, which represent the microcracks.
Figure 14 shows the comparison between the two microstructures (with and without voids) with respect to the microcrack nucleation cycles.
As can be seen in
Figure 14, voids have a significant effect on the fatigue crack initiation, especially from a cycle accumulation point of view. From the calculations, it has been observed that by increasing the number of nucleating microcracks, the differences between the results of the models with and without pores increase.
As it has been mentioned earlier, the drop for the microstructure, which includes voids happens at the 36th iteration, and the simulation process stops completely at the 38th iteration, while the simulation for the microstructure without voids continues until the end of the 50th iteration. Of course, the modelling for the microstructure without voids could continue even to higher modelling iterations, but the number of iterations for this modeling is confined to 50.
In this case, the sample without voids experienced a higher number of accumulated cycles (512 cycles) at the end of the 38th iteration in comparison to the sample with voids (443 cycles). It should also be noted that at the end of the 50th iteration, the microstructure without voids has undergone 721 accumulation cycles altogether.
This means that the presence of pores in the microstructure, even under ideal conditions (e.g., friction coefficient to be zero as assumed), significantly decreases the fatigue initiation lifetime and accelerates the beginning of long fatigue crack propagation and final failure consequently. Based on the S-N diagram of the SAE 52100 martensitic hardened steel (
Figure 7), it is anticipated that the bearing component without porosities in the current loading condition (under the stress of 750 MPa) undergoes an infinite number of cycles, as it is seen also in experimental observations [
10], while in the presence of porosities the S-N curve shifts downwards and the failure for the specific stress amplitude occurs at the lesser number of cycles.

 ,
, 


