Evaluation of Writing Performance for Different Types of Ballpoint Pen Ink by Acoustic Emission Sensing


Abstract
:1. Introduction
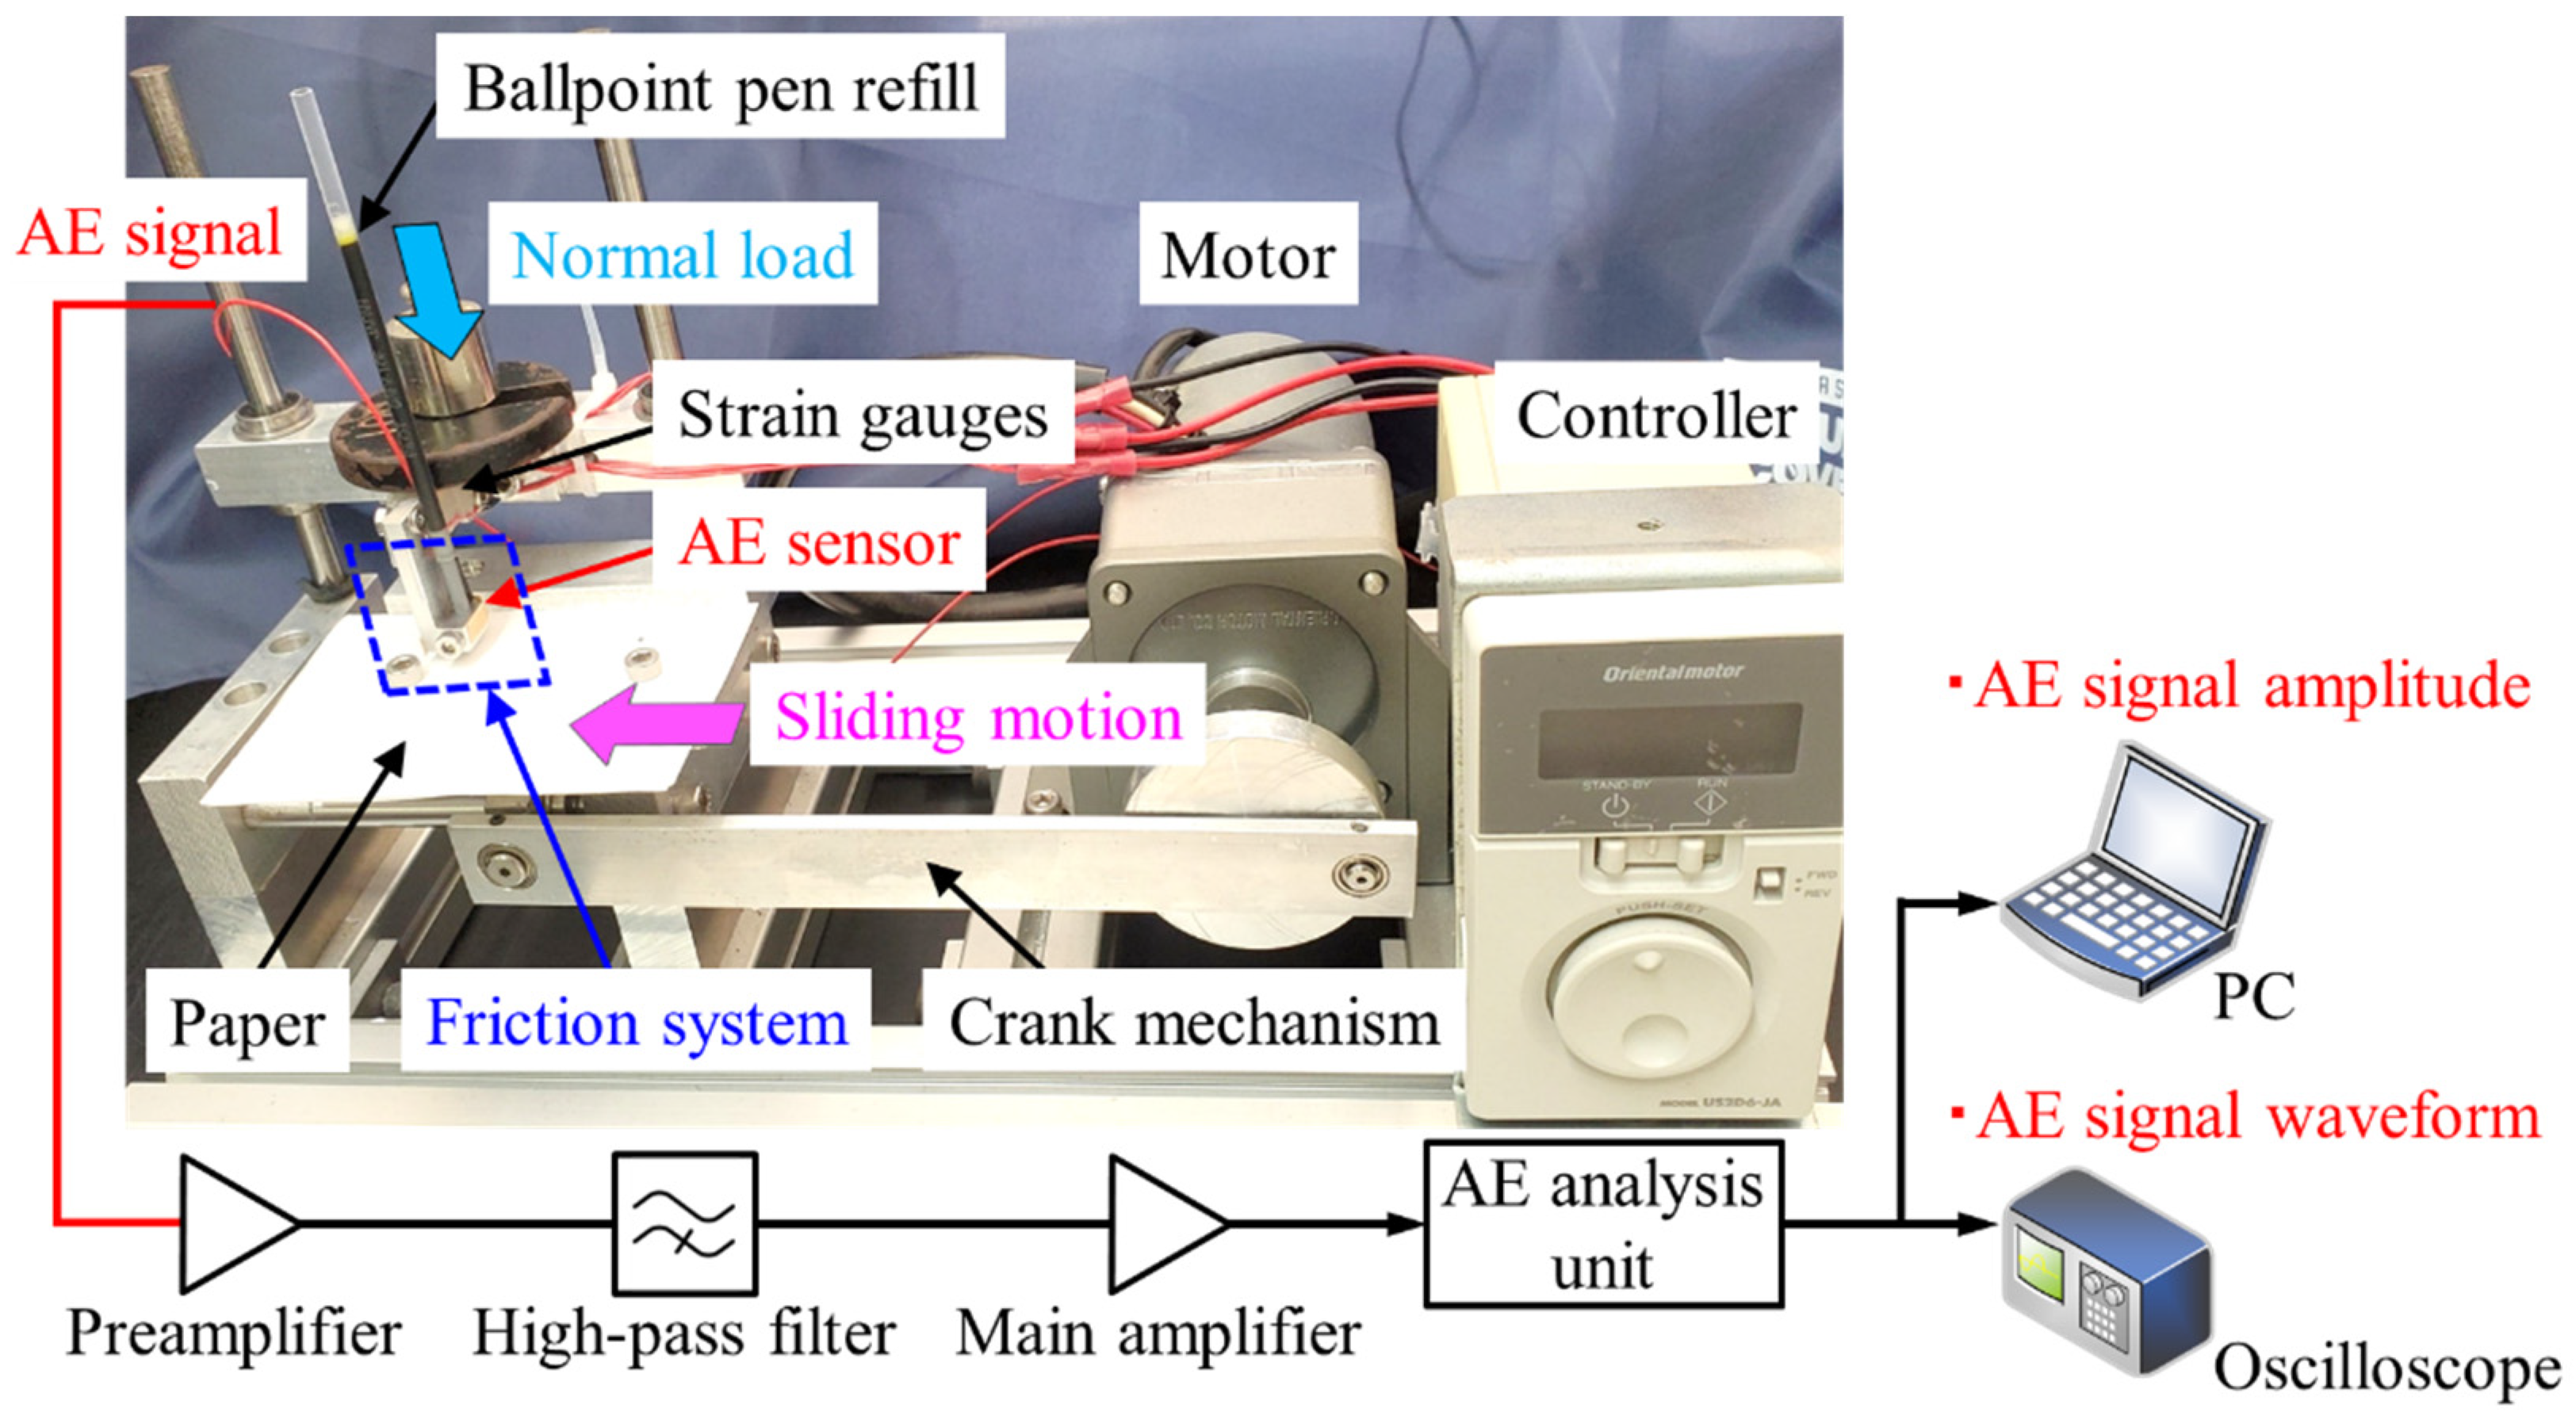
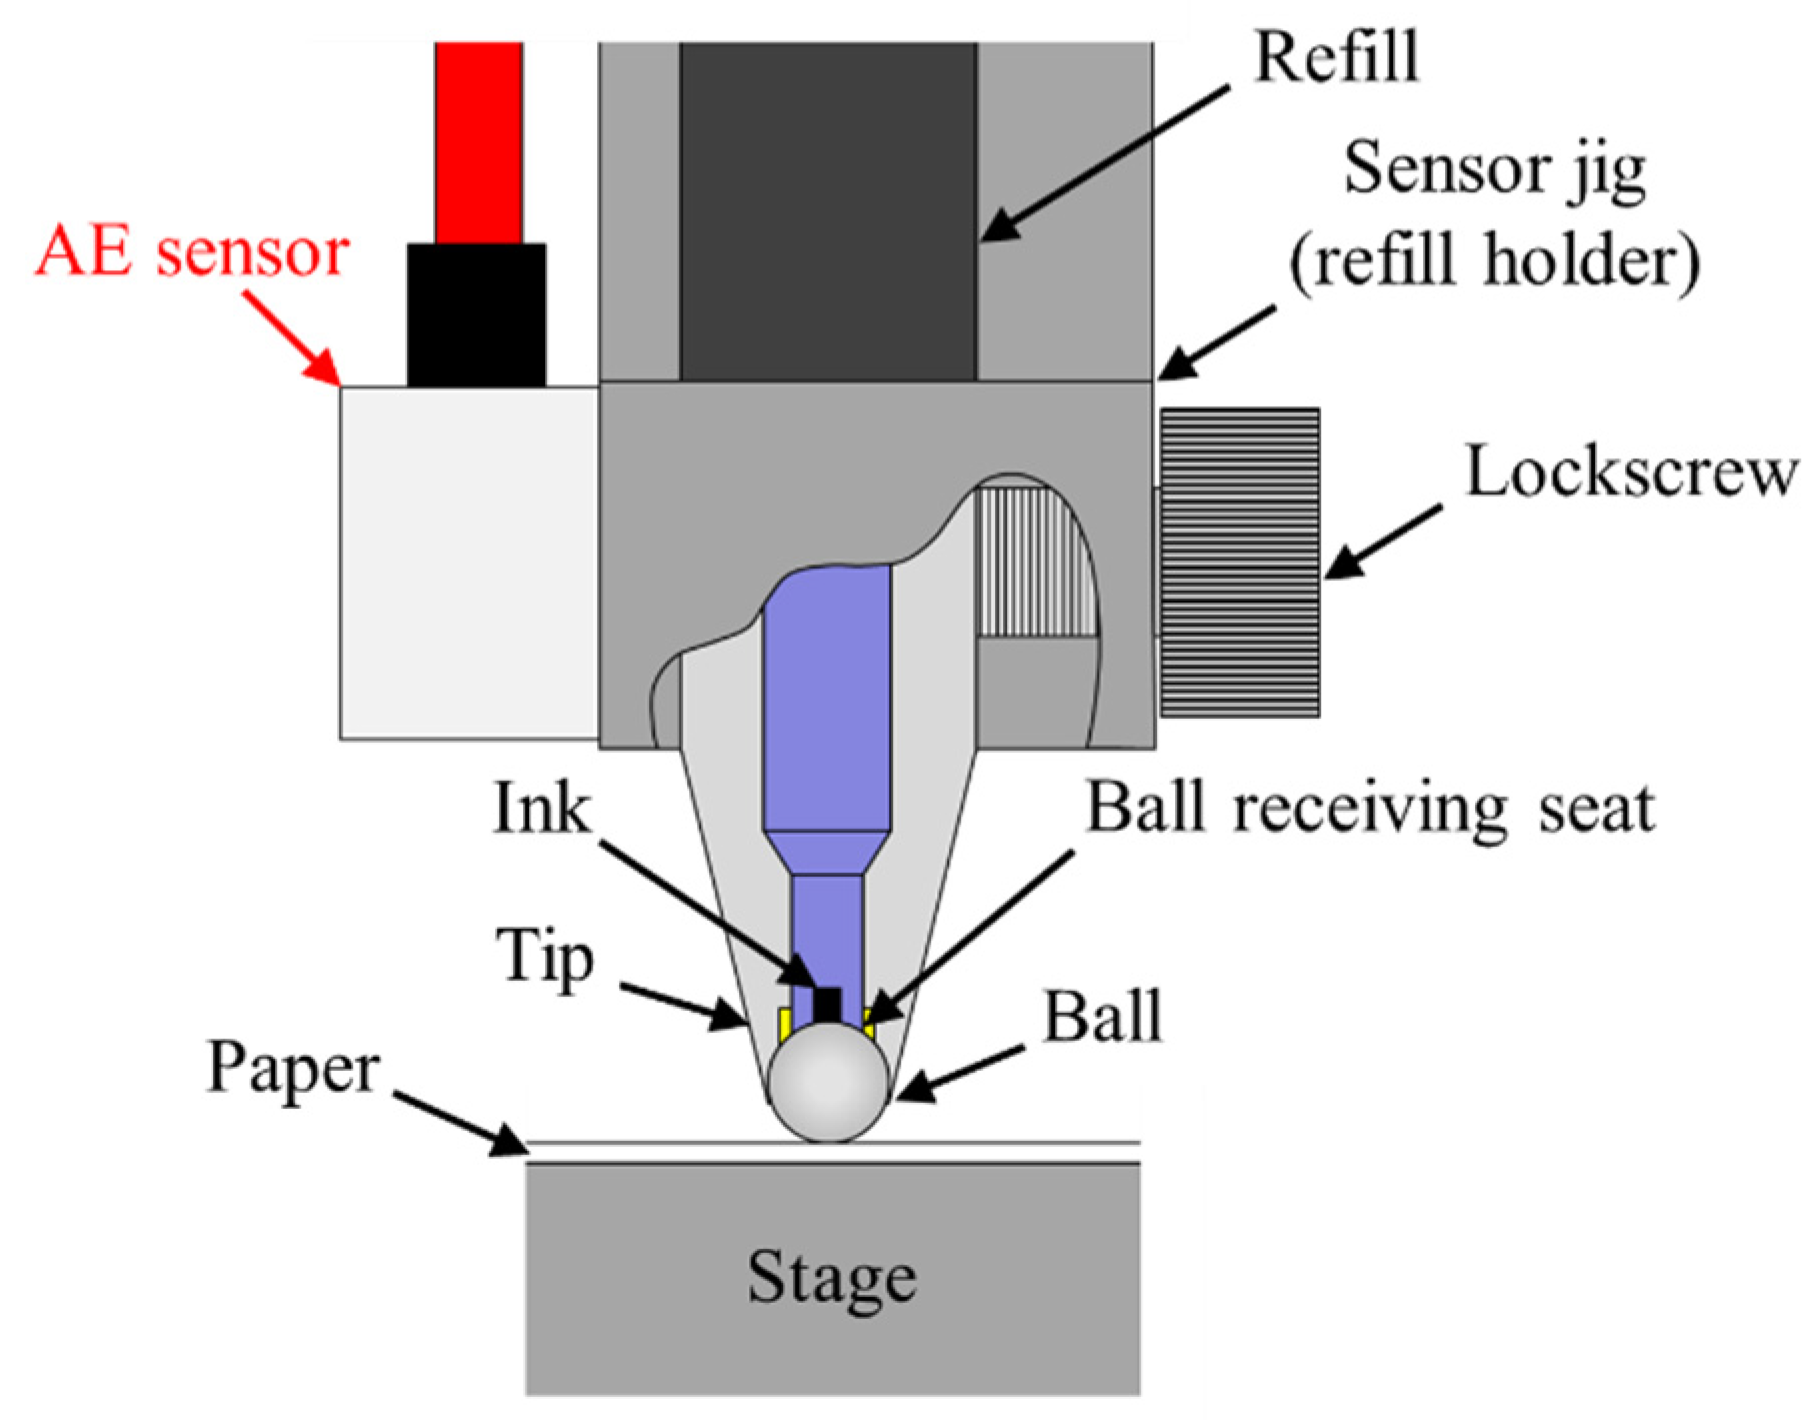
2. Experiments
3. Results and Discussion
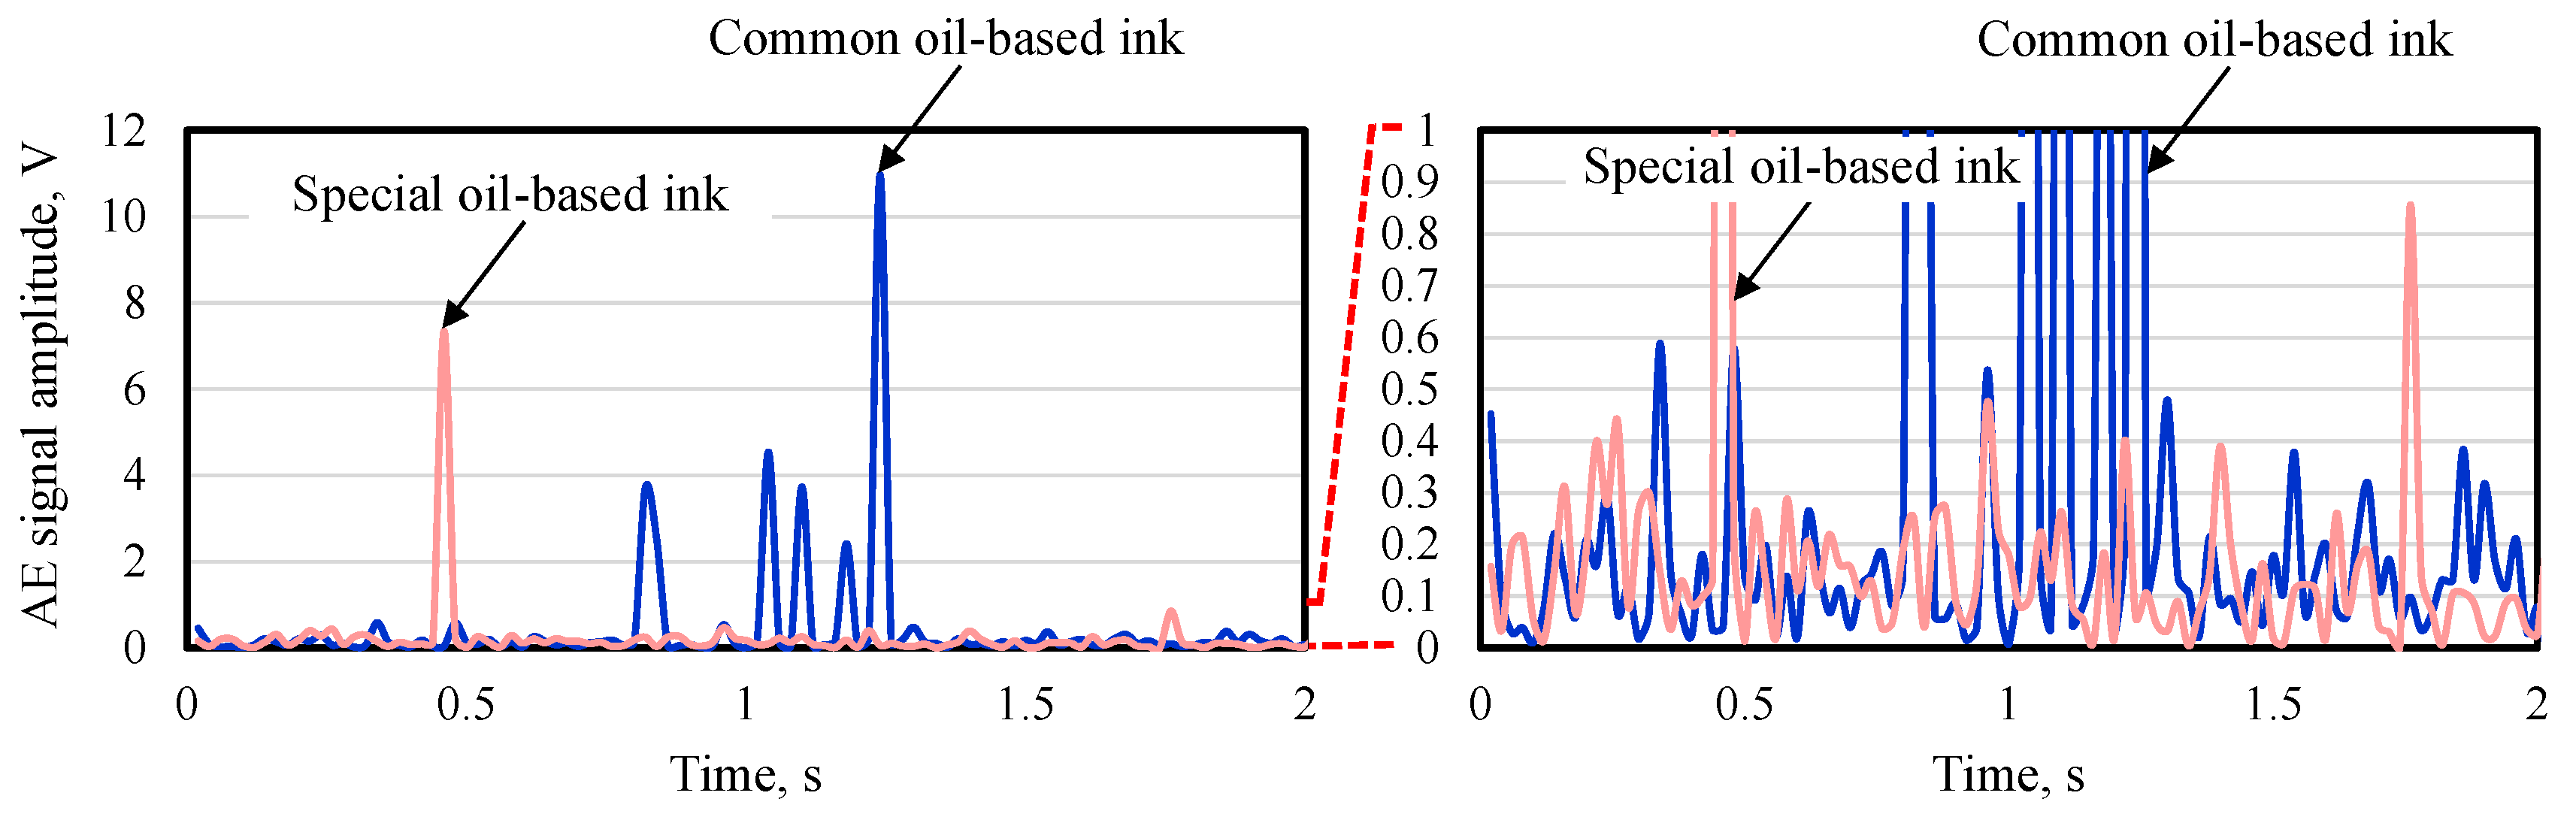
3.1. Change in AE Signal Amplitude during Writing with a Ballpoint Pen
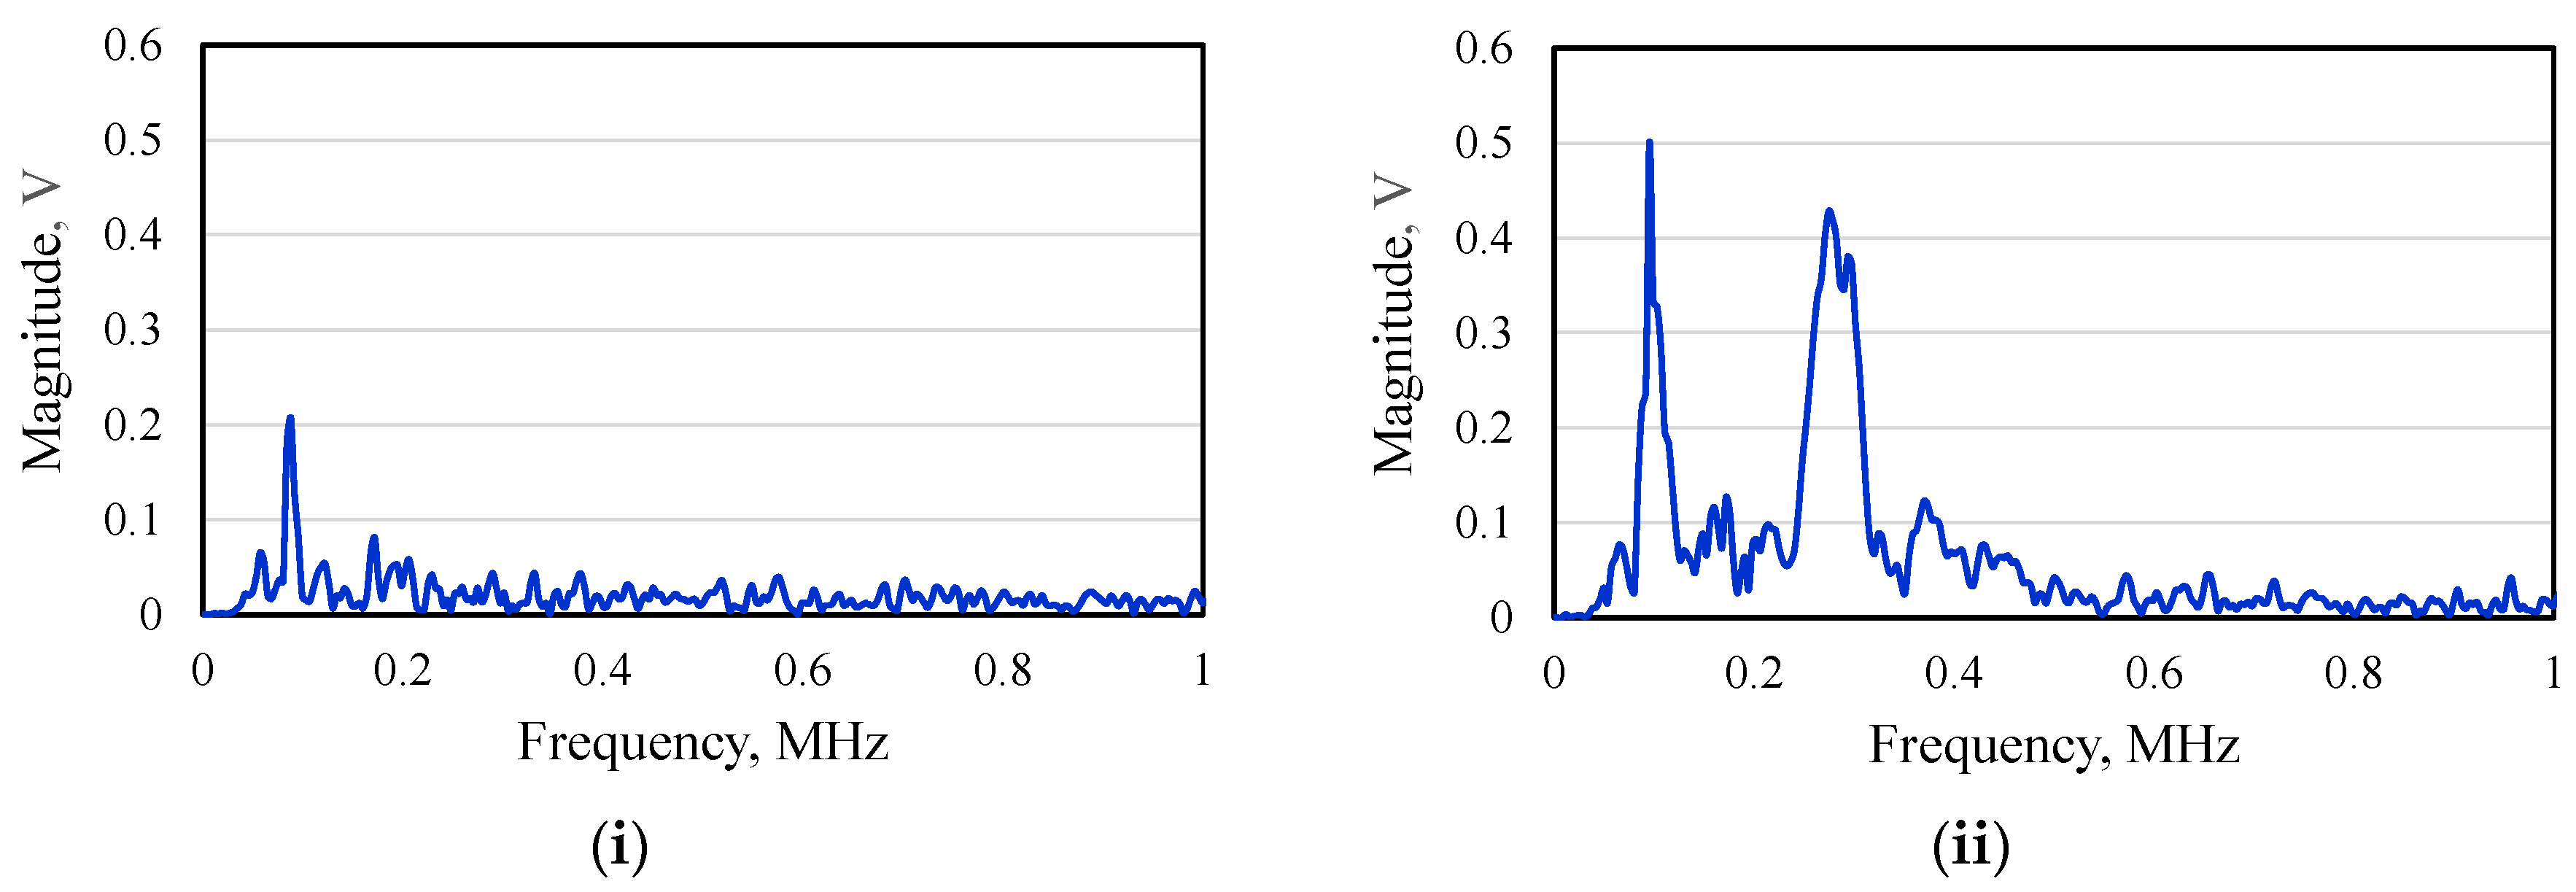
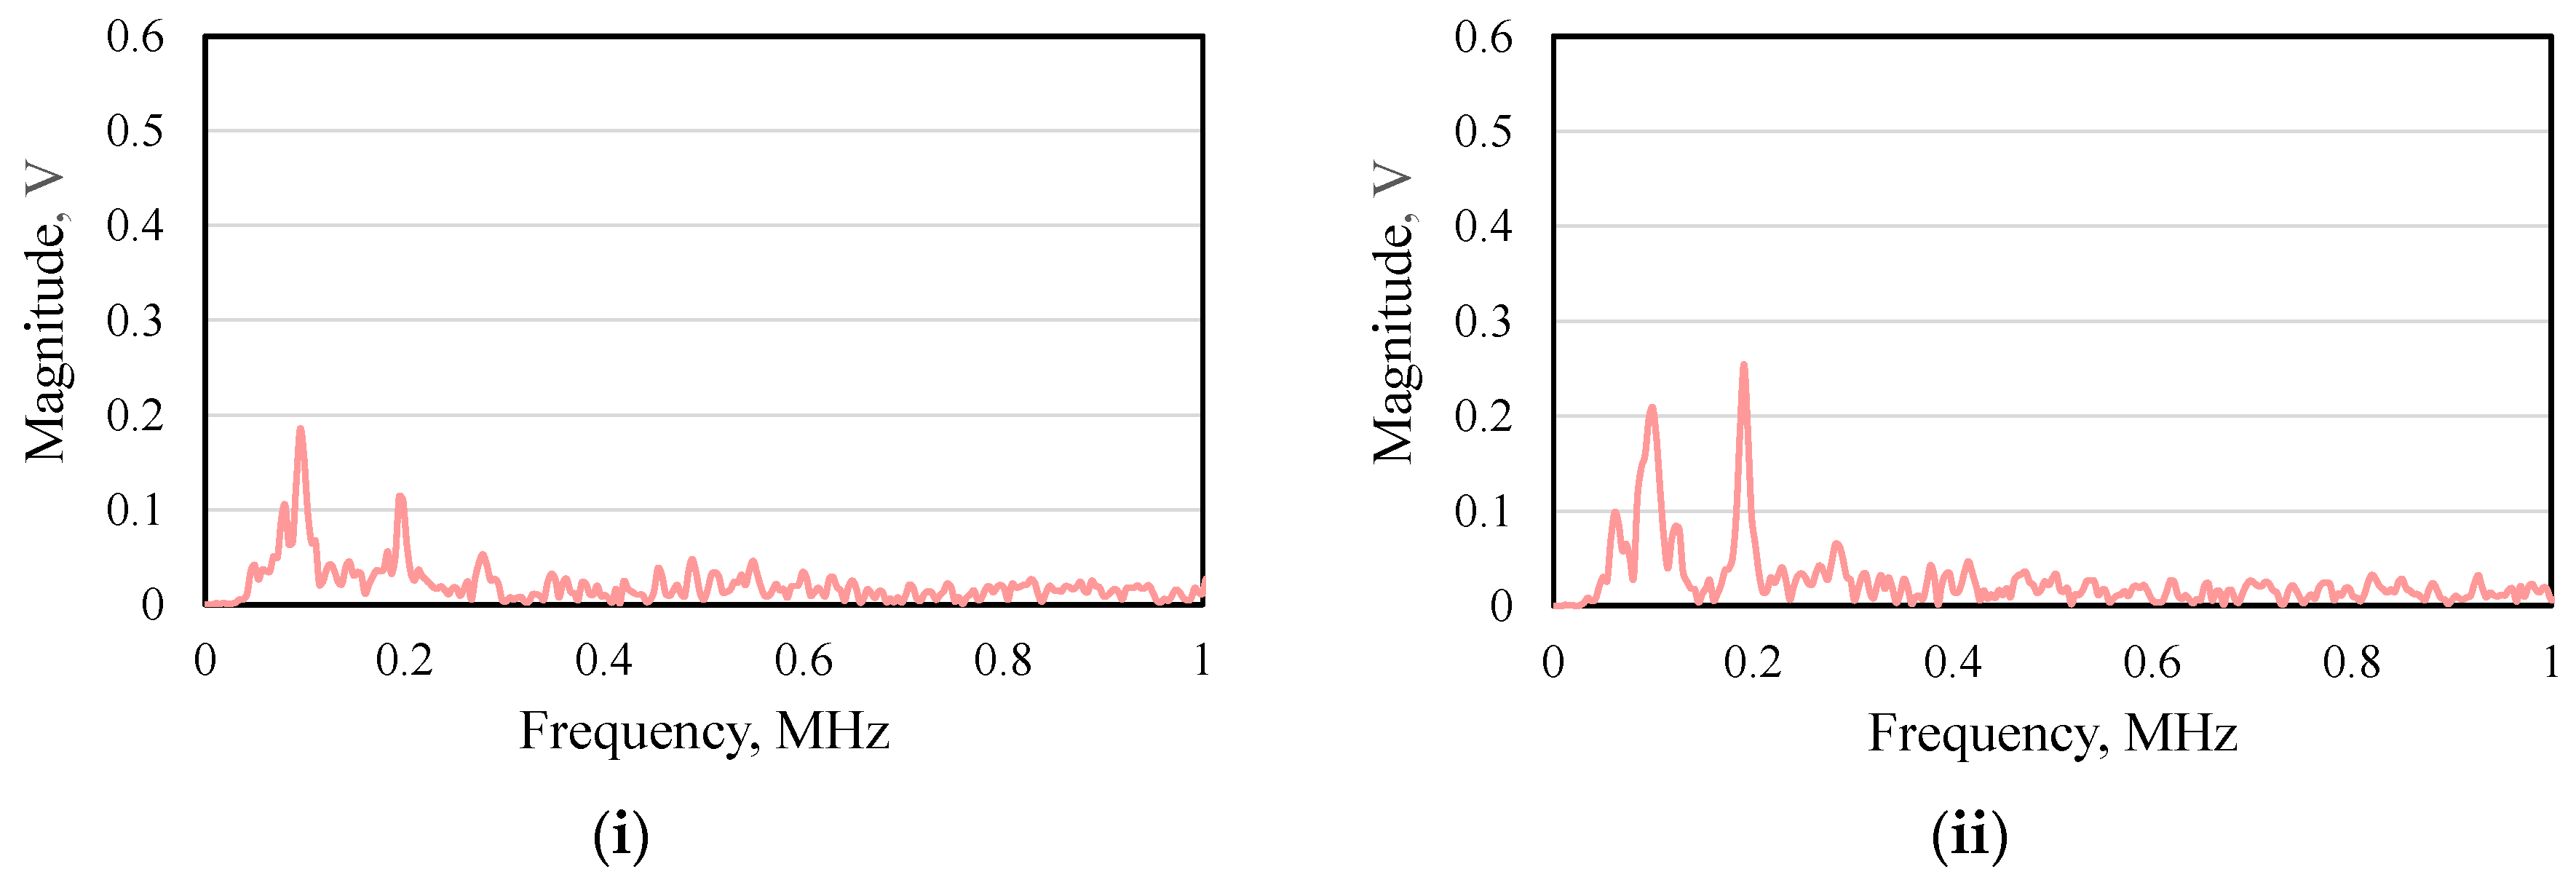
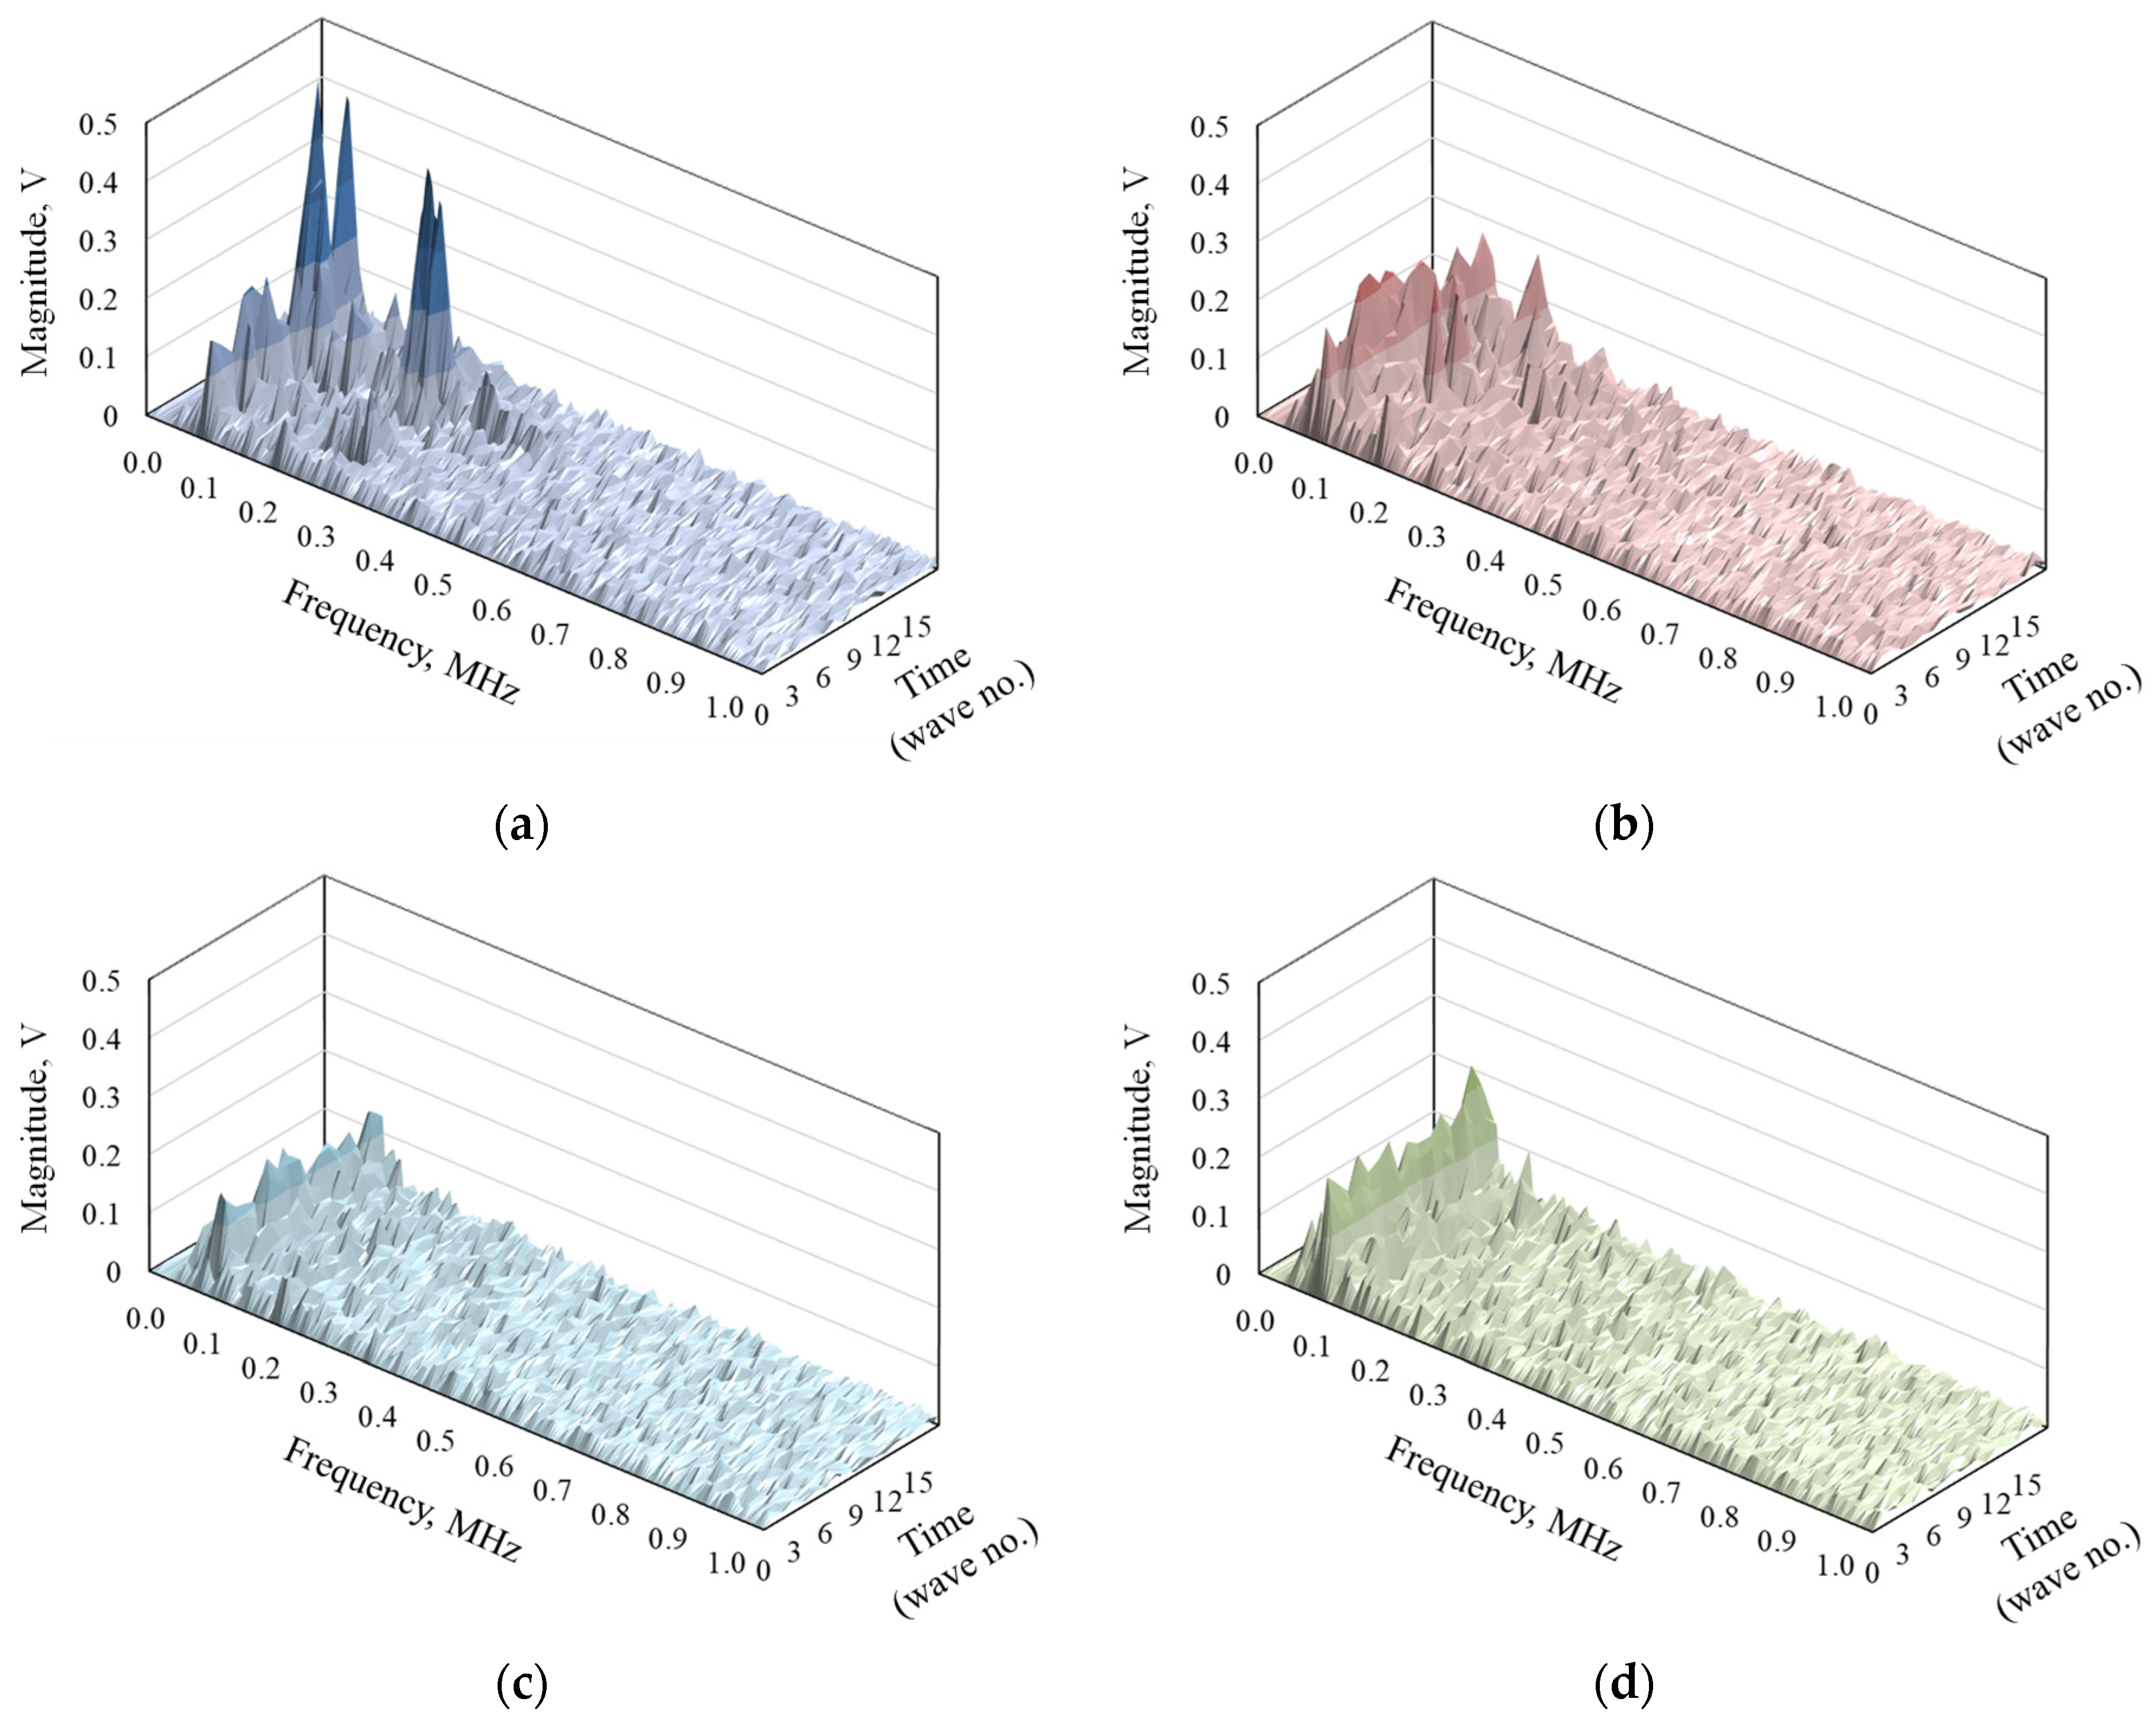
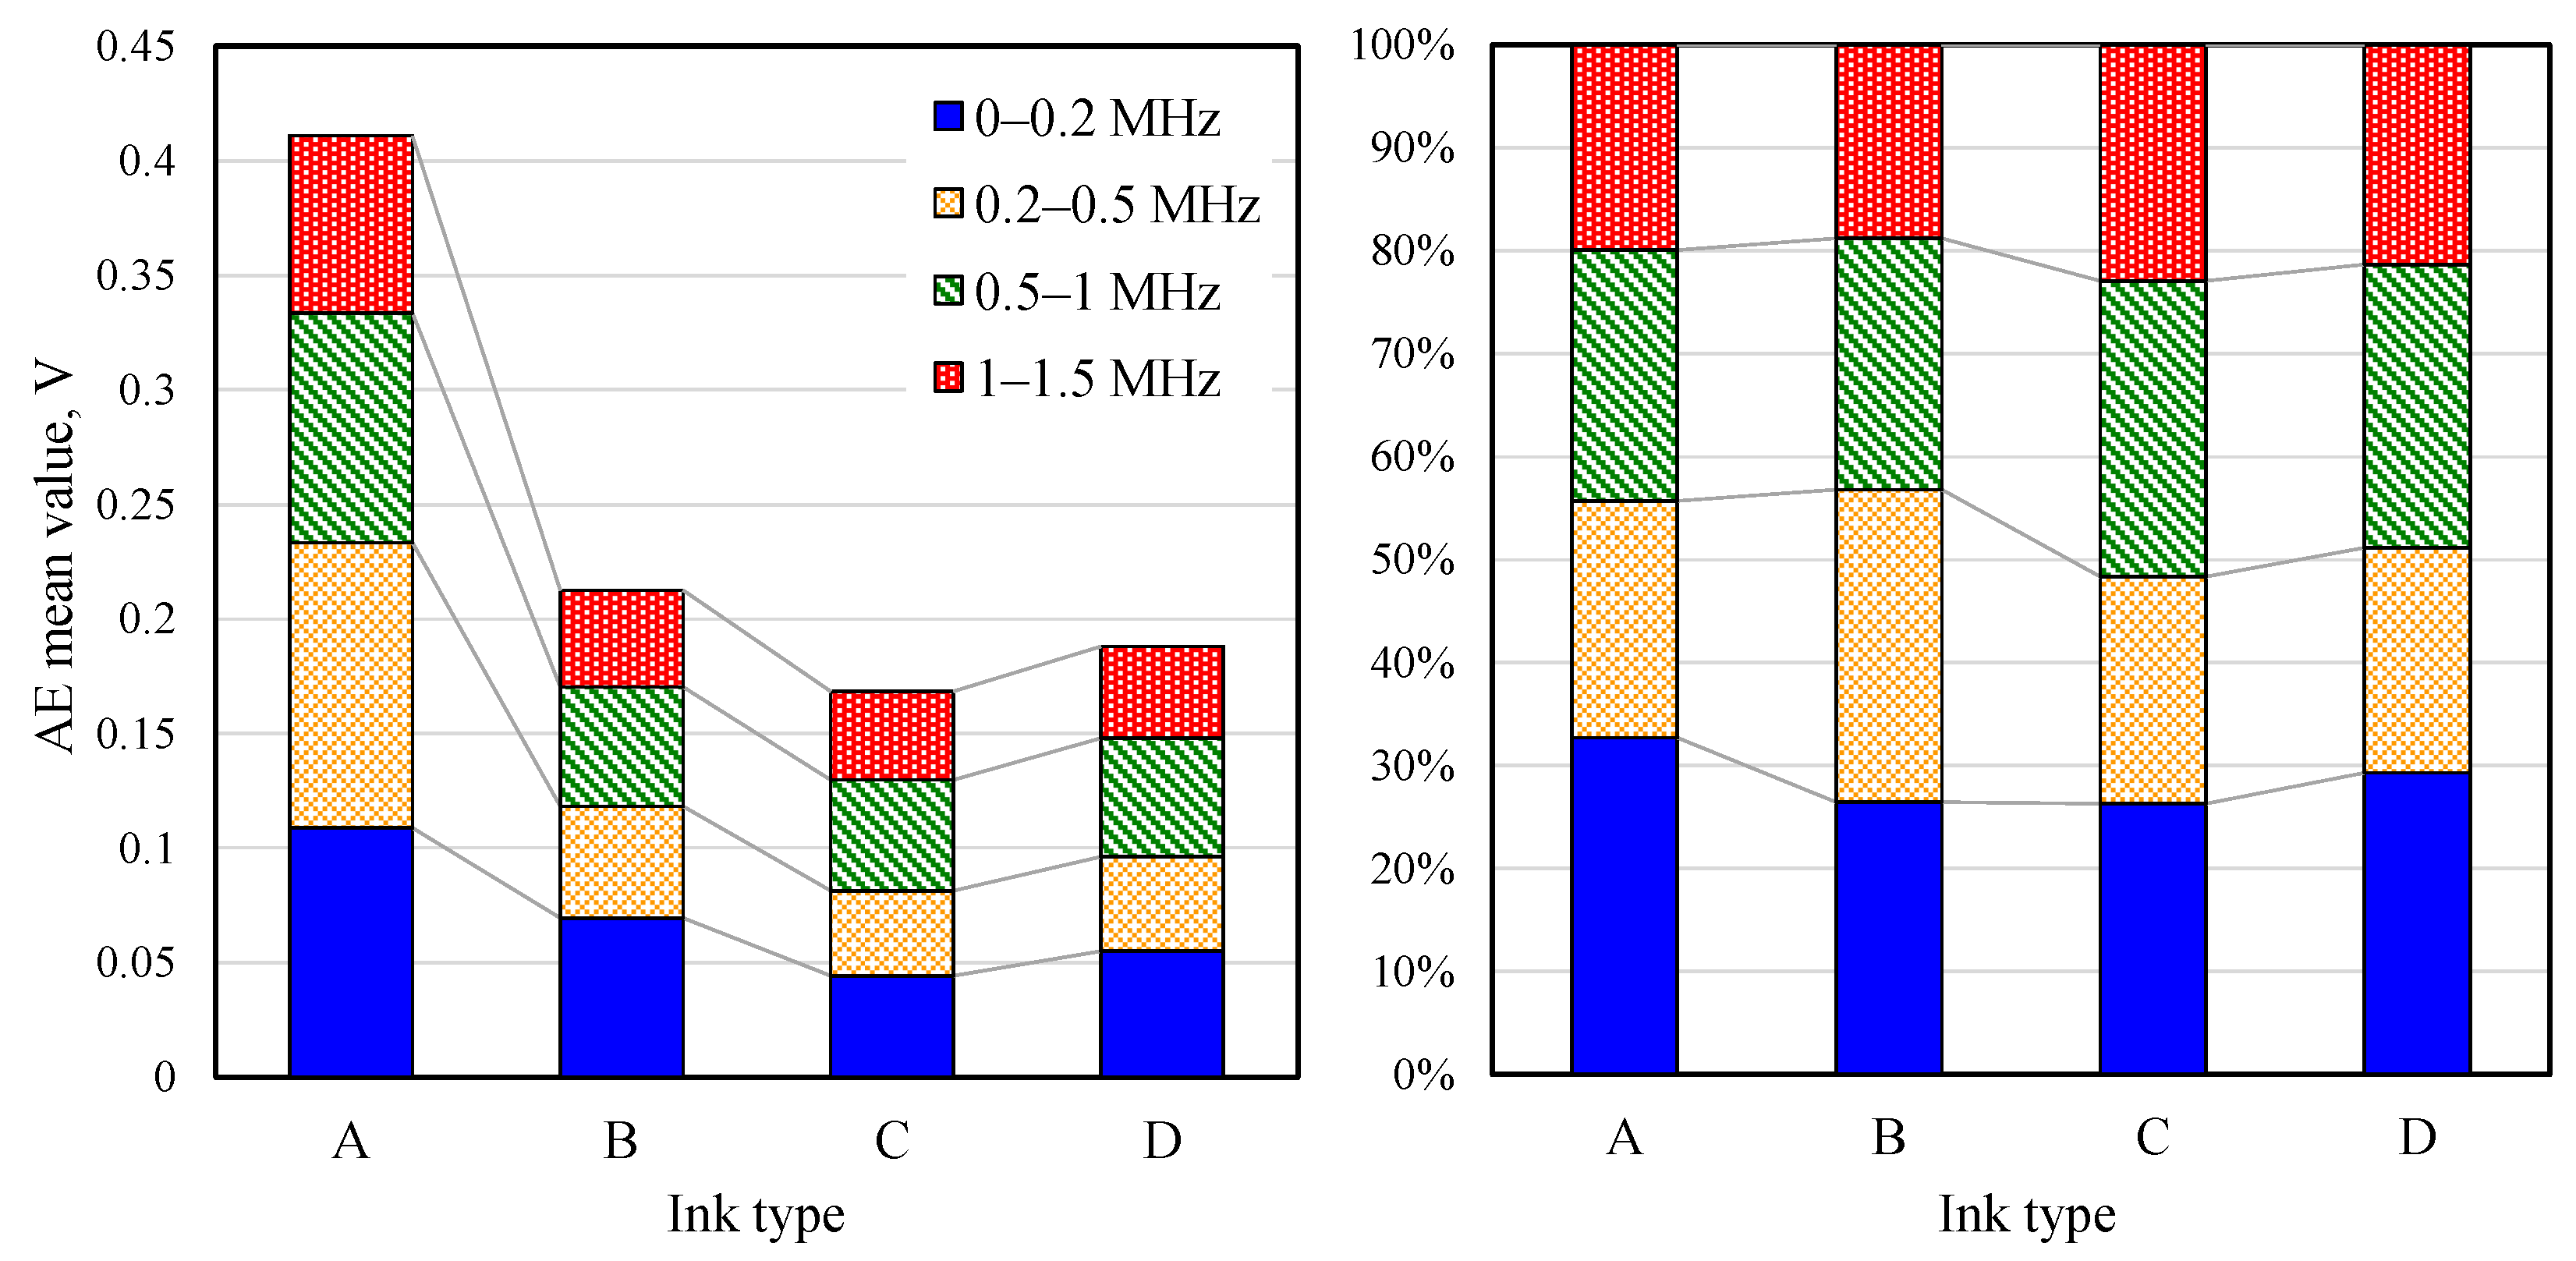
3.2. Changes in AE Signal Frequency Depending on the Type of Ink
3.3. Evaluation of Writing Performance of Ballpoint Pens by AE Sensing
4. Conclusions
- (1)
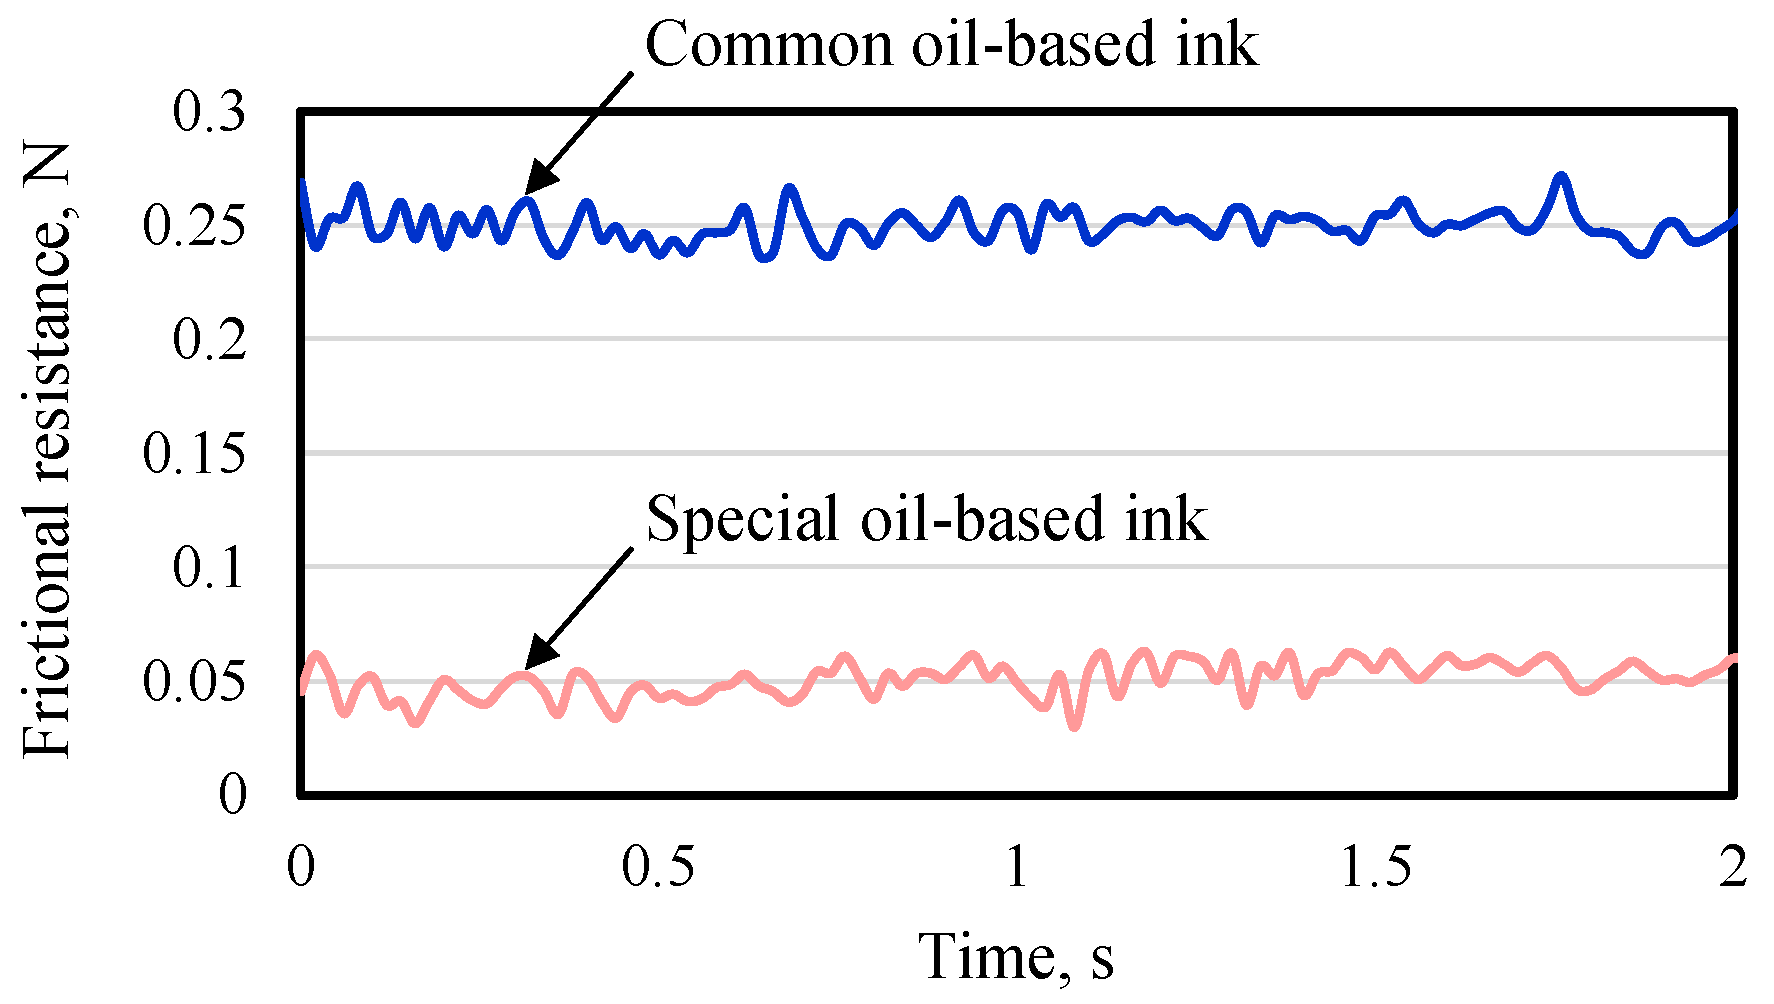
- AE sensing can capture the tribological phenomena that occur in the tip of a ballpoint pen during writing with higher sensitivity than by measuring the frictional resistance.
- (2)
- Large frequency peaks were confirmed around 0.1 to 0.2 MHz (low-frequency region) when writing was stable, and around 0.2 to 0.4 MHz (medium-frequency region) when writing was unstable.
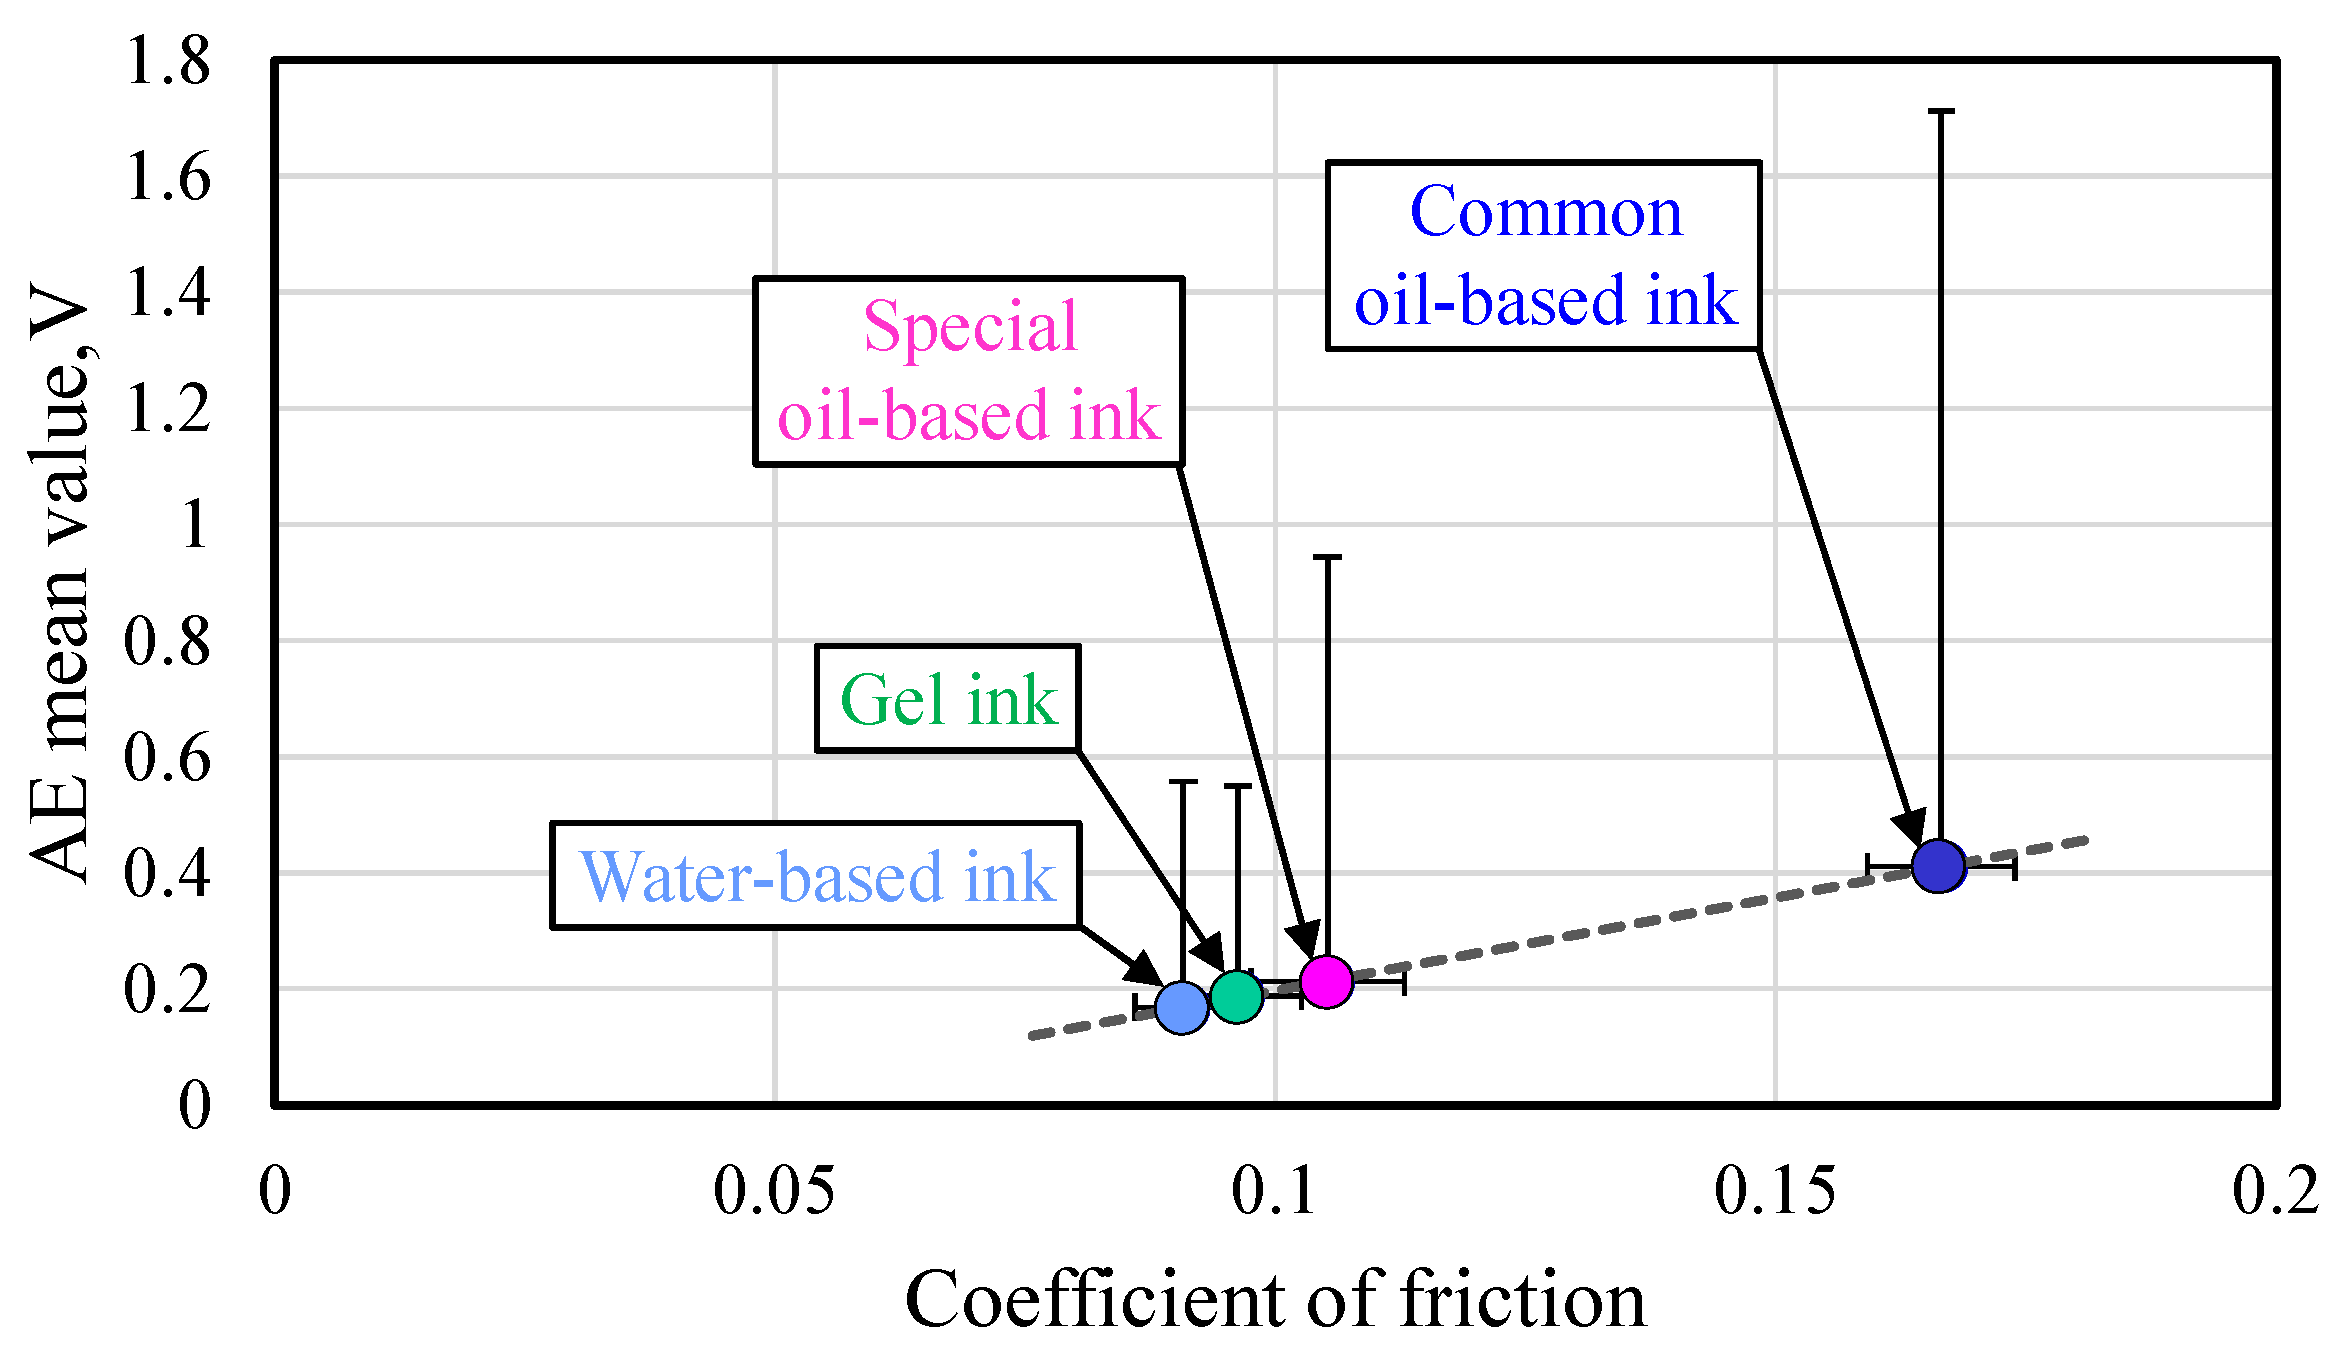
- (3)
- A correlation between the AE signal amplitude and the coefficient of friction, which involves both sliding friction and rolling friction between the ball and the paper, was found.
- (4)
- It is possible to evaluate and interpret the differences in writing performance depending on the ink type of a ballpoint pen from not only the changes in the AE signal amplitude but also the ratio of the AE signal frequency component.
Funding
Data Availability Statement
Acknowledgments
Conflicts of Interest
References
- Ichikawa, S. Recent Trends in Ballpoint Pen Ink. J. Jpn. Soc. Colour Mater. 2019, 92, 329–335. [Google Scholar] [CrossRef]
- Goonetilleke, R.S.; Hoffmann, E.R.; Luximon, A. Effects of pen design on drawing and writing performance. Appl. Ergon. 2009, 40, 292–301. [Google Scholar] [CrossRef] [PubMed] [Green Version]
- Kim, K.; Proctor, R.W.; Salvendy, G. Emotional factors and physical properties of ballpoint pens that affect user satisfaction: Implications for pen and stylus design. Appl. Ergon. 2020, 85, 103067. [Google Scholar] [CrossRef] [PubMed]
- Isokane, M.; Tadokoro, C.; Sasaki, S.; Prakash, B. Influence of Ink Composition on Tribological Properties of Ballpoint Pen. Tribol. Online 2017, 12, 257–261. [Google Scholar] [CrossRef] [Green Version]
- Chigira, Y.; Fujii, Y.; Valera, J.D.R. Direct measurement of friction acting between a ballpoint pen and a paper. SICE 2004 Annu. Conf. 2004, 2, 1518–1521. [Google Scholar]
- Okuo, H.; Asahi, T.; Onoue, T.; Osaka, T. Nano-Tribological Study on the Smoothness of Writing with a Ball-Point Pen Using Friction Force Microscopy. Bull. Chem. Soc. Jpn. 2006, 79, 149–153. [Google Scholar] [CrossRef]
- Geng, Z.; Puhan, D.; Reddyhoff, T. Using acoustic emission to characterize friction and wear in dry sliding steel contacts. Tribol. Int. 2019, 134, 394–407. [Google Scholar] [CrossRef] [Green Version]
- Revill, P.; Clarke, A.; Pullin, R.; Dennis, G. Acoustic emission monitoring of wear in aerospace self-lubricating bearing liner materials. Wear 2021, 486–487, 204102. [Google Scholar] [CrossRef]
- Renhart, P.; Maier, M.; Strablegg, C.; Summer, F.; Grün, F.; Eder, A. Monitoring Tribological Events by Acoustic Emission Measurements for Bearing Contacts. Lubricants 2021, 9, 109. [Google Scholar] [CrossRef]
- Hase, A.; Sato, Y.; Shinohara, K.; Arai, K. Identification of the Wear Process of a Silver-Plating Layer by Dual Acoustic Emission Sensing. Coatings 2021, 11, 737. [Google Scholar] [CrossRef]
- Yuki, H.; Honjo, Y. Evaluation of the Tone of Lines in Manual Drafting with a Pencil by Acoustic Emission Measurement. In Proceedings of the International Conference on Advanced Technology in Experimental Mechanics, Toyohashi, Japan, 4–8 October 2015; p. 92. [Google Scholar]
- Hase, A.; Wada, M.; Mishina, H. Acoustic Emission Signals and Wear Phenomena on Severe-Mild Wear Transition. Tribol. Online 2008, 3, 298–303. [Google Scholar] [CrossRef] [Green Version]
- Hase, A. Early Detection and Identification of Fatigue Damage in Thrust Ball Bearings by an Acoustic Emission Technique. Lubricants 2020, 8, 37. [Google Scholar] [CrossRef] [Green Version]
- Boness, R.J.; McBride, S.L. Adhesive and Abrasive Wear Studies Using Acoustic Emission Techniques. Wear 1991, 149, 41–53. [Google Scholar] [CrossRef]
- Hase, A.; Mishina, H.; Wada, M. Correlation between Features of Acoustic Emission Signals and Mechanical Wear Mechanisms. Wear 2012, 292–293, 144–150. [Google Scholar] [CrossRef]
- Soutome, T. Precision Machining on Ball Point Pen—A Trial for Nanometer Tip Machining. J. Jpn. Soc. Precis. Eng. 2007, 73, 23–27. [Google Scholar] [CrossRef]


| AE Sensor (Frequency Band) | Wideband-type (0.5–4.0 MHz) |
| AE Amplification Factor | 100 dB |
| AE Band-Pass Filter | High-pass filter: 50 kHz Low-pass filter: through |
Publisher’s Note: MDPI stays neutral with regard to jurisdictional claims in published maps and institutional affiliations. |
© 2022 by the author. Licensee MDPI, Basel, Switzerland. This article is an open access article distributed under the terms and conditions of the Creative Commons Attribution (CC BY) license (https://creativecommons.org/licenses/by/4.0/).
Share and Cite
Hase, A. Evaluation of Writing Performance for Different Types of Ballpoint Pen Ink by Acoustic Emission Sensing. Lubricants 2022, 10, 44. https://doi.org/10.3390/lubricants10030044
Hase A. Evaluation of Writing Performance for Different Types of Ballpoint Pen Ink by Acoustic Emission Sensing. Lubricants. 2022; 10(3):44. https://doi.org/10.3390/lubricants10030044
Chicago/Turabian StyleHase, Alan. 2022. "Evaluation of Writing Performance for Different Types of Ballpoint Pen Ink by Acoustic Emission Sensing" Lubricants 10, no. 3: 44. https://doi.org/10.3390/lubricants10030044