1. Introduction
Solutions have long been sought to improve material properties such as abrasion resistance, hardness, and friction. Improved material properties extend the service life of specific units and, consequently, the whole machine, reducing the need for new parts, repairs, and thus unnecessary energy consumption. Methods to improve machine parts and assemblies have varied from different heat treatments [
1,
2,
3,
4] to applying coatings with different complicities [
5,
6,
7,
8].
Different nanocoatings are used to improve the base material’s characteristics of traditional bulk materials in such sectors as electronic components, aeronautics, medical equipment, industrial manufacturing, transportation, and others. It is well known that nanocoatings can be deposited by different methods [
9]. Among them, PVD technologies are one of the most promising methods because they allow obtaining highly dense nanostructured ceramic coatings with smooth surfaces, i.e., low RMS (Root mean square) value, thus increasing the tribological properties of the material. The advanced PVD technique has been used in this research work, denoted here as the High-Power Ion-Plasma Magnetron Sputtering (HiPIPMS). To overcome multiple tribological and mechanical limitations mentioned by a few researchers [
10,
11,
12,
13,
14], a novel approach based on modified 3-phase non-stoichiometric carbonitride/nitride films in this study will be used. NSC based on carbonitride/nitride constituents (denoted here {-CN/-N}) would theoretically be harder even than diamond-type coatings if they could be deposited in the same structure as Si
3N
4, i.e., C
3N
4. Some specific carbonitride/nitride coatings produced and reported up to now have shown extreme elastic and tribological properties [
15,
16] combined with relatively high hardness values in the range of about 20–60 GPa. Therefore, the research strategy was based on modified non-stoichiometric NSC based on {TiMe
1Me
2-CN/TiAlSi-N}
n where ‘Me
1 and Me
2′ denote alloying metallic additives as Cr, Nb, W, and Zr, but subscript ‘n’ indicates a number of periods within the NSC containing alternating {carbonitride/nitride} sublayers. Thus, the goal was to achieve a novel solution to sufficiently reduce or even eliminate well-known disadvantages of the hard pure carbon-based or nitride-based coatings, i.e., inherent compressive macro-stresses, not-good-enough adhesion to steel workpieces, and reduced thermal stability due to the denitrification of coatings.
Another aspect is the quality of the working surface of the parts, its complete characterization, and its impact on the tribological and mechanical properties. Given the current state of technology, it is already known that 3D texture measurements should be used instead of 2D for more accurate surface characterization. Wang et al. [
17] presented a study on surface roughness, which was evaluated using a 2D and 3D profiling approach. These results proved that 3D surface texture parameters such as Sa (Arithmetical mean height) and Sq (Root mean square height) are more accurate in describing the surface quality than the corresponding 2D parameters—Ra (Arithmetical mean height of the profile) and Rz (Maximum height of profile). Additionally, the standard error of 3D surface texture parameters is lower than that of 2D parameters. Similar results were obtained by Deleanu et al. [
18] by analyzing 2D and 3D surface texture parameters for both metal and polymer blocks. The standard error for 2D surface texture parameters was more significant than for 3D parameters in all cases. Moreover, the use of focus-variation microscopy [
19] to acquire 3D surface characteristics and evaluate the surface quality of laser cut edges using areal surface roughness parameters (parameters Sa and S10z (height of the 10 points of the surface)) has shown the reliability of the standard 2D texture parameters is low. In one more paper [
20], it was stated that the 3D approach choosing five 3D surface texture parameters, such as Sds (Density of peaks), Sdq (Root mean square gradient), Ssc (Arithmetic mean summit curvature), and Sdr (Developed interfacial area ratio), describes operational surfaces more precisely than the 2D approach.
Several studies are known to investigate a correlation between surface texture and friction-wear characteristics. Menezes et al. [
21] analyzed the effect of surface texture on hardness and friction during unidirectional sliding, concluding that the friction coefficient (CoF) predominantly depends on the hardest surface texture. It was pointed out [
22] that the basic amplitude parameters commonly used to describe tribological characteristics are insufficient to determine the tribological properties of contact surfaces. Therefore, other surface topography parameters should be used to describe the tribological properties of the friction pairs. Pawlus et al. [
23] performed a pervasive analysis of the functional importance of surface texture parameters, taking into account the parameters listed in ISO 25178. Pawlus concluded that most surface texture parameters are related to friction and wear; however, it is vital to know the application of friction pair. Amplitude parameters are most commonly used and are related to friction, lubrication, and wear. Skewness Ssk and kurtosis Sku characterizes the shape of the height distribution. Negative skewness typically improves the contact of rough surfaces. The hybrid parameters are more related to the rough surfaces of the contacts. Correspondingly, the parameters related to the material ratio curve or functional parameters are also related to friction and wear, but the main problem is the selection of groups of parameters that describe the material ratio curve. Surface texture parameters to describe surfaces obtained by grinding, lapping, and electrochemical machining processes were, by importance, classified by Kacalak et al. [
24]. Both the parameters listed in the standard ISO 25178 and the feature parameters introduced by the author were used, obtaining that the feature parameters S5p (Five-point peak height), S10z, and height parameters (Sp (Maximum peak height), Sv (Maximum pit height), Sa, Sq) indicate a high ability to distinguish characteristic surface features. In Zak et al. [
25], the surface textures produced by different machining operations were analyzed regarding their potential functionality: the parameters Sa, Ssk (Skewness), Spk (Reduced peak height), Vmp (Peak material volume), and Vvv (Pit void volume) showed a strong correlation with fluid retention abilities and tribological properties. Jansons et al. [
17] concluded that from four surface 3D surface texture parameters (Sa, Ssk, Sds, Sdq), the Sa is the most useful for ice friction surface characterization. Das et al. [
26] analyzed a systematic and appropriate selection of surface roughness parameters for extruded and ground surfaces that could act as process monitoring indices. It was obtained that the 3D parameter ratio Spk/Sk can be used to define the surface lay. Another option may be a combination of skewness and kurtosis to define the shape of the profile to determine the oil retention capacity. Ratios Spk/Sk, Svk/Sk, and Spk/Svk can be used to measure load-carrying capacity.
In light of the known literature, it can be concluded that extensive work has been undertaken in recent years to find the correlation dependence between the 3D surface texture parameters and the tribological properties of the material. However, surfaces with treatment traces from machining and relatively high surface roughness are primarily analyzed (see
Table 1). However, no correlation between surface texture and tribological properties has been sought for coatings with relatively small surface roughness (Sa below 0.015 µm).
If the correlation between the surface texture parameters of different friction pairs and the friction properties has been studied in the works of several authors, then the correlation between hardness and surface texture is considered less frequently. That may be related to the technological provision, i.e., when measuring the hardness of the material with a sufficiently high load (using the most popular methods of measuring the hardness of the material, for example, Brinell, Vickers, Rockwell), surface irregularities do not noticeably affect the measurement result. Hardness measurement methods such as microhardness and nanohardness should be used to analyze surface texture’s effect on hardness.
When measuring microhardness or nanohardness, the effect of surface texture can be significant to the measurement result. Bohme et al. [
30] studied microhardness measurements of stainless steel samples on a milled (Ra 125–240 nm) and polished surface (Ra 2–3 nm). Indentation measurements for the milled samples indicated a scatter of the measurement results, although the hardness should not change. If the indentation is made in a valley, the material appears harder, but if the indentation is made on a peak, it appears softer. Therefore, in order to be able to analyze the microhardness results, the surface texture must be measured at the point of indentation. The sample’s surface must also be prepared as smoothly as possible for qualitative microhardness measurements. Microhardness measurements on a milled surface indicated an error of at least 40%, while the error did not exceed 8% on a polished surface.
The surface must be even smoother if the nano-indentation method is used. The thin film was deposited on a silicon wafer substrate, and cyclic nano-indentation to determine the mechanical properties of the coating on the surface (RMS 0.5 nm) was used in Plichta et al. [
31] work. The surface texture significantly affected the near-surface mechanical properties, and the measured values varied up to 100% compared to the actual value depending on the surface at the measurement position. Analyzing the nanohardness of Cu/Ni multilayer structures, Kulej et al. [
32] concluded that the hardness measurements results are related to the surface texture, i.e., a smoother surface provides higher nanohardness. Although some investigations concerning surface texture and micro or nanohardness have been done, the correlation between several 3D surface texture parameters and hardness measurements has not been reported yet in the known literature.
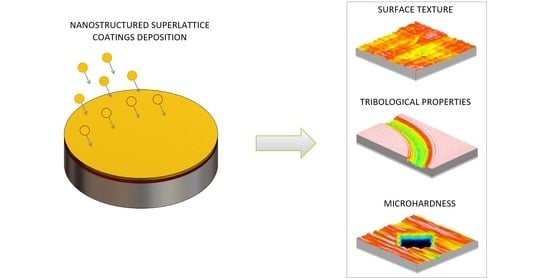
This work aims to analyze the correlation dependence between tribological and mechanical properties of the NSC and their surface texture parameters to determine how much surface texture will affect the tribological performance of the coated workpieces. This work stresses the measuring methods of the NSC and evaluation procedures of the obtained data rather than the coatings’ microstructure, morphology, and other physiochemical properties.
2. Materials and Methods
2.1. Preparation of the Samples
The NSC samples were deposited onto bearing steel disk-shaped substrates (∅30 × 4 mm) made of 100Cr6 using the HiPIPMS technique. The HiPIPMS was implemented on the Thin Film Modular Deposition System (TF-MDS) [
33,
34]. The TF-MDS had four cross-configured workstations equipped with magnetron sputtering devices (MSD), up to 8 MSDs altogether (
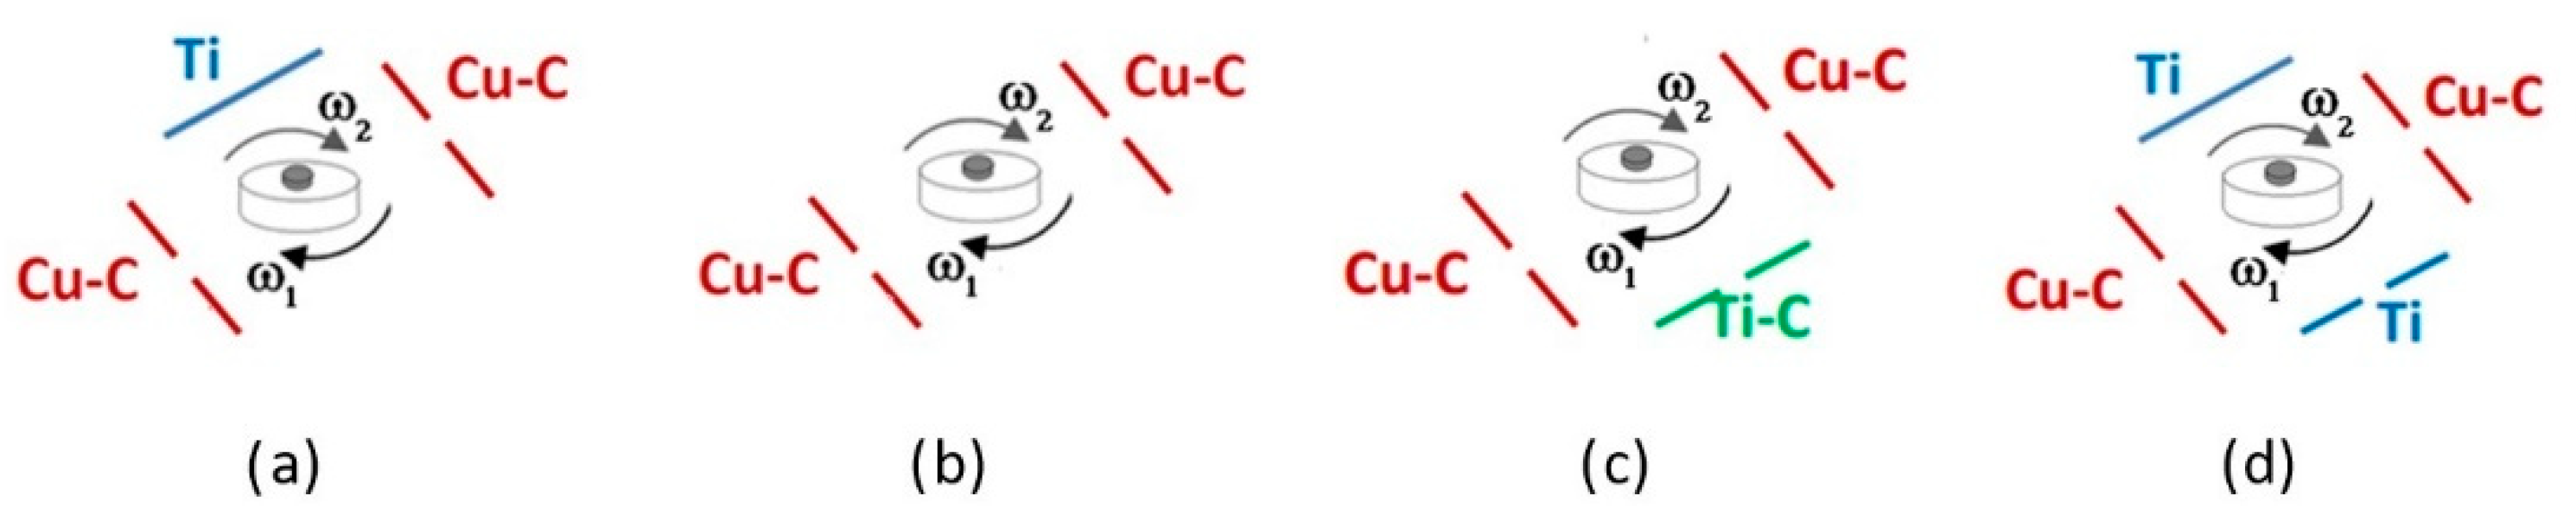
Figure 1). The cross-configuration of the workstations on the circumference inside the vacuum chamber allows numerous specific combinations of monolithic and mosaic-type magnetron sputtering targets (MST) mounted onto MDSs depending on the requested chemical composition of the NSC. MSDs were operated in the effective crossed-field unbalanced magnetron sputtering ion-plasma mode, providing a highly ionized plasma environment in the whole space between the MST and substrate-holder. Thus, immersed sputtering plasma mode was realized nearby of both surfaces of the MST and Substrate. The plasma environment within the MST-substrate space enhanced the chemical reactivity of the sputtered particles condensed on the substrate and activated carbonitride/nitride film growth. Sputter cleaning of the substrates was performed prior to film deposition by a collimated linear ion beam device which was also used for film growing activation and resputtering weakly accommodated particles during the film deposition process.
The PVD technologies applied for obtaining NSC samples and their modification are based on the modern design and engineering capabilities of the deposition system TF-MDS. The modular design of TF-MDS provides the possibility of simultaneous use of up to 8× MSDs where, in principle, each MSD can be mounted with the MST of a different material [
35,
36]. Therefore, the TF-MDS design allows flexibly modifying the technological parameters of the PVD process, the chemical composition of the obtained nanocomposite coating, and its physical-mechanical and electrophysical properties. For example, the material of which the MST is made and MSTs configuration in the vacuum chamber determine the structure of the coating layers and their chemical composition. In addition, the 1D and/or 2D rotation of the sample holder carousel determines the coating density and thickness uniformity. In turn, ion-plasma discharge power on the MSDs determines the film deposition rate and nanostructure at the atomic level (see
Figure 1).
The morphology of the coating structures was investigated using a scanning electron microscope (SEM) Tescan Lyra3 (Tescan, Brno, Czechia), equipped with an energy-dispersive X-ray spectrometer (EDS) Oxford Aztec (Oxford Instruments, Abingdon, UK). SEM and EDS measurements were performed using a beam-accelerating voltage of up to 30 kV and a beam current of 500 pA.
2.2. Tribology Tests
The tribology tests were performed to analyze the wear and friction coefficient using a ball-on-disc tribometer TRB3 (CSM Instruments, Needham Heights, MA, USA) under dry friction conditions. Samples were tested using a 100Cr6 (EN 683-17) steel ball (Ø6 mm). All tests were performed at room temperature 21 ± 1 °C. Experimental settings for friction and wear tests were based on recommendations in standard ISO 18535 (Diamond-like carbon films—Determination of friction and wear characteristics of Diamond-like carbon films by ball-on-disc method).
Friction tests were performed for 5000 cycles at a 3 mm tribo-track radius (100 m total distance) and 0.15 m/s linear speed. The normal load was set to 3 N.
For wear tests, the total number of cycles was increased to 1000 m total distance and 0.1 m/s linear speed. The normal load was set to 5 N. The wear track was measured in 8 positions at a constant angular distance using a Surftest SJ-500 (Mitutoyo, Kawasaki, Japan) surface roughness tester. Wear cross-sectional area was calculated using Talymap Gold analysis software, version 4.1.1.
2.3. Surface Texture Measurements
A Talysurf Intra 50 (Taylor Hobson, Leicester, UK) profilometer with a 112/2009 stylus (2 µm tip diameter) was used to characterize surface texture. The total area measured was 2 × 2 mm, including both the smooth part of the surface and the tribo-track part. The texture was measured from 300 profiles, with each profile line consisting of 10,000 points, for a total of 3,000,000 points per measurement.
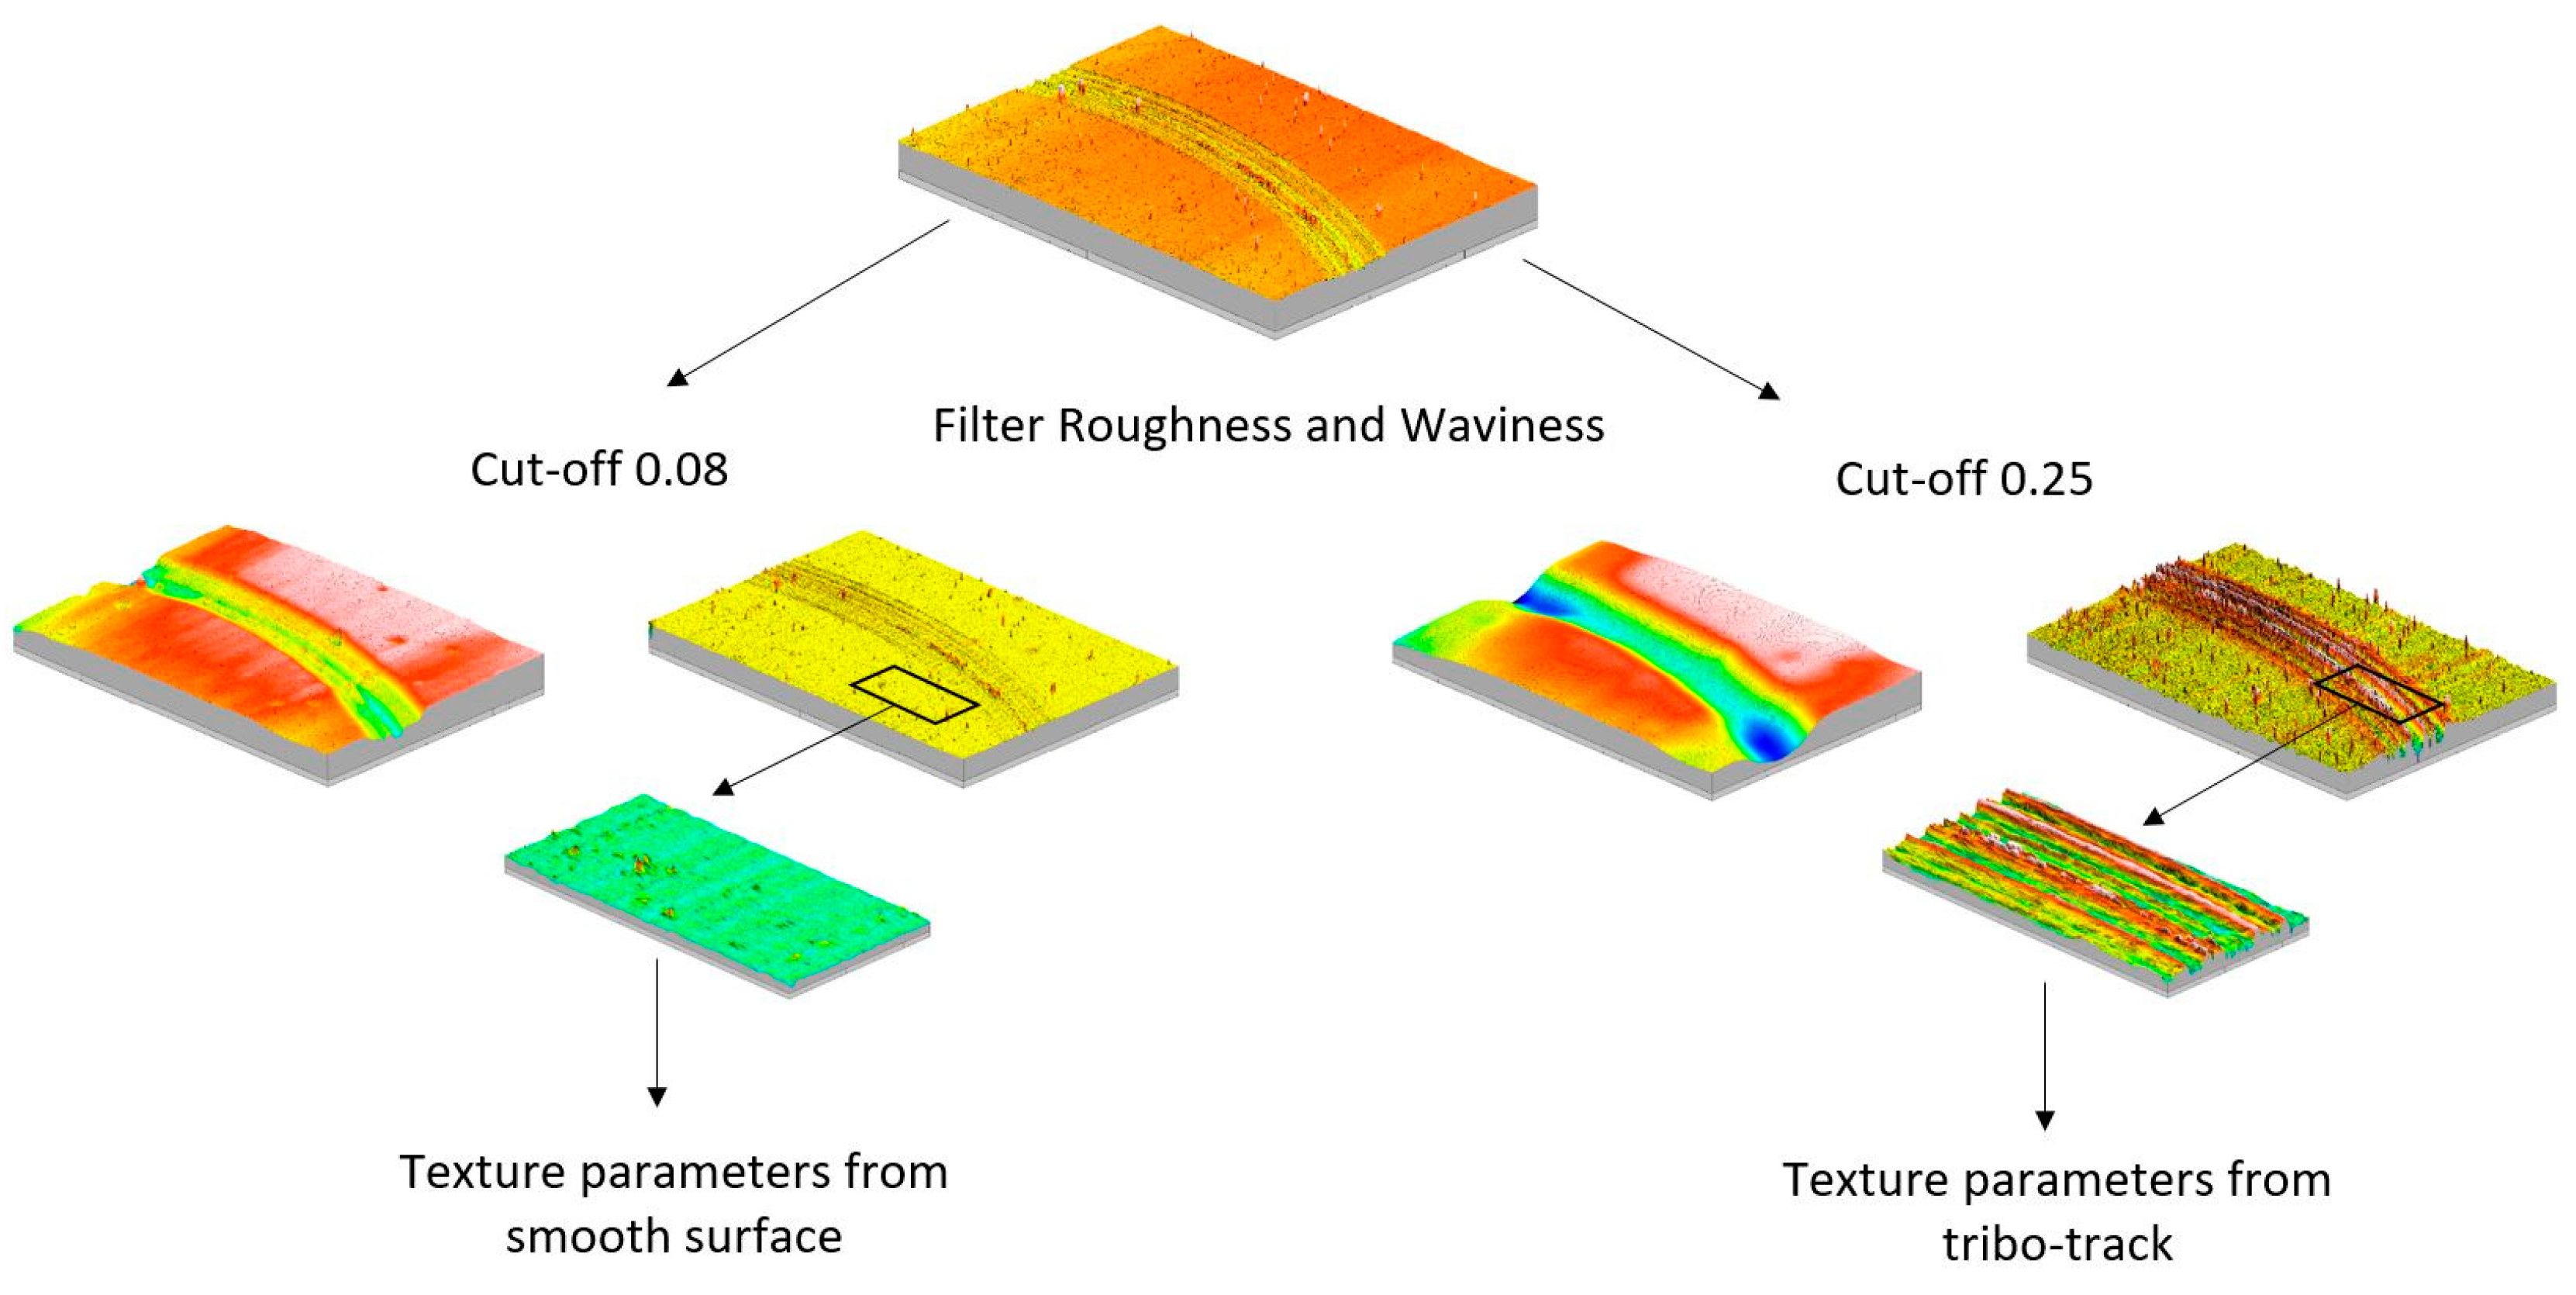
Data post-processing was performed with Talymap Expert software, version 3.2.0. Initially, the primary surface was leveled, followed by the separation of the surface roughness and the waviness portion (see
Figure 2). Smooth surface part and tribo-track part measurements were performed with a different cut-off based on the recommendations of standard ISO 25178-3. The cut-off value of 0.08 was used for the smooth surface part and 0.25 for the tribo-track surface part for all measured samples. The separated roughness was then zoomed in to the surface from the smooth or tribo-track area (200 × 500 µm), and 3D surface texture parameters were obtained.
The surface texture was measured for a total of 9 coated and for the reference sample. In total, 31 surface texture parameters (ISO 25178-2) and ratios [
23,
28] were considered in this work (see
Table 2). Three-dimensional surface texture parameters, for various reasons, do not indicate a significant difference between the measuring sample surfaces in the given case; for example, spatial parameter Std, which depends on the surface orientation during a measurement, was not considered. Moreover, the 3D surface texture parameters that require additional necessary information for performing a correct analysis, for example, the parameter Smr, or areal material ratio, which directly depends on the level from the highest peak, and related parameters such as Smc (inverse material ratio) were not considered.
In this analysis, parameters can be classified into four groups—Amplitude, Spatial, Hybrid, and Functional.
The most typical amplitude parameters which are used in surface characterization were considered. According to the literature [
23,
24,
26,
29,
37,
38], it is known that Sa, Sq, Sz, Sp, Sv affect surface contact, lubrication, friction, wear, as well as such parameters as Ssk, Sku, and ratios Sp/Sz, Sq/Sa, which characterize the shape of the height distribution. Sa and Sq parameters, usually used to characterize the surface texture, are not sufficient to characterize the tribological process of contacting surfaces. It was obtained that Sku and Ssk parameters showed a higher correlation with the wear process than Sa and Sq [
22]. In the boundary and mixed lubrication friction regimes, parameters Ssk and Sku impact friction [
39]. The pitch parameter Rsm and Rsm/Sa are included in the wear calculations [
40], and it has also been observed that the friction properties on the ice can be estimated [
28]. Rsm for each sample was calculated as an average from five separate profiles extracted from the measured 3D surface.
Spatial parameters Sal (Autocorrelation length) and Str (Texture aspect ratio) affect lubrication and friction [
23]. The Sds parameter is an important parameter used in bearings and seals because it is related to how surfaces deform elastically and plastically under load [
41]. The Sfd (Fractal dimension of the surface) parameter describes the complexity of the surface using the fractal dimension theory, thus indicating whether the surface is flat or complex, and Sfd correlates with Sds for the honed surfaces [
25].
The hybrid parameters, which combine information on height and spatial parameters, Sdq and Sdr, affect surface contact, friction, and wear properties. Sdq is highly dependent on Sq; accordingly, Sdr is dependent on Sdq. The Ssc parameter is used in contact mechanics to characterize the plastic deformation affecting the wear [
23].
The functional group of parameters related to the material ratio curve affects wear and friction [
23]. For example,
Vmc (Core material volume) is the most relevant parameter to characterize the rolling process [
38], or
Vvv and
Vvc (Core void volume) parameters are related to valleys of the surface, which reflect lubricant storage performance [
23,
42]. Moreover,
Vvv and
Vvc correlated with the friction coefficient of a rough contact interface [
29]. Parameters related to the material ratio curve were calculated using default material ratios of 10 and 80%.
2.4. Microhardness Measurements
Microindentation provided information about the integrated coating hardness, including the hardness of both Coating and the Substrate. Micro-Vickers indenter HM210D (Mitutoyo, Kawasaki, Japan) with complete CNC XY sample holding stage was used for the tests. Lenses with 50× and 100× magnification were used for indentation diagonals measurements. Complete CNC control over the sample holding stage provided semi-automatic sample testing with various indentation forces and a test matrix with evenly distributed distances between indentations.
Twelve different test forces were used for each sample from 0.1–6.0 N. Information about the integrated hardness is essential to understand the whole system (Coating + Substrate) usability in tribological applications because both components play a significant role in the final performance, i.e., hard coating on too soft substrate might fracture if the substrate surface bends. Thus, finding optimal combinations of coating hardness and substrate hardness is essential.
3. Results and Discussion
3.1. NSC Samples
All substrates are unique, as it is impossible to prepare them with identically polished surfaces. Therefore, ten samples are considered in the study—9 of them are coated with the NSC, and one is uncoated (see
Table 3). Each sample was studied tribologically and mechanically, as well as using electron microscopy and profilometry. Correlation dependence between the mechanical and tribological properties of the samples and the surface texture parameters was sought.
The Calo tester (CSM Instruments, Needham, MA, USA) and KH7700 optical microscope (Hirox, Tokyo, Japan) were used to measure the thickness of the coatings. The coating thickness was measured to be greater than 5200 nm for all samples.
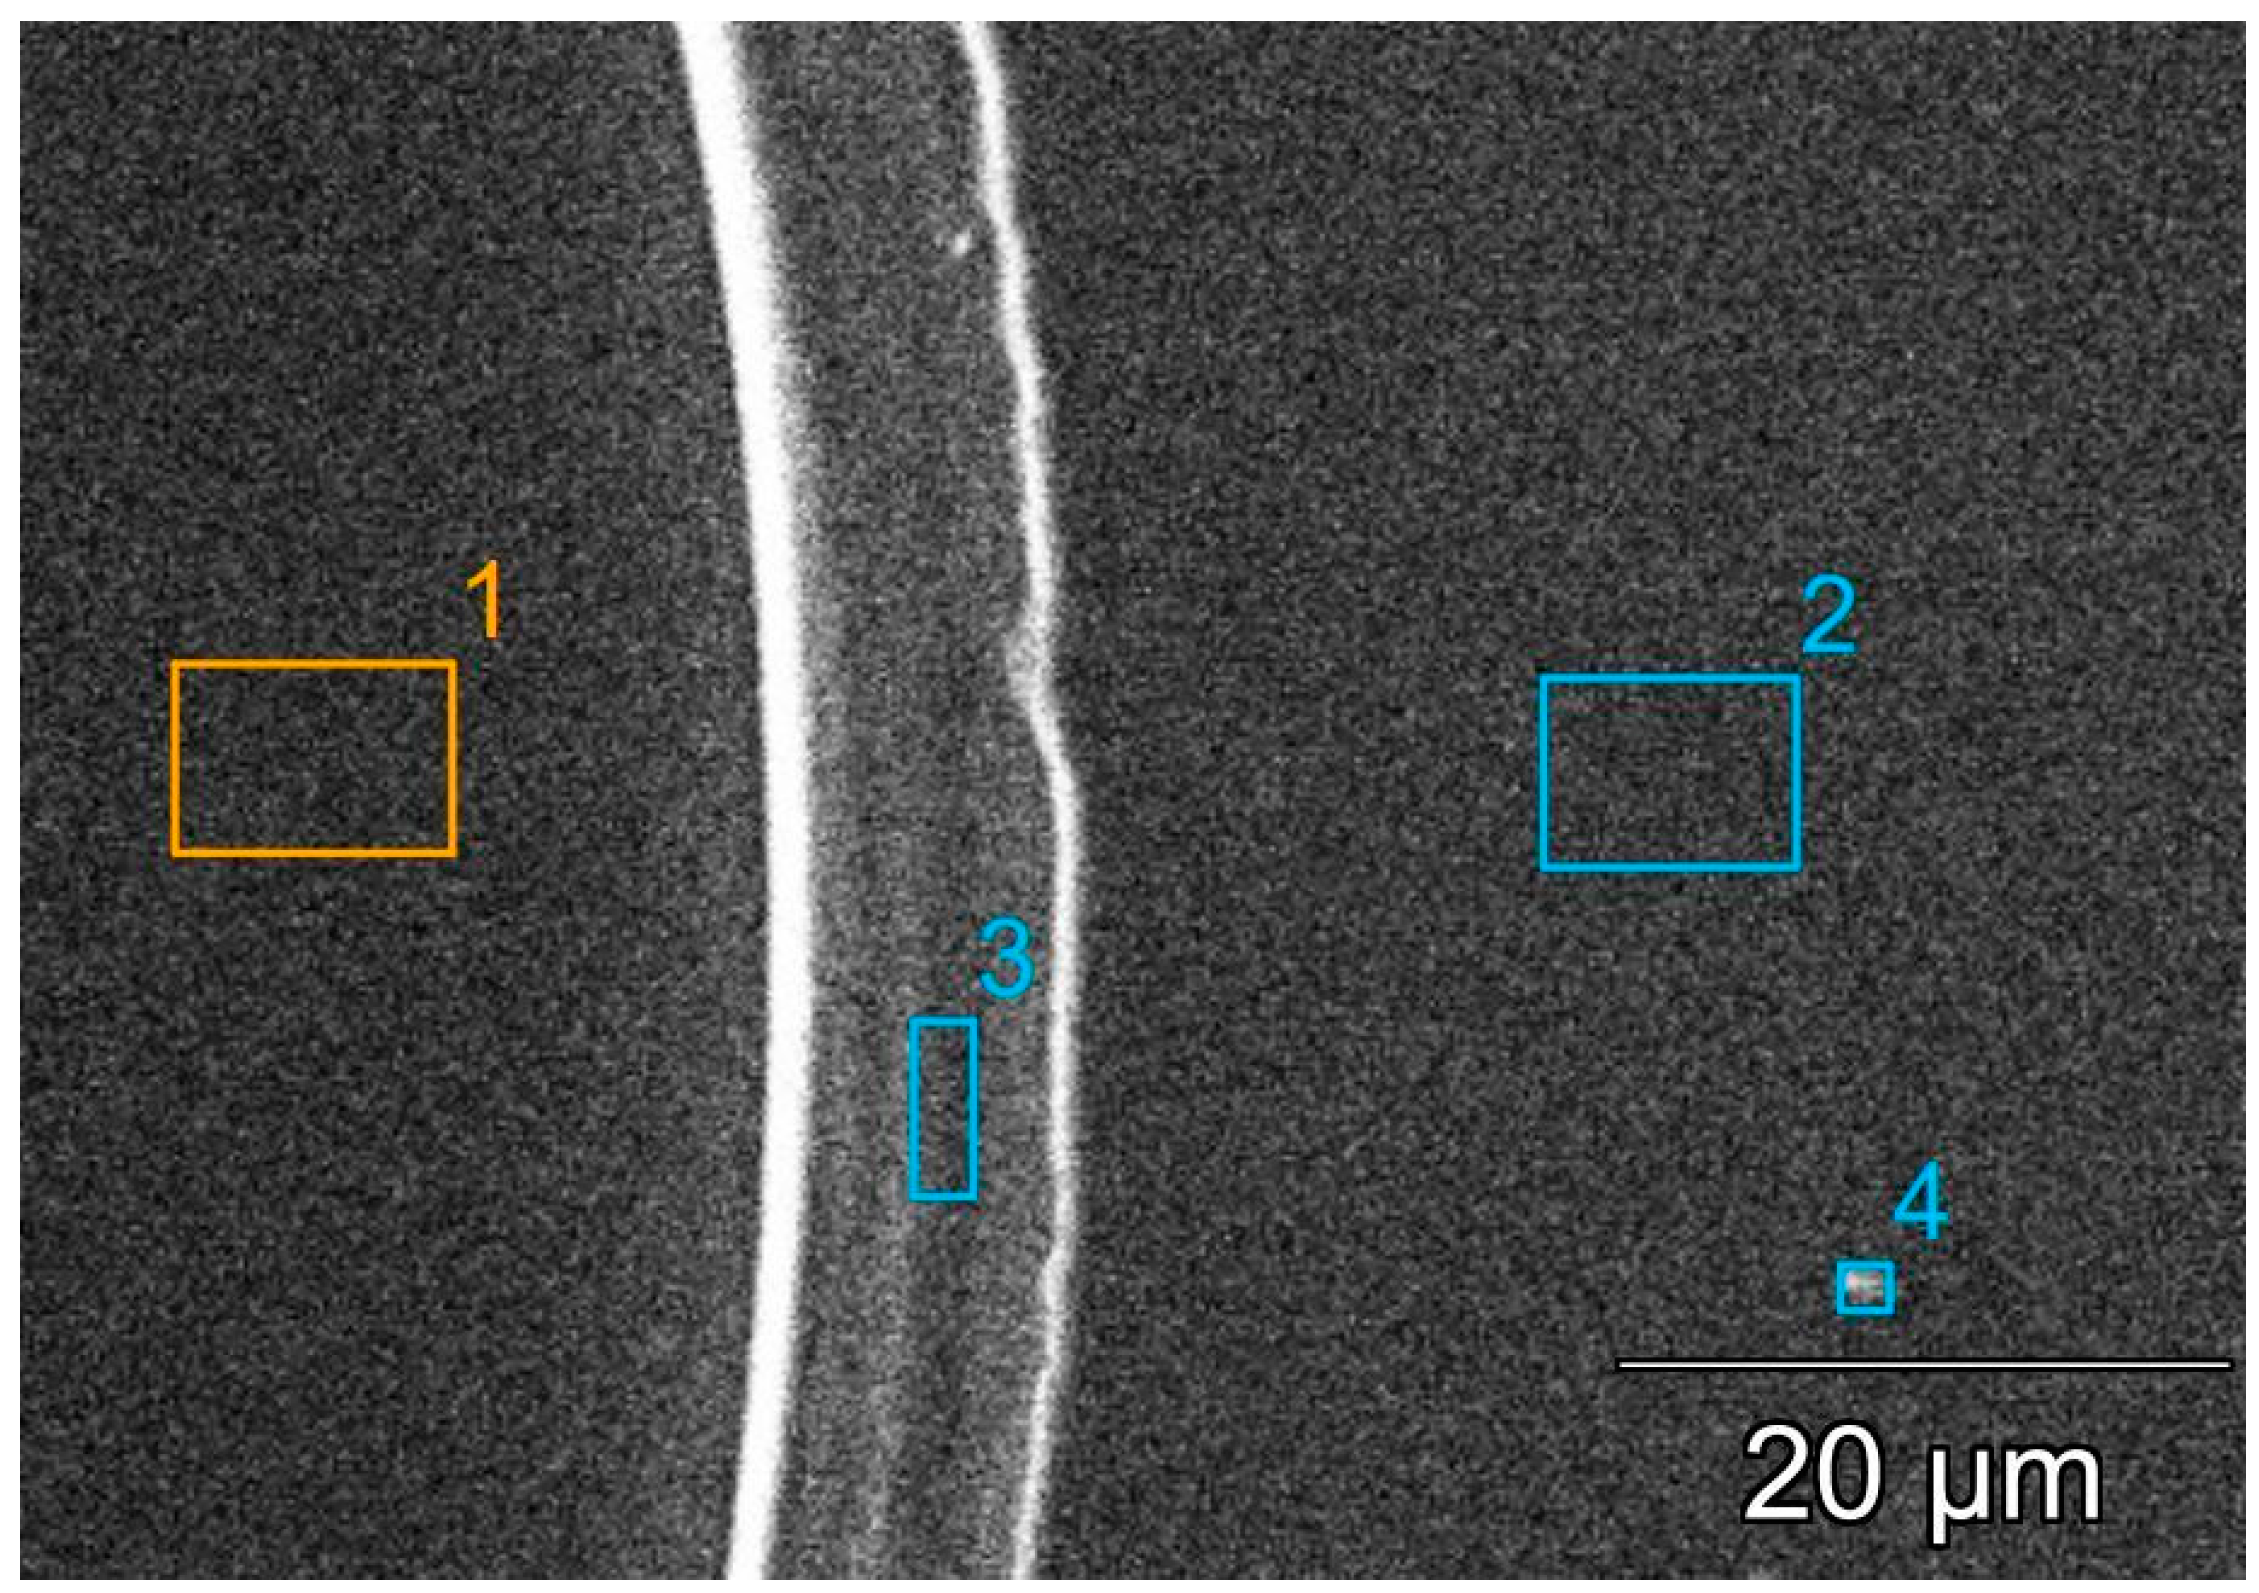
Four characteristic spots on the sample surface were chosen to analyze the coating‘s chemical composition (see
Figure 3). Spot-1 is a sample surface without coating, i.e., a substrate; spot-2 as a nearby smooth surface region of the coating; spot-3 as a coating’s deeper sublayers as worn tribo-tracks and/or flaked or detached coating’s pieces; and finally, spot-4 as a nearby surface region of the coating having some irregularity, unlike the spot-2.
The elements observed in the EDS spectra exhibiting their weight and atomic content within the coating are summarized in
Table 4. It is seemingly that the chemical composition of the coating affects its micromechanical and tribological properties, i.e., the overall tribological performance.
3.2. Wear and Friction Coefficient
Two different tribological experiments were performed. One characterized the wear of the Coatings, and the other the friction properties.
3.2.1. Wear
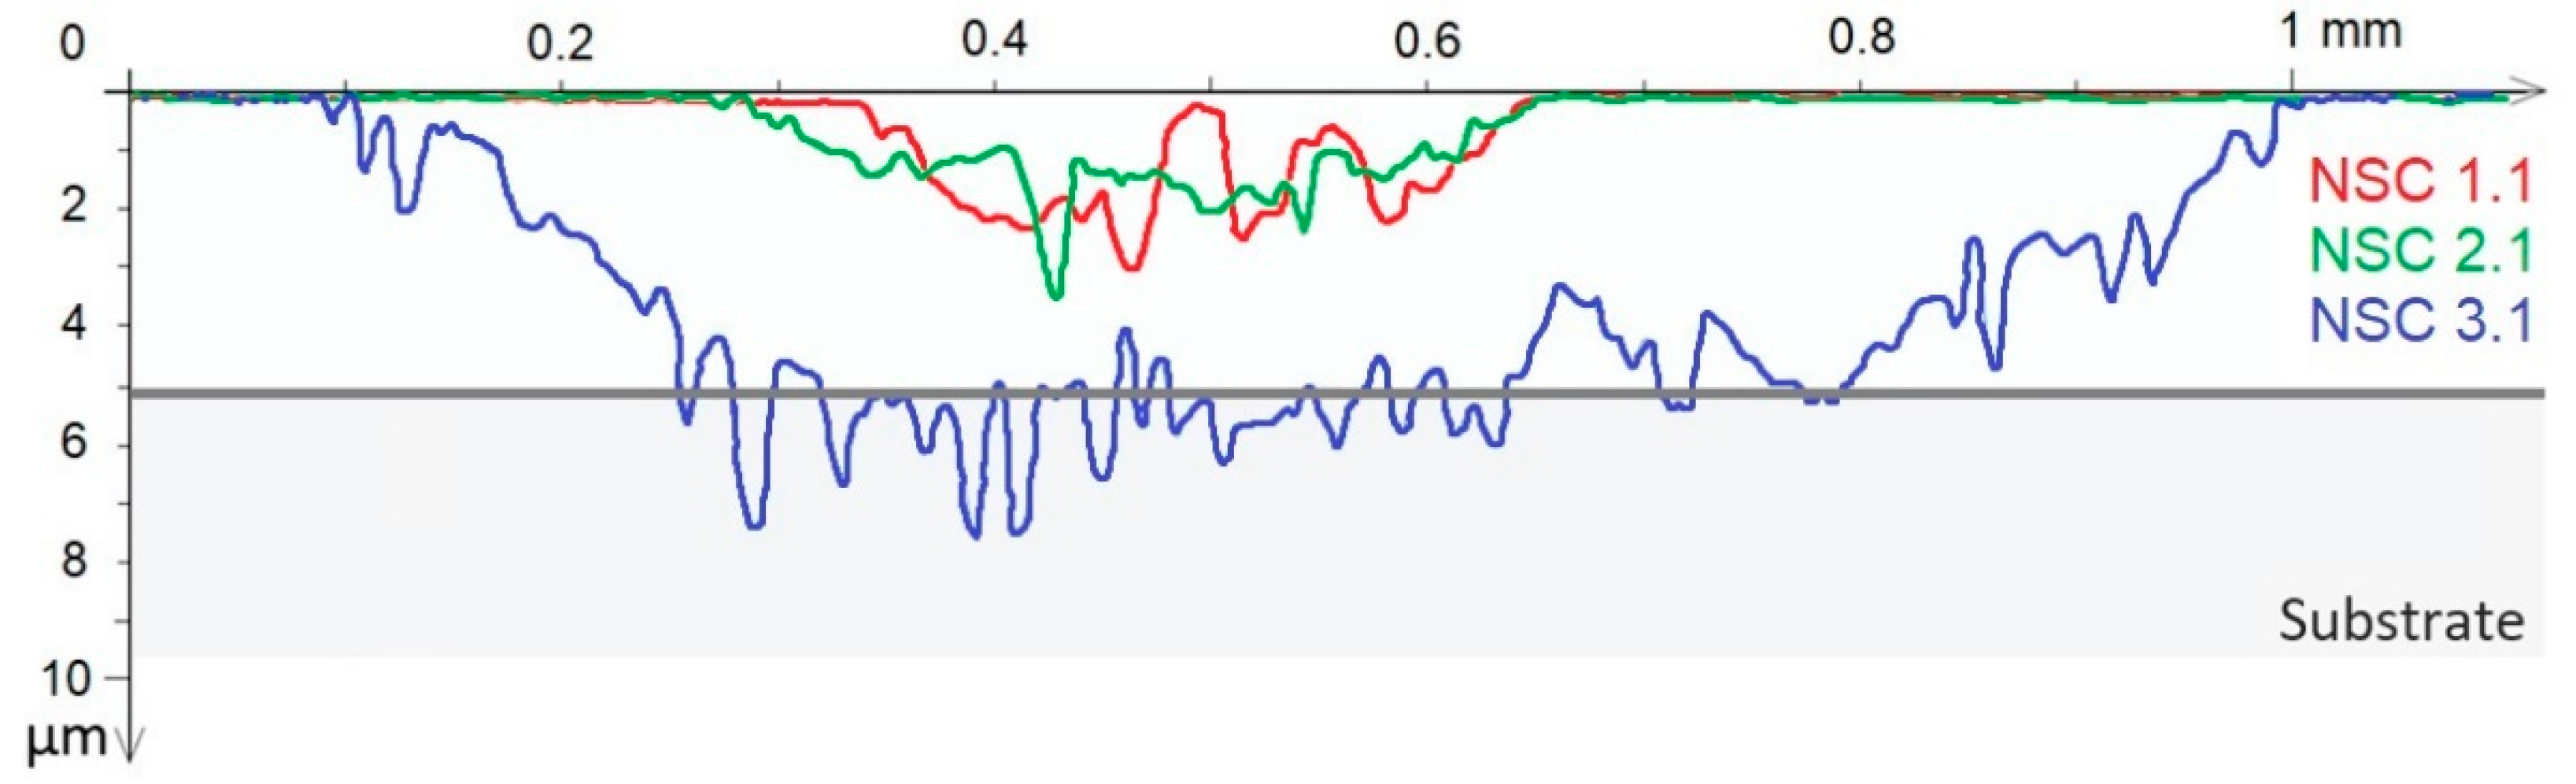
The wear tests were conducted according to standard ISO 18535 as described in the materials and methods section. The wear track was measured in eight positions at a constant angular distance, and the average value of the cross-sectional area was calculated for each coating. Examples of wear profiles for three coatings are shown in
Figure 4. NSC 1.1 is represented in red, and NSC 2.1 and NSC 3.1 are in green and blue colors, respectively. The gray area represents the substrate material. From the measured coating thicknesses (see
Table 3), NSC 3.1 is worn to the substrate material. NSC 1.1 and 1.2 are worn to a depth of approximately 3 μm, but NSC 2.1 is slightly wider.
The wear cross-sectional area was calculated for each profile using the Talymap Gold analysis software, and the average value was calculated for each Coating and Substrate (see
Table 5). The average cross-sectional area was used as the wear-describing parameter in this case. The obtained data shows that the best wear-resistant Coating is NSC 1.1, improving the wear properties about 28 times against the substrate material. The worst wear resistance was observed in NSC 3.1, with approximately three times better wear properties against the substrate material. As the wear increases, the numerical value of the standard deviation of the measurements increases. That can be explained by the fact that as the total worn area increases, the numerical value of the standard deviation also increases proportionally, as well as for a material or coating with low wear resistance, wear debris impact and separation of layers is possible in specific places, which accordingly affects the size of the wear cross-sectional area and standard deviation.
3.2.2. Friction Coefficient
The friction coefficient was measured according to the settings described in materials and methods to characterize the friction properties of the coatings. Measurements were performed on three samples for each coating and the substrate material. The initial and steady-state friction coefficients and the maximum and minimum values for each sample were determined and averaged to characterize the friction properties of the coatings (see
Table 6).
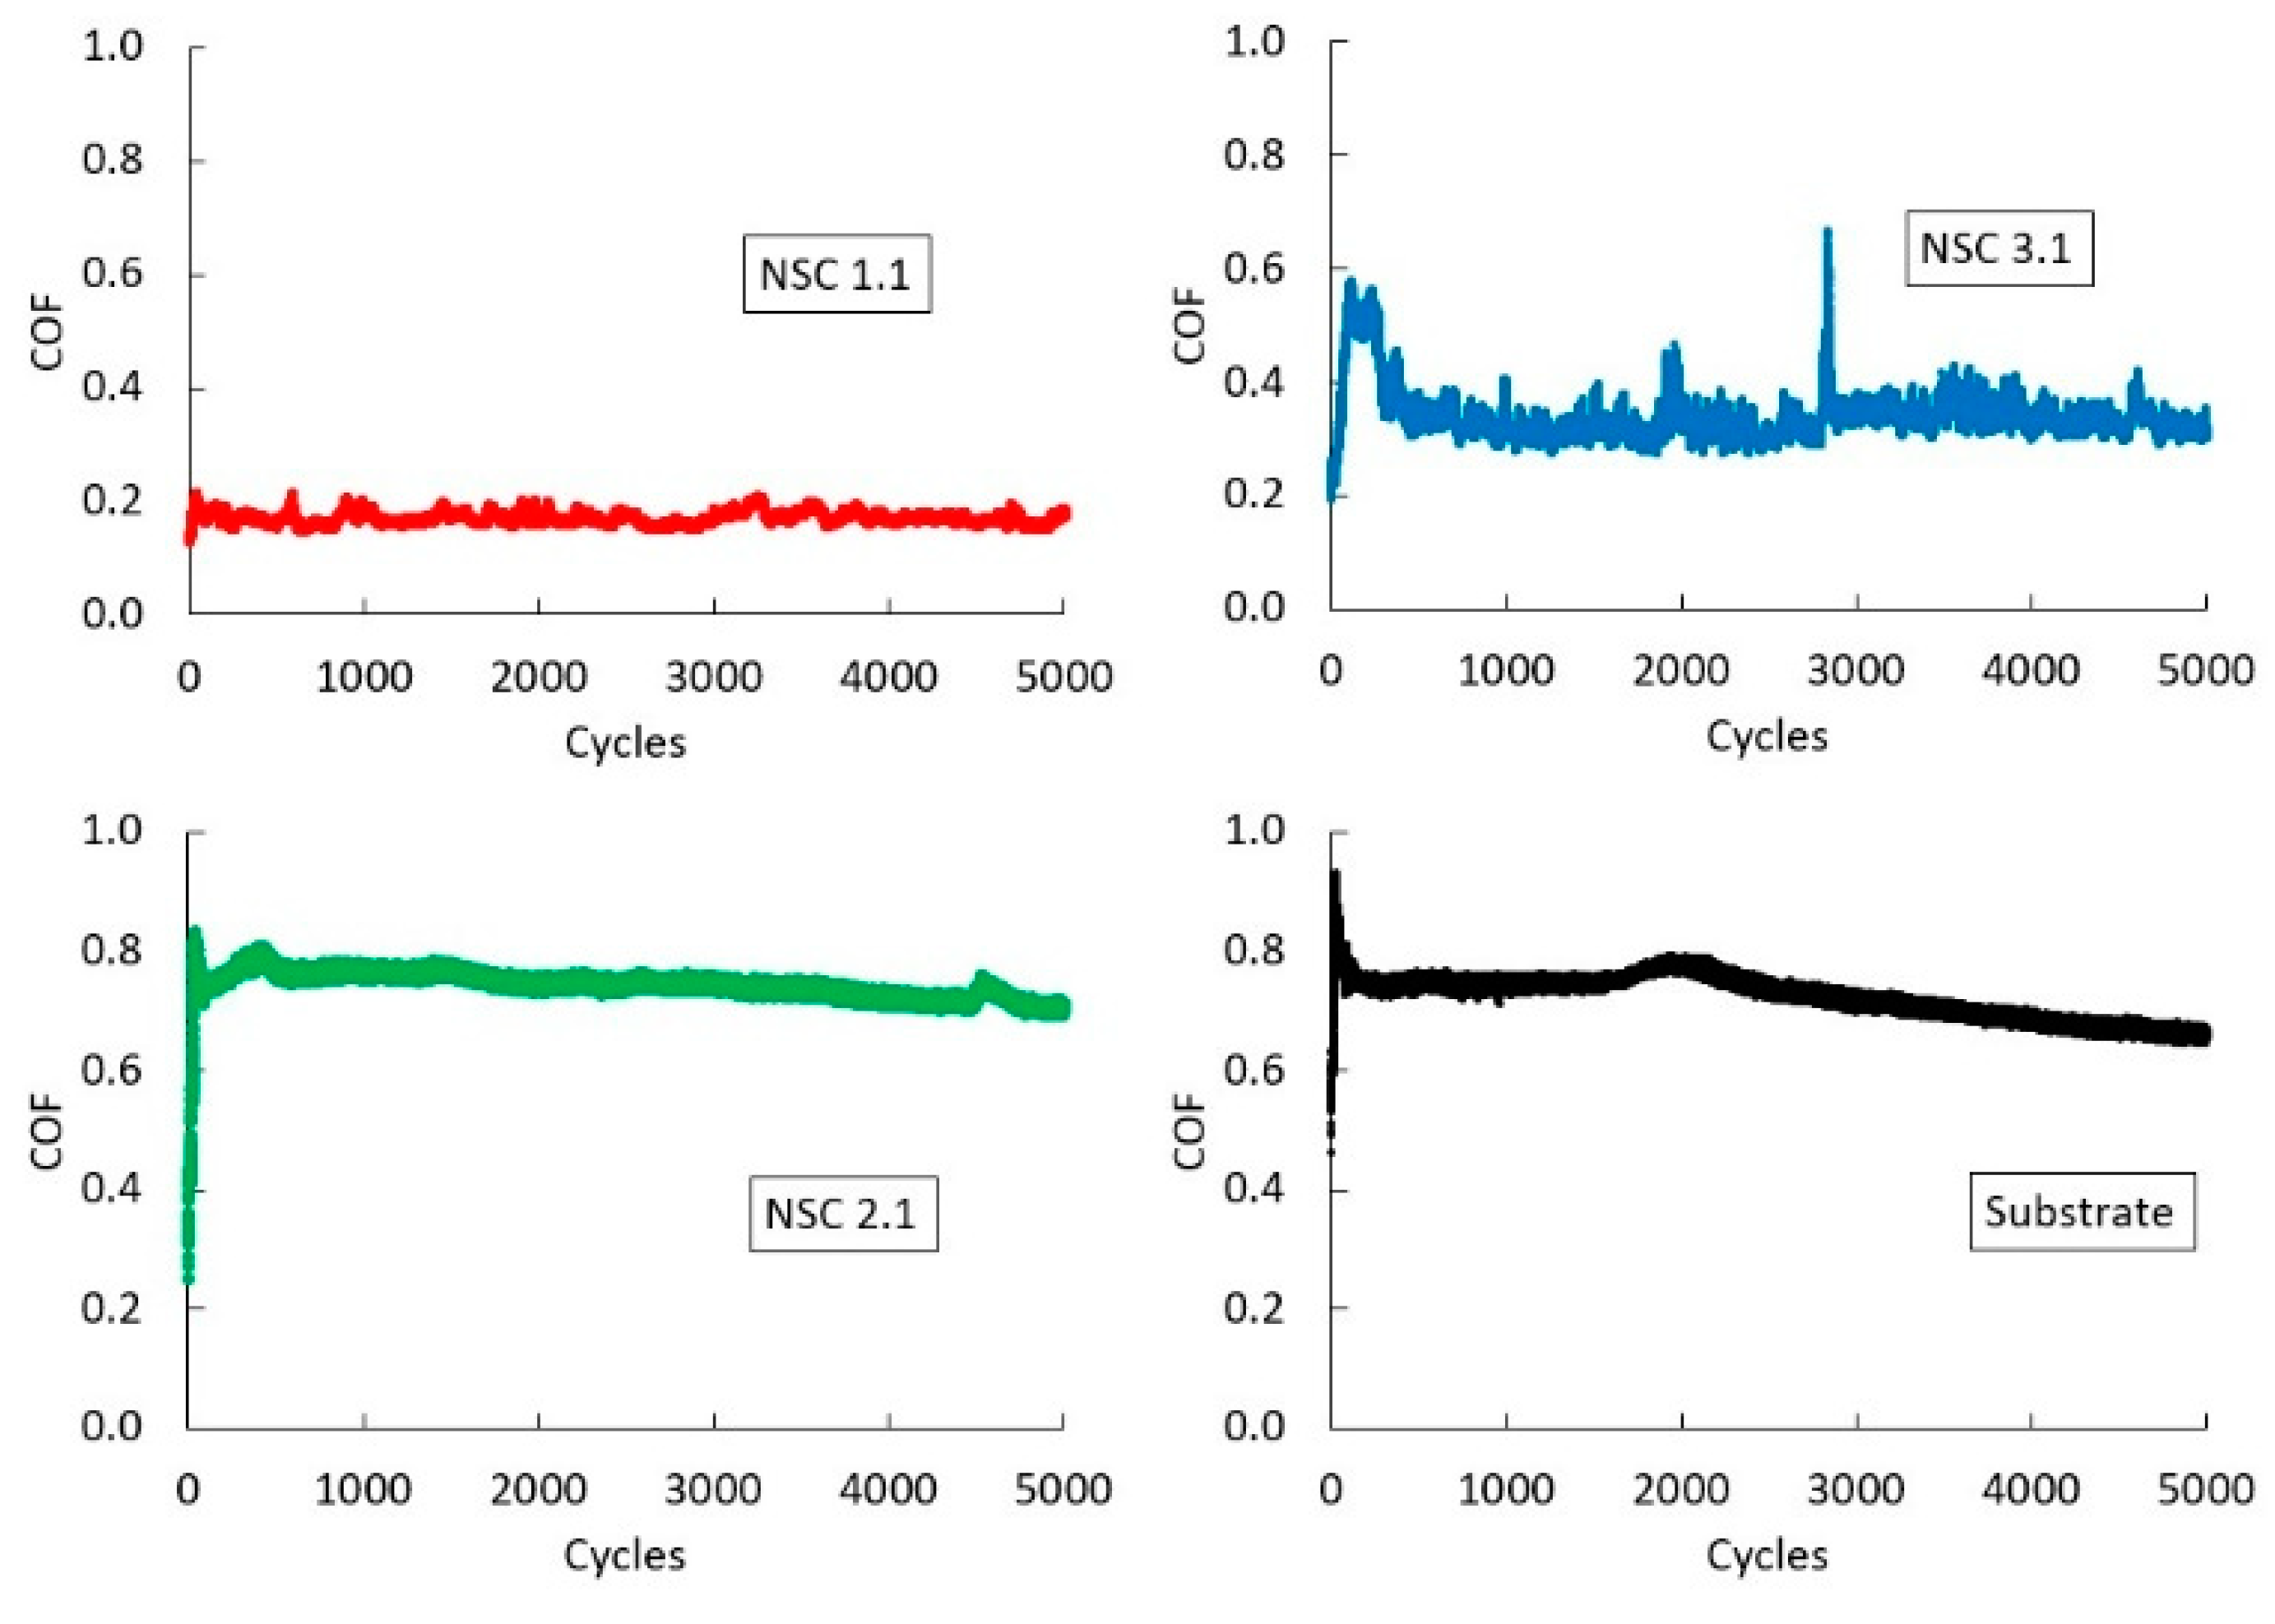
Steady-state coefficients of friction are further used to compare the friction properties of the Coatings. They were calculated from the data obtained in sections of stable value curves containing at least 1000 cycles or 20 m. Examples of friction coefficient curves from each coating and substrate material are summarized in
Figure 5. Data were recorded every 0.012 s, and exponential smoothening of the data with a damping factor of 0.8 were performed.
According to
Table 6, the lowest value of the average steady-state friction coefficient was reached for the NSC 1—0.18. Compared to the average steady-state friction coefficient of the substrate material of 0.75, NSC 1 has a reduction in friction of at least four times. The value of the steady-state friction coefficient for NSC 3 is about two times lower than for the substrate material, but more significant curve fluctuations are observed, which could be due to the relatively large wear of this coating. Although the wear is greater than the other two coatings, it did not wear to the substrate material as observed in the wear experiments (see
Figure 4). NSC 2 has no friction improvement over the substrate coating.
3.3. Surface Texture Measurements
The surface 3D texture parameters were measured for the smooth surface part, or the surface before the tribology experiments and the surface part after the tribology experiments (tribo-tracks from friction experiments (3 N load and 100 m distance) according to the described methodology above (see
Figure 2). The surface texture results of different samples in this paragraph are described only by the parameter Sa (see
Table 7 and
Figure 6) for visibility and simplicity purposes. All used 31 surface texture values are summarized in
Table A1 and
Table A2 in the
Appendix A.
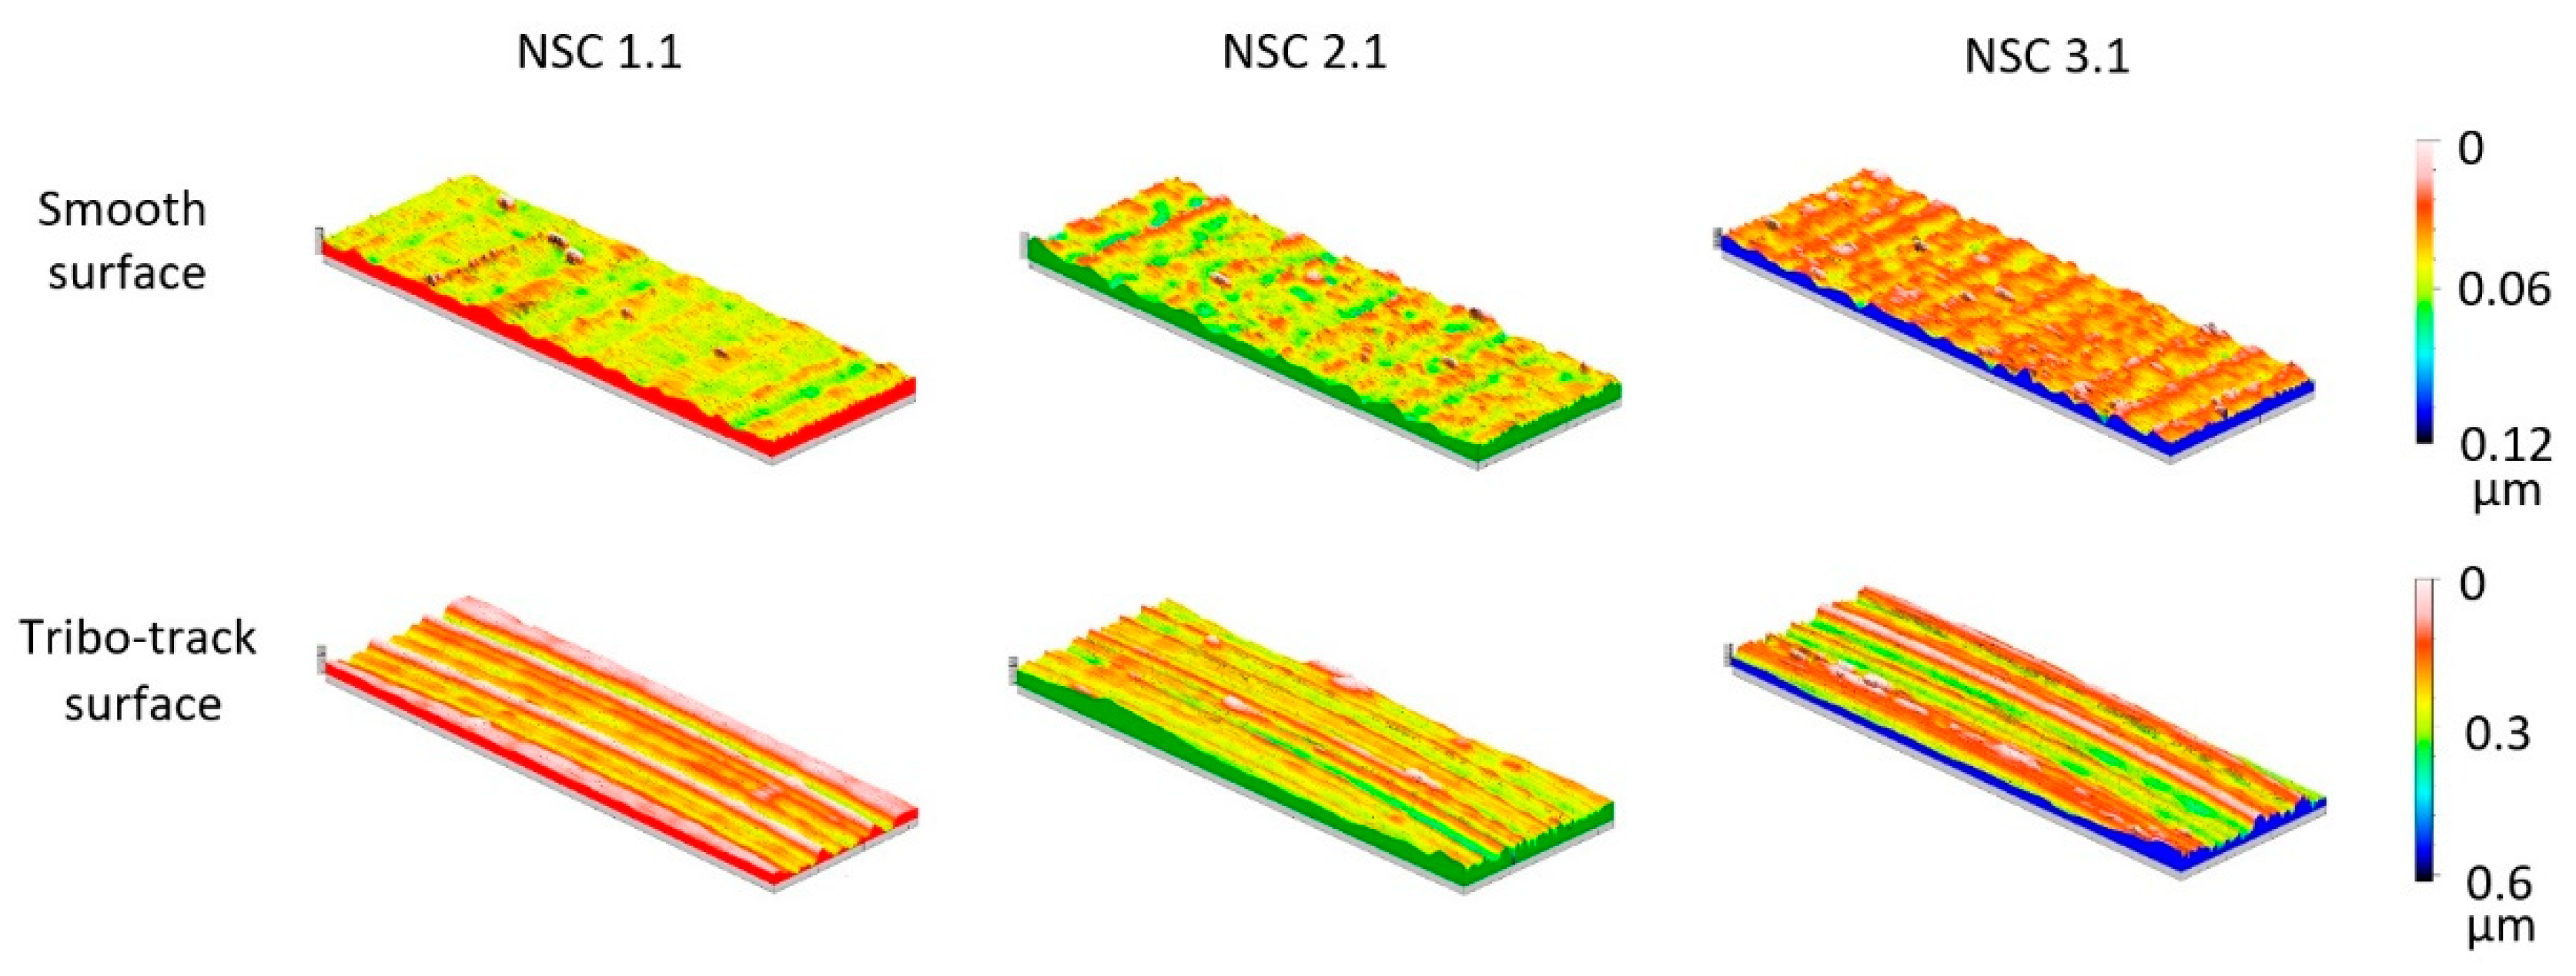
If Sa values are compared for the smooth surface, then for the comparison of different coatings, it can be seen that the NSC 1 and NSC 3 coatings have an average Sa value above 10 nm, but the NSC 2 is slightly smoother with an average Sa value around 8 nm. Respectively, for the tribo-track surface, the moderately rougher surface is observed for the NSC 3 coating (Sa 142 nm), the smoothest—for the NSC 2 (Sa 60.4 nm). It should be noted that a significantly rougher surface was observed for NSC 3.2. Therefore, the average value of the Sa tribo-track is also significantly higher. The standard deviation also indicates differences between samples.
Figure 6 represents visual information about the different coating surface textures for the smooth and tribo-track surfaces. The scale values for all three coatings are the same but different for a smooth surface part and tribo-track surface part. For the roughest samples (NSC 3.1) on the tribo-track surface, the roughness has a larger amplitude, which forms a more considerable Sa value. NSC 2.1 has several minor irregularities in amplitude and width compared to NSC 1.1.
3.4. Microhardness
Microhardness was measured for each sample in the force range from 0.1 to 6 N (see
Table A3 in
Appendix A). Each measurement point for each sample consists of 10 measurements, and the average value to represent the hardness of the coating was calculated accordingly.
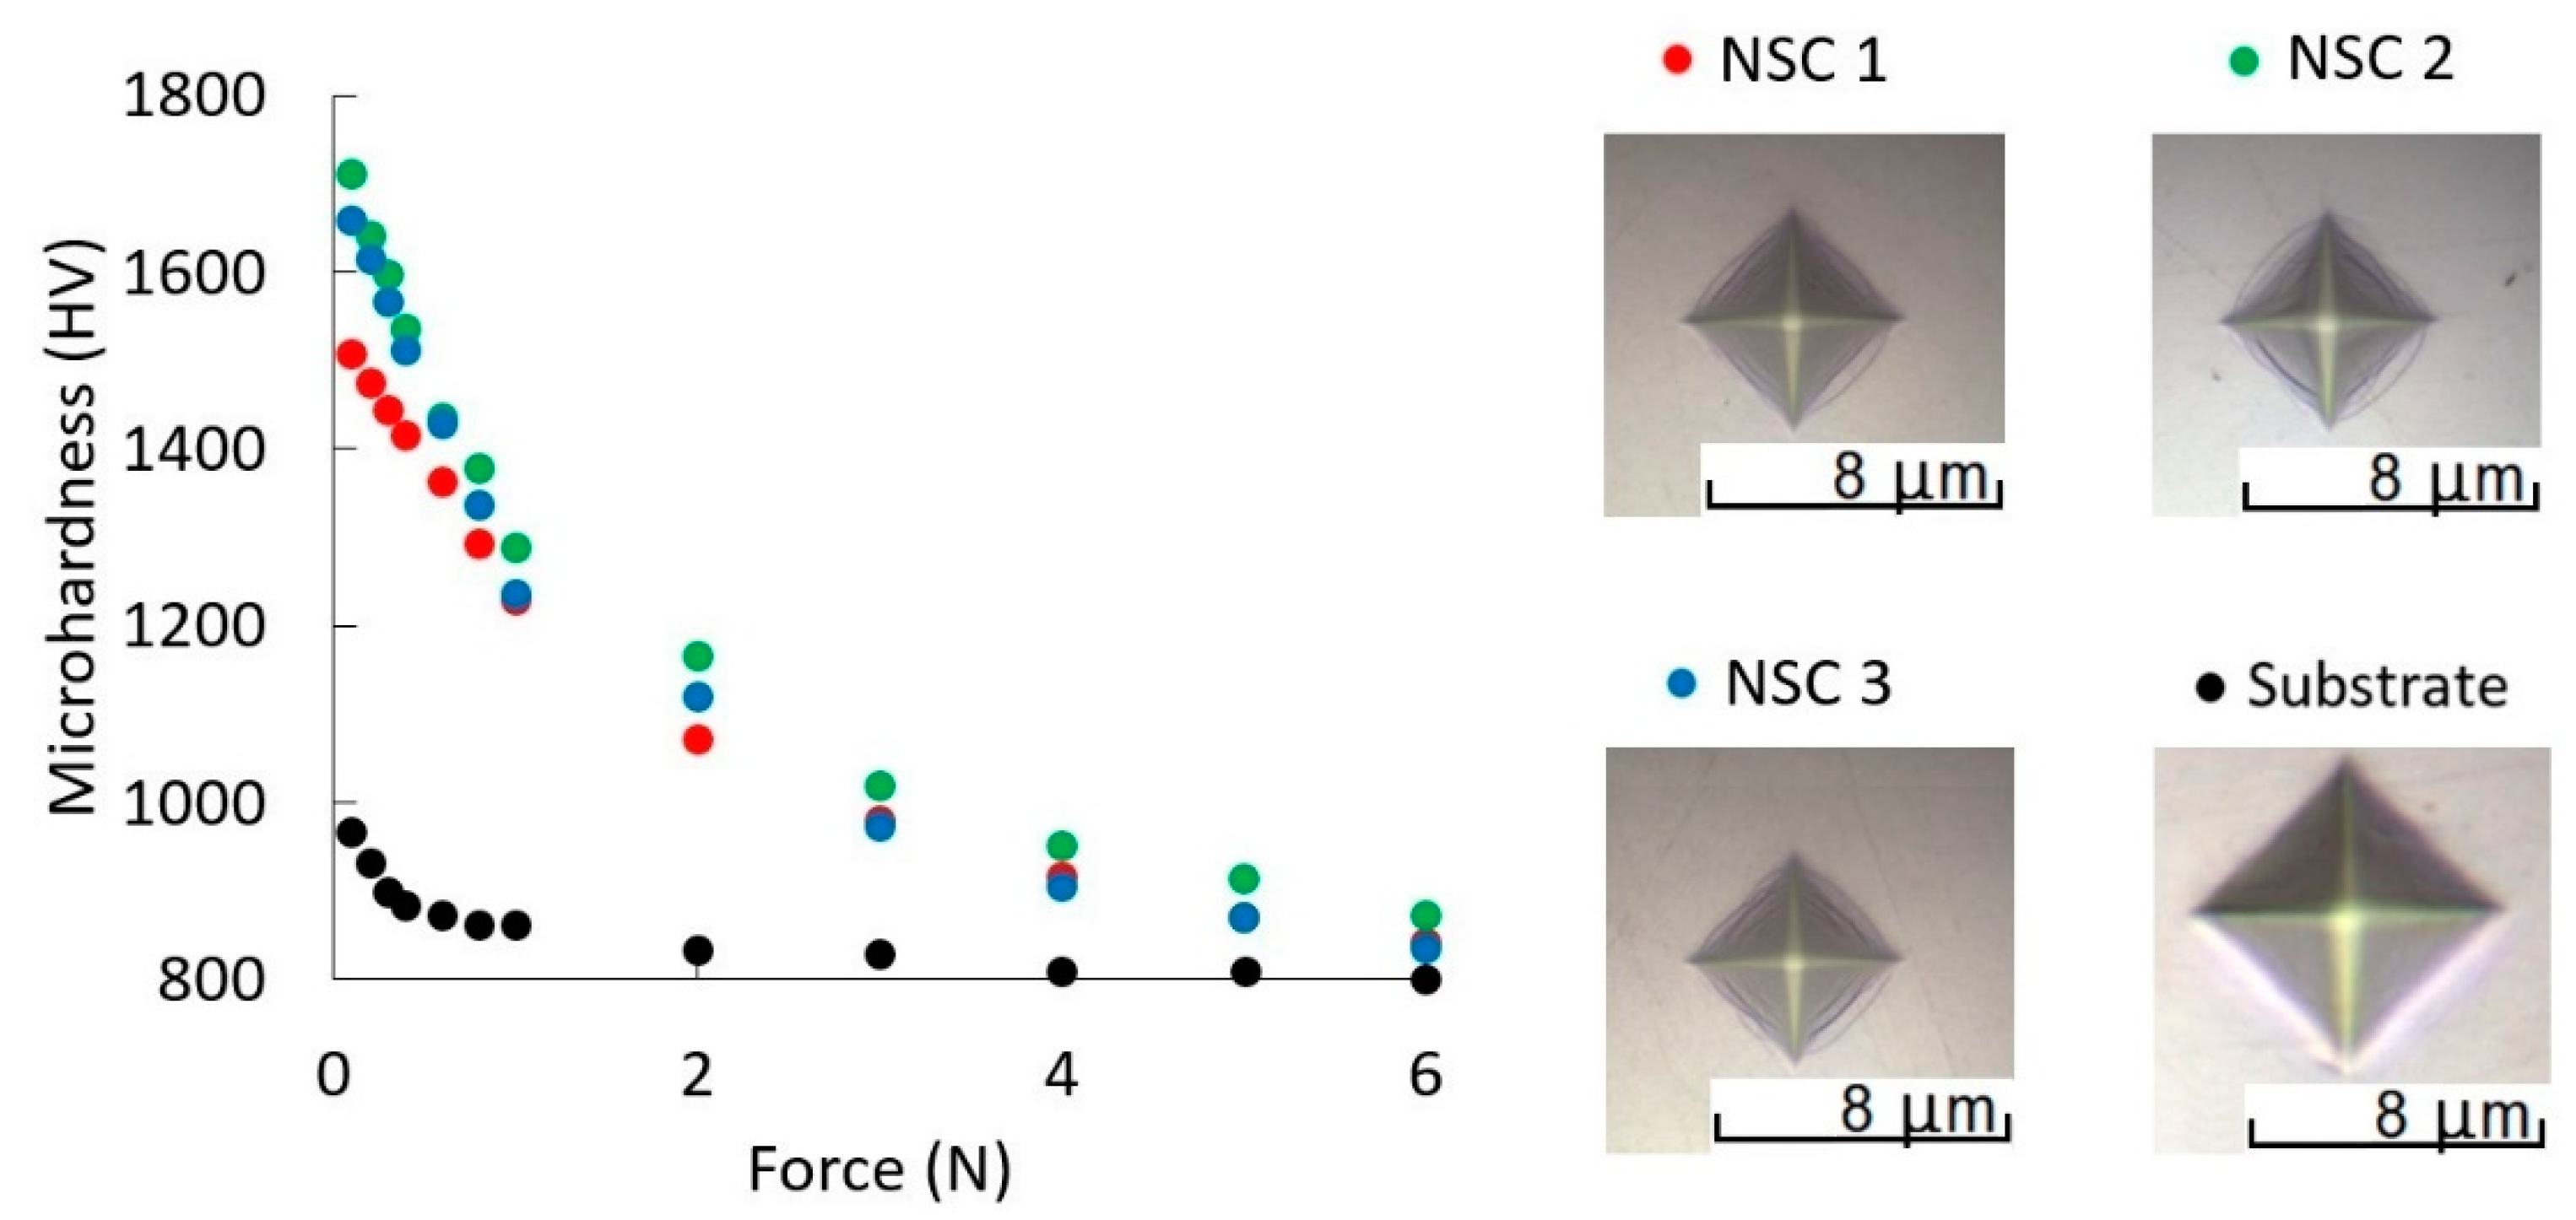
Figure 7 shows the dependence of microhardness values on the applied force when measuring three coatings and substrate material. Examples of visual microscopic images for microhardness measurements at a force of 0.3 N are shown in the second part of the image—a more significant imprint refers to lower hardness.
From
Figure 7, it can be concluded that by reducing the applied measurement force, the hardness values increase, but as the load increases, the measured hardness values converge with the hardness of the substrate. As the load decreases, the hardness of the coating directly approaches the hardness of the coating, not the integrated hardness (Coating + Substrate). The indentation depth at 0.1 N was measured to be approximately 0.5 μm, which does not exceed the recommended 10% of coating thickness (ranging from 5.2 to 6.5 μm) [
43]; thus, the microhardness values at 0.1 N force should be close to actual coating hardness. If the coatings are thinner or softer actual coating hardness using Micro-indenter might be problematic to measure. In this case, either mathematical calculations [
44] or equipment that provides lower measurement force, such as nano-indenter, should be used.
The highest coating hardness at 0.1 N was obtained for NSC 2 (HV 1710) and NSC 3 (HV 1658), and the lowest for NSC 1 (HV 1507). Compared to the substrate material (HV 967), the hardness increased from 1.6 to 1.8 times.
3.5. Correlation Dependence between Surface Texture and Coating Tribological, Mechanical Properties
As shown by several authors, there is a correlation between the parameters characterizing the surface texture of the sample and the friction coefficient [
21,
23,
24], as well as the coating’s hardness [
21,
22,
23]. Therefore, the correlation between surface texture, friction coefficient, and microhardness was considered for the experimental samples. It has been proven in the known literature [
22] that there is a correlation between surface texture parameters and wear; however, with the samples used in the experiments, which have a low surface roughness (Sa below 12 nm), it was not possible to obtain reliable data confirming the correlation between surface texture and wear. For example, in Dzierwa et al. [
22], it was obtained that the surface texture parameter Ssk affects the wear volume. The value of Sa for all samples was 4 μm. Shi et al. [
29], studying how surface texture parameters affect wear, already in the title, emphasizes that the research was carried out on rough surfaces (Sa from 0.9 to 3.8 µm). It was found that the void volume parameters affect the wear under hydrodynamic friction conditions; as they increase, the lubricant can penetrate more easily, and thus the surface wear decreases. Perhaps if the surface were rougher, as in other experiments of a similar type, it would be possible to identify the correlation, although, in tests by Sedlacek et al. [
39], it was stated that under dry fiction regime because of completely changed surface roughness parameters, it is hard to conclude tribological behaviour.
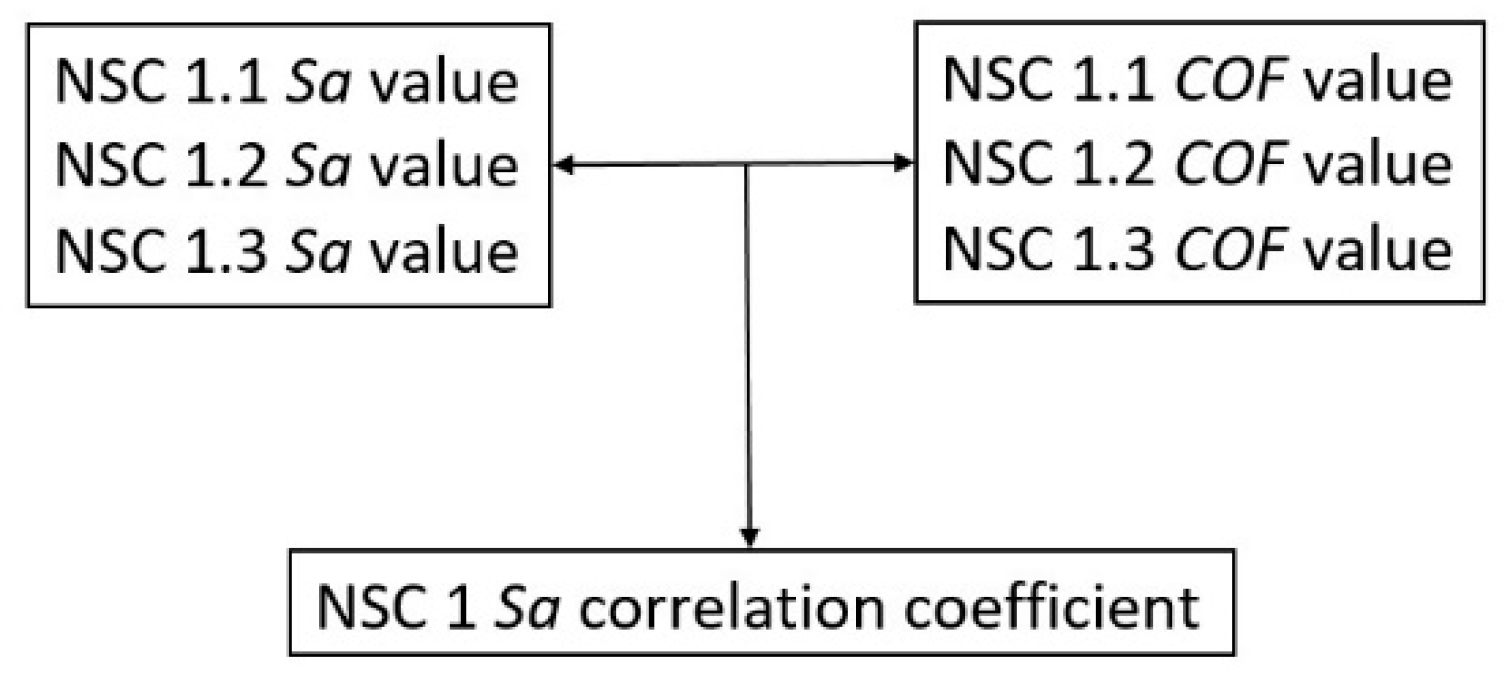
The surface texture measurements and friction coefficient and hardness measurements indicated differences between theoretically three identical samples for each coating; thus, the correlation between the tribological and mechanical properties of the samples and the 3D parameters characterizing the surface texture was considered. The correlation was determined using a correlation coefficient. An example of how the correlation coefficient was determined for each coating is shown in
Figure 8. The example uses the correlation of the surface texture parameter Sa for three samples with a friction coefficient of NSC 1.
The steady-state friction coefficient was used to characterize friction tests and to identify correlation with surface texture parameters. Microhardness measurements at 0.1 N force (the lowest possible load of the equipment) were used to find the correlation between the surface texture parameters and the microhardness. Therefore, there is reason to believe that surface texture’s effect on the coating’s hardness under this force would be most probable.
3.5.1. Correlation Dependence between Friction Coefficient and Surface Texture
The correlation between friction properties and 3D surface texture parameters was initially sought using the initial friction coefficient and sample surface parameters from smooth surface measurements. However, the results obtained were considered inconsistent, i.e., opposite correlations were observed between the three samples for different coating types. Sedlacek et al. [
39] mentioned that under dry sliding, a high degree of wear and changes in surface texture limits a proper comparison and correlation between surface texture and tribological properties; thus alternative method was sought.
Considering the results of inconsistent measurements between the initial friction coefficient and the surface texture of the samples, the correlation between the steady-state friction coefficient and the surface texture parameters of the tribo-track was determined to obtain consistent results. Each sample’s steady-state friction coefficient values are represented in
Table 6, and considered 3D surface texture parameters are compiled in
Table A2 in the
Appendix A.
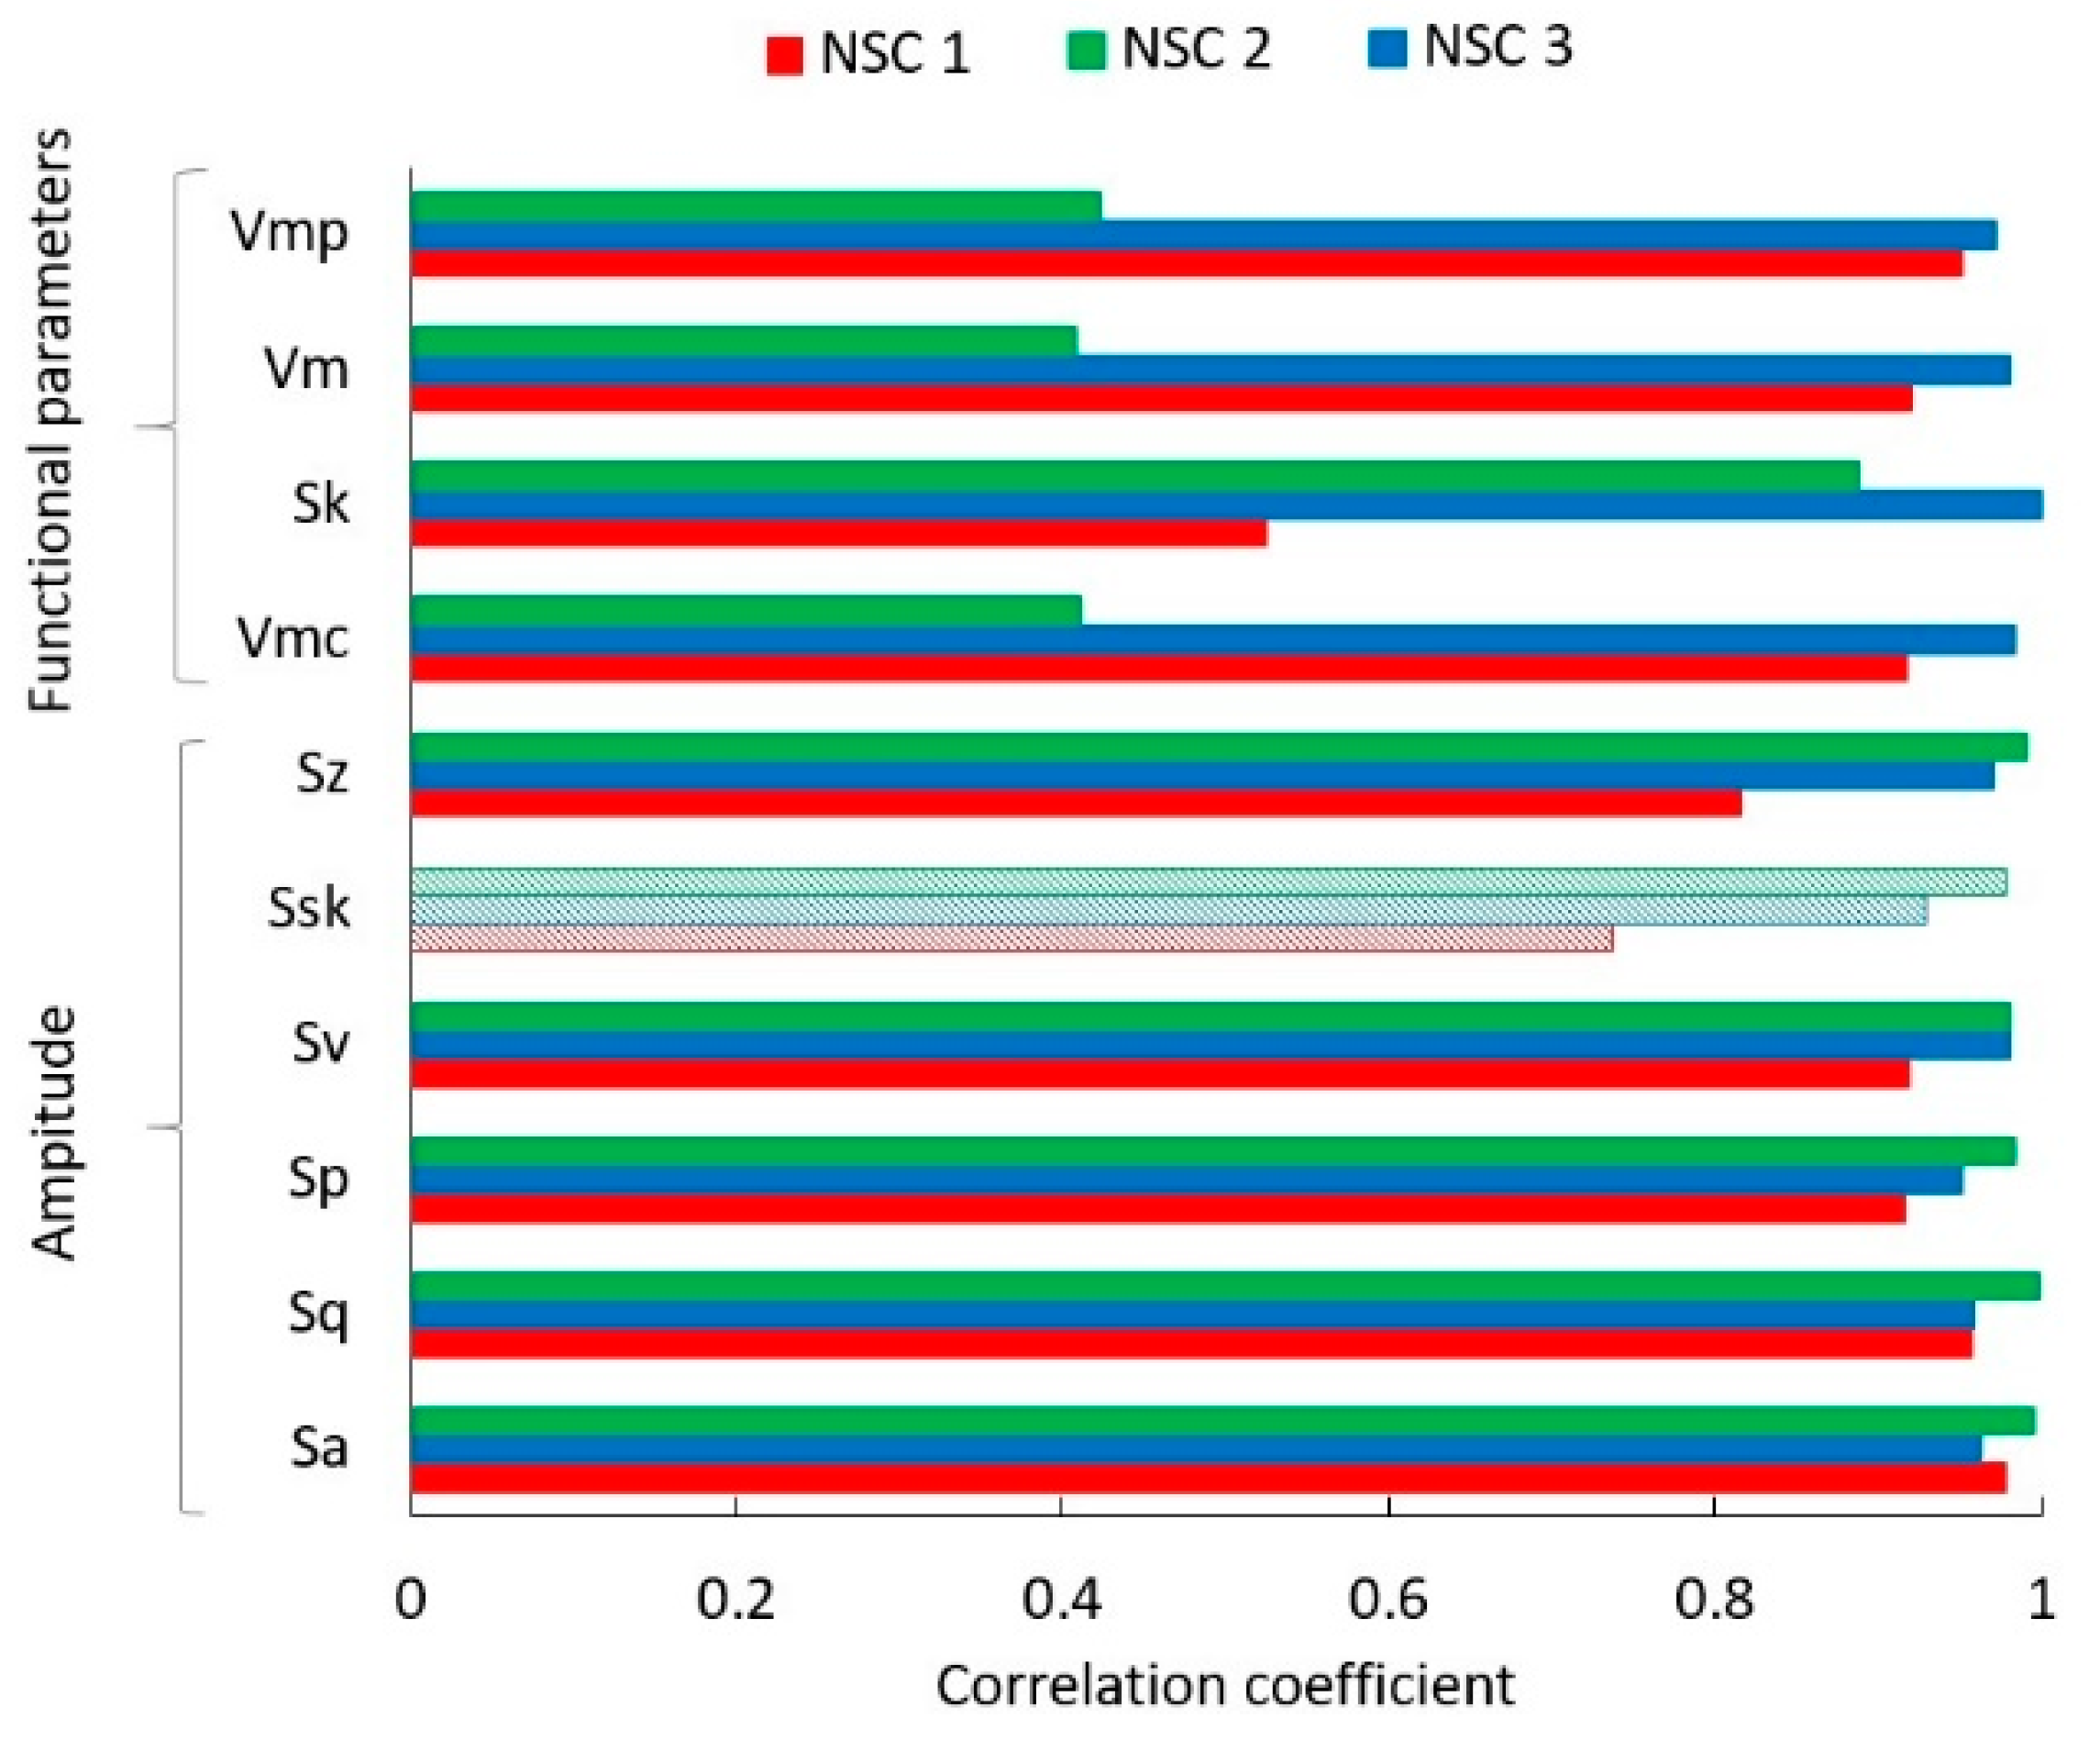
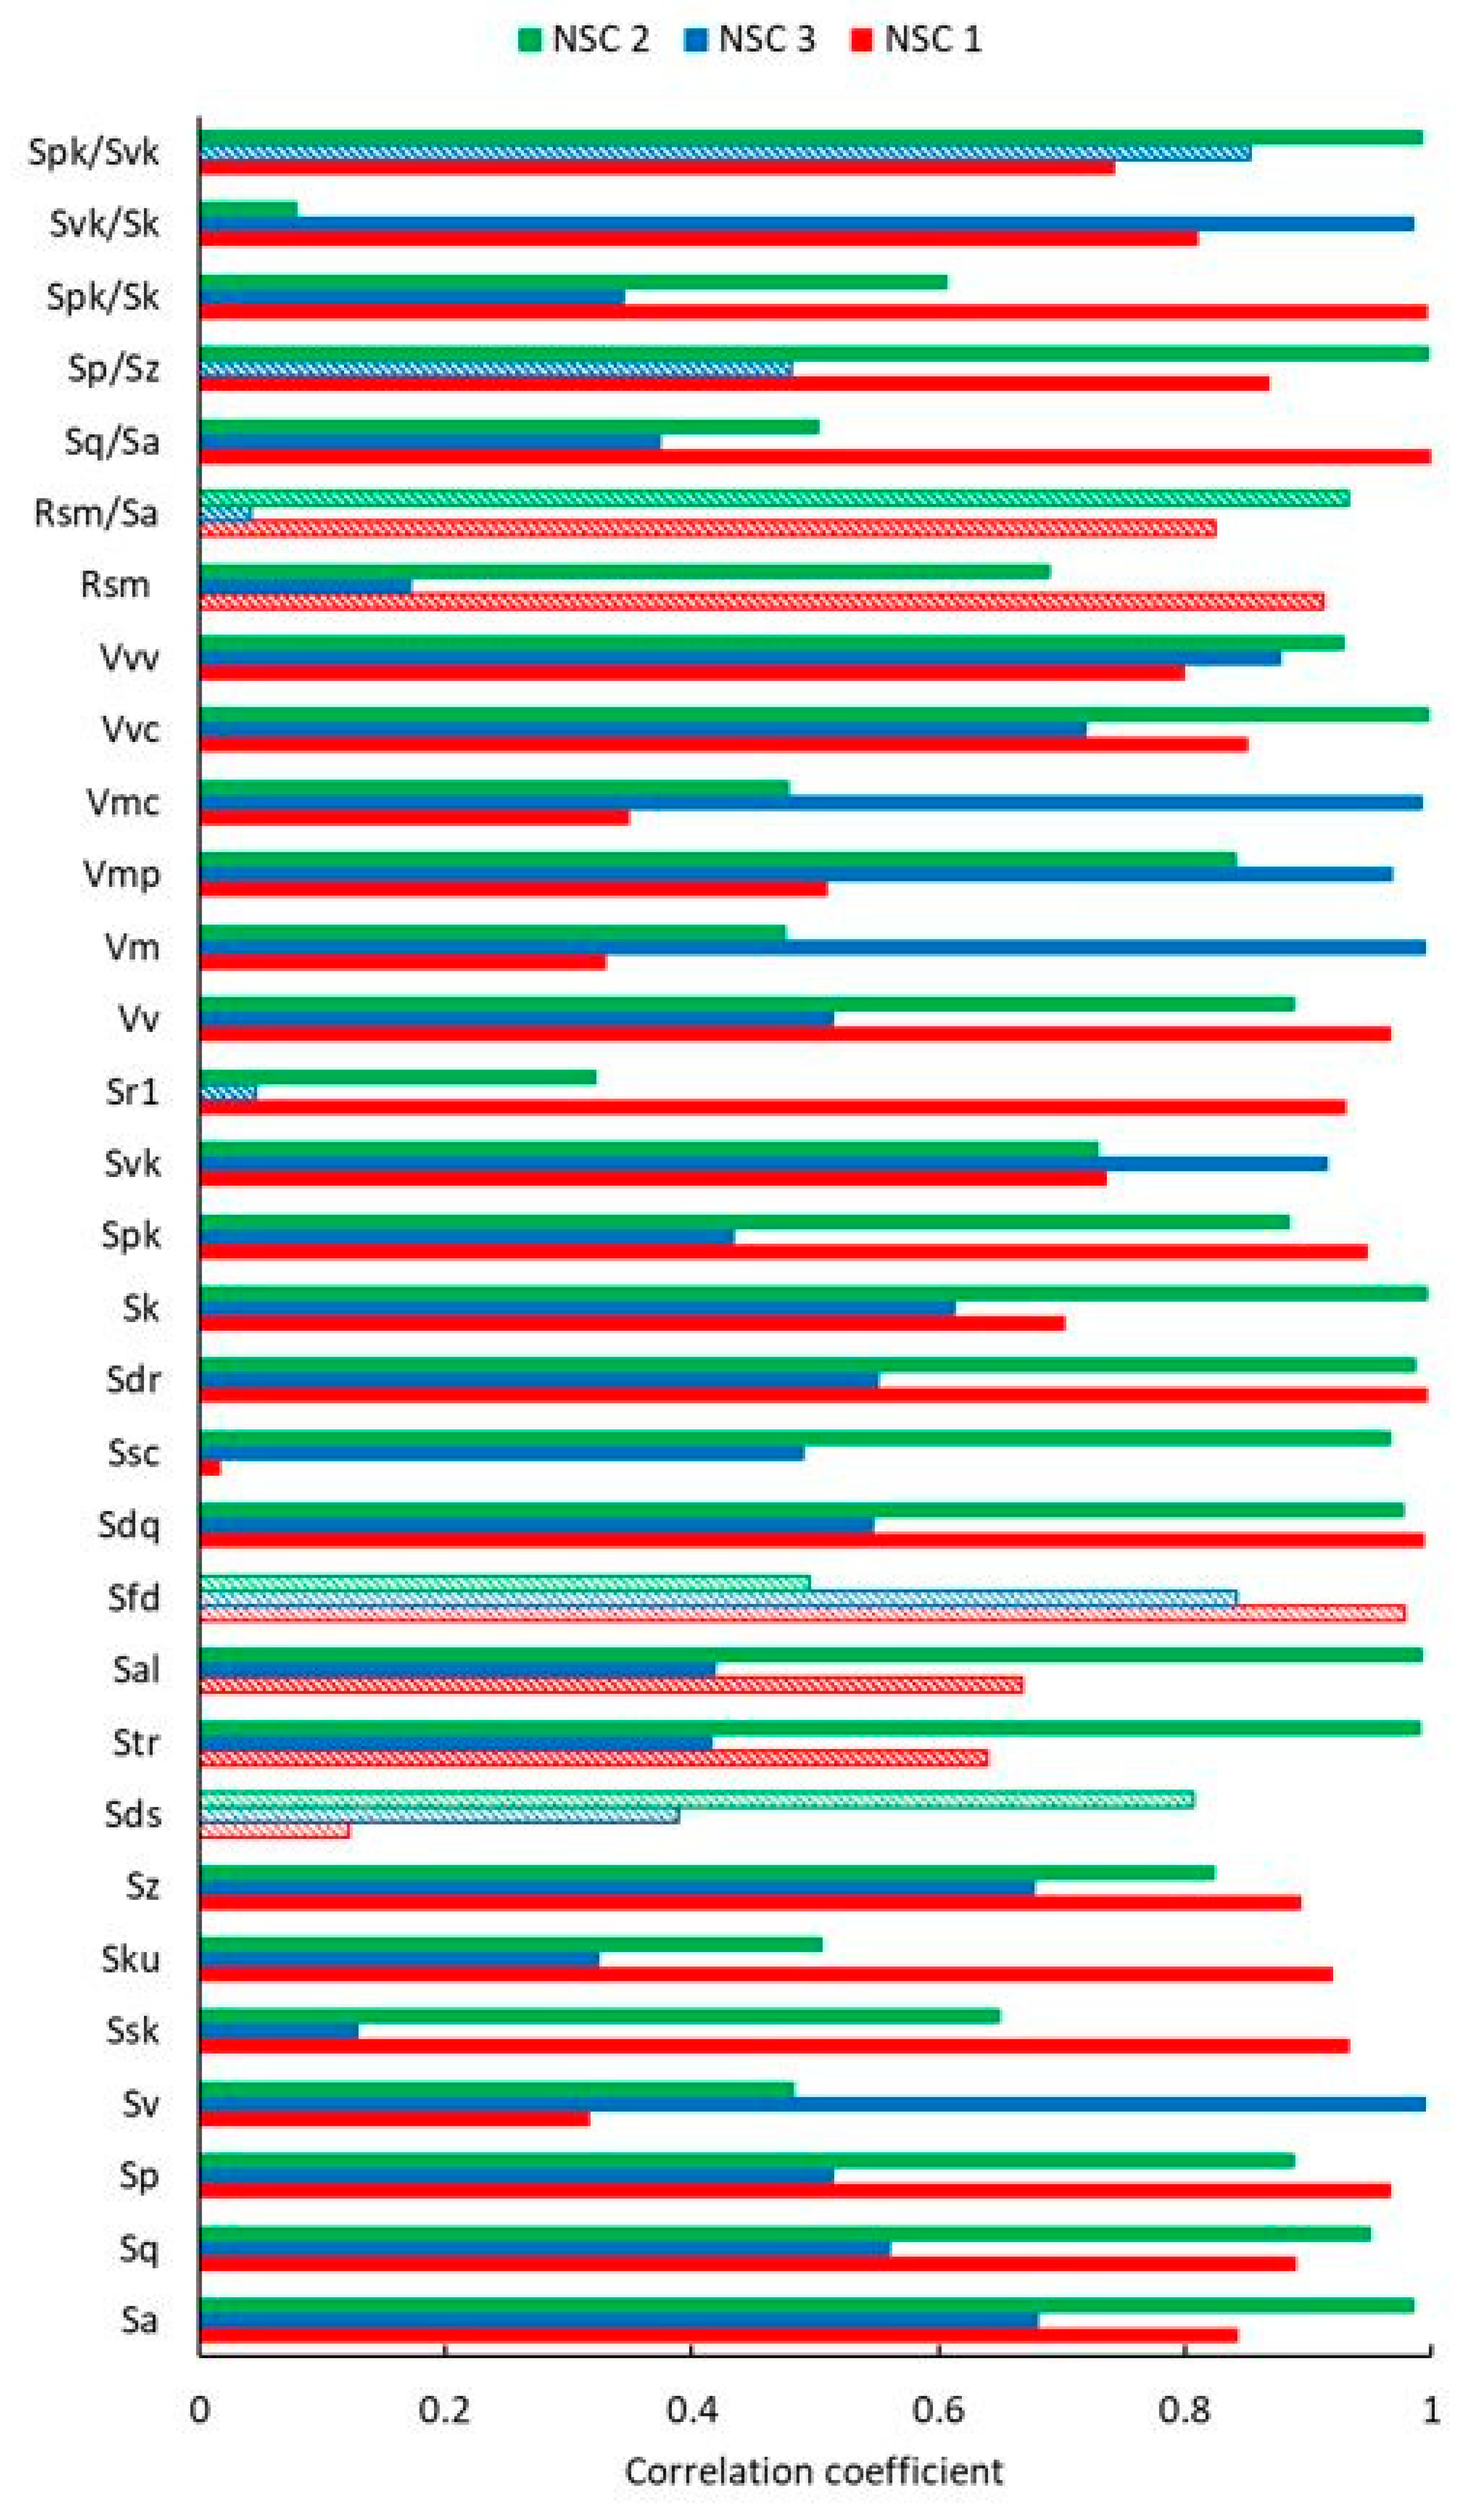
Figure 9 summarizes the TOP 10 highest correlation coefficients for the surface texture parameters of the samples against the steady-state friction coefficient for each Coating (NSC 1—red, NSC 2—green, NSC 3—blue), where each coating includes three samples. A complete graph of the correlation coefficients (including all 31 parameters used) is shown in
Figure A1 in
Appendix A. Filled bars represent positive correlations, and strikethrough bars—are negative.
It can be seen from
Figure 9 that two groups of surface texture parameters crystallize—amplitude and functional parameters, which are related to the material ratio curve. Amplitude parameters such as Sa, Sq, Sz, Sp, and Sv have been reported in previous studies [
23,
24,
26,
29,
38] as parameters affecting surface contact and friction. Therefore, it is reasonable to assume that even in the case of nanostructured superlattice coatings, these parameters can be considered primarily. However, it should be noted that the surface texture was measured at the tribo-track location and not on the smooth surface. Ssk (Skewness) is the ratio of the average cube value of the surface ordinates to the cube of the Sq parameter [
23]. Therefore, considering that the parameter Ssk is directly dependent on the parameter Sq, the correlation coefficients were also high. In most cases, parameter Ssk was negative, pointing to the surface with the predominance of valley structures. Moreover, Ssk helps monitor different types of wear conditions [
41]; therefore, it is logical that this parameter can be successfully used to analyze the correlation with the friction coefficient using surface texture measurements in the tribo-track location. Sedlacek et al. [
39] indicated that Ssk is the most dominant parameter affecting friction at the boundary or lubricated conditions, experimenting with ground and polished samples of different surface roughness.
Parameters such as Vmp, Vmc, and Sk have been described in previous studies as parameters affecting wear and friction [
23]. Vmp is the peak material volume, representing the volume of material comprising the surface from the height corresponding to a material ratio level p to the highest peak [
41]. In this case, the default p-value of 10% of the highest point was used in the measurements. The surface’s core height characterizes Sk or core roughness with the predominant peaks and valleys removed. In the future, these correlations should be considered cautious when analyzing the surface at different levels. In this case, the functional parameters were calculated using default material ratios of 10 and 80%. Moreover, compared with the amplitude parameter group, the correlations of functional parameters are not so unambiguous; for example, in the case of Vmp, Vm, and Vmc, correlations below 0.5 were observed for the NSC 2 sample.
Hybrid and spatial surface texture parameter groups showed low correlations for different coatings observed in opposite directions. Considering that isotropic surfaces with the same character were studied, it is impossible to observe sufficient spatial parameter changes between the samples, resulting in correlations in opposite directions. In future studies, the number of samples will be increased; therefore, it is possible that a high correlation could be observed for other 3D surface parameters as well, such as the hybrid parameters Sdr and Sdq, which are affected by both surface texture amplitude and spacing, and can also be successfully used in surface contact, friction and wear characterization [
23,
25].
3.5.2. Correlation Dependence between Microhardness and Surface Texture
The correlation between the microhardness of the coated samples and the surface texture parameters for the smooth surface (see
Table A1 in the
Appendix A) was determined at a force of 0.1 N (see the microhardness values in
Table A3 in the
Appendix A). The force was chosen as the lowest technologically possible for the particular equipment Micro-Vickers indenter HM210D (Mitutoyo, Kawasaki, Japan). The penetration depth of the indenter was measured up to approximately 0.5 μm, which exceeds the maximum surface height Sz of the studied samples; therefore, the surface irregularities affect the measurement results indirectly.
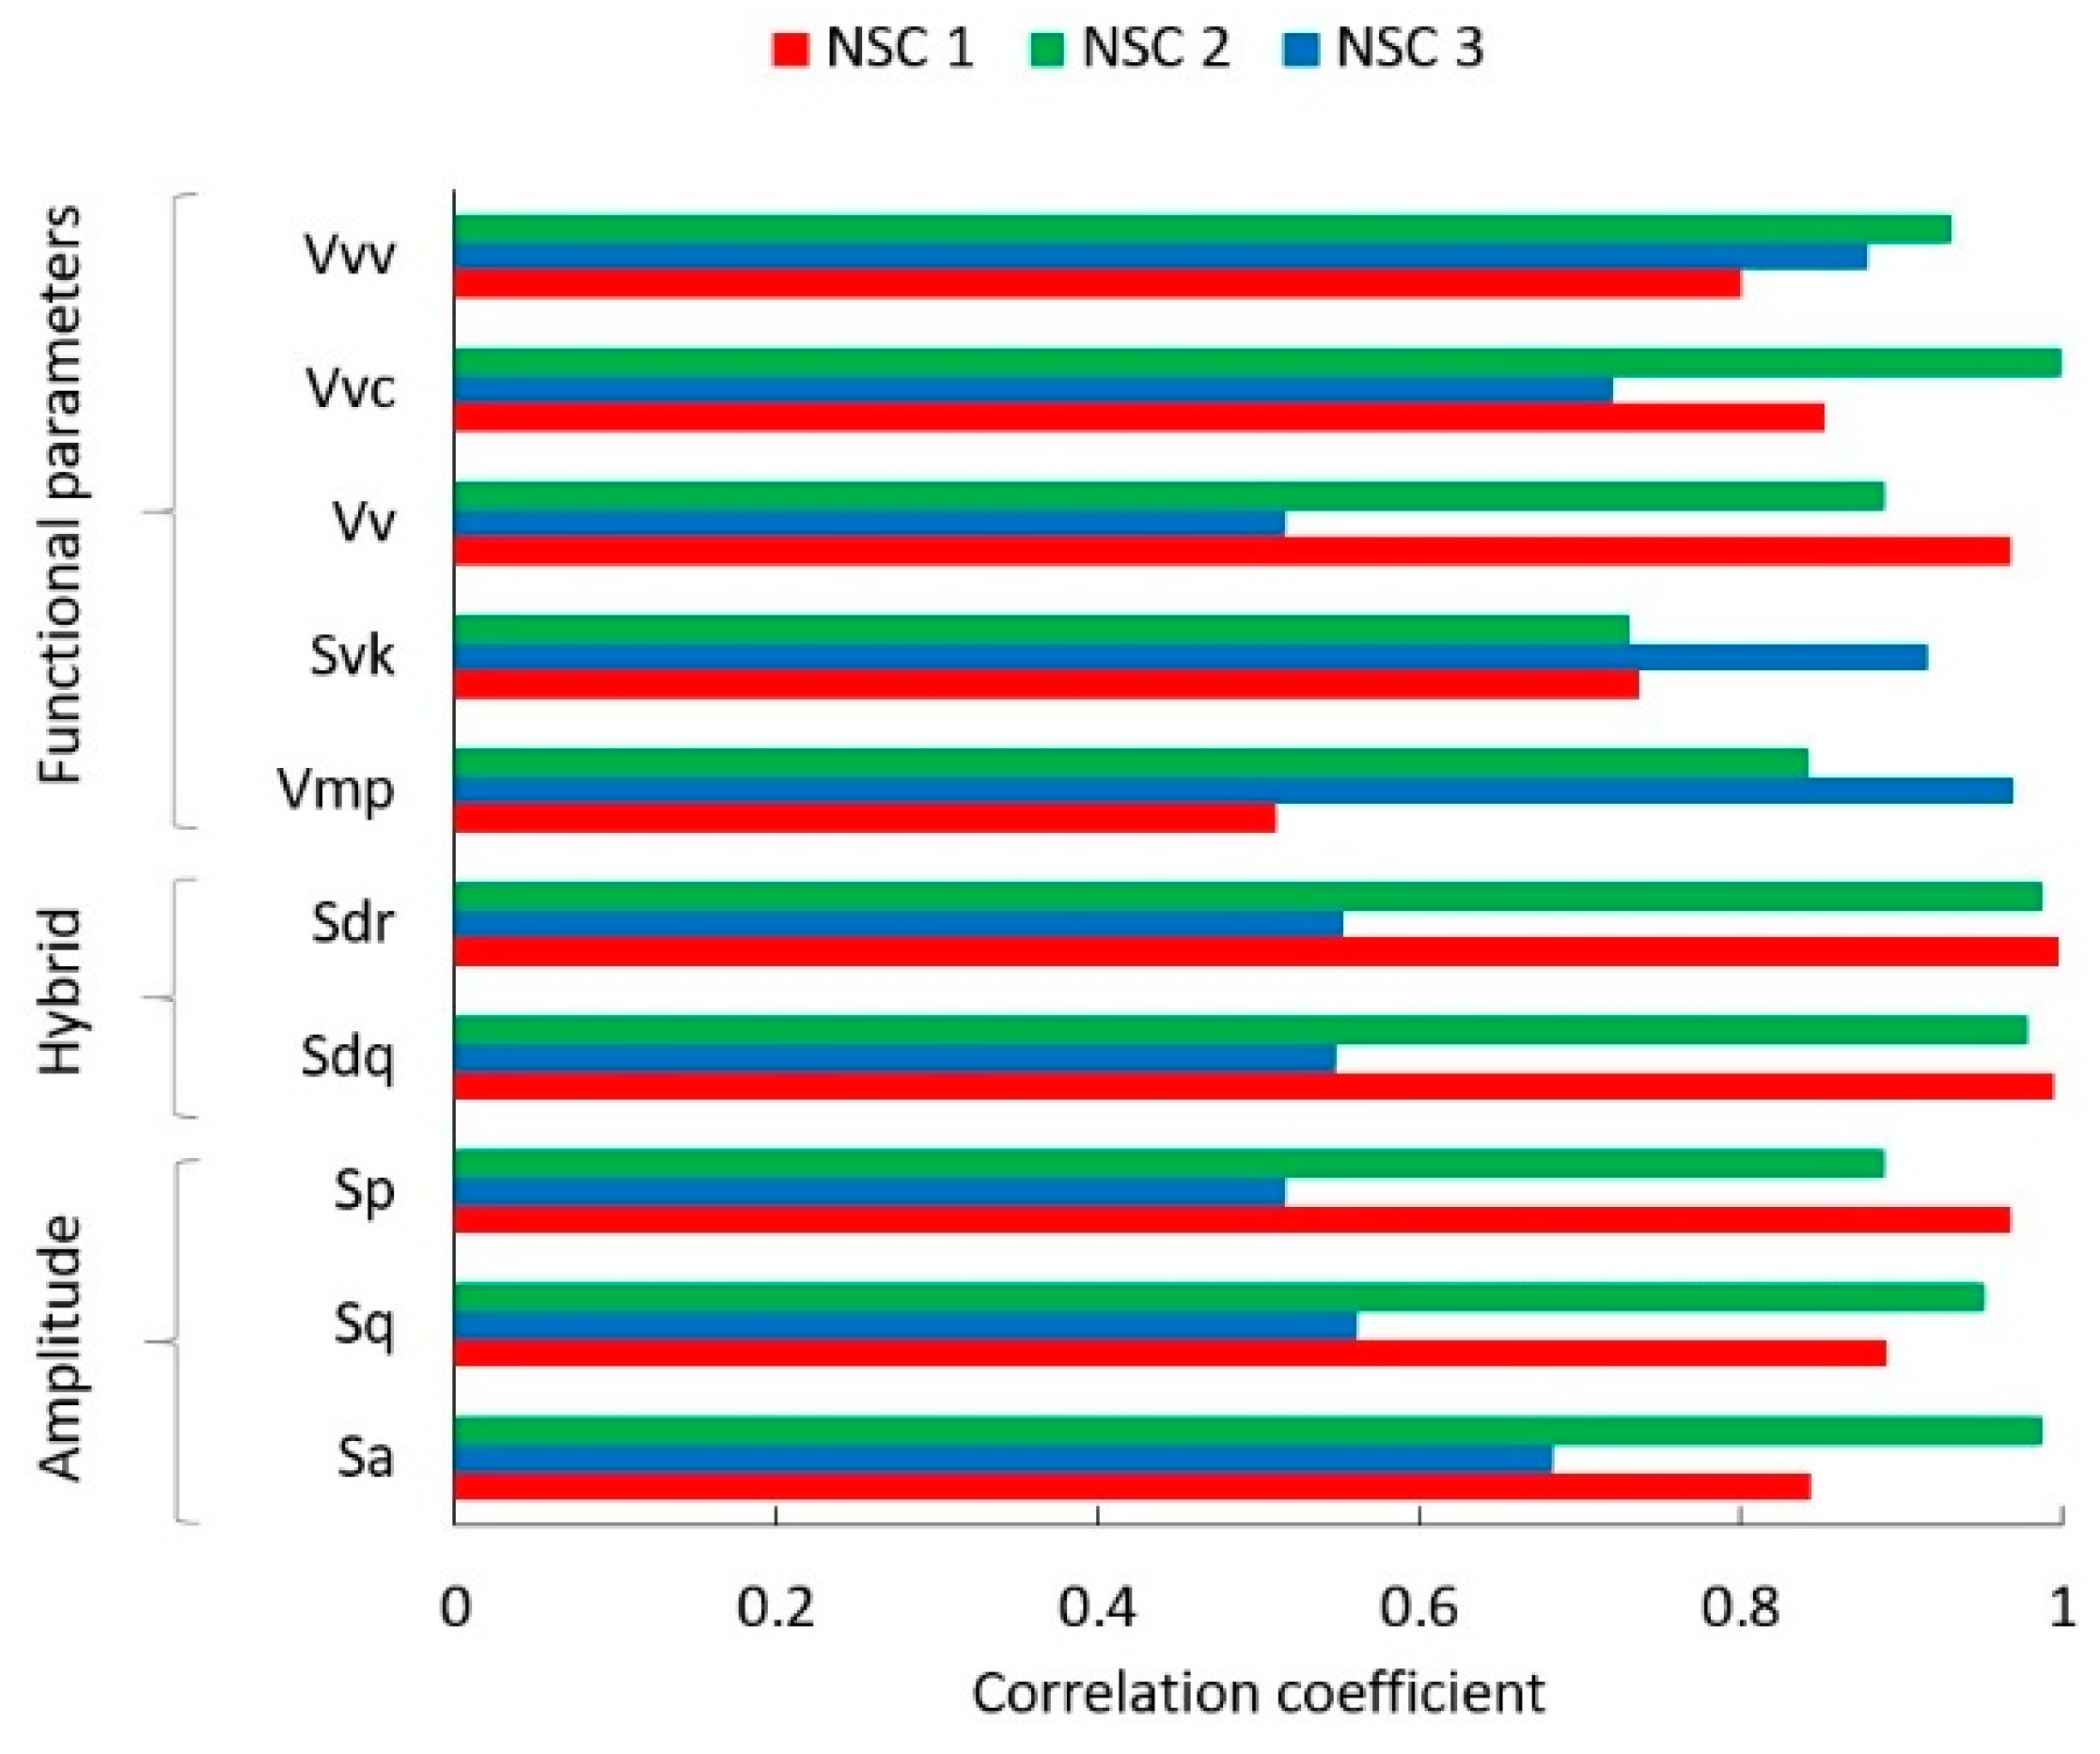
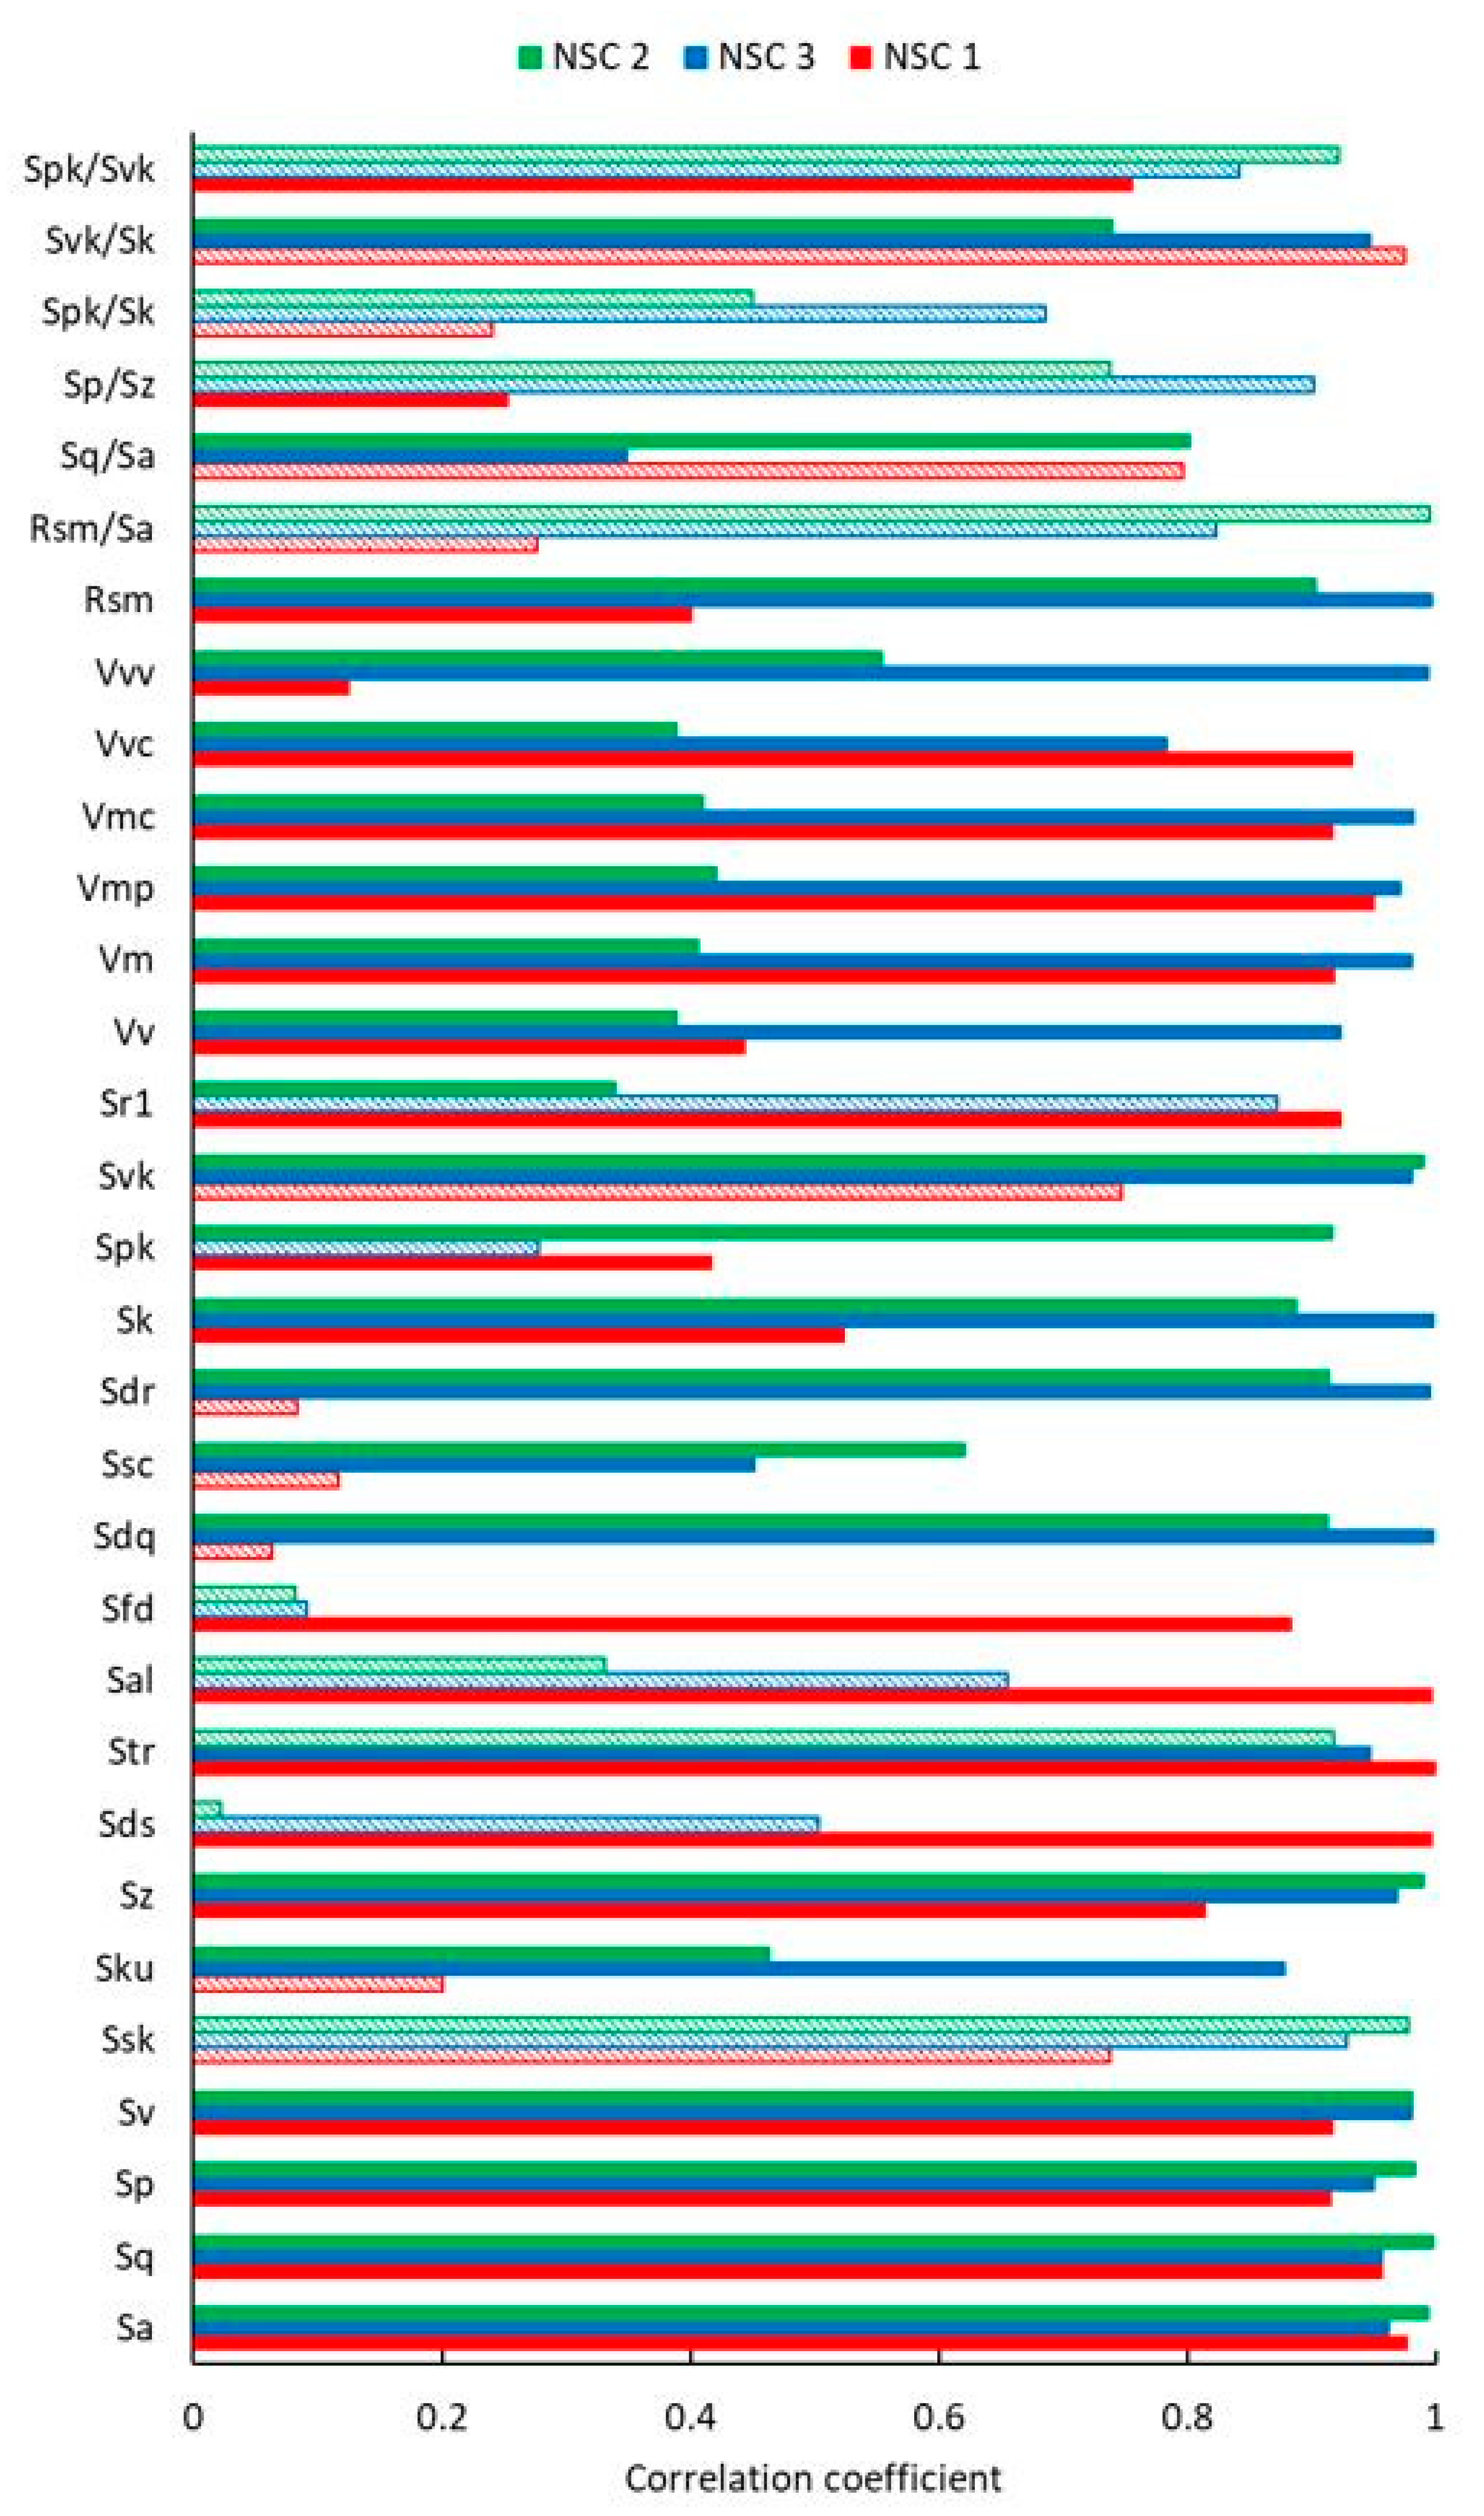
Figure 10 summarizes the TOP 10 highest correlation coefficients for the surface texture parameters of the samples against the microhardness values at 0.1 N for each Coating (NSC 1—red, NSC 2—green, NSC 3—blue), where each coating includes three samples. A complete graph of the correlation coefficients is shown in
Figure A2 in
Appendix A.
From the
Figure 10 data, it can be concluded that, similarly to the friction coefficient, high correlations have been obtained with the parameters related to the material ratio curve and amplitude parameters Sa, Sq, Sp. It was observed that the hybrid parameters Sdr and Sdq also correlate well. The surface texture parameter Sdq is highly dependent on the Sq parameter, while the Sdr parameter is dependent on the Sdq parameter [
23]; thus, the correlations for the hybrid parameters are also high.
However, the correlation bars indicate that a rougher surface results in higher microhardness, which contradicts previous studies such as Kulej et al. [
32] work which described the surface texture and nanohardness of Cu/Ni multilayer structures and obtained that lower Ra (profile roughness height) provides higher hardness. Opposite results were obtained by Bohme et al. [
30], where polished surfaces (Ra 2–3 nm) and milled surfaces with traces of machining (Ra 126–240 nm) were produced. The hardness reached 5.7 GPa for the post-polished surface and 7.2 GPa for the machined surface. The error of measurement results for machined surfaces was observed above 40%. Bohme emphasized that it is essential to characterize the surface directly at the indentation point because when indenting at the peak, the material appears softer; when measured in the valley, it appears harder.
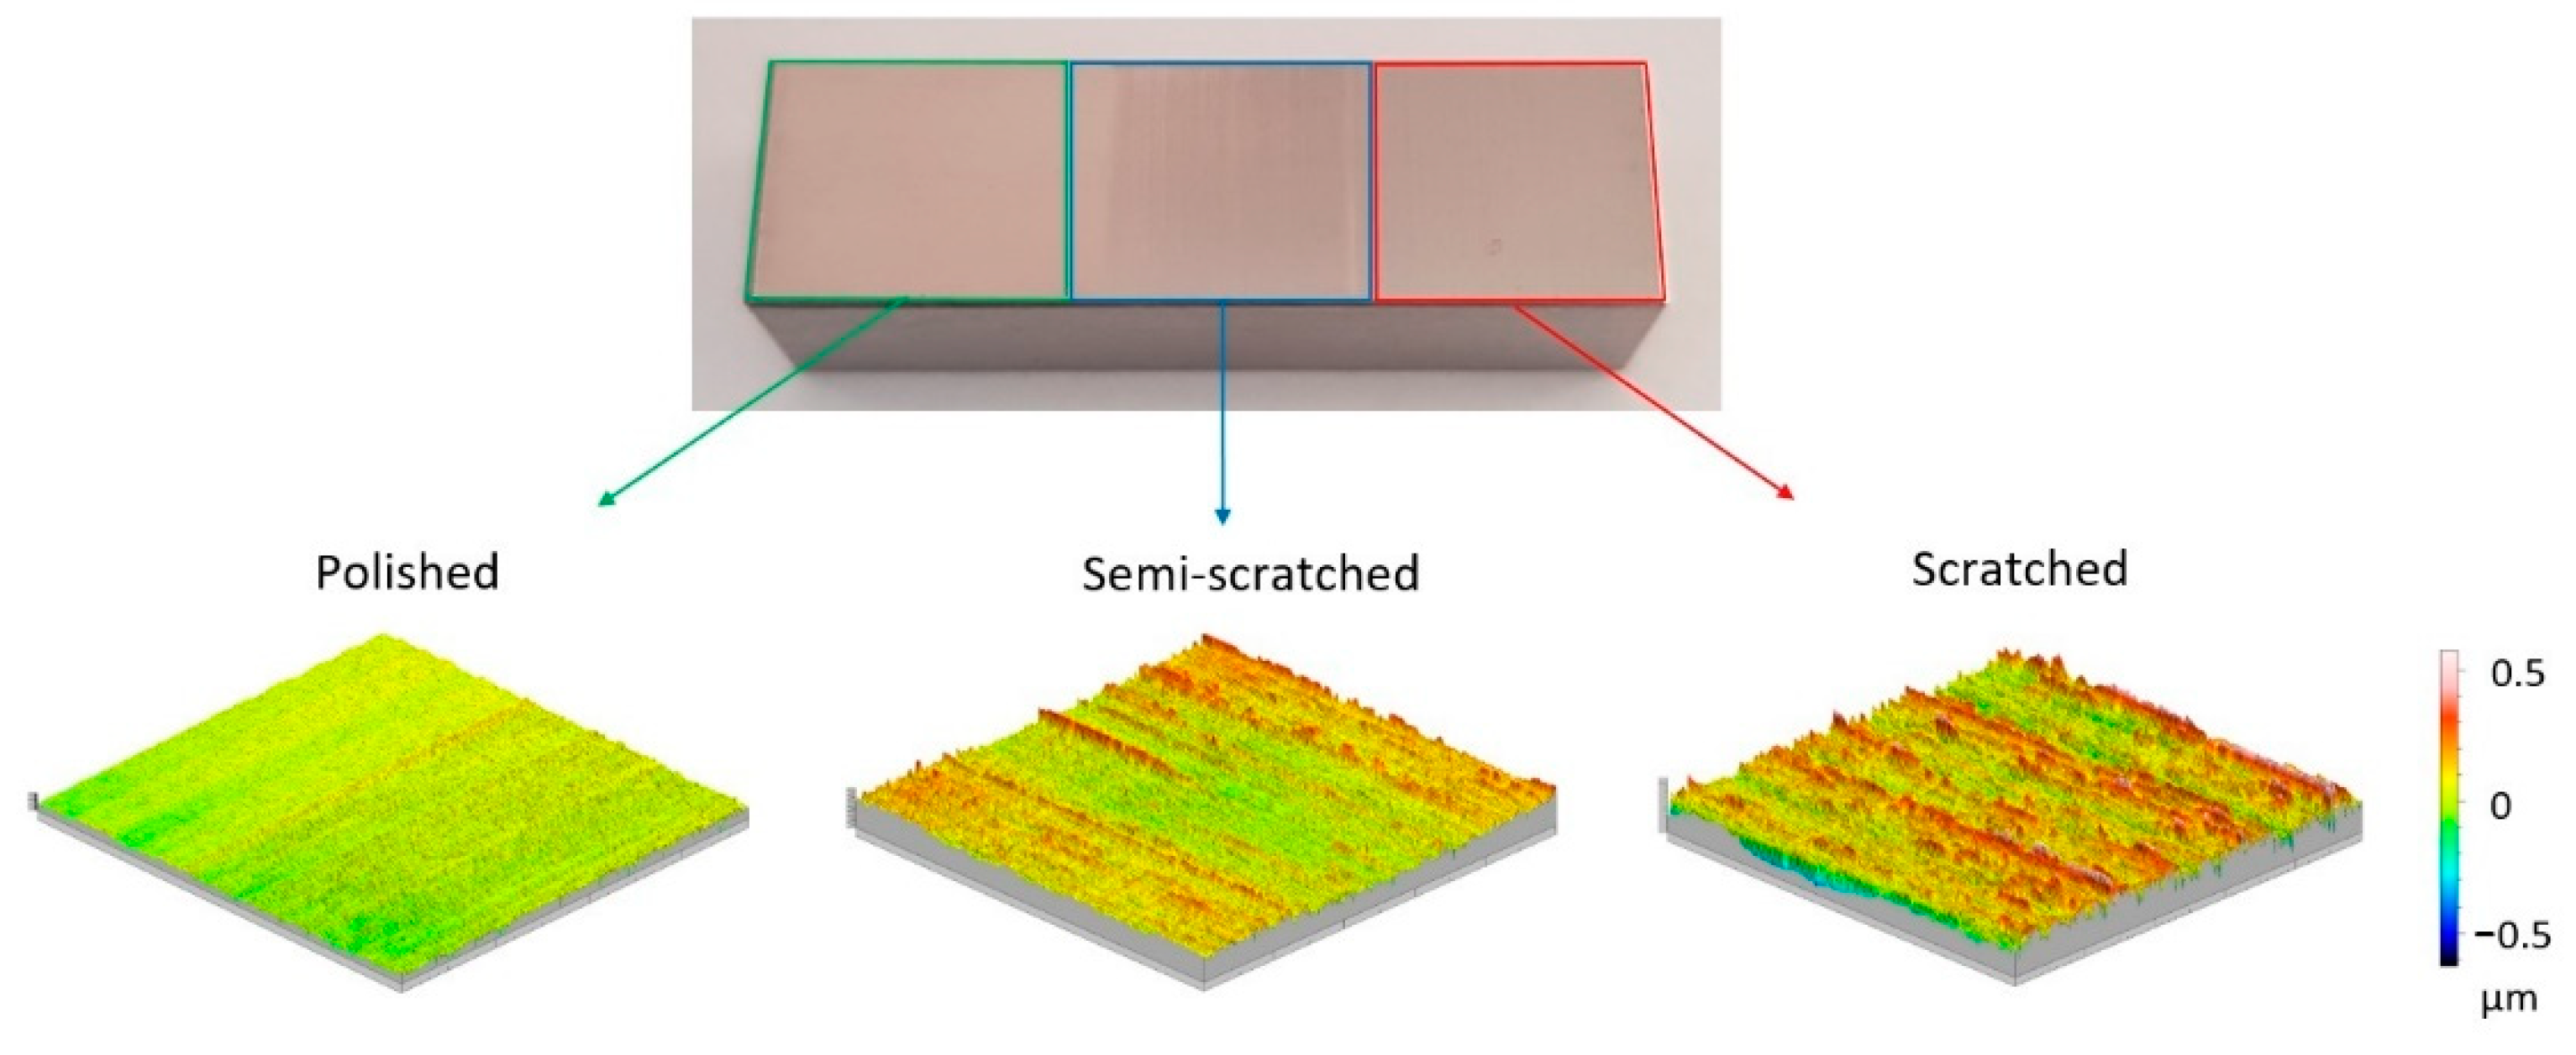
Considering obtained results, an additional experiment was performed, creating three surfaces of different roughness on one rectangular sample with dimensions—30 × 9 × 7.5 mm and material—100Cr6. The sample was polished to Sa 0.04 µm, part of the sample was scratched with 1500 grit sandpaper to Sa 0.06 µm, and another part of the sample was scratched with 600 grit sandpaper to Sa 0.1 µm (see
Figure 11). Surface texture measurements were made with the same 3D profilometer and settings as for the samples discussed above.
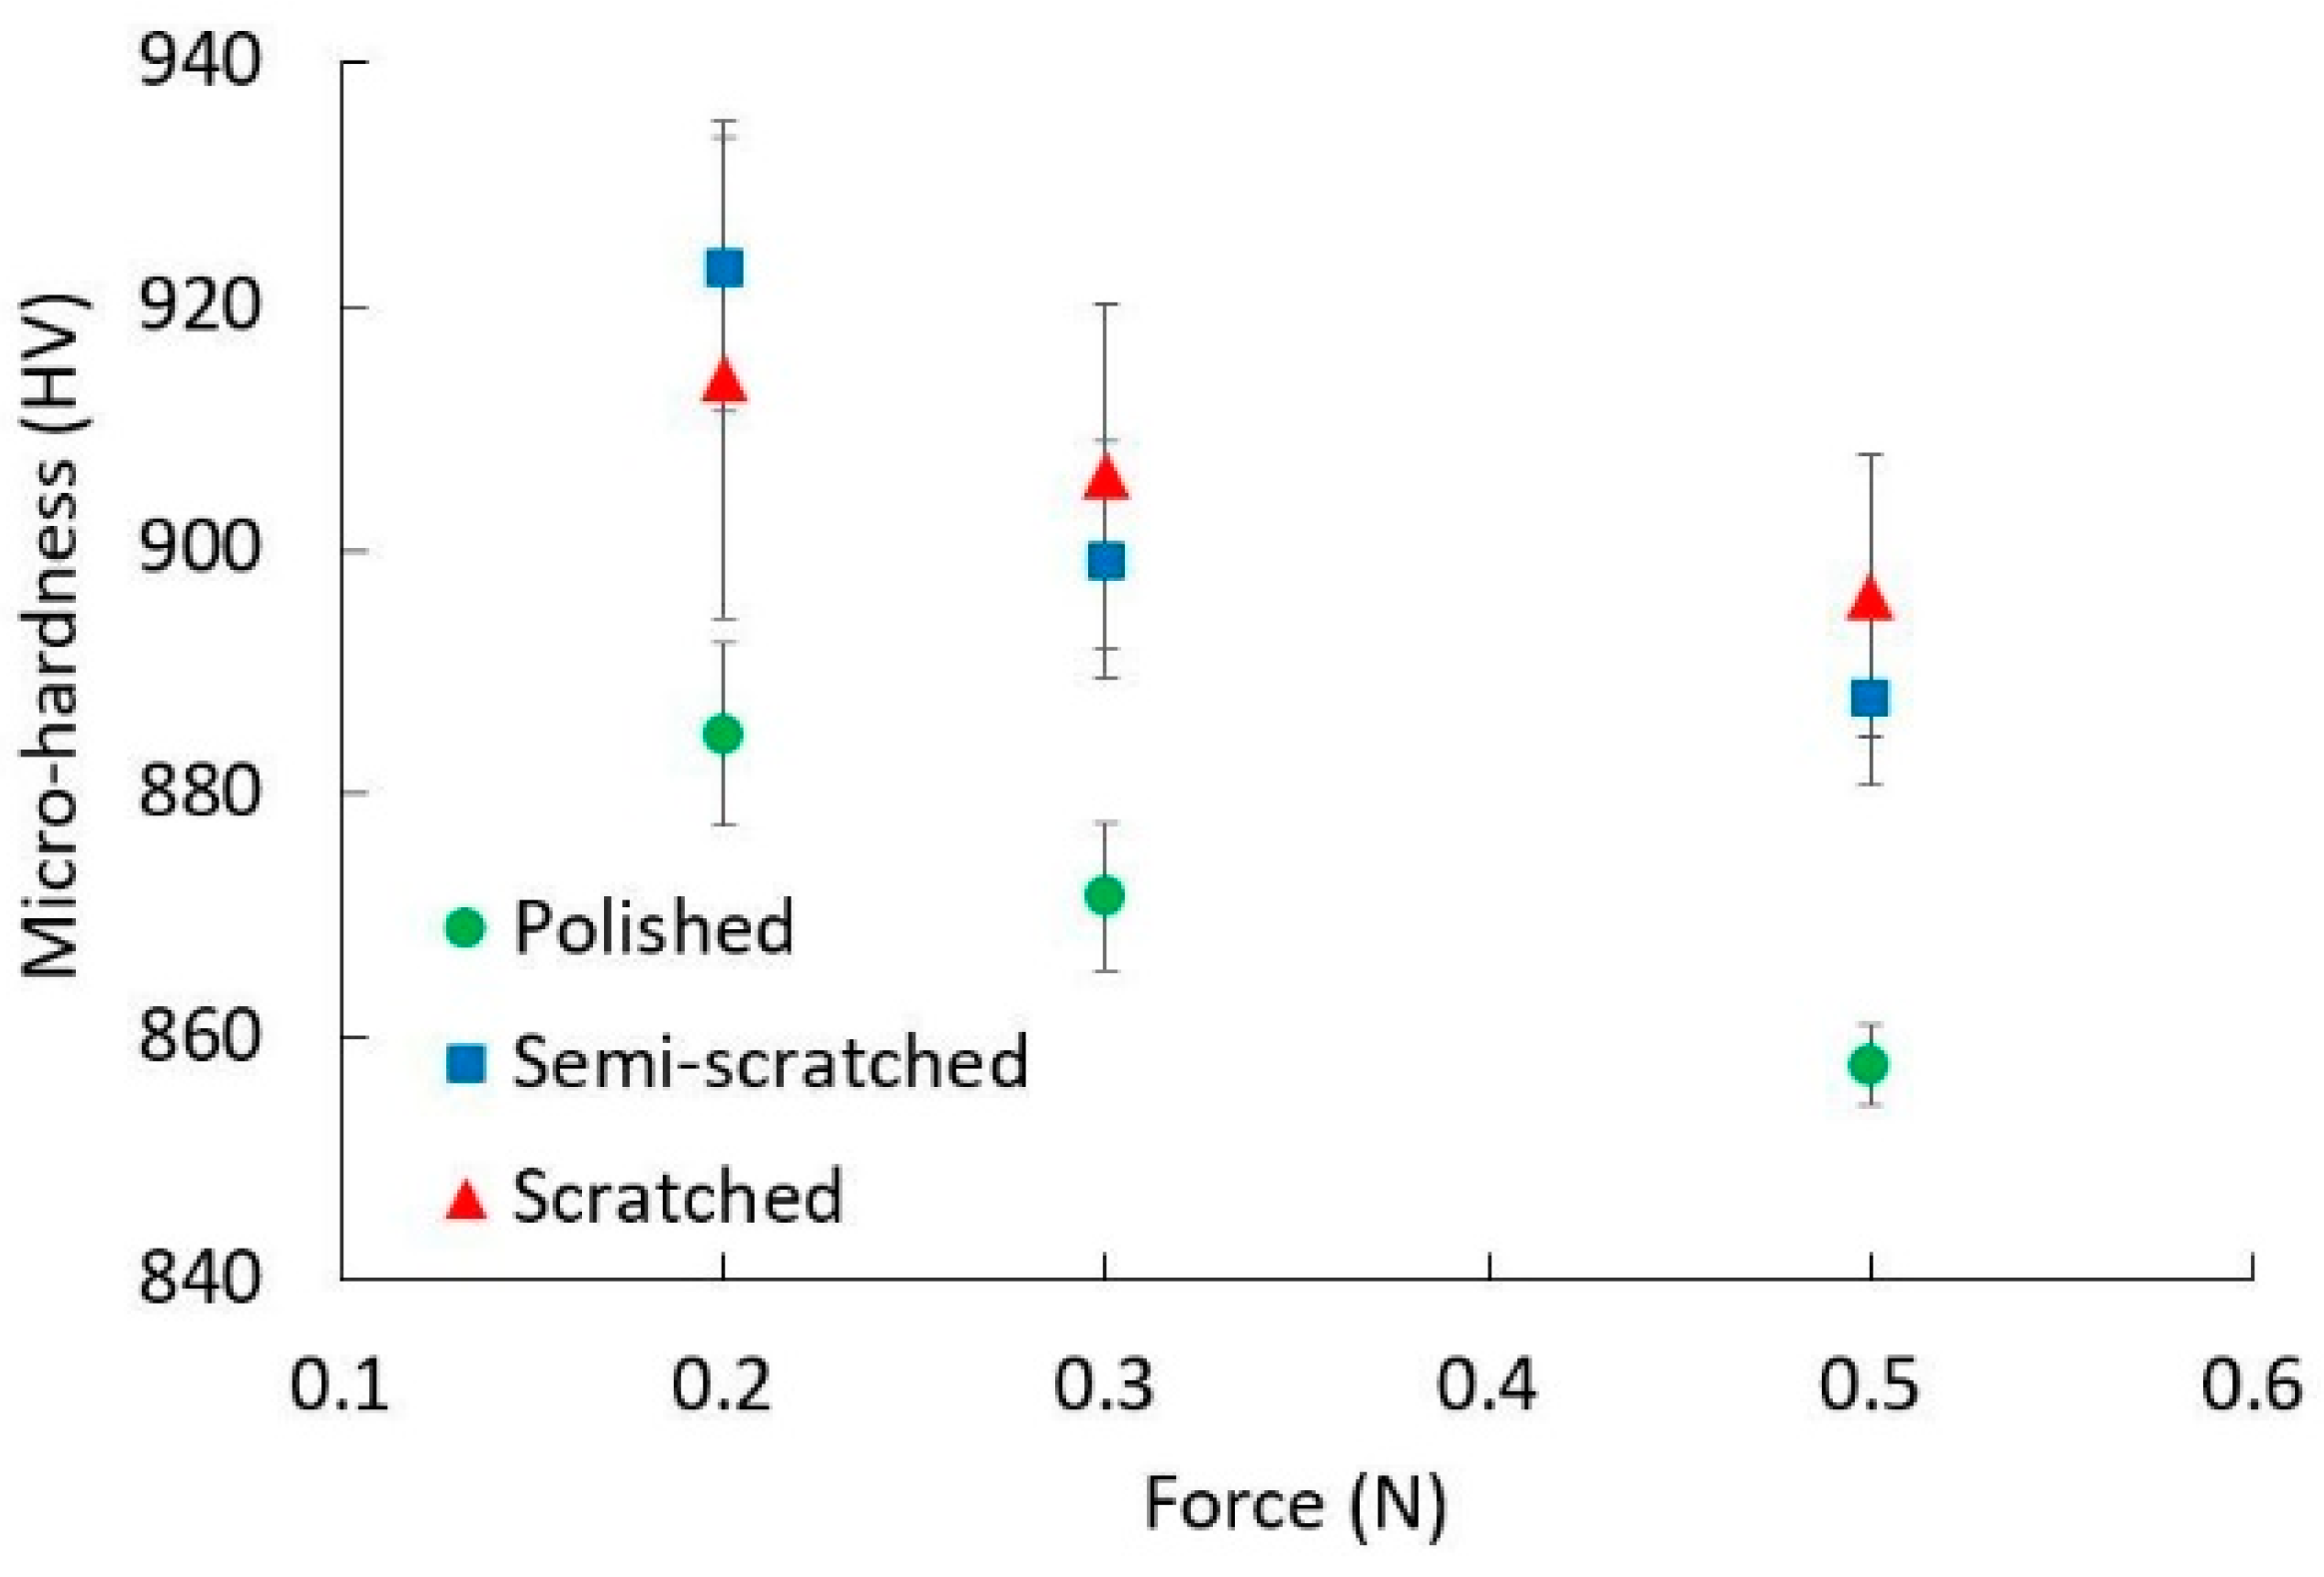
Microhardness measurements were performed with a Micro-Vickers indenter HM210D (Mitutoyo, Kawasaki, Japan), using 0.2, 0.3, and 0.5 N indentation force. A higher measurement force than in previous experiments was used because the surface roughness is higher than the investigated nano-coated samples, and so the indentations can be analyzed with a contact type 3D profilometer Talysurf Intra 50 (Taylor Hobson, Leicester, UK).
The obtained microhardness measurement results can be seen in
Figure 12. Each measurement point is calculated as the average of 15 measurements. Unexpectedly, the lowest hardness values were obtained for the polished sample, reaching a difference with the scratched ones of about 40 HV. Moreover, the standard deviations for scratched and semi-scratched surface parts are higher than for polished. That indicates that the measurement error for rougher surfaces tends to be higher, as observed by Bohme [
30]. The result agrees with Bohme et al. but is the opposite of what Kulej et al. observed.
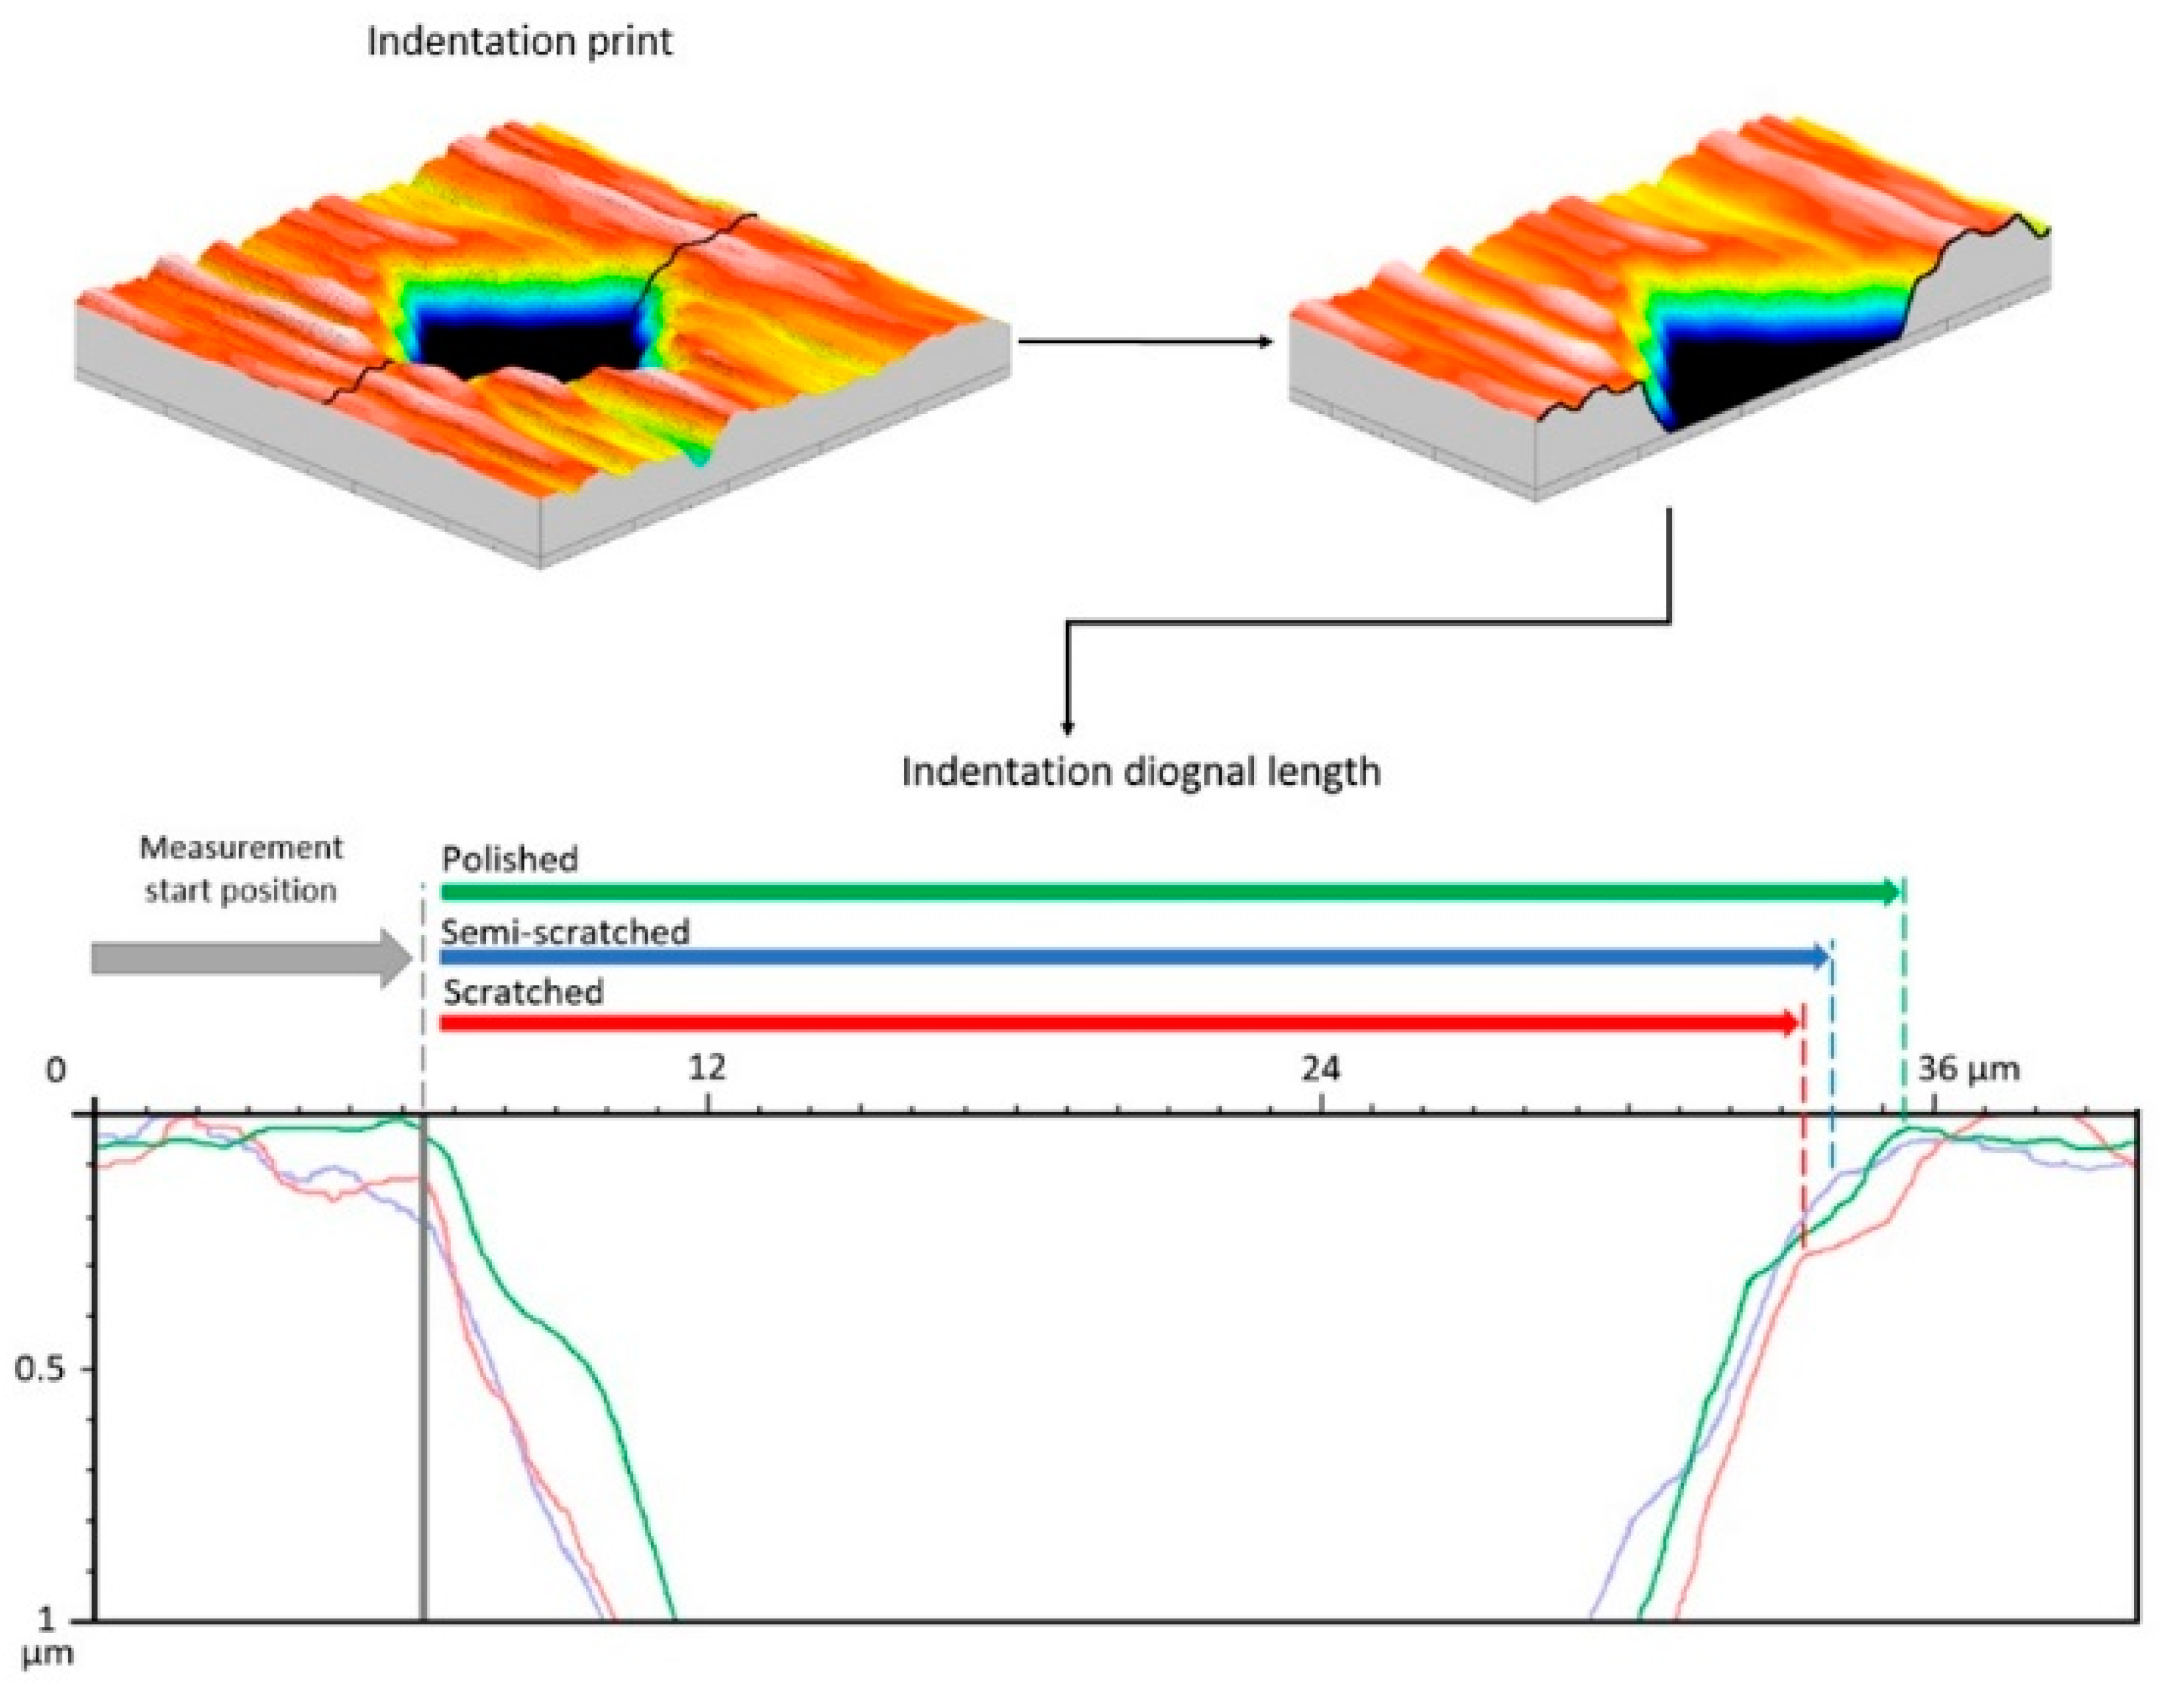
After the microhardness measurements, a 3D measurement of the surface texture of the indentations was performed (see
Figure 13). A 2D profile was cut from the surface measurement midway through the indentation and perpendicular to the machining marks for all three surfaces. In the graph, the left measurement limit (measurement start position) for all three surfaces is defined as the reference limit, and the profiles are arranged accordingly. The arrows indicate the approximate length of measured indentation diagonals. According to the profile data, it can be seen that the limits of indentation measurements can be clearly defined for a polished surface (green profile), but for the scratched and also semi-scratched sample, the measurement limit is more challenging to define because surface roughness prevents it from being accurately determined. It can even be seen that, most likely, the measurement limits for the scratched and semi-scratched surfaces indicate a smaller length of the indentation profile along the
X-axis than it is for the polished surface. Considering the obtained information, it can be concluded that surface texture quality is critically important when performing hardness measurements with a visual reading of measurements.
In the case of Nano-coated samples, although seemingly logical parameters related to surface volume and amplitude correlate with surface hardness, the differences in surface roughness are too small to find a reliable relationship between hardness and surface texture. Such a study could be developed with surfaces of markedly different roughness, as demonstrated in an additional study above. However, if the hardness is measured by a visual measurement method, the subjective assumption of the operator when determining the indentation limits has a significant impact on the processing of the measurement data, especially if the surface roughness is high. Similar to the classic hardness indentation, where the hardness is measured depending on the displacement [
45], the impact of the surface texture on the hardness measurement results can be observed using the visual microhardness measurement method. As the surface roughness increases, the accuracy of microhardness measurements decreases.
3.6. Procedure for Measuring and Evaluating the Surface Texture, Tribological and Mechanical Properties of Deposited Nanocoating
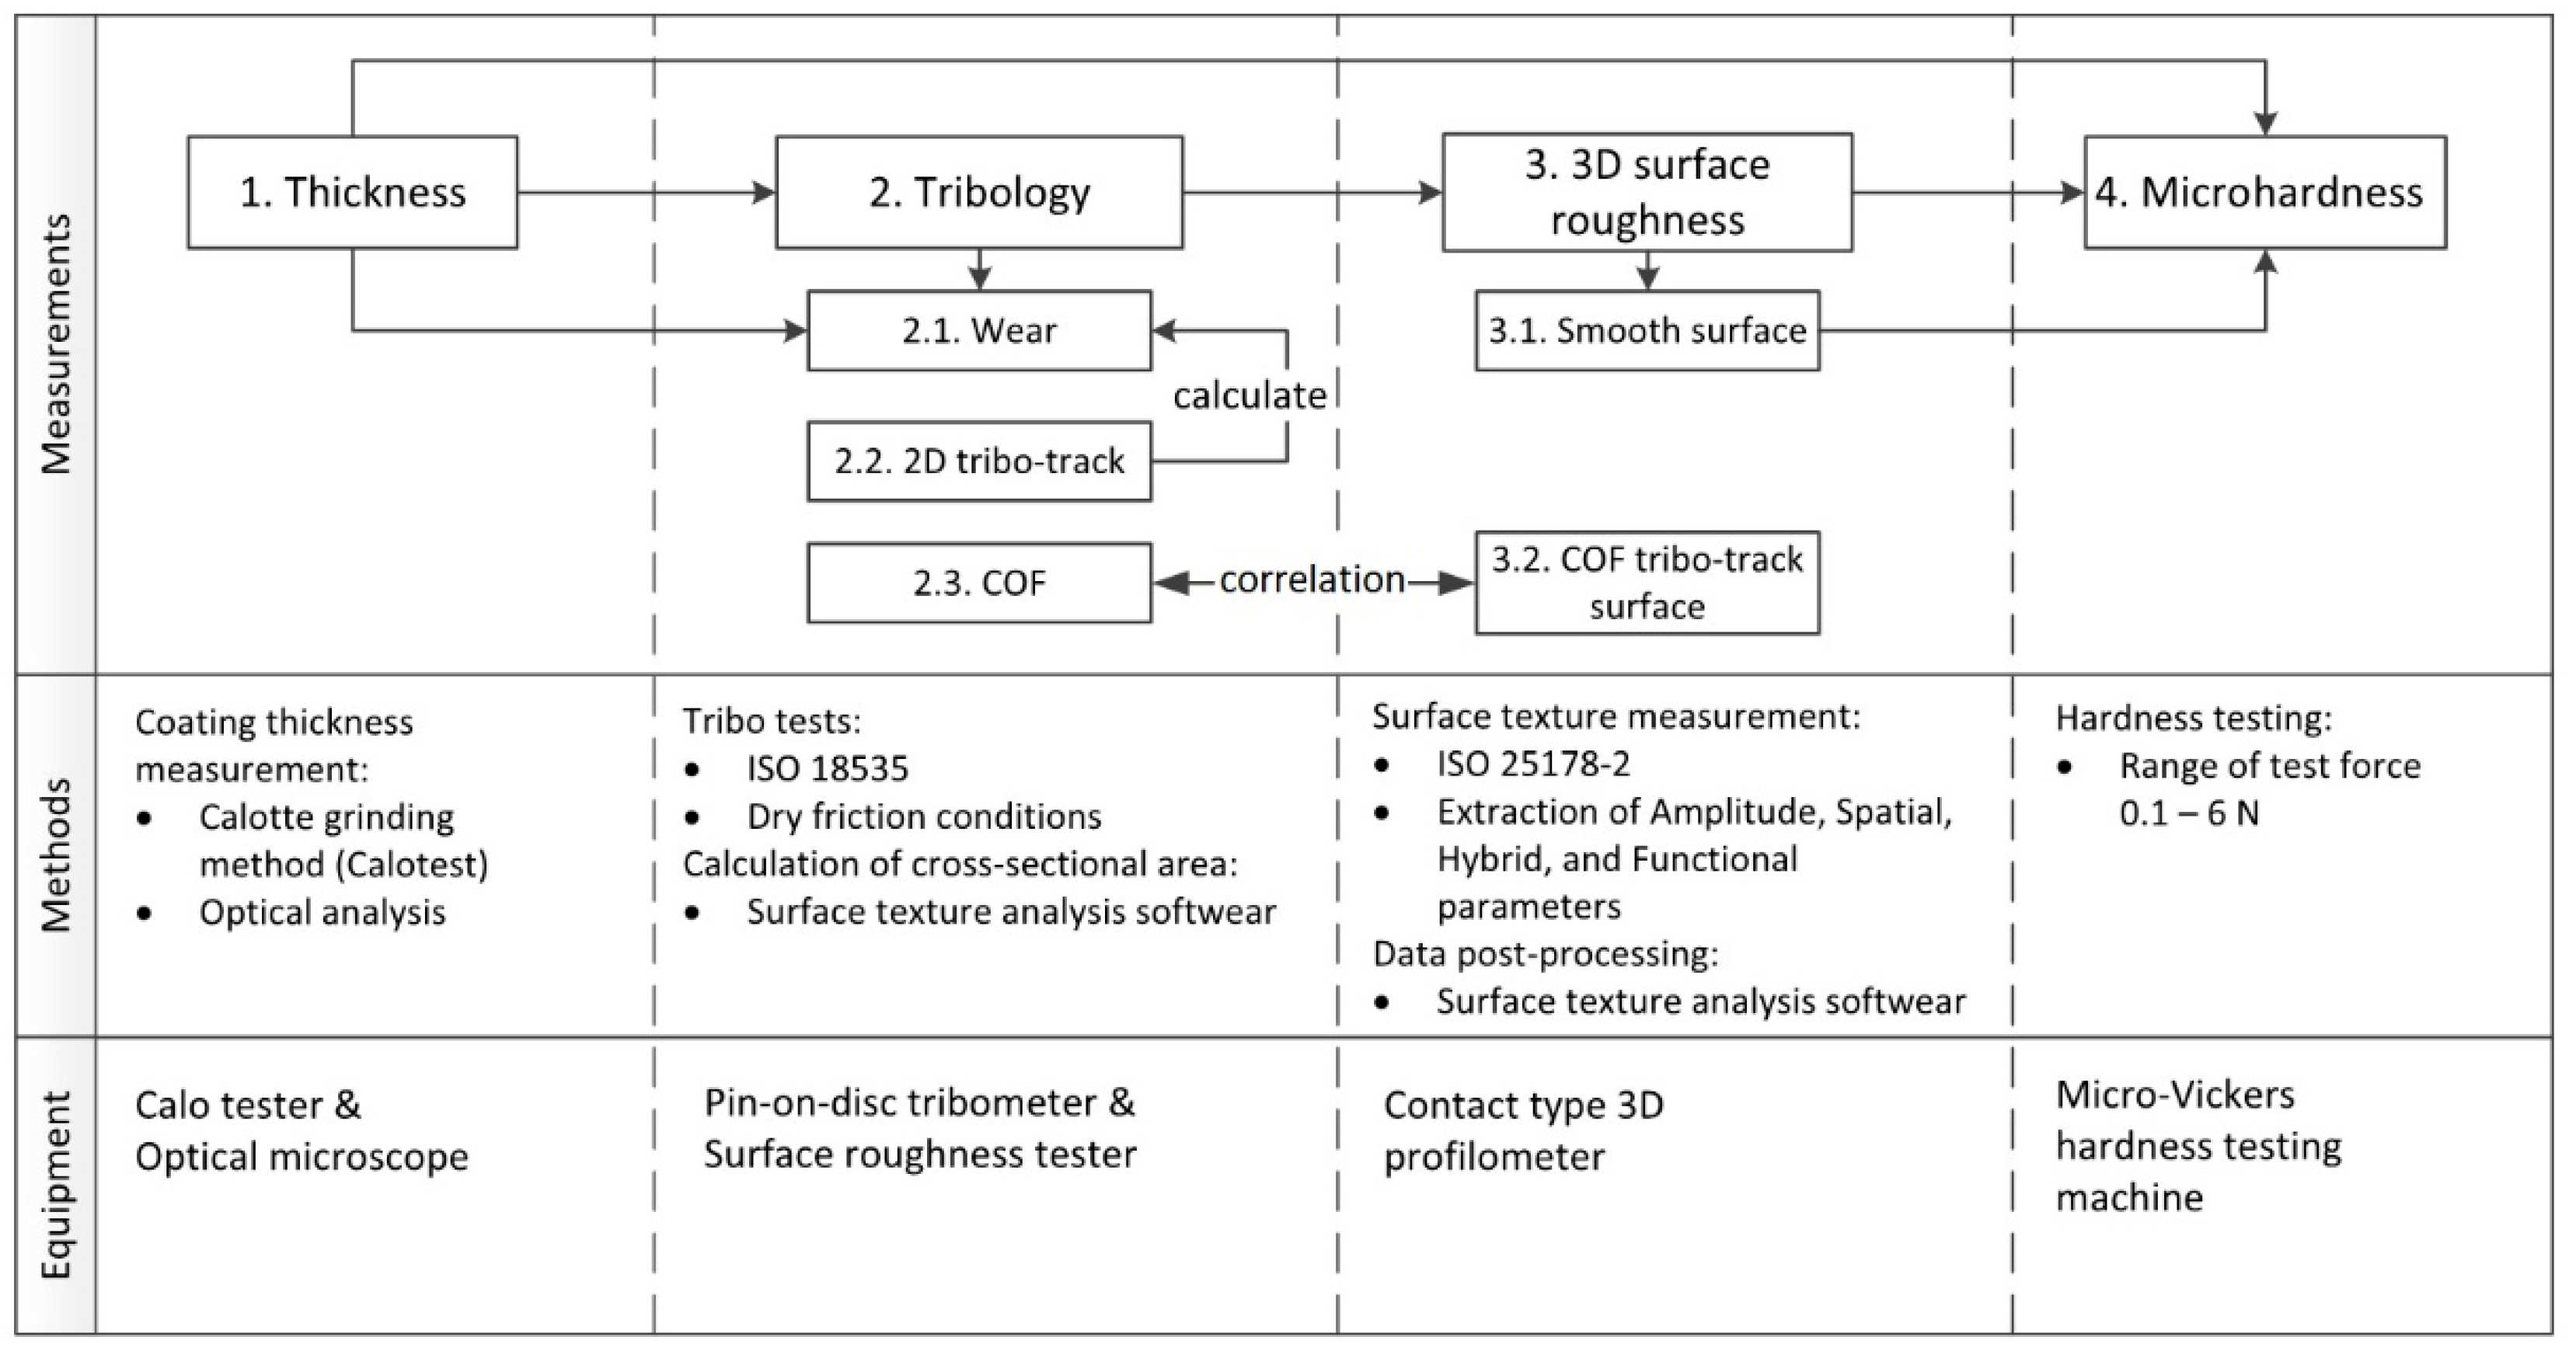
The proposed measurement procedure is intended to analyze nanocoatings and is created based on a holistic approach using three different coatings deposited on a 100Cr6 substrate. The schematic representation of the measurement procedure in
Figure 14 and the description below contain the proposed main steps to measure and evaluate nanocoatings. The principles for developing the surface texture measurement procedure were based on the ISO 10012 standard recommendations. A clause 7.2.2 (Measurement process design) provides the set of guidelines that were taken into account when specifying the measurement processes. Before the measurement procedure was designed, the following elements were considered—necessary measurements, the methods of measurement, and the required equipment for measurements. All three essential elements have been incorporated into the scheme as horizontal dimensions covering the entire measurement process. More specific and detailed information on applied methods is described in the relevant paragraphs of this paper.
Initially, it is necessary to determine the thickness of the coating, which can be performed with the standard Calo-tester and an optical microscope. Knowing the thickness of the coating can then evaluate the wear properties of the coating, as well as analyze the microhardness measurements.
Tribology experiments are performed for friction coefficient and wear measurements according to the settings recommended in the ISO 18535 standard. The friction coefficient measurements determine friction properties; the wear measurements determine the coating’s durability. Wear can be measured using a 2D profilometer, obtaining the cross-sectional area or/and calculating the total wear. The recommended number of profiles starts from four at a constant angular distance.
The 3D surface texture measurement is performed for the smooth surface part and the tribo-track part of the friction coefficient. Three-dimensional surface texture measurement provides more accurate and complete information about the surface. The measurement of the smooth part allows to estimate of the surface texture of the coating and can also be used for further analysis of the surface microhardness. The tribo-track surface texture measurement of the friction coefficient showed a high correlation with the steady-state friction coefficient values, which makes it possible to analyze the relationship between the friction coefficient and the surface texture. In this case, the texture of the smooth surface did not show significant differences between the different samples, so no correlation was established.
Microhardness measurements are recommended to be performed in the broadest possible indentation force range, thereby determining the integrated hardness (Coating + Substrate) for each sample.
The developed procedure for measuring and evaluating nanocoatings systematically collects the most important information about the surface, tribological, and mechanical properties. The procedure will be further improved and refined by performing more measurements with different nanocoatings. One of the recommended measures to improve the procedure would be to define what skills are required for the personnel performing the measurements, as defined in the ISO 10012 standard. As the measurements for this study were carried out in a scientific laboratory by qualified scientific personnel, the skills set for the personnel were not included in this procedure.
4. Conclusions
The above-noted general empirical formula for modified non-stoichiometric NSC based on {TiMe1Me2-CN/TiAlSi-N}n where ‘Me1 and Me2′ denote alloying metallic additives as, e.g., Cr, Nb, W, and Zr but subscript ‘n’ indicates a number of periods within the NSC containing alternating {carbonitride/nitride} sublayers includes numerous modifications of metal-based carbonitride/nitride multilayered ceramic coatings manifesting high wear resistance (up to 28 times against substrate material), low friction coefficient (up to four times against substrate material) and high surface hardness (up to 1.6 times against substrate material).
Microhardness measurements in the applied force range from 0.1 to 6.0 N allow the integrated hardness changes to be evaluated depending on the applied force. As the applied indentation force increases, the impact of the coating on the result of the microhardness measurement decreases. At 6.0 N applied force, the measured microhardness values of the coated samples start to converge with the microhardness value of the substrate (the difference is less than 8%).
The surface roughness significantly impacts the results using the visual microhardness measurement method. As the roughness increases, the accuracy of microhardness measurements decreases. The standard deviation decreased approximately two times as applied force increased from 0.2 to 0.5 N, and the standard deviation was almost three times higher for the rougher surface (Sa 0.1 µm) compared to the polished one (Sa 0.04 µm).
High correlation dependence between the steady-state friction coefficient and the amplitude (correlation coefficient above 0.8 in 94% of cases) and functional (correlation coefficient above 0.8 in 67% of cases) surface texture parameters of the tribo-track surface were obtained.
Based on a holistic approach, a procedure for measuring and evaluating nanocoatings was developed at the initial stage, allowing systematic coatings analysis.

 ,
, 


