Article

Vertical Structure of the Milky Way Disk with Gaia DR3

1
Instituto de Astronomía y Ciencias Planetarias, Universidad de Atacama, Copayapu 485, Copiapó 1531772, Chile
2
Institute of Physics, Southern Federal University, Stachki 194, 344090 Rostov-on-Don, Russia
3
Dipartimento di Fisica e Astronomia, Universitá di Padova, Vicolo Osservatorio 3, I-35122 Padova, Italy
*
Author to whom correspondence should be addressed.
Galaxies 2023, 11(3), 77; https://doi.org/10.3390/galaxies11030077
Submission received: 25 April 2023 / Revised: 5 June 2023 / Accepted: 6 June 2023 / Published: 16 June 2023

Abstract

:
Using a complete sample of about 330,000 dwarf stars, well measured by Gaia DR3, limited to the galactic north and south solid angles | b | < 75 ° and up to a vertical distance of 2 kpc, we analyze the vertical structure of the Milky Way stellar disks, based on projected tangential velocities. From selected subsamples dominated by their corresponding population, we obtain the thin and thick disk scale heights as h Z = 279.76 ± 12.49 pc and H Z = 797.23 ± 12.34 pc, respectively. Then from the simultaneous fitting of the sum of two populations over the whole sample, assuming these scale heights, we estimate the thick-to-thin disk number density ratio at the galactic plane to be ρ T / ρ t = 0.750 ± 0.049 , which is consistent with a previous result by the authors: in the galactic plane there is a significant number of thick disk stars, possibly as many as thin disk ones, which also points to the existence of more thick disk stars than generally thought. The overall fit does not closely follow the data for | Z | > 700 pc and points to the presence of more stars beyond the thin disk that cannot be accounted for by the two-disk model.

1. Introduction

The Milky Way (MW) consists of a few observationally easily distinct components, which differ in their spatial distribution, kinematics, and chemical abundances: the bulge, the disk, and the halo. These structures are shared with many other disk galaxies, although in many of them, we had observed the presence of both thin and thick disks. Only 40 years ago, the MW thick disk was discovered by Gilmore and Reid [1] and nowadays this part of the Galaxy is regarded as a significant component for understanding the process of Galaxy formation.
A number of studies have been dedicated to measuring the scale heights of the thin and thick disks, results for the thin disk vary approximately from 120 to 300 pc while those of the thick disk range from 500 to 1900 pc [2,3,4,5,6,7,8,9]. Recently Everall et al. [10] used GAIA EDR3 data to estimate the vertical spatial structure of the Milky Way disk together with the Milky Way halo in the direction perpendicular to the Galactic disk. To take into account the sample incompleteness, Everall et al. [10] used a method, based on the Poisson likelihood function [11]. They find that the density distribution in the Milky Way galaxy perpendicular to the galactic disk can be represented as a sum of two exponential profiles, the thin disk with the vertical scale height of 260 ± 3 (stat) ± 26 (sys) pc, and the thick disk with scale height of 693 ± 7 (stat) ± 121 (sys) pc, together with the power law density distribution in the stellar halo. Similar to Everall et al. [10] we base our study on GAIA EDR3 data, limiting, however, our study to the density distribution perpendicular to the galactic disk within ±2 kpc from the mid-plane of the Galaxy using a complete sample of the main sequence stars with apparent G-magnitudes between 4 and 8, as we further explain below.
Despite the significant efforts made to understand its physical properties, there is no consensus as to its exact origin, although it is agreed the thick disk is the result of the dynamical heating of a pre-existing thin disk produced by either (i) the scattering of thin disk stars by giant molecular clouds [12], (ii) spirals or barred structures [13], (iii) minor mergers of small companion galaxies [14], or (iv) radial migration of stars [15,16]. It has been suggested [17] that the thick disk was formed by stars originating from an accreted disrupted satellite galaxy. On the other hand, others like [18] advocate for a continuous vertical disc structure connected by a series of individual stellar mono-abundance populations that smoothly go from thin to thick with increasing age, whose integrated vertical space density reveals itself as two disks [19]. Models simulations [20,21] indicate that the thick disk is the result of a continuous evolution of the pristine disk stellar population.
The only way to clarify which of the proposed formation scenarios occurred in the MW is a detailed study of the properties of the Milky Way thick disk. To select thick disk stars a few criteria have been suggested: relative abundance of alpha-elements (e.g., [22]), stellar ages (e.g., [22]), or simply a cut in absolute vertical distance at 1–2 kpc beyond the Galactic mid-plane (e.g., [23,24]). Although the thin disk scale height is well below this cut (∼200–300 pc as measured by many authors), positions alone are not good enough to disentangle both populations, and different kinematics and/or abundances cuts are required to achieve so. In this case, scale heights may be measured but the number density ratio within the volume studied, a fundamental quantity to understand the thick disk properties, can not be computed.
In our work, we aim to select a subset of Gaia DR3 stars that fully sample the Galaxy in two solid angles above and below the galactic plane up to a distance of 3 kpc, for which the projected tangential velocity can be used as a safe proxy of the U V -velocities of the stars. Such an approach has been used in the past to study the Milky Way vertical structure and dynamics at larger heights [25], with astrometric data only. Nowadays Gaia data has increased dramatically the number of stars with both astrometry and radial velocities, yet the latter is still measured only for a portion (G ≲ 13) of stars. In any case, Gaia allows us to extend this approach even farther than in past studies, which means we can get more thick disk stars in the volume sampled.
This study is organized as follows: Section 2 explains how the data samples were selected and their completeness assessed, Section 3 is dedicated to the analysis of the vertical profiles at different velocity-cut populations, and Section 4 shows the scale height fits and number density ratio calculations. Section 5 includes a discussion and summarizes our conclusions.

2. Data Selection and Completeness

Data was selected from Gaia DR3 catalog [26] with the following cuts: abs(b) > 75, parallax > 0.3, parallax_over_error > 10, ruwe < 1.4, in_qso_candidates = false, in_galaxies_candidate = false and non_single_stars = 0, yielding a total of 703,272 sources. Parallaxes were corrected as prescribed by [27] using the Python implementation gaiadr3_zeropoint located in https://gitlab.com/icc-ub/public/gaiadr3_zeropoint, accessed on 25 April 2023. From the stars selected, we could make the correction on 703,176 stars, of which 87% have a 5-parameter solution and 13% have a 6-parameter one. With only parallaxes and proper motions, we computed approximated ( U , V ) velocities (U towards the galactic center and V in the direction of galactic rotation) by assuming that the line-of-sight velocity is zero. This can be safely done because in the galactic caps samples selected, its projected contribution to the U and V velocities is small and below the estimated velocity error. To support our assumption, we compared our approximated vs the full ( U , V ) velocities over the subsample for which Gaia DR3 had radial velocities measured (only 23% of the data), we confirmed their differences were small enough. From now on all velocities will refer to the approximated ones or the ones based on them.
A quick analysis of the ( U , V ) velocities with respect to the LSR (see Figure 1), showed a small but non-negligible number of halo stars, lagging in the rotation behind the LSR, which were discarded by rejecting those with U 2 + V 2 180 km s−1. After this cut, the sample is reduced to 684,740 stars. We also found two open clusters easily visible in the polar caps, the Coma Cluster in the north and the Blanco 1 in the south, but their presence does not disturb our results as their number of stars is negligible compared to the overall sample.
From the ( U , V ) velocities, we compute galactocentric cylindrical velocities V R (away from the galactic center) and V ϕ (against galactic rotation) velocities, assuming the following values for the solar motion with respect to the Local Standard of Rest (LSR), the galactocentric tangential motion of the LSR and the solar galactocentric distance: ( U , V , W ) = ( 11.10 , 12.24 , 7.25 ) km s−1 [28], V g , L S R = 244.5 km s−1 and R = 8 kpc. The final cut is made in extinction-corrected absolute magnitude G 0 = phot_g_mean_mag+5log(parallax) −10-ag_gspphot, so that only 339,876 dwarfs stars are selected with the cut 4 < G 0 < 8 (see Figure 2).
Gaia DR3 completeness—based on what is already known for EDR3 [29]—is estimated to be between magnitudes 19 and 21. Assuming a frequently quoted value of completeness down to phot_g_mean = 20.7, then all dwarfs stars with 4 < G 0 < 8 were observed up to a distance of 3.4 kpc, encompassing our two-cones volume. But completeness can be compromised since we applied quality cuts (parallax_over_error, ruwe, non_single_stars). Therefore we further check the completeness of our disk dwarf stars sample as in [30]. The cumulative distribution of the squared cylindrical radius centered at the Sun of the stars is evaluated along Z over a flat cylinder volume or coin, whose radius increases as Z grows farther from the plane following the shape of the cones. Sampling is complete when the distribution at each coin is uniform. An estimation is made of the incompleteness at each coin, as computed by [30], and shown in Figure 3.
Our sample incompleteness is below 1% within 2 kpc vertically from the galactic plane but gets higher further away. The grey line in Figure 3 is the histogram of the vertical positions of the stars in the sample, measured every 100 pc, and shows the expected two-maxima distribution for the two-cones volume sampling, notice nonetheless the asymmetry in the count numbers, which has been detected in the past by other authors, including [30]. There are very few stars within 100 pc from the galactic plane, as expected from the volume shape being sampled: two opposing cones with vertex at Z = 0 . The smaller number of stars closer to the plane and the smaller volume being sampled make the density calculations very unstable and prone to errors and that is why we avoid the Galactic plane ( | Z | < 100 pc) for density calculations. Finally, considering the large variation in completeness beyond 2 kpc vertically away from the galactic plane, we limit the sample of disk dwarfs stars to those vertically within ± 2 kpc from the galactic plane, therefore our final sample has 337,859 stars.

3. Vertical Distribution for Different V ϕ Populations

In our disk dwarfs sample, we examine the histograms of Z (vertical distribution) for different subsamples defined by intervals of V ϕ of 20 km s−1 width. We see that the vertical distribution of the subsamples change depending on their mean rotation velocity around the MW. In Figure 4, we plot the Kernel Density Estimation1 (KDE) of such histograms using the Python package seaborn.kdeplot (bw_method = 0.1, cut = 0).
We see the expected widening as the subsamples transition from faster (thin disk) to slower rotation (thick disk). Particularly, we notice that subsamples in 280 < V ϕ < 200 km s−1 share a similar shape concentrated around the galactic plane (thin disk), while the subsamples in 140 < V ϕ < 60 km s−1 (thick disk) share a much wider shape. The subsamples in between exhibit changing profiles with mixed characteristics. We also notice that the fastest rotating sample with 300 < V ϕ < 280 (dashed line in Figure 4) exhibits a significant north-south asymmetry, reason for which we opt not to include it in the thin disk sample.

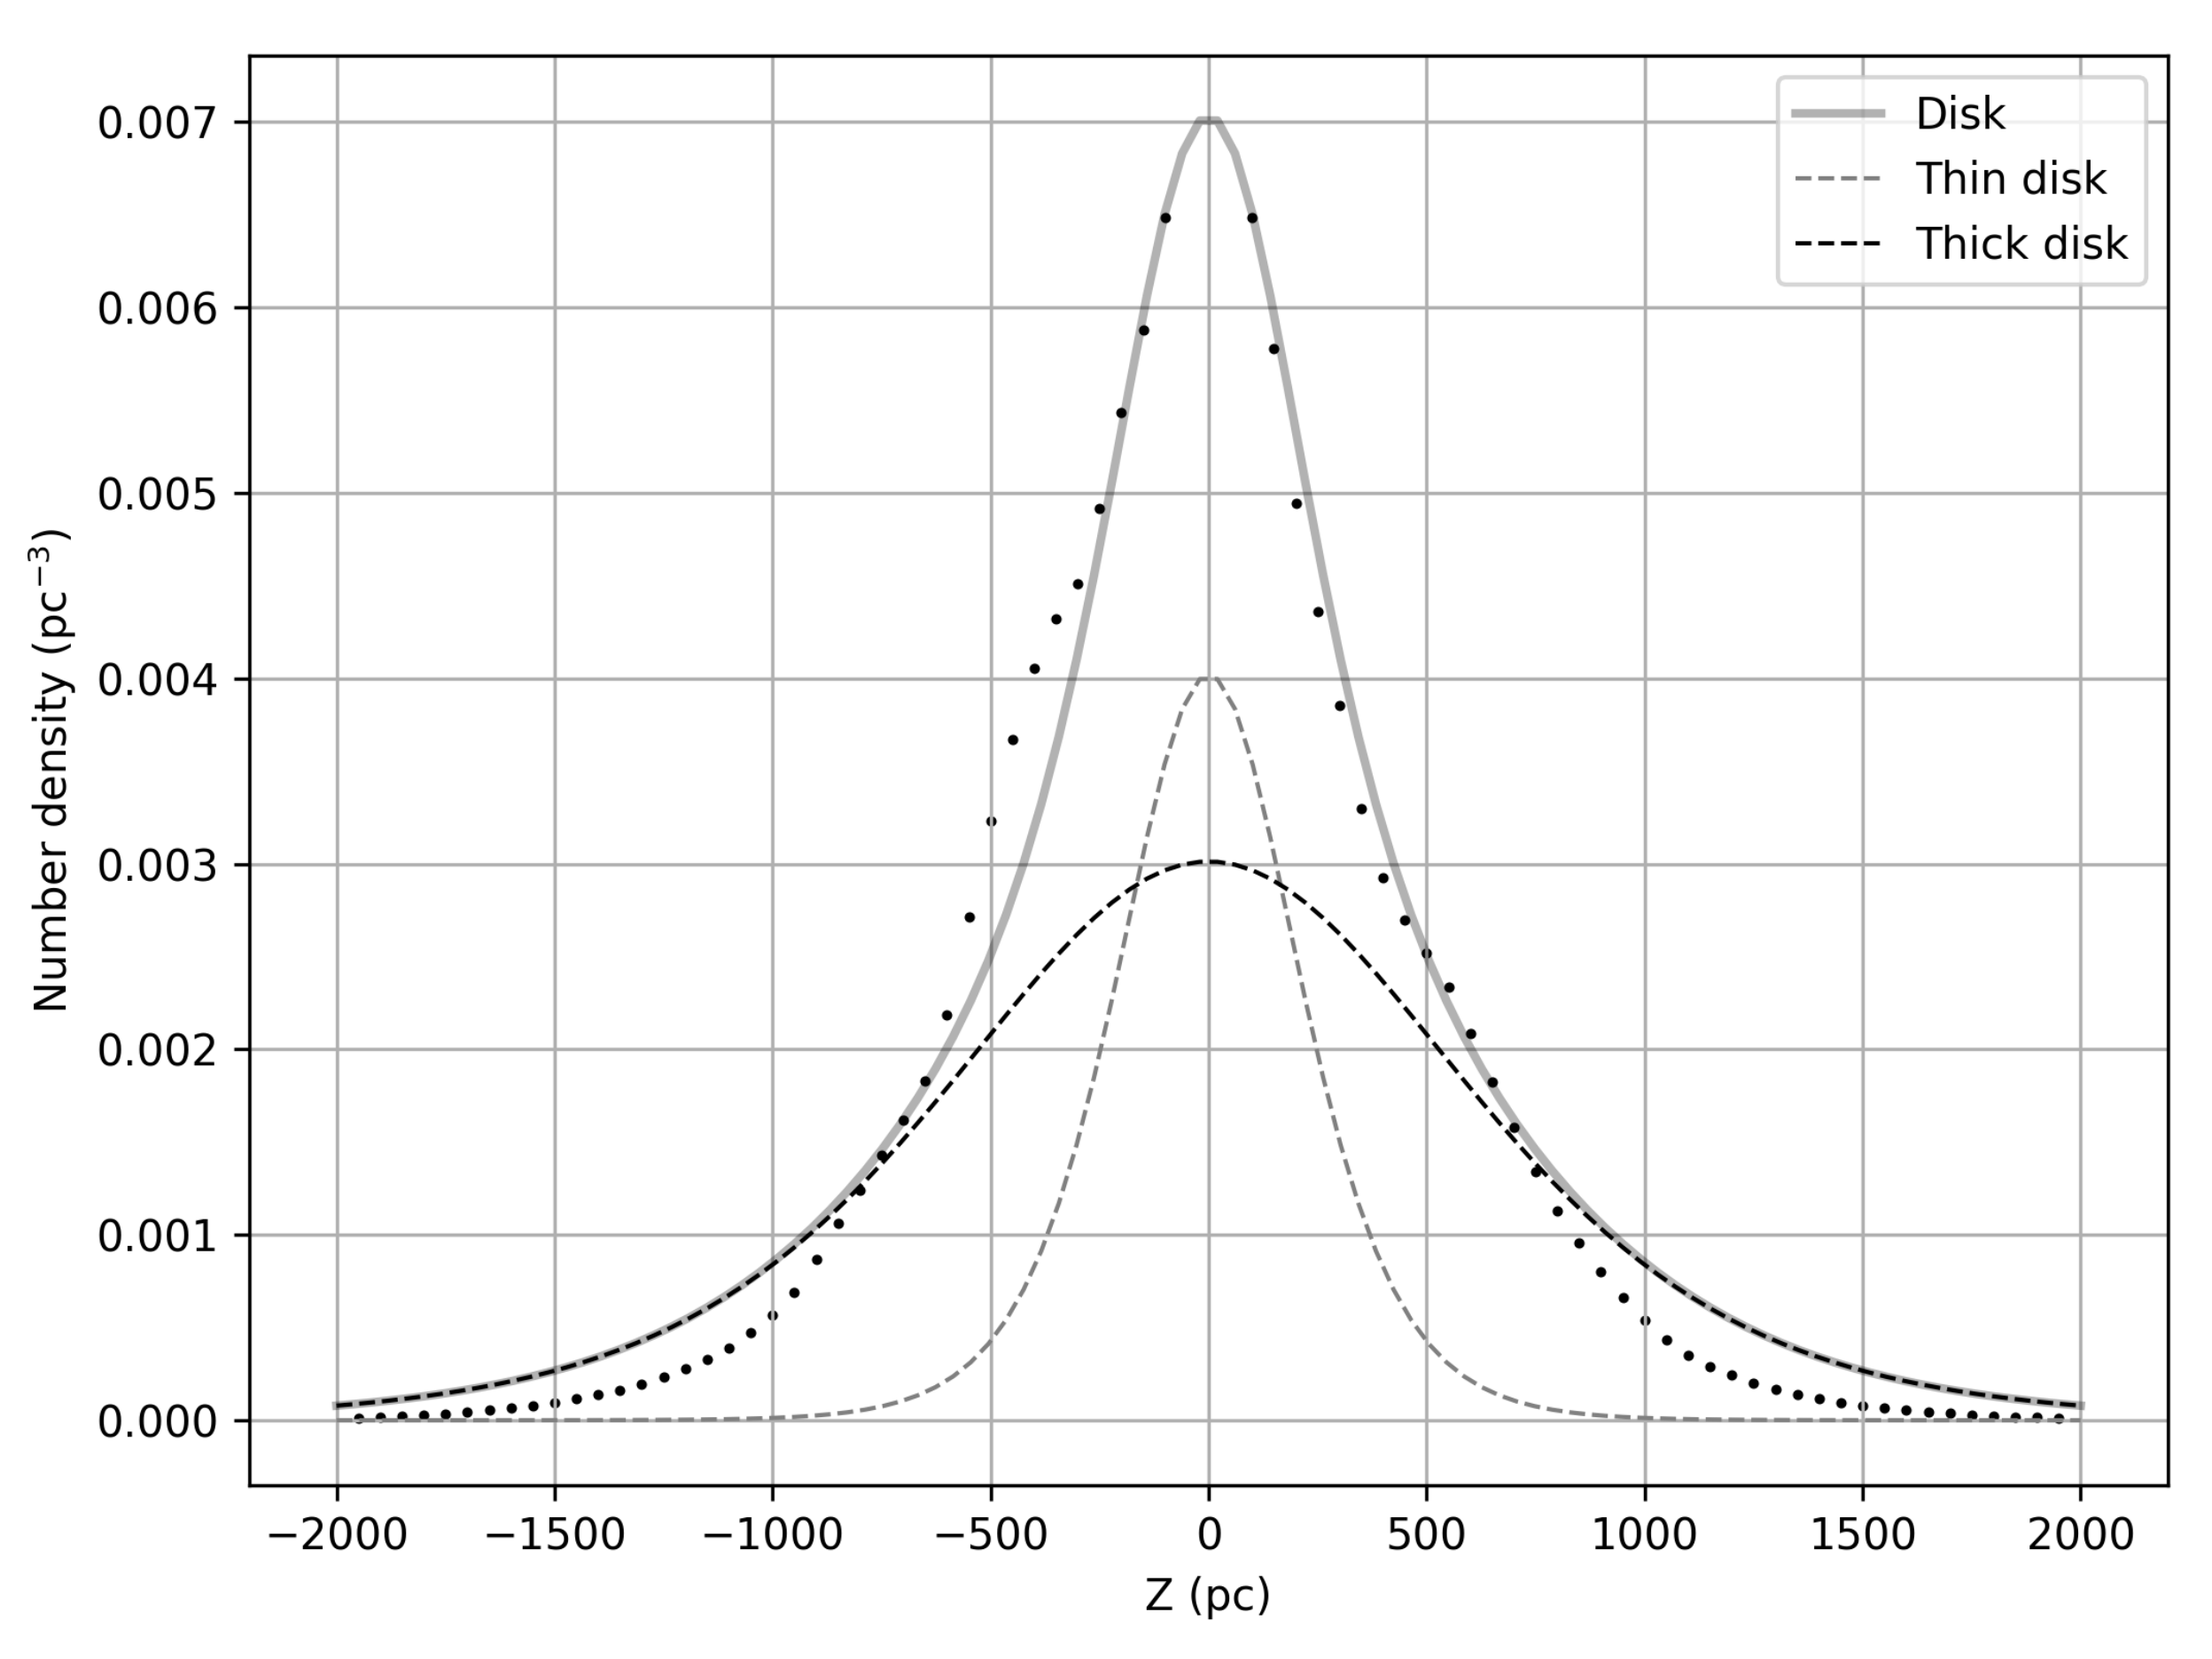
4. Results: Scale Heights and Number Density Ratio

To obtain the scale height of the vertical density of a chosen population in our volume, we must compute its corresponding number density at each height Z.

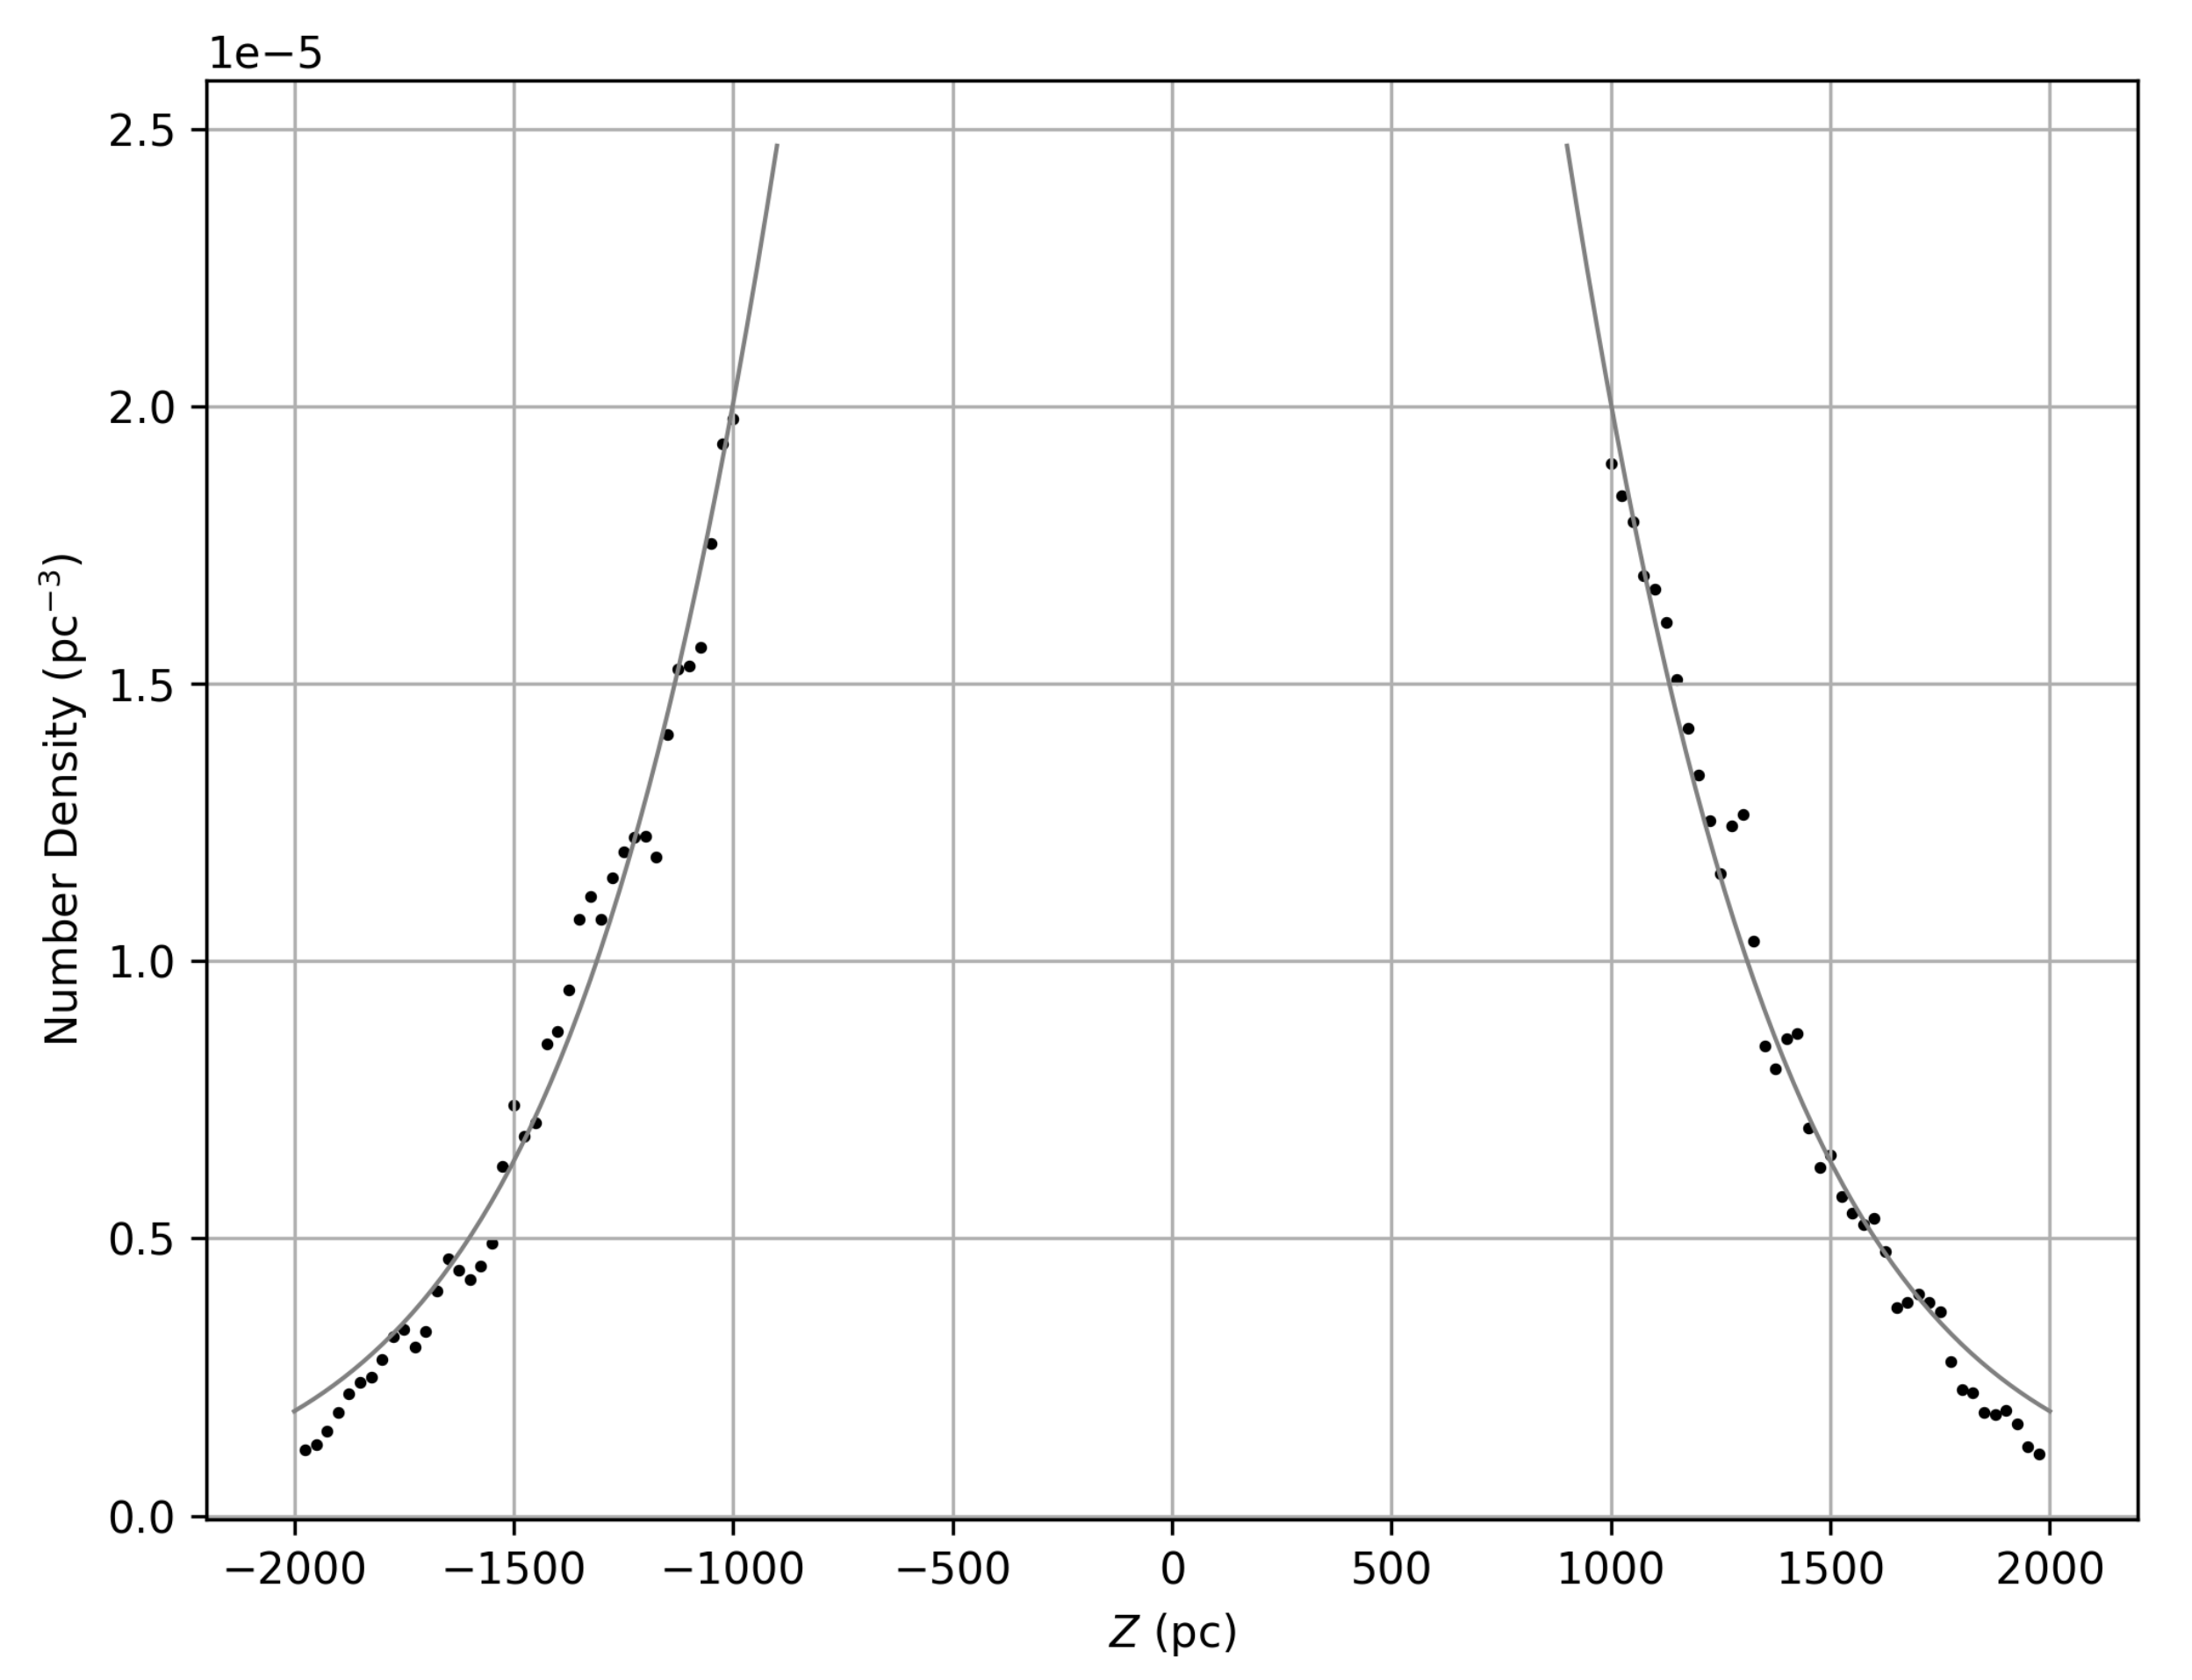
4.1. Thick Disk Vertical Scale Height H Z

By considering 6228 dwarf stars with 1000 > | Z | < 2000 pc and V ϕ > 140 km s−1, we use the Python package scipy.optimize.curve_fit to fit a function of the form ρ ( Z ) = ρ 0 sech 2 ( Z / H Z ) to the number density computed every 25 pc over truncated cones of height 50 pc, between Z = 2 kpc and Z = + 2 kpc. The resulting densities (black points) and fit (grey curve) can be seen in Figure 5, the fitting yields ρ 0 = 7.204 × 10 5 ± 3.075 × 10 6 pc−3 and H Z = 797.23 ± 12.34 pc.

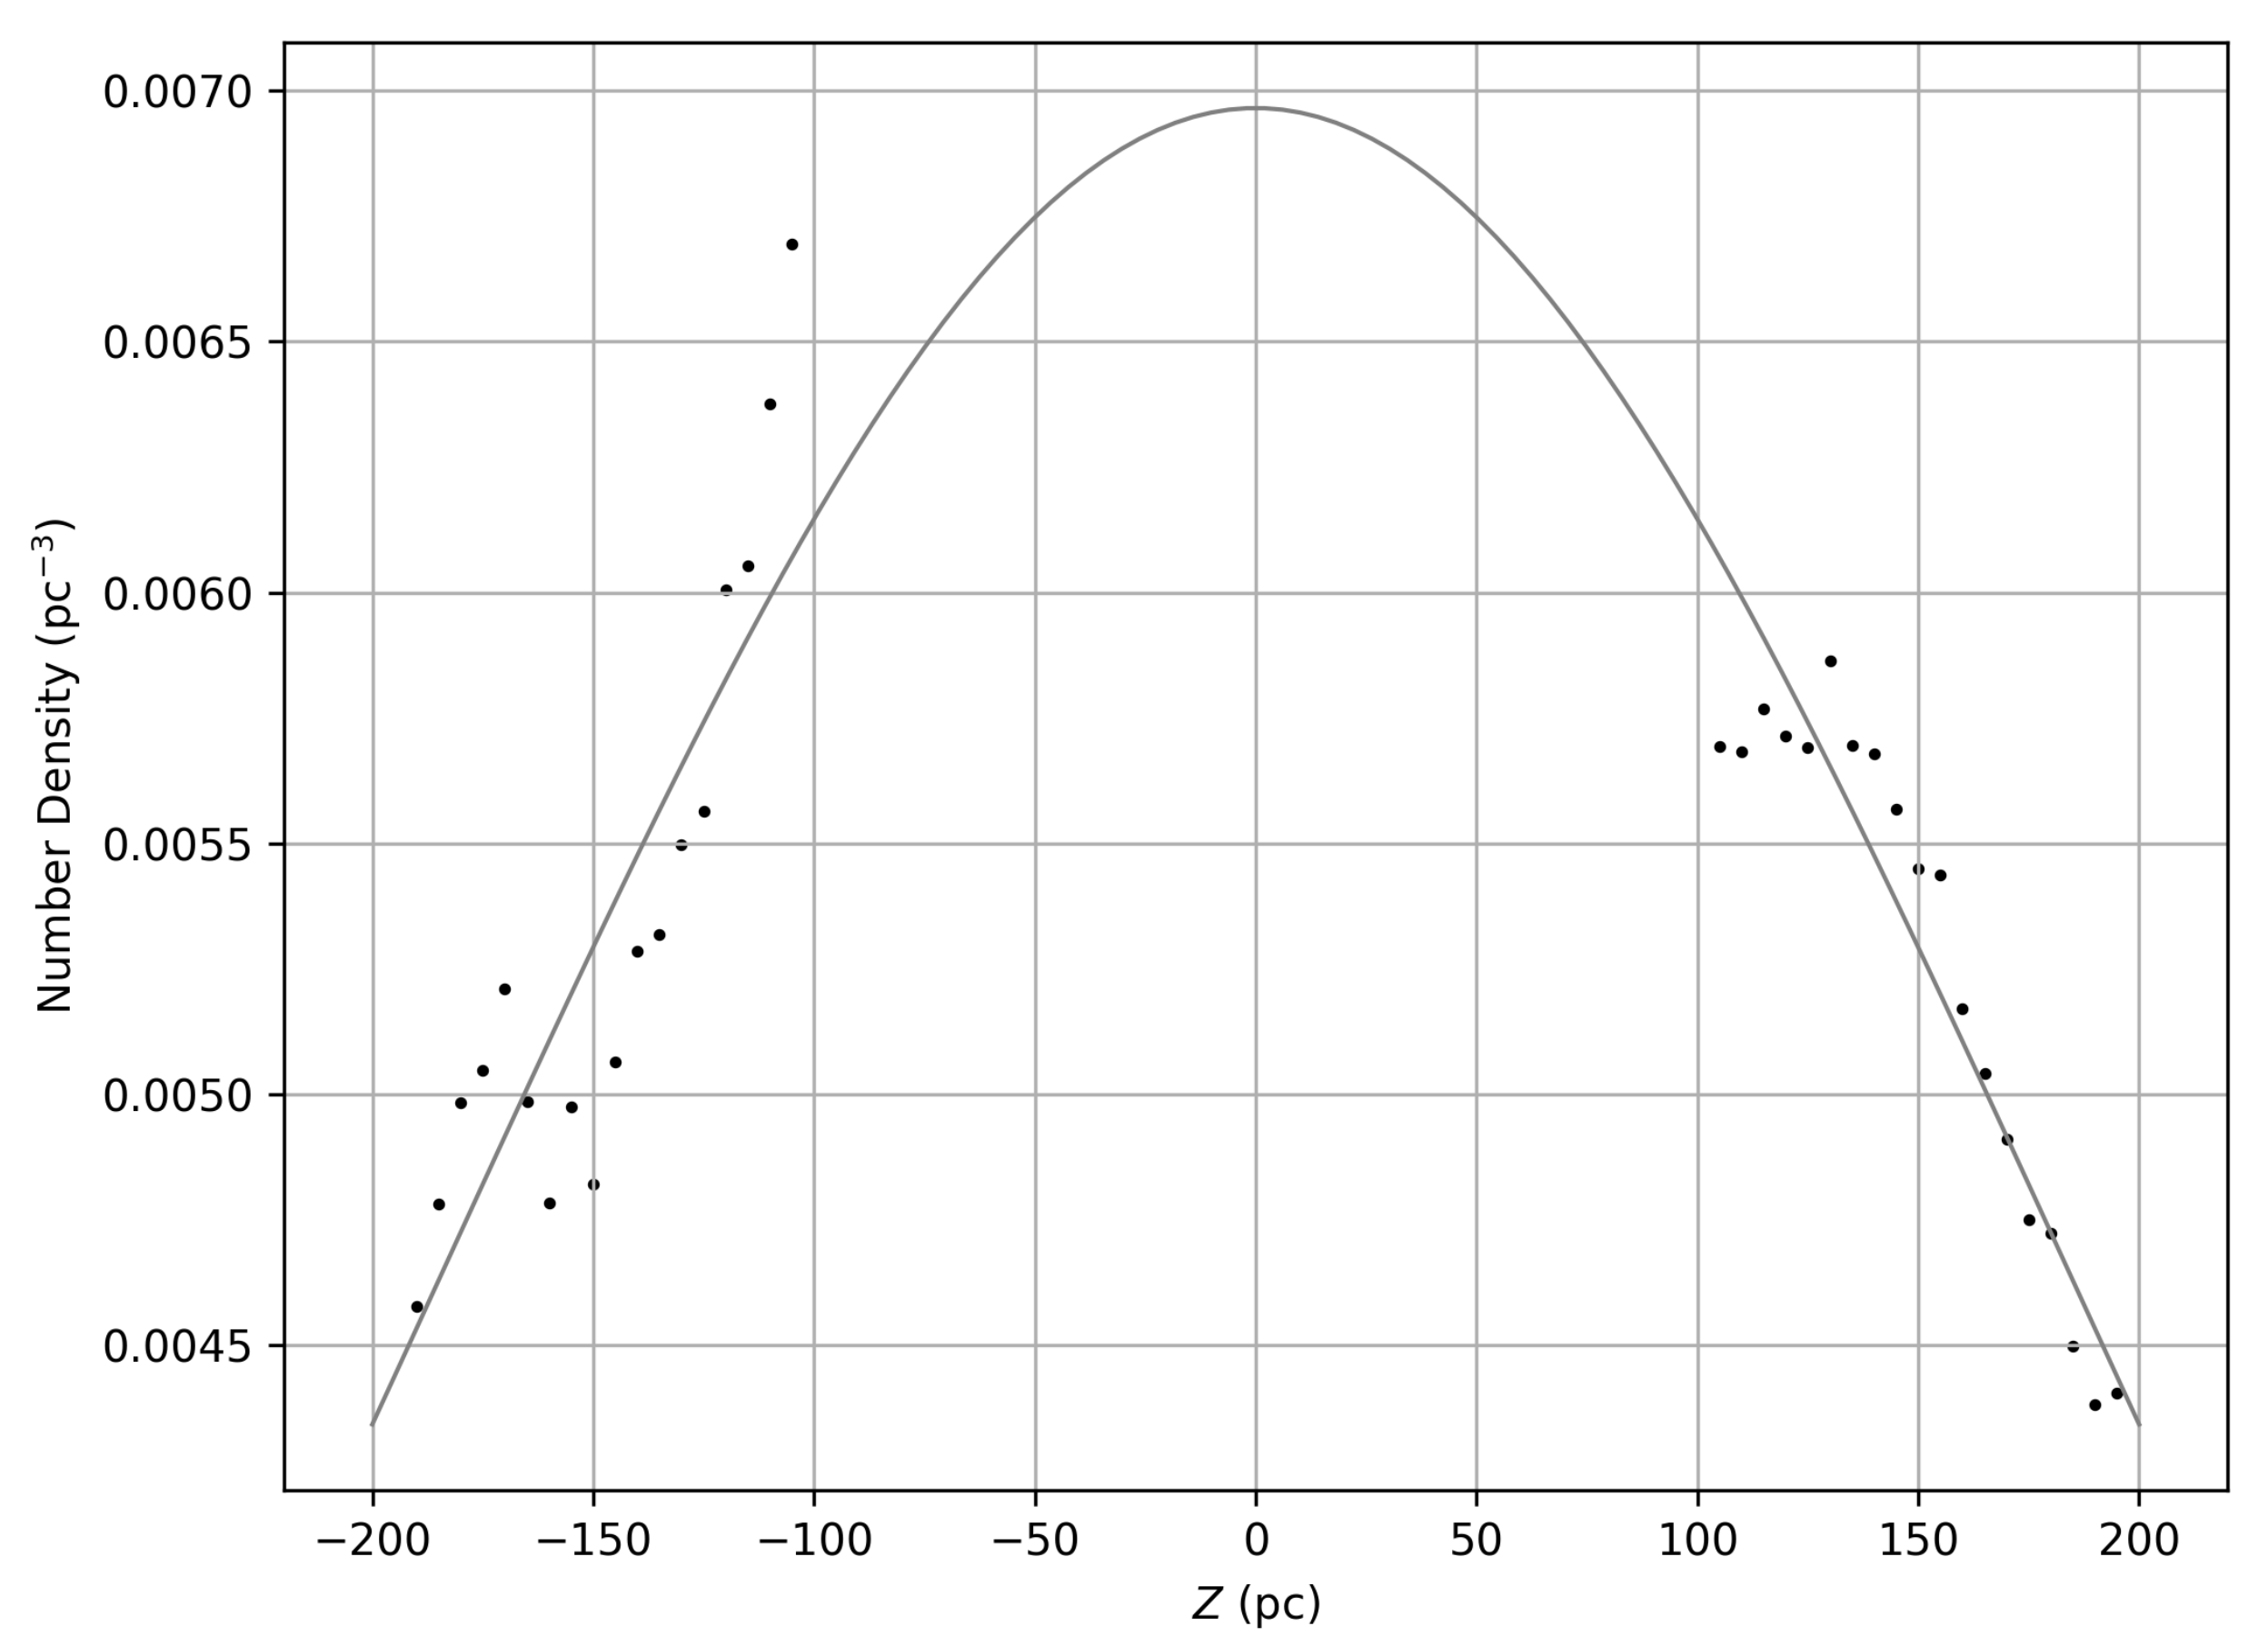
4.2. Thin Disk Vertical Scale Height h Z

Several intervals of | Z | were studied in order to obtain a trustable fit for the thin disk sample. Our previous experience from [30] indicates that kinematically-selected thin disk samples may have non-negligible thick disk contamination. Therefore, we restrict the calculations to 100 < | Z | < 200 pc and 280 < V ϕ < 200 km s−1 (5353 dwarf stars) to compute the thin disk number density every 5 pc over truncated cones of height 20 pc, and fit a single sech 2 profile as with the thick disk. The results are ρ 0 = 6.966 × 10 3 ± 1.630 × 10 4 pc−3 and h Z = 279.76 ± 12.49 pc, visible in Figure 6. When we tried adding the Sun’s height Z as an additional parameter, it came out as consistent with zero within the error, therefore we did not fit for it.

4.3. Thick-to-Thin Number Density Ratio

As for the calculation of the thick-to-thin disk number density ratio at the galactic plane, i.e., ρ T / ρ t , we compute the vertical number density over the disk sample in the two-cones volume, considering all dwarfs stars with 100 < | Z | < 2000 pc and no cut in V ϕ , amounting to 336,899 stars. We fit a function of the form
ρ ( Z ) = ρ t sech 2 Z h Z + ρ T sech 2 Z H Z ,
where ρ t and h Z correspond to the thin disk and ρ T and H Z to the thick one, respectively. The number densities were computed every 50 pc over truncated cones of height 100 pc, between Z = 2 kpc and Z = + 2 kpc, excluding | Z | < 100 pc. The results, including the scale heights from the previous subsections, are listed in Table 1 and can be seen in Figure 7.
The root mean square deviation (RMSD) of the fitting, a measure of the typical residual between the points and the fitted function, is RMSD = 7.9745 × 10 4 .
We notice that the fit goes above the measured densities for | Z | 700 pc. We did several tests in which we fit Equation 1, under the following conditions:
  • Assuming h z and estimating H Z , ρ t and ρ T ;
  • Assuming H z and estimating h Z , ρ t and ρ T ;
  • Estimating all parameters h Z , H Z , ρ t and ρ T .
In all of these three cases, the fitted scale heights were significantly different than the ones we previously obtained and their percentage errors were significantly higher, although their RMSD were smaller, the last case getting the smallest one and the closest-to-the-points fit. In all cases, the thin/thick disk was fitted a higher/smaller scale height than what we had previously estimated from the fast/slow-rotating subsample. When estimating all parameters, the thin disk parameter reached percentage errors of 184% and 663% for h Z and ρ t respectively. Therefore, when given the freedom to fit all parameters, the algorithm has a hard time finding stable reliable values, the best performance in terms of parameters errors—at the cost of not properly fitting the data at higher | Z | —is obtained when our previous estimates of h Z and H Z are given as fixed values. We believe our estimates of the scale heights of the thin and thick disks listed in Table 1 are trustable, as those subsamples are dominated by these populations despite not having further information to improve that data selection.
As for the ratio of the thick-to-thin vertical number densities, we notice that for the parameters found, the ratio ρ T ρ t sech 2 ( Z / H Z ) sech 2 ( Z / h Z ) is maximum and equal to ρ T / ρ t at Z = 0 , decreases to 5% of that at | Z | ∼700 pc and tends to zero beyond that. This means the fitting of Equation (1) is being driven mainly by the data | Z | < 700 pc and if we take the points beyond that, results do not change significantly. We proved this, by limiting the data to | Z | < 700 , 1000 and 2000 pc, and we found that both ρ t and ρ T changed within the corresponding 3 σ level, ρ t increased and ρ T decreased as the sample spanned vertically farther from the galactic plane. Curiously, the larger the coverage in | Z | the smaller the percentage errors of all parameters, but this could simply mean that a larger | Z | range translates into more “stability” for the parameters found.
When assuming h z and estimating H Z , ρ t and ρ T , we obtained a very poorly estimated number density ρ t for the thin disk and a visibly smaller H Z compared to previously reported values, which looked more like a mean value between the generally accepted ones for the thin and thick disk. Our slow and fast-rotating samples may not properly gauge the vertical profiles of the thick and thin disks respectively, which is a possibility, or the assumed two populations fit is not enough and a different model is needed. Another option is that the observed asymmetry, not accounted for in this work, is significant enough for requiring being considered.
It calls our attention that fitting the sum of thin and thick disks, the more or less generally accepted model for our Milky Way galaxy, to high-quality Gaia DR3 data, fails to account for the data at | Z | > 700 pc, where the thin disk contribution is negligible. Previous works generally deal with either disk separately but fitting both simultaneously seems to be a much harder task. We believe that the approximations used in our work—limiting the volume to two-cones and ignoring the contribution of line-of-sight velocities—are not biasing the obtained results.

5. Comparison with Previous Work by the Authors

With the obtained number densities for the thin and thick disk in this work, we proceed to contrast this result with our previous one in [30], in which we found that within a 500 pc height from the galactic plane and cylindrical radius 1 kpc from the Sun, both thin and thick disks have about the same number of red giant stars. A quick arithmetic (see Appendix A) proves that given the s e c h 2 vertical density distributions of the thin and thick disks with their corresponding scale heights, the number of thin and thick disk stars in a cylinder of height z l i m , regardless of the cylinder radius, can be expressed as N t h i c k ( z l i m ) = f ( z l i m ) N t h i n ( z l i m ) where
f ( z l i m ) = f ( z l i m ; h Z , H Z , ρ t , ρ T ) = H Z h Z ρ T ρ t tanh z l i m H Z tanh z l i m h Z .
Entering the values from Table 1, we obtain that f ( 500 p c ) = 1.26 ± 0.09 , with the error estimate computed by using a Monte-Carlo approach assuming Gaussian 1 σ errors for the parameters involved. This value of f is consistent with f = 1 within 3 σ = 0.27 , therefore it supports our conclusion in [30], that close to the galactic plane there is a significant number of thick disk stars, possibly as many as thin disk ones.

6. Discussion

Park et al. [31] studied whether the thin and the thick disks derived from the vertical density distribution of the Milky Way galaxy are really distinct components that are formed at different times and by different formation mechanisms. To do this, Park et al. [31] used 18 massive disk galaxies from the New Horizon simulation together with one disk galaxy taken from GALACTICA simulation. These simulations have high spatial resolution which makes them a powerful tool to study the detailed structure of galaxies. Park et al. [31] applied the the two-component fit to the r-band vertical profiles, and found that the two-component thin-thick disk structures are well represented in the numerical simulations. Figure 3 of Park et al. [31] summarizes the properties of the thin, and of the thick disks. The authors find that about 30 percent of the mass, and about ten percent of r-band luminosity near the mid-plane of the disk are determined by the thick disk stars. This result concurs with the results of other authors who find that kinematic decomposition of the stellar particles leads to the same result: the mass of the thick disk is comparable to that of the thin disk [17,32].
The conclusion based on the high-resolution numerical simulations finds confirmation in observations of the external galaxies. Kasparova et al. [33] performed deep imaging and high-resolution spectroscopic observations of edge-on large lenticular galaxy NGC 7572. Using decomposition of vertical cross-sections of disk of the galaxy and assuming a double sech2 distribution, authors derived the scalelengths and the scaleheights of both disks. Authors derived the stellar mass-to-light ratios for the thin disk of 3.1 (M/L) and for the thick disk of NGC 7572 a ratio equal to 4.6 (M/L) which allowed them to estimate masses of the thin and of the thick disk equal to 5.9 × 10¹⁰ M and 1.6 × 10¹¹ M respectively. Both high resolution numerical simulations and observational data of mass distribution in the disks of the galaxy NGC 7572 are consistent with our finding about high density ratio of the thick-to thin disks in solar neighborhood.

7. Conclusions

We conclude that in the Milky Way there are more stars at higher scale heights than those of the thin disk that need to be accounted for. Considering that most of the thick disk stars are located in the galactic plane, then a separation of thin and thick disk populations close to the Sun, based only on detailed chemical abundances, and entirely independent of kinematic selections will provide a clearer answer.

Author Contributions

Conceptualization, V.K. and G.C.; methodology, K.V. and V.K.; investigation K.V.; validation A.L.; writing—original draft preparation, K.V., V.K., G.C. and A.L. All authors have read and agreed to the published version of the manuscript.

Funding

This research received no external funding.

Data Availability Statement

Gaia DR3 data are publicy available at https://gea.esac.esa.int/archive/, accessed on 25 April 2023.

Acknowledgments

This work presents results from the European Space Agency (ESA) space mission Gaia. Gaia data are being processed by the Gaia Data Processing and Analysis Consortium (DPAC). Funding for the DPAC is provided by national institutions, in particular, the institutions participating in the Gaia MultiLateral Agreement (MLA). The Gaia mission website is https://www.cosmos.esa.int/gaia, accessed on 25 April 2023. The Gaia archive website is https://archives.esac.esa.int/gaia, accessed on 25 April 2023. V.K. acknowledges financial support by Ministry of Science and Higher Education of Russian Federation, State contract GZ0110/23-10-IF.

Conflicts of Interest

The authors declare no conflict of interest.

Appendix A

Here we briefly show the relevant equations used to fit the density profiles and compute the number of stars within a cylindrical volume of radius R and height ± z l i m above/below the galactic plane, for such density profiles.
sech 2 z h d z = h tanh z 2 h + c o n s t a n t z l i m z l i m sech 2 z h d z = 2 h tanh z l i m h + sech 2 z h d z = lim z l i m + z l i m + z l i m sech 2 z h d z = lim z l i m + 2 h tanh z l i m h = 2 h

Note

1
A procedure to smooth a histogram in which each discrete point contributing to a bin is replaced by an extended probability distribution, called a kernel, and the probability density at any given point in the space is then estimated to be the sum of the kernels at the chosen point, over all of the discrete points, after proper normalization.

References

  1. Gilmore, G.; Reid, N. New light on faint stars—III. Galactic structure towards the South Pole and the Galactic thick disc. Mon. Not. R. Astron. Soc. 1983, 202, 1025–1047. [Google Scholar] [CrossRef] [Green Version]
  2. Kuijken, K.; Gilmore, G. The mass distribution in the galactic disc—II. Determination of the surface mass density of the galactic disc near the Sun. Mon. Not. R. Astron. Soc. 1989, 239, 605–649. [Google Scholar] [CrossRef] [Green Version]
  3. Bilir, S.; Karaali, S.; Ak, S.; Yaz, E.; Hamzaoğlu, E. Galactic longitude dependent galactic model parameters. New Astron. 2006, 12, 234–245. [Google Scholar] [CrossRef] [Green Version]
  4. Jurić, M.; Ivezić, Ž.; Brooks, A.; Lupton, R.H.; Schlegel, D.; Finkbeiner, D.; Padmanabhan, N.; Bond, N.; Sesar, B.; Rockosi, C.M.; et al. The Milky Way Tomography with SDSS. I. Stellar Number Density Distribution. Astrophys. J. 2008, 673, 864–914. [Google Scholar] [CrossRef]
  5. Ak, T.; Bilir, S.; Ak, S.; Eker, Z. Spatial distribution and galactic model parameters of cataclysmic variables. New Astron. 2008, 13, 133–143. [Google Scholar] [CrossRef] [Green Version]
  6. De Jong, J.T.A.; Yanny, B.; Rix, H.W.; Dolphin, A.E.; Martin, N.F.; Beers, T.C. Mapping the Stellar Structure of the Milky Way Thick Disk and Halo Using SEGUE Photometry. Astrophys. J. 2010, 714, 663–674. [Google Scholar] [CrossRef] [Green Version]
  7. Ferguson, D.; Gardner, S.; Yanny, B. Milky Way Tomography with K and M Dwarf Stars: The Vertical Structure of the Galactic Disk. Astrophys. J. 2017, 843, 141. [Google Scholar] [CrossRef] [Green Version]
  8. Mateu, C.; Vivas, A.K. The Galactic thick disc density profile traced with RR Lyrae stars. Mon. Not. R. Astron. Soc. 2018, 479, 211–227. [Google Scholar] [CrossRef] [Green Version]
  9. Dobbie, P.S.; Warren, S.J. A Bayesian Approach to the Vertical Structure of the Disk of the Milky Way. Open J. Astrophys. 2020, 3, 5. [Google Scholar] [CrossRef]
  10. Everall, A.; Belokurov, V.; Evans, N.W.; Boubert, D.; Grand, R.J.J. The photo-astrometric vertical tracer density of the Milky Way—II. Results from Gaia. Mon. Not. R. Astron. Soc. 2022, 511, 3863–3880. [Google Scholar] [CrossRef]
  11. Everall, A.; Evans, N.W.; Belokurov, V.; Boubert, D.; Grand, R.J.J. The Photo-Astrometric vertical tracer density of the Milky Way—I. The method. Mon. Not. R. Astron. Soc. 2022, 511, 2390–2404. [Google Scholar] [CrossRef]
  12. Spitzer, L., Jr.; Schwarzschild, M. The Possible Influence of Interstellar Clouds on Stellar Velocities. Astrophys. J. 1951, 114, 385. [Google Scholar] [CrossRef]
  13. Sellwood, J.; Carlberg, R. Spiral instabilities provoked by accretion and star formation. Astrophys. J. 1984, 282, 61–74. [Google Scholar] [CrossRef]
  14. Quinn, P.; Hernquist, L.; Fullagar, D. Heating of galactic disks by mergers. Astrophys. J. 1993, 403, 74–93. [Google Scholar] [CrossRef]
  15. Roškar, R.; Debattista, V.P.; Quinn, T.R.; Stinson, G.S.; Wadsley, J. Riding the spiral waves: Implications of stellar migration for the properties of galactic disks. Astrophys. J. Lett. 2008, 684, L79. [Google Scholar] [CrossRef]
  16. Schönrich, R.; Binney, J. Chemical evolution with radial mixing. Mon. Not. R. Astron. Soc. 2009, 396, 203–222. [Google Scholar] [CrossRef] [Green Version]
  17. Abadi, M.G.; Navarro, J.F.; Steinmetz, M.; Eke, V.R. Simulations of galaxy formation in a Λ cold dark matter universe. I. Dynamical and photometric properties of a simulated disk galaxy. Astrophys. J. 2003, 591, 499. [Google Scholar] [CrossRef] [Green Version]
  18. Bovy, J.; Rix, H.W.; Hogg, D.W.; Beers, T.C.; Lee, Y.S.; Zhang, L. The Vertical Motions of Mono-abundance Sub-populations in the Milky Way Disk. Astrophys. J. 2012, 755, 115. [Google Scholar] [CrossRef] [Green Version]
  19. Rix, H.W.; Bovy, J. The Milky Way’s stellar disk. Mapping and modeling the Galactic disk. Astron. Astrophys. Rev. 2013, 21, 61. [Google Scholar] [CrossRef] [Green Version]
  20. Bird, J.C.; Kazantzidis, S.; Weinberg, D.H. Radial mixing in galactic discs: The effects of disc structure and satellite bombardment. Mon. Not. R. Astron. Soc. 2012, 420, 913–925. [Google Scholar] [CrossRef] [Green Version]
  21. Bird, J.C.; Kazantzidis, S.; Weinberg, D.H.; Guedes, J.; Callegari, S.; Mayer, L.; Madau, P. Inside out and Upside down: Tracing the Assembly of a Simulated Disk Galaxy Using Mono-age Stellar Populations. Astrophys. J. 2013, 773, 43. [Google Scholar] [CrossRef] [Green Version]
  22. Fuhrmann, K. The Deep Thick Disk as Seen by UVES. In Proceedings of the from Extrasolar Planets to Cosmology: The VLT Opening Symposium; Springer: Berlin, Germany, 2000; pp. 351–356. [Google Scholar] [CrossRef]
  23. Girard, P.; Soubiran, C. Abundances and ages of the deconvolved thin/thick disks of the Galaxy. In Chemical Abundances and Mixing in Stars in the Milky Way and its Satellites; Springer: Berlin, Germany, 2006; pp. 56–57. [Google Scholar] [CrossRef] [Green Version]
  24. Kordopatis, G.; Recio-Blanco, A.; De Laverny, P.; Gilmore, G.; Hill, V.; Wyse, R.; Helmi, A.; Bijaoui, A.; Zoccali, M.; Bienaymé, O. A spectroscopic survey of thick disc stars outside the solar neighbourhood. Astron. Astrophys. 2011, 535, A107. [Google Scholar] [CrossRef] [Green Version]
  25. Girard, T.M.; Korchagin, V.I.; Casetti-Dinescu, D.I.; van Altena, W.F.; López, C.E.; Monet, D.G. Velocity Shear of the Thick Disk from SPM3 Proper Motions at the South Galactic Pole. Astron. J. 2006, 132, 1768–1782. [Google Scholar] [CrossRef] [Green Version]
  26. Gaia Collaboration; Vallenari, A.; Brown, A.G.A.; Prusti, T.; de Bruijne, J.H.J.; Arenou, F.; Babusiaux, C.; Biermann, M.; Creevey, O.L.; Ducourant, C.; et al. Gaia Data Release 3: Summary of the content and survey properties. arXiv 2022, arXiv:2208.00211. [Google Scholar]
  27. Lindegren, L.; Bastian, U.; Biermann, M.; Bombrun, A.; de Torres, A.; Gerlach, E.; Geyer, R.; Hernández, J.; Hilger, T.; Hobbs, D.; et al. Gaia Early Data Release 3. Parallax bias versus magnitude, colour, and position. Astron. Astrophys. 2021, 649, A4. [Google Scholar] [CrossRef]
  28. Schönrich, R.; Binney, J.; Dehnen, W. Local kinematics and the local standard of rest. Mon. Not. R. Astron. Soc. 2010, 403, 1829–1833. [Google Scholar] [CrossRef] [Green Version]
  29. Gaia Collaboration; Brown, A.G.A.; Vallenari, A.; Prusti, T.; de Bruijne, J.H.J.; Babusiaux, C.; Biermann, M.; Creevey, O.L.; Evans, D.W.; Eyer, L.; et al. Gaia Early Data Release 3. Summary of the contents and survey properties. Astron. Astrophys. 2021, 649, A1. [Google Scholar] [CrossRef]
  30. Vieira, K.; Carraro, G.; Korchagin, V.; Lutsenko, A.; Girard, T.M.; van Altena, W. Milky Way Thin and Thick Disk Kinematics with Gaia EDR3 and RAVE DR5. Astrophys. J. 2022, 932, 28. [Google Scholar] [CrossRef]
  31. Park, M.J.; Yi, S.K.; Peirani, S.; Pichon, C.; Dubois, Y.; Choi, H.; Devriendt, J.; Kaviraj, S.; Kimm, T.; Kraljic, K.; et al. Exploring the Origin of Thick Disks Using the NewHorizon and Galactica Simulations. Astrophys. J. Suppl. Ser. 2021, 254, 2. [Google Scholar] [CrossRef]
  32. Obreja, A.; Macciò, A.V.; Moster, B.; Dutton, A.A.; Buck, T.; Stinson, G.S.; Wang, L. Introducing galactic structure finder: The multiple stellar kinematic structures of a simulated Milky Way mass galaxy. Mon. Not. R. Astron. Soc. 2018, 477, 4915–4930. [Google Scholar] [CrossRef] [Green Version]
  33. Kasparova, A.V.; Katkov, I.Y.; Chilingarian, I.V. An excessively massive thick disc of the enormous edge-on lenticular galaxy NGC 7572. Mon. Not. R. Astron. Soc. 2020, 493, 5464–5478. [Google Scholar] [CrossRef] [Green Version]
Figure 1. ( U , V ) velocities of the sample extracted from Gaia. The disk sample is limited to the stars within the circle, having U 2 + V 2 < 180 km s−1.
Galaxies 11 00077 g001
Figure 2. Color-magnitude diagram of the disk sample, corrected by extinction and reddening. Disk stars are shown in grey while disk dwarfs stars are in black.
Galaxies 11 00077 g002
Figure 3. Completeness evaluation of the 339,876 disk dwarfs stars sample. The black line shows the incompleteness percentage estimate (left axis), while the grey dashed line counts the number of stars (right axis), both evaluated at 100-pc height coins centered at each Z.
Galaxies 11 00077 g003
Figure 4. KDE plot of the vertical distribution at various V ϕ intervals. Each curve corresponds to a V ϕ bin of 20 km s−1 width, centered at −290 to −50 km s−1. The thick grey lines are subsamples dominated by the thin disk and the thick black lines are dominated by the thick disk. The thin black lines are a mix of both and the thin dashed line is the fastest rotating sample that exhibits significant asymmetry. The filled light and dark grey plots correspond to subsamples as defined in the legend: thin ( 280 < V ϕ < 200 km s−1) and thick disk ( V ϕ > 140 km s−1) dominated samples.
Galaxies 11 00077 g004
Figure 5. Thick disk sample (1000 < | Z | < 2000 pc and V ϕ > 140 km s−1) vertical number density fit. Obtained scale height is 797.23 ± 12.34 pc.
Galaxies 11 00077 g005
Figure 6. Thin disk sample ( 100 < | Z | < 200 pc and 280 < V ϕ < 200 km s−1) vertical number density fit. Obtained scale height is 279.76 ± 12.49 pc.
Galaxies 11 00077 g006
Figure 7. Disk sample vertical number density simultaneous fit of thin and thick disk using Equation (1). Black points are the computed densities at each truncated cone centered at Z and of 100 pc height. All dwarfs stars with 100 < | Z | < 2000 pc and no cut in V ϕ were considered.
Galaxies 11 00077 g007
Table 1. Fit results for the disk dwarf stars sample in the two-cones volume. Values h Z and H Z were obtained from smaller subsamples, and were taken as fixed when fitting ρ t and ρ T for the whole disk dwarf stars sample. Parameter errors are in the second row and percentage errors are in the third one.
h Z (pc) H Z (pc) ρ t (pc−3) ρ T (pc−3) ρ T / ρ t
279.76797.23 4.017 × 10 3 3.013 × 10 3 0.750
±12.49±12.34 ± 2.171 × 10 4 ± 1.088 × 10 4 ± 0.049
5%2%5%4%6%
Disclaimer/Publisher’s Note: The statements, opinions and data contained in all publications are solely those of the individual author(s) and contributor(s) and not of MDPI and/or the editor(s). MDPI and/or the editor(s) disclaim responsibility for any injury to people or property resulting from any ideas, methods, instructions or products referred to in the content.

