Article

Hidden Spectra Treasures in the Foster Archive: A Pilot Study of the Be Stars α Eri, α Col, ω Car and η Cen

1
Instituto de Física y Astronomía, Facultad de Ciencias, Universidad de Valparaíso, Valparaíso 2360102, Chile
2
Center of Astro Engineering, Pontificia Universidad Católica de Chile, Santiago 7820436, Chile
3
Department of Electrical Engineering, Pontificia Universidad Católica de Chile, Santiago 7820436, Chile
4
Observatorio UC Manuel Foster, Santiago 8420541, Chile
*
Author to whom correspondence should be addressed.
Galaxies 2022, 10(6), 106; https://doi.org/10.3390/galaxies10060106
Submission received: 6 October 2022 / Revised: 17 November 2022 / Accepted: 19 November 2022 / Published: 22 November 2022
(This article belongs to the Special Issue Theory and Observation of Active B-type Stars)

Abstract

:
We present the archive of spectroscopic photographic plates of the Universidad Católica historic observatory Manuel Foster. The archive includes more than 4800 plates covering the period of time from 1928 to 1991. The spectra present in the archive are mostly those of bright variable or binary stars observed at different epochs. We developed a method of digitalization and data processing for the plates and verified it through the analysis of a selected sample of spectra. As an example of the potential relevance of this Foster archive we studied the variation of helium, H β and H γ spectral lines over time (1980−1991), complementing with high resolution spectroscopic data from the “Be Star Observation Survey” (2012−2015), of four Be stars mainly, α Eri, α Col, ω Car and η Cen. The spectra of these stars show evidence of a circumstellar gas disk present in both periods of time. From the spectroscopic analysis, we found these stars are variable in helium and this variability presents an opposite behavior with the variability observed in the EW of the H β line profile. This archive represents a unique source of data from past that is available for the use of the community.

1. Introduction

The historical observatory Manuel Foster of Pontificia Universidad Católica de Chile (PUC) counts with an archive of spectroscopic photographic plates. The archive includes more than 4800 plates covering the period of time from 1928 to 1991 with wavelength range between 3900 and 5150 Å. All plates were obtained with the Cassegrain telescope of 93 cm in diameter and 16.9 m focal length (F/18). The spectrograph (a copy of the Mills spectrograph [1]) includes three prisms as dispersing elements, allowing the choice of three different spectral dispersion, using either 1, or 2 or all 3 prisms. The collimator of the spectrograph with 724 mm focal length provides a beam of 37.4 mm, the objective has an equivalent focal length of 16 inches [1]. The low resolution (∼700) optical spectra ( λ 3900−5150 Å) present in the archive (see Section 2.1 for details) are mostly those of bright variable or binary stars observed at different epochs (see [2]). A full list of observed targets is available in an excel online (https://docs.google.com/spreadsheets/d/1h2o_MItVYwjV8F2V3rpG0eLDCQiuq-43mYGuExAUFAY/edit#gid=0, accessed on 5 October 2022 document belonging to PUC. The vast majority of these spectroscopic plates have to be scanned, and represent a unique database that can be of significant use to the community. Digitalization of photographic plates is an on going effort at PUC because of the historic and scientific relevance of this archive. The aim of this paper is to introduce the Foster archive to the community and highlight the importance of the hidden spectra treasures of variable stars. In particular Foster spectra can be used to:
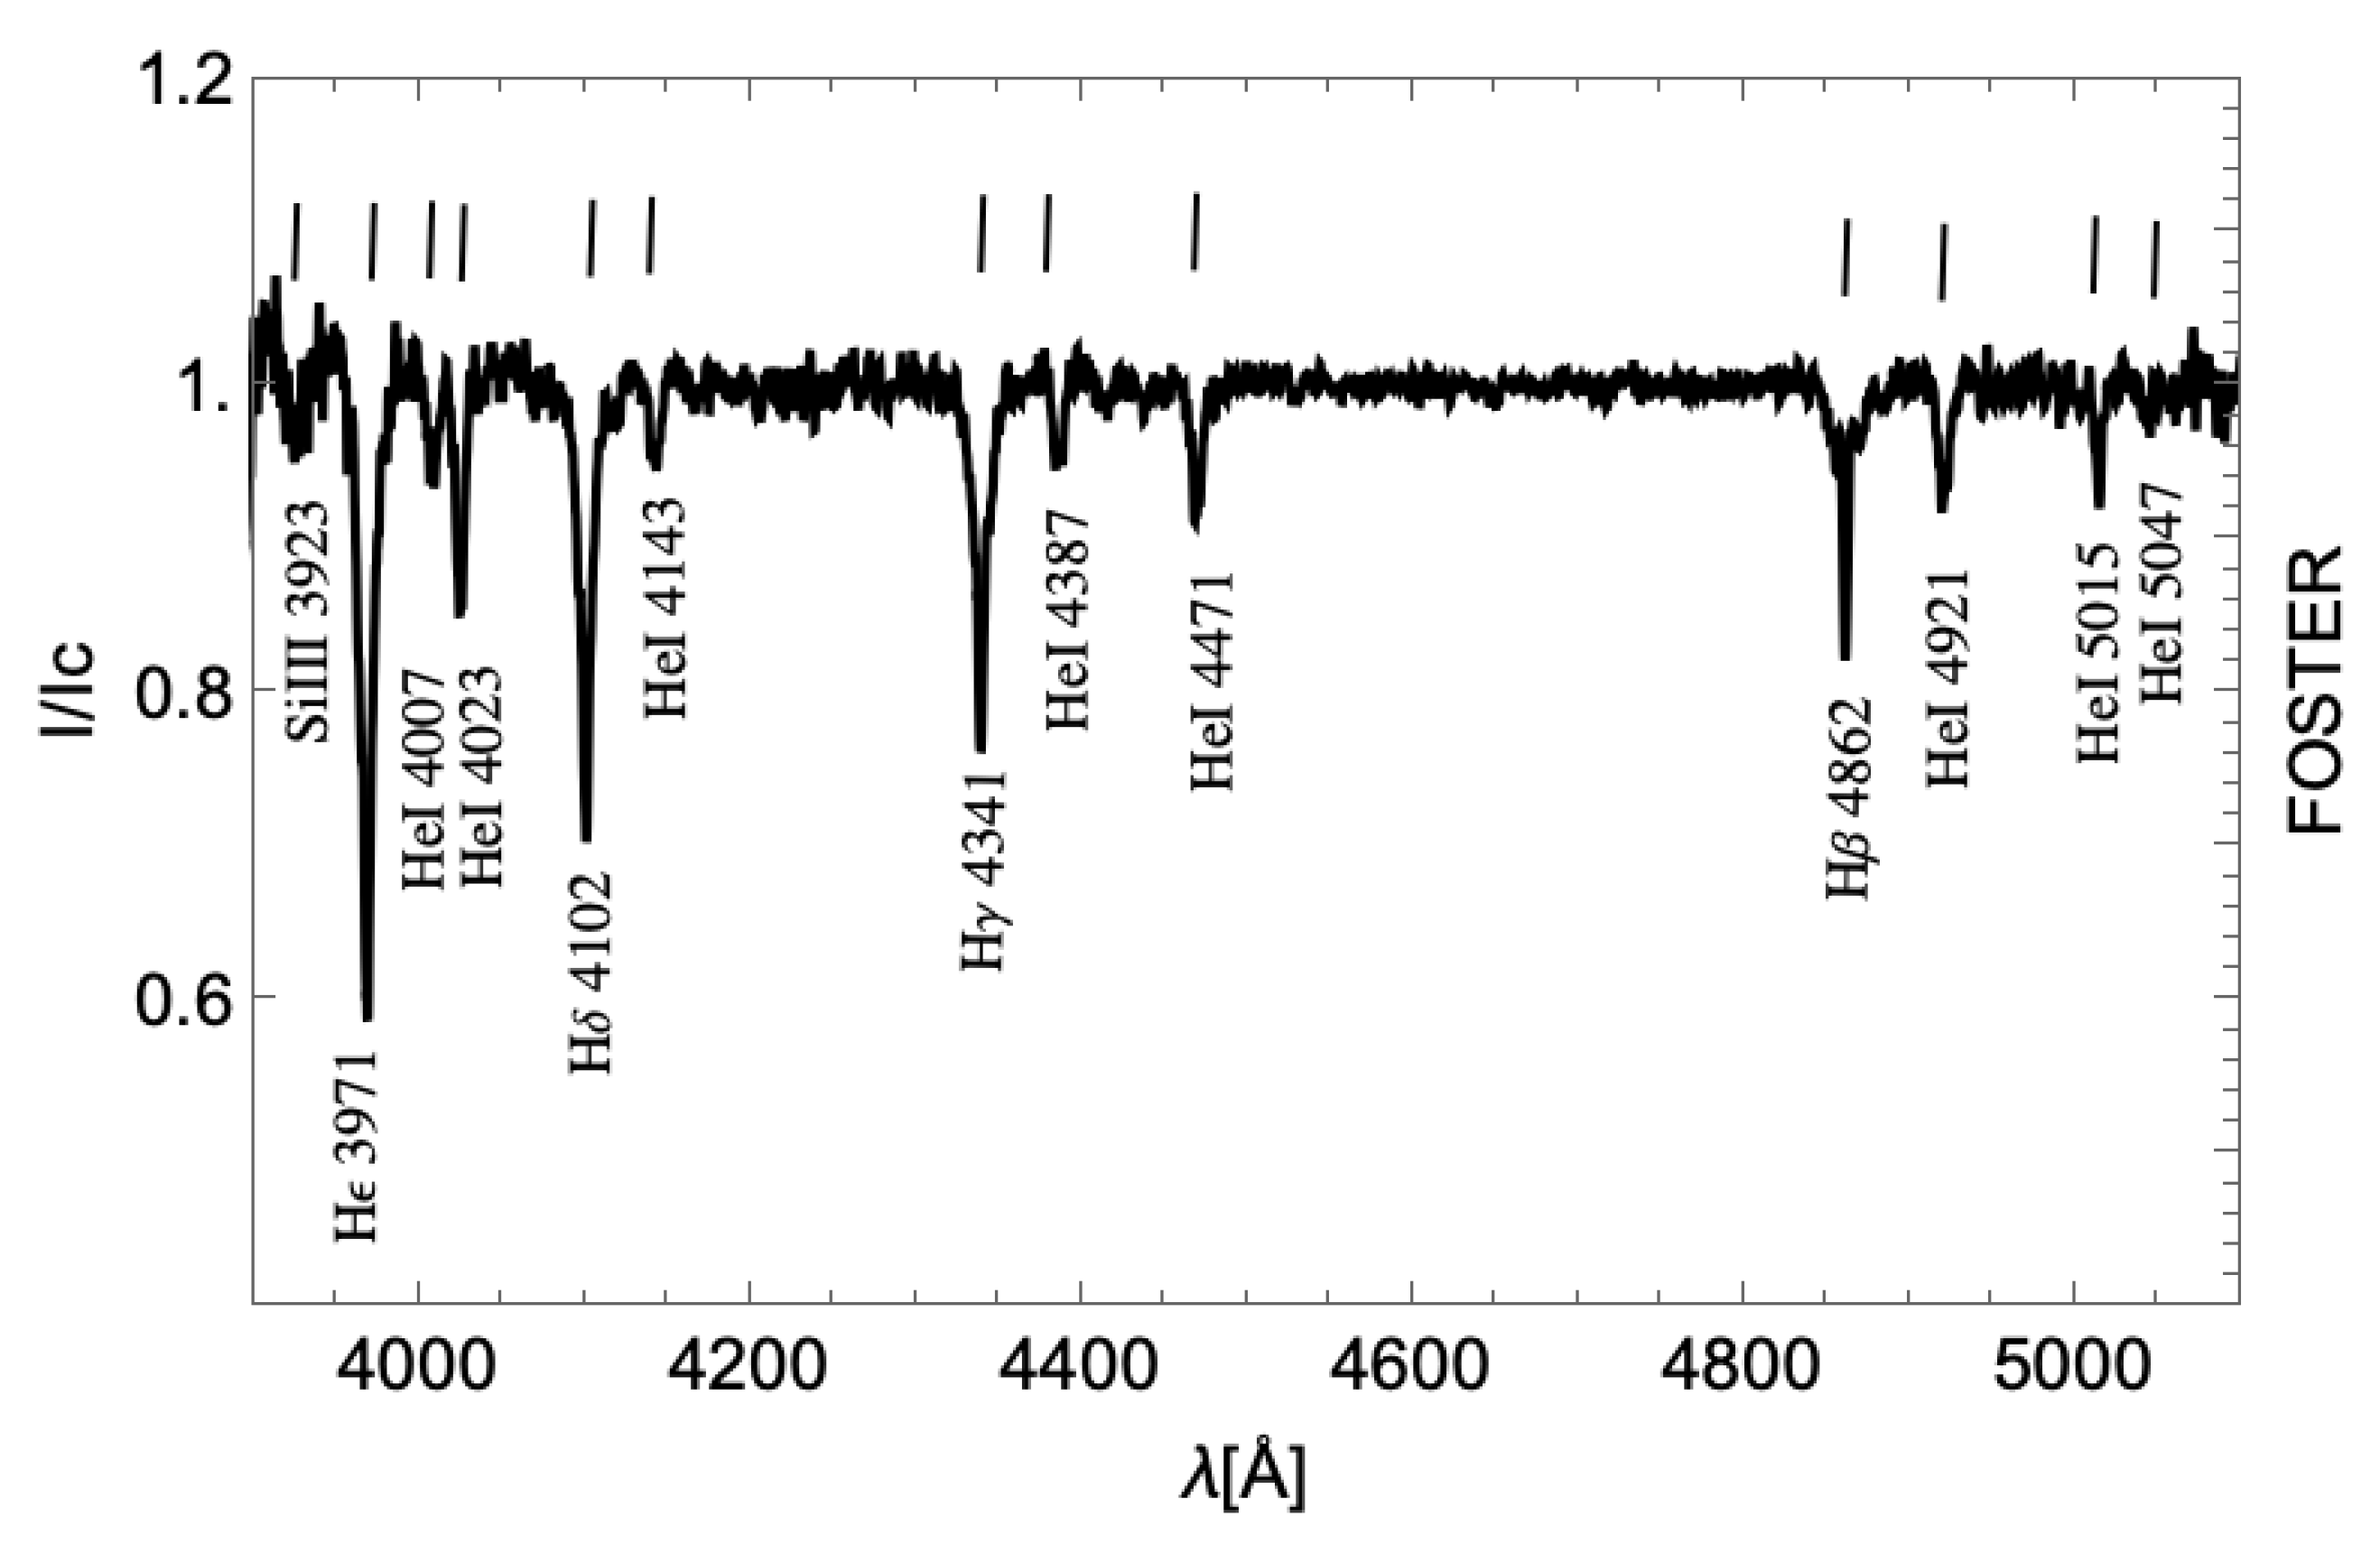
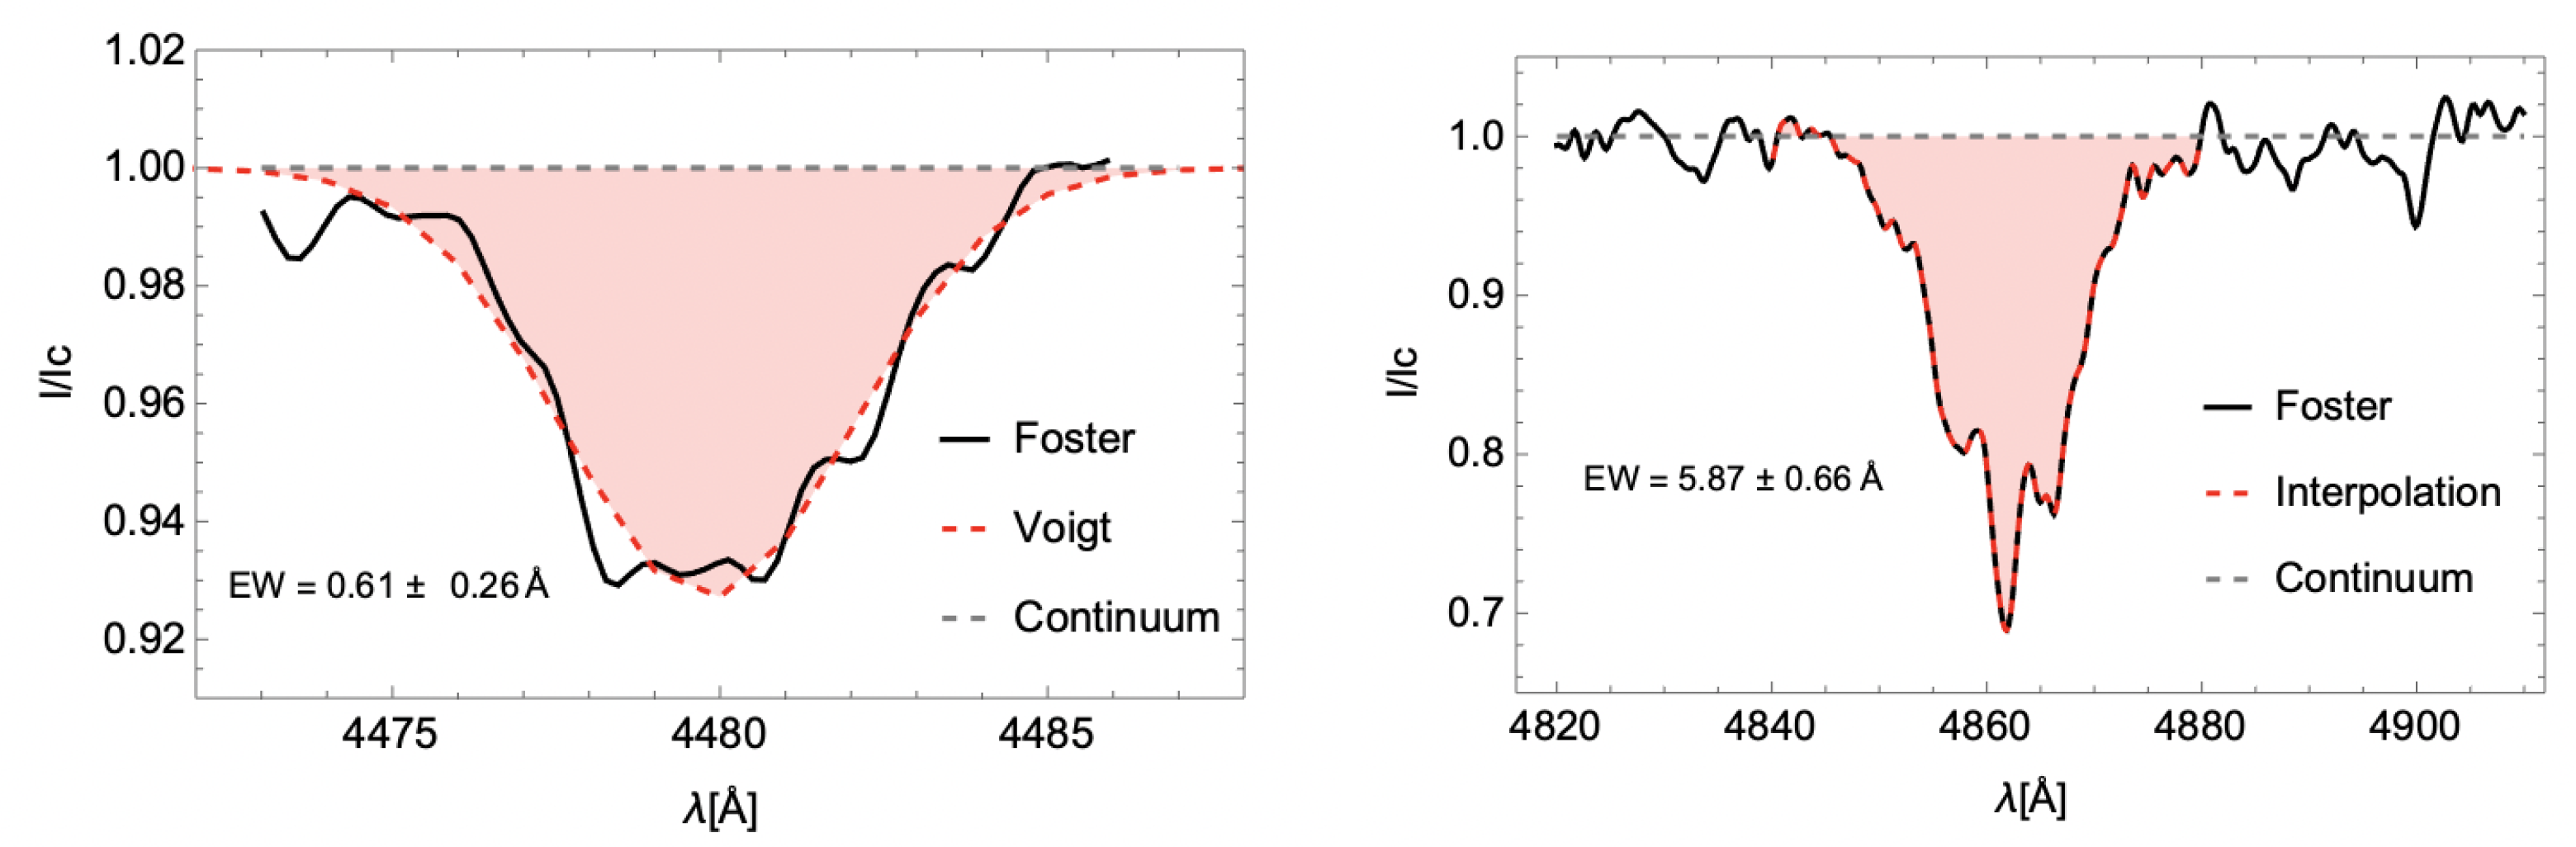
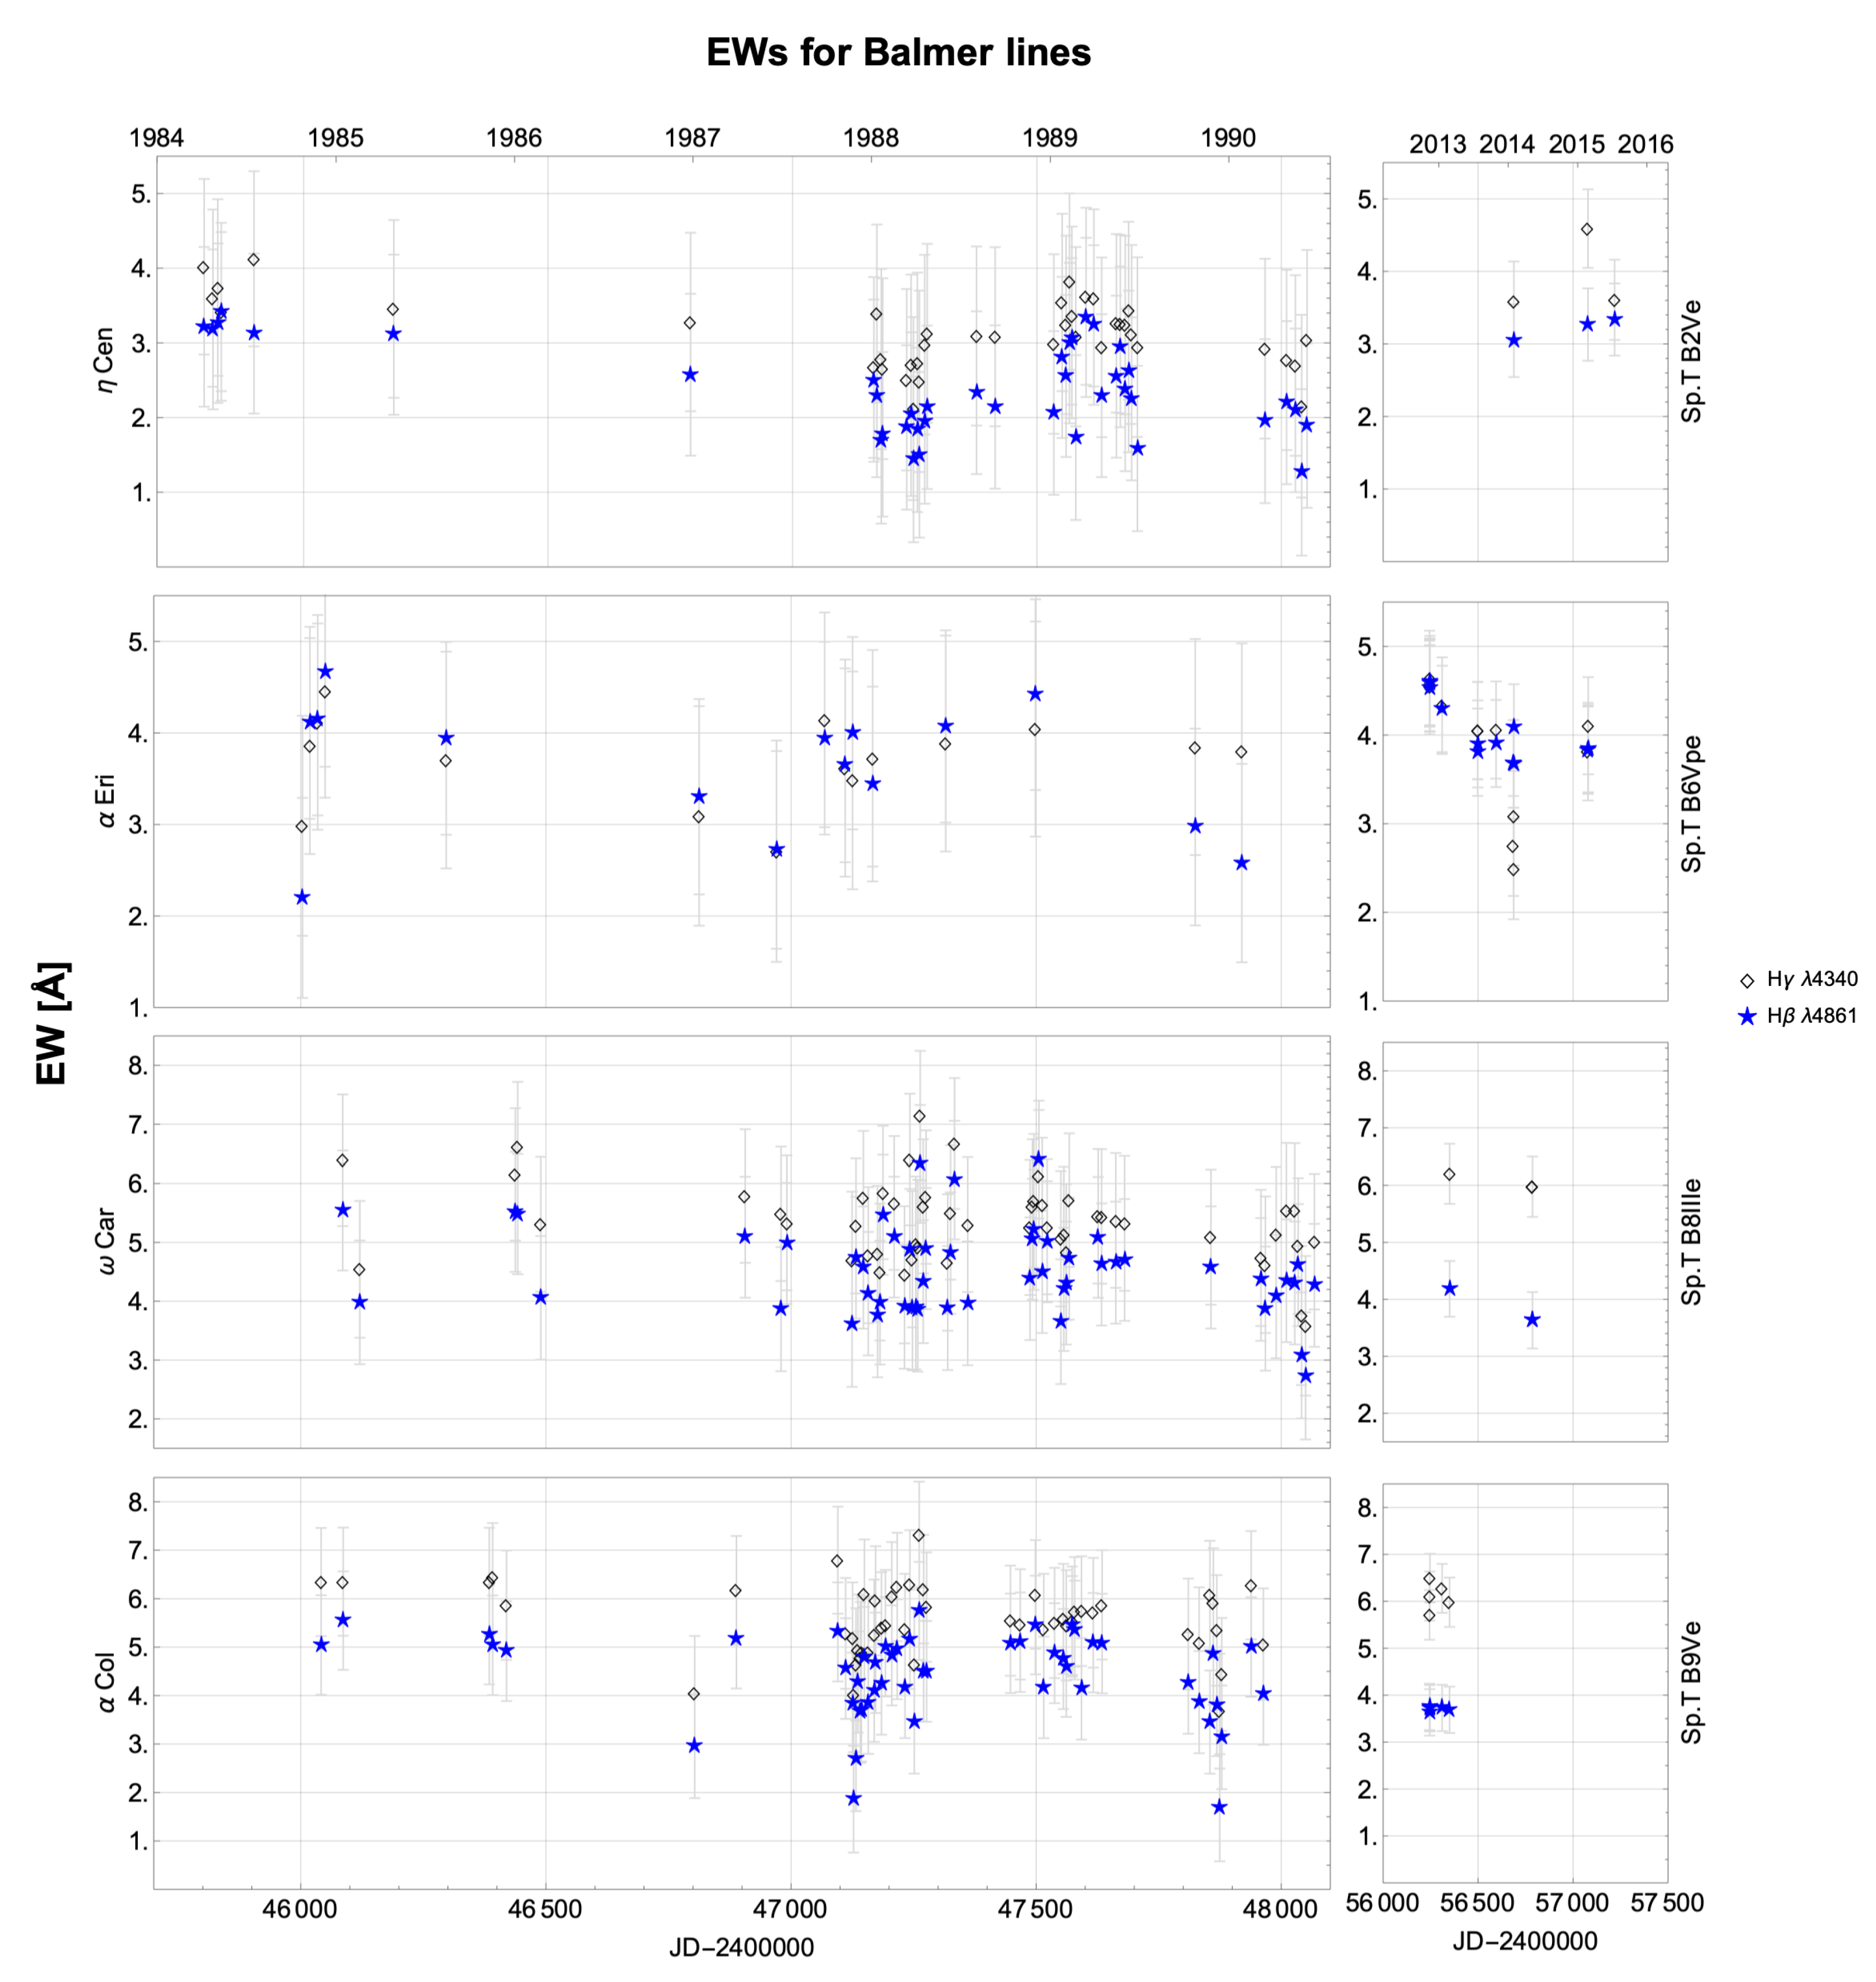
  • Identify hydrogen emission lines and quantify the strength through equivalent width (EW) measurements;
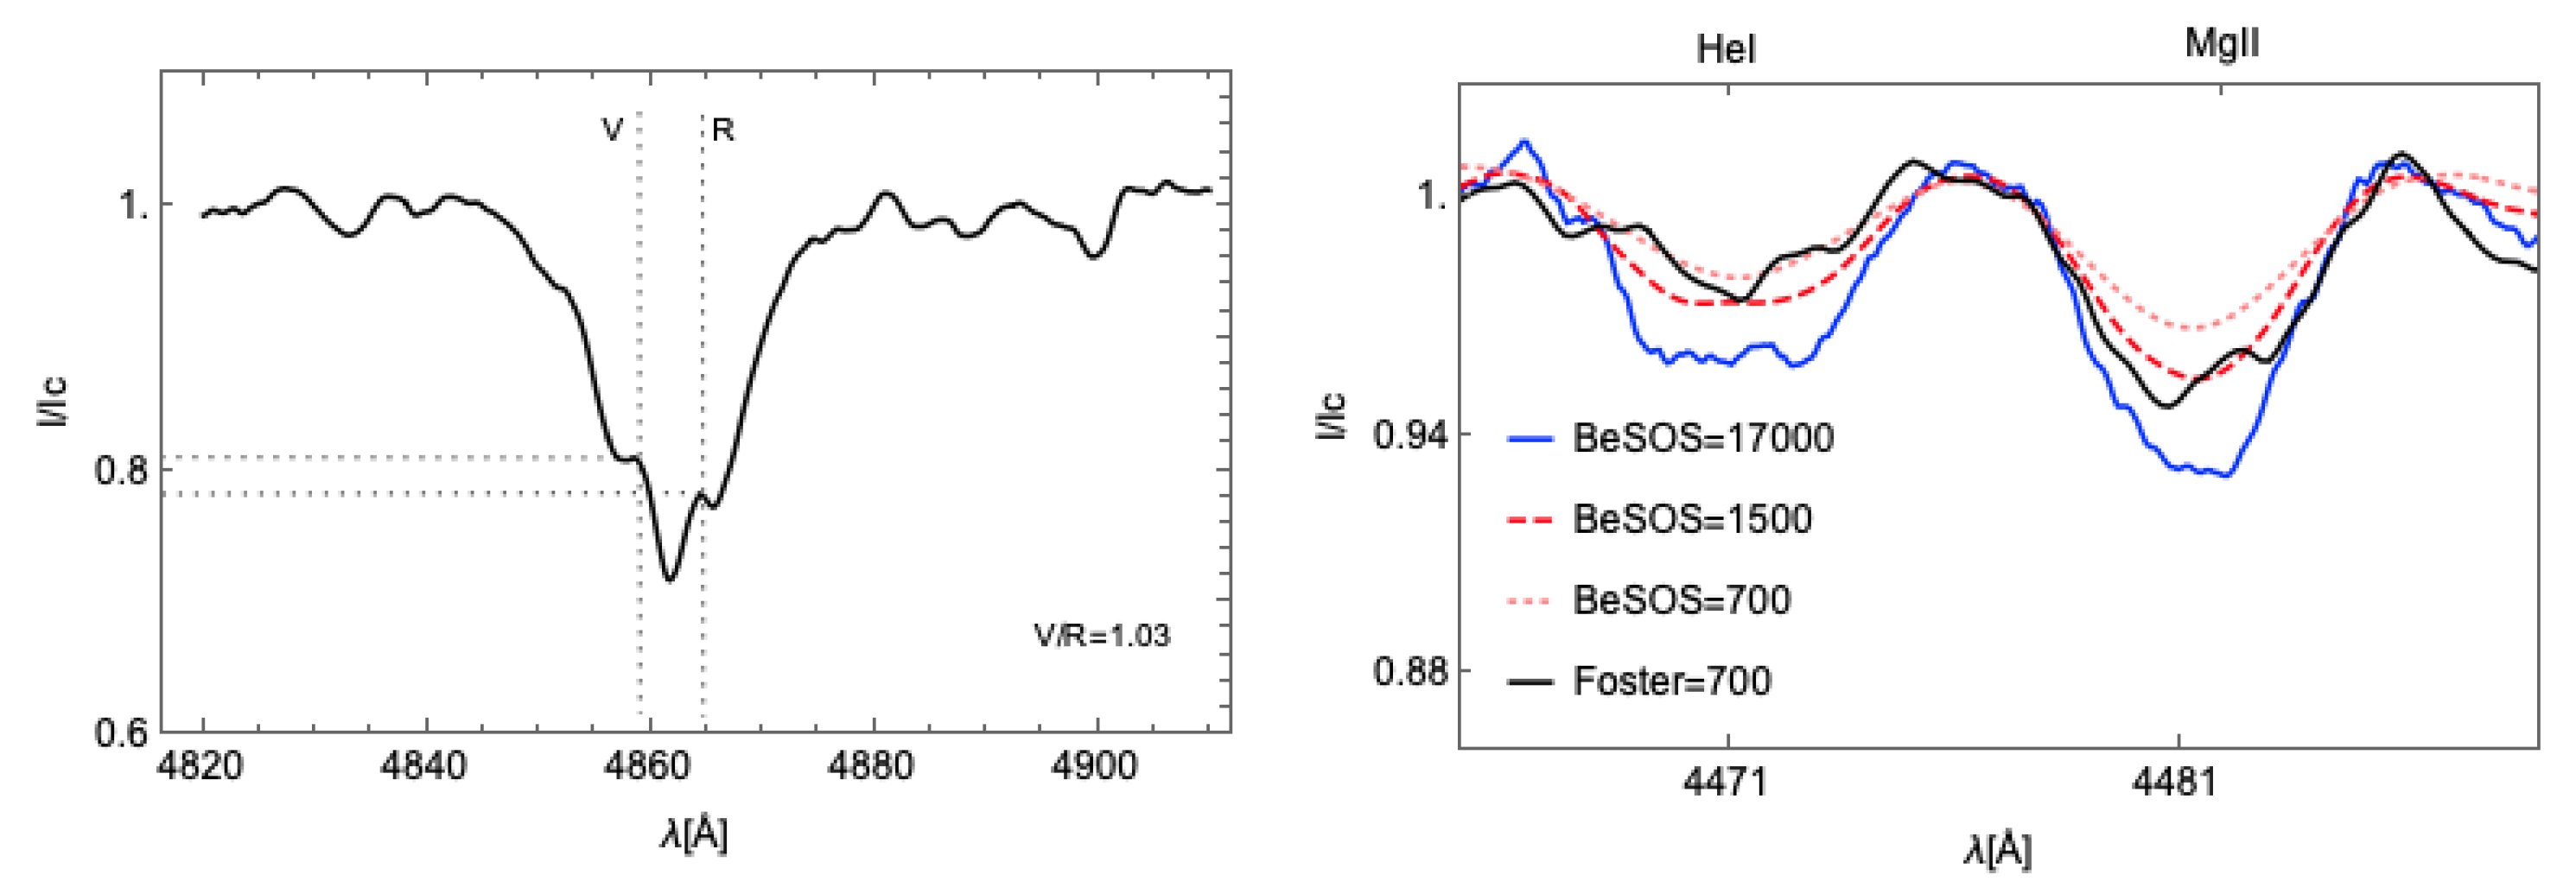
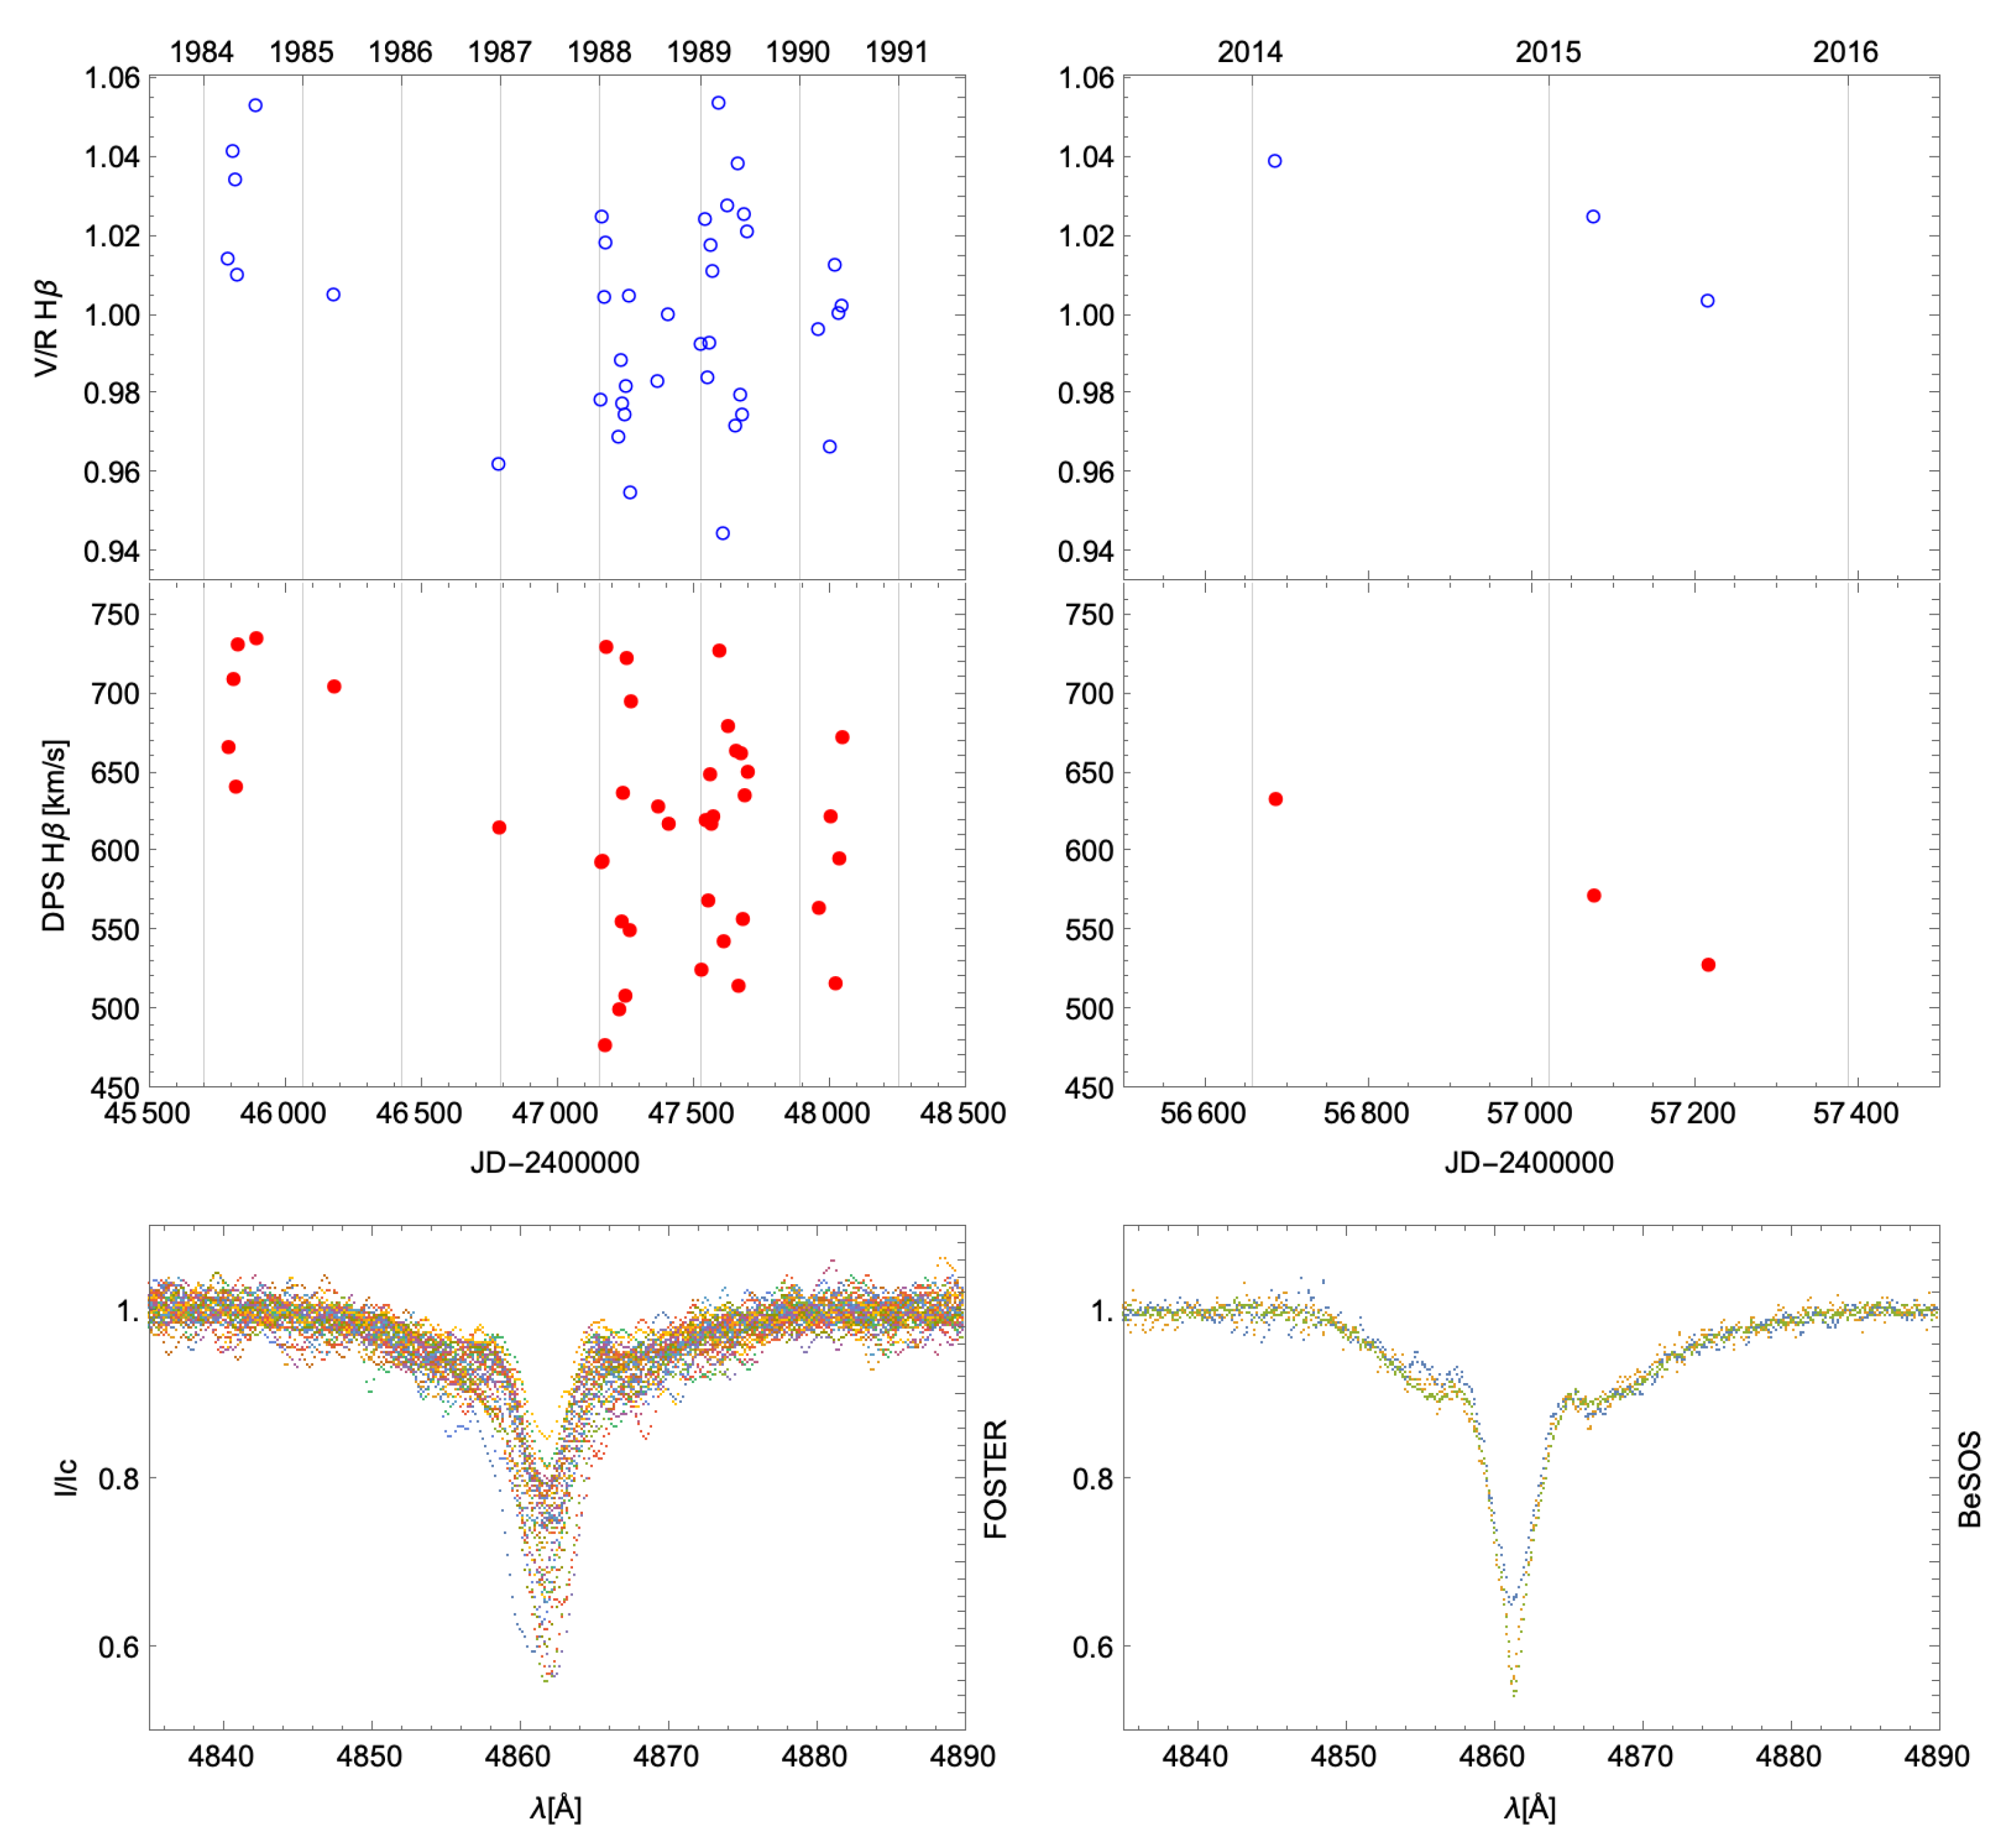
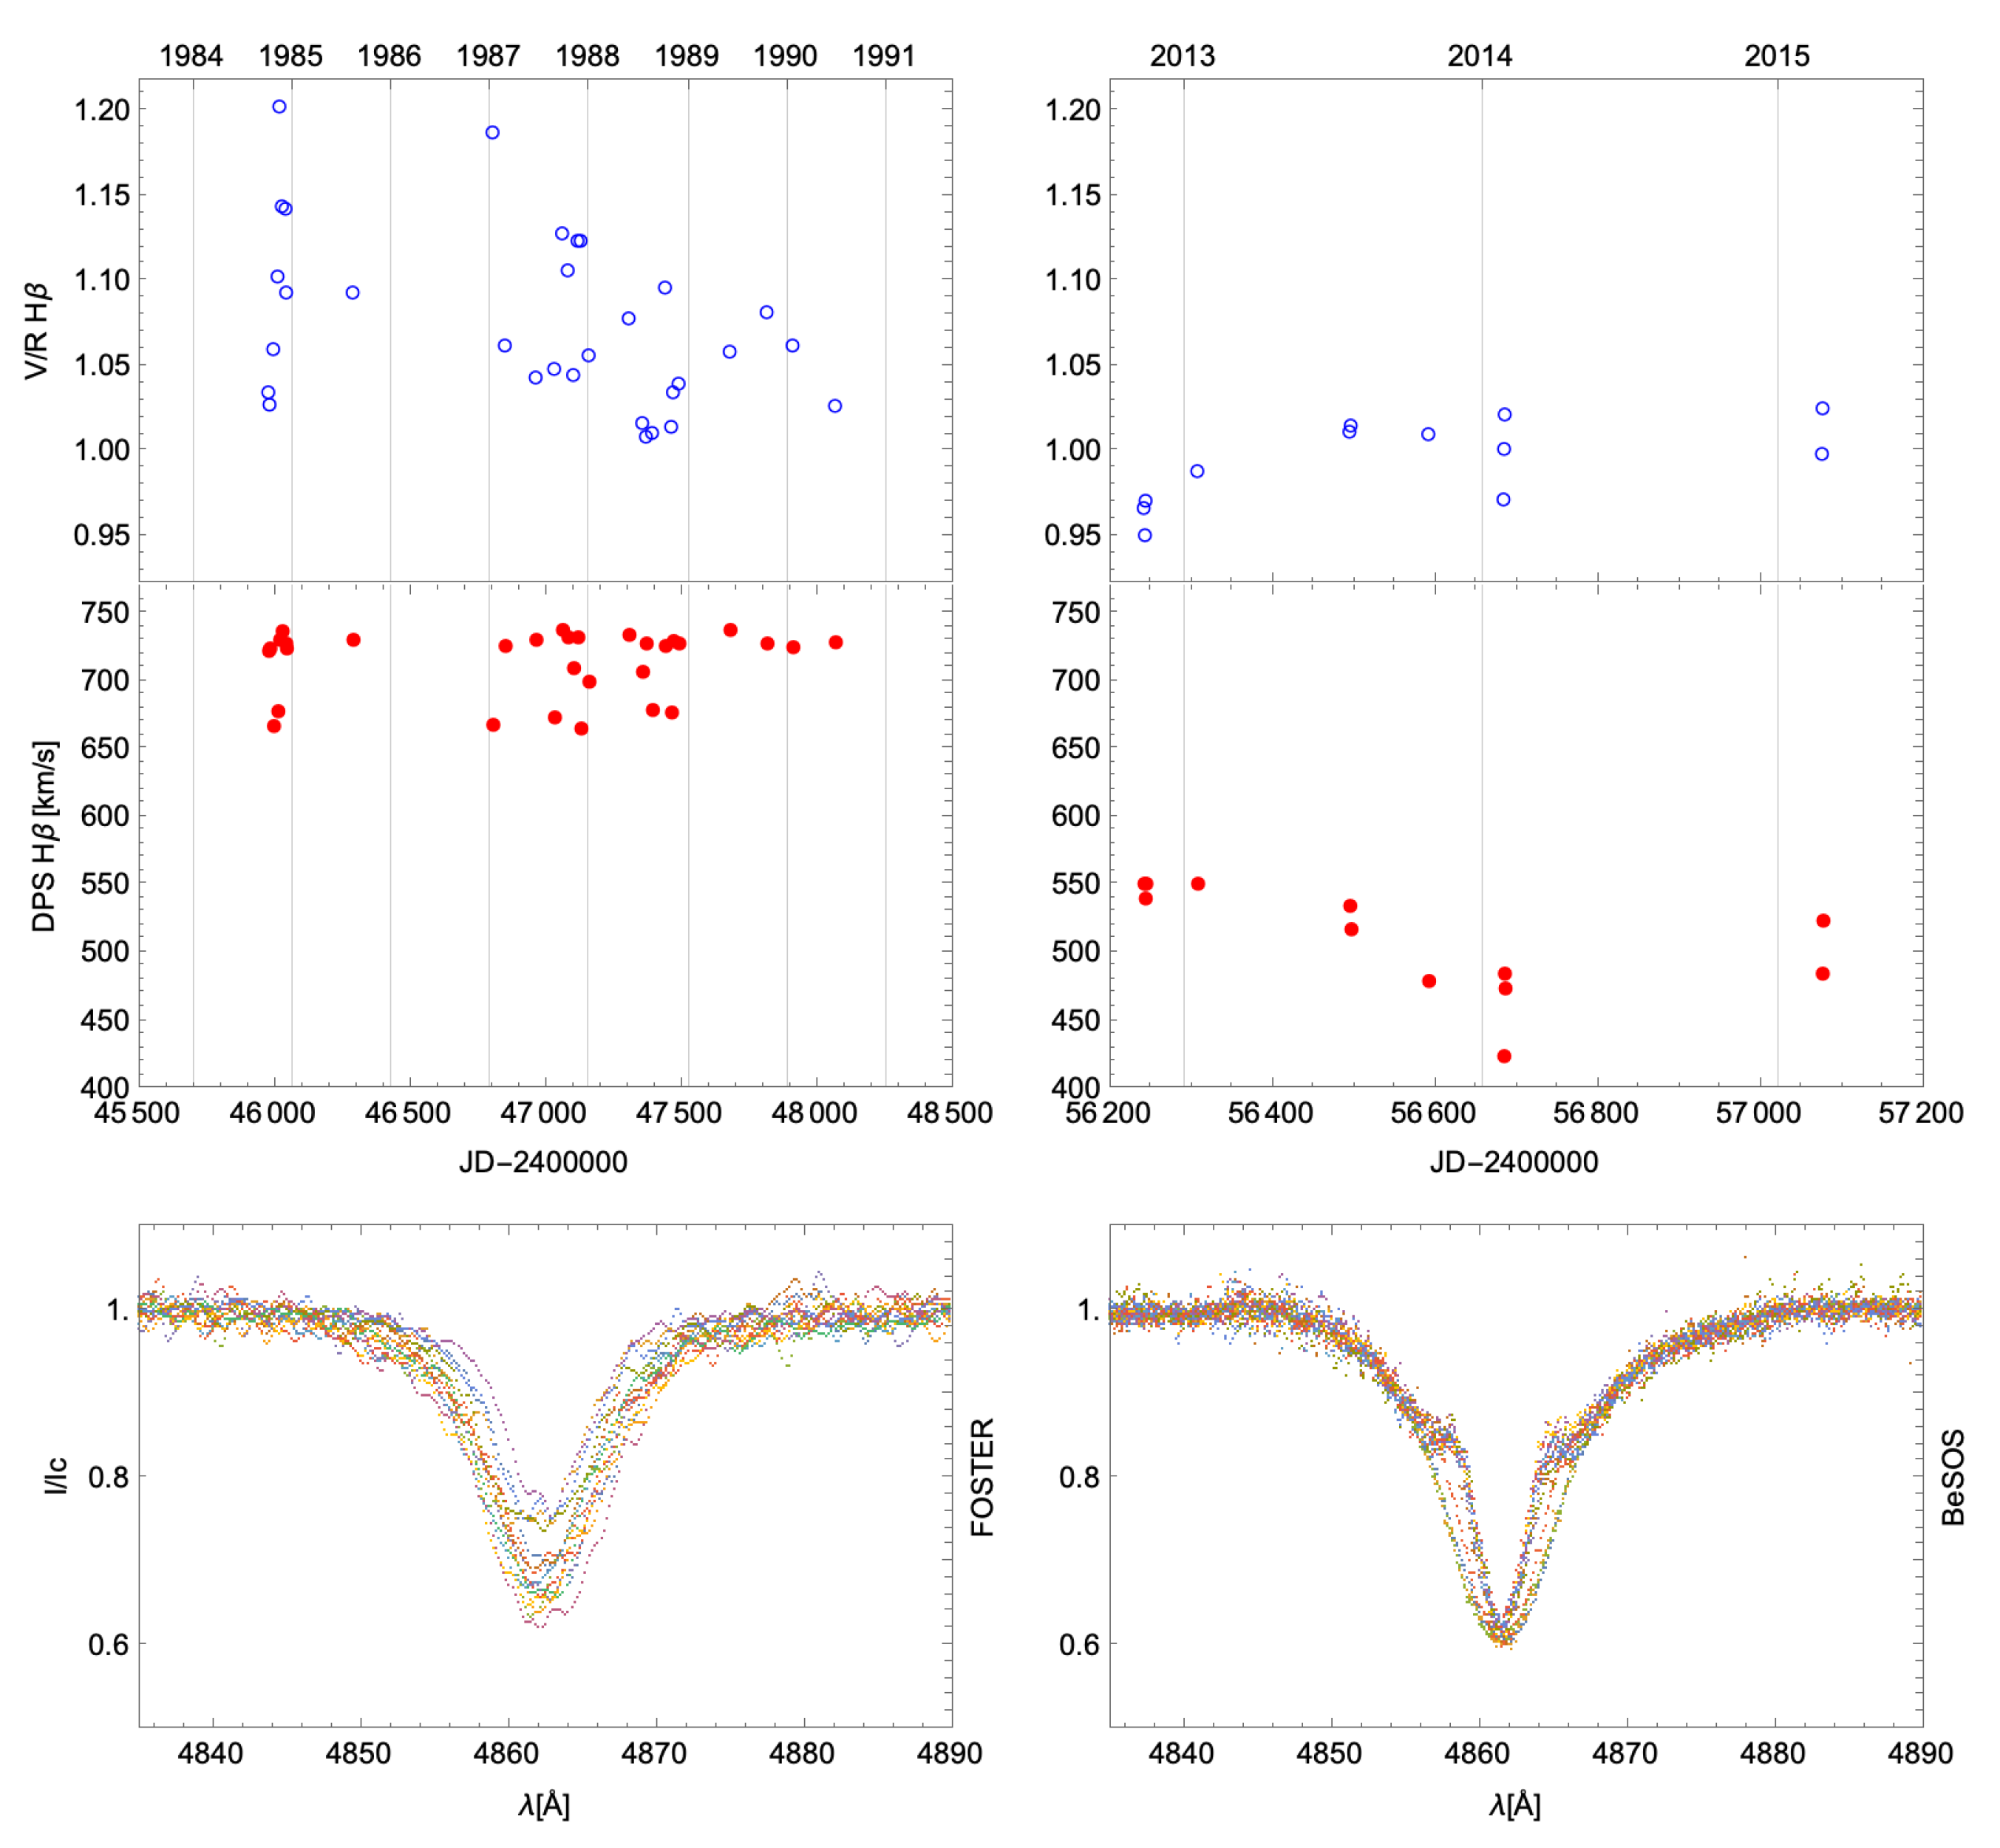
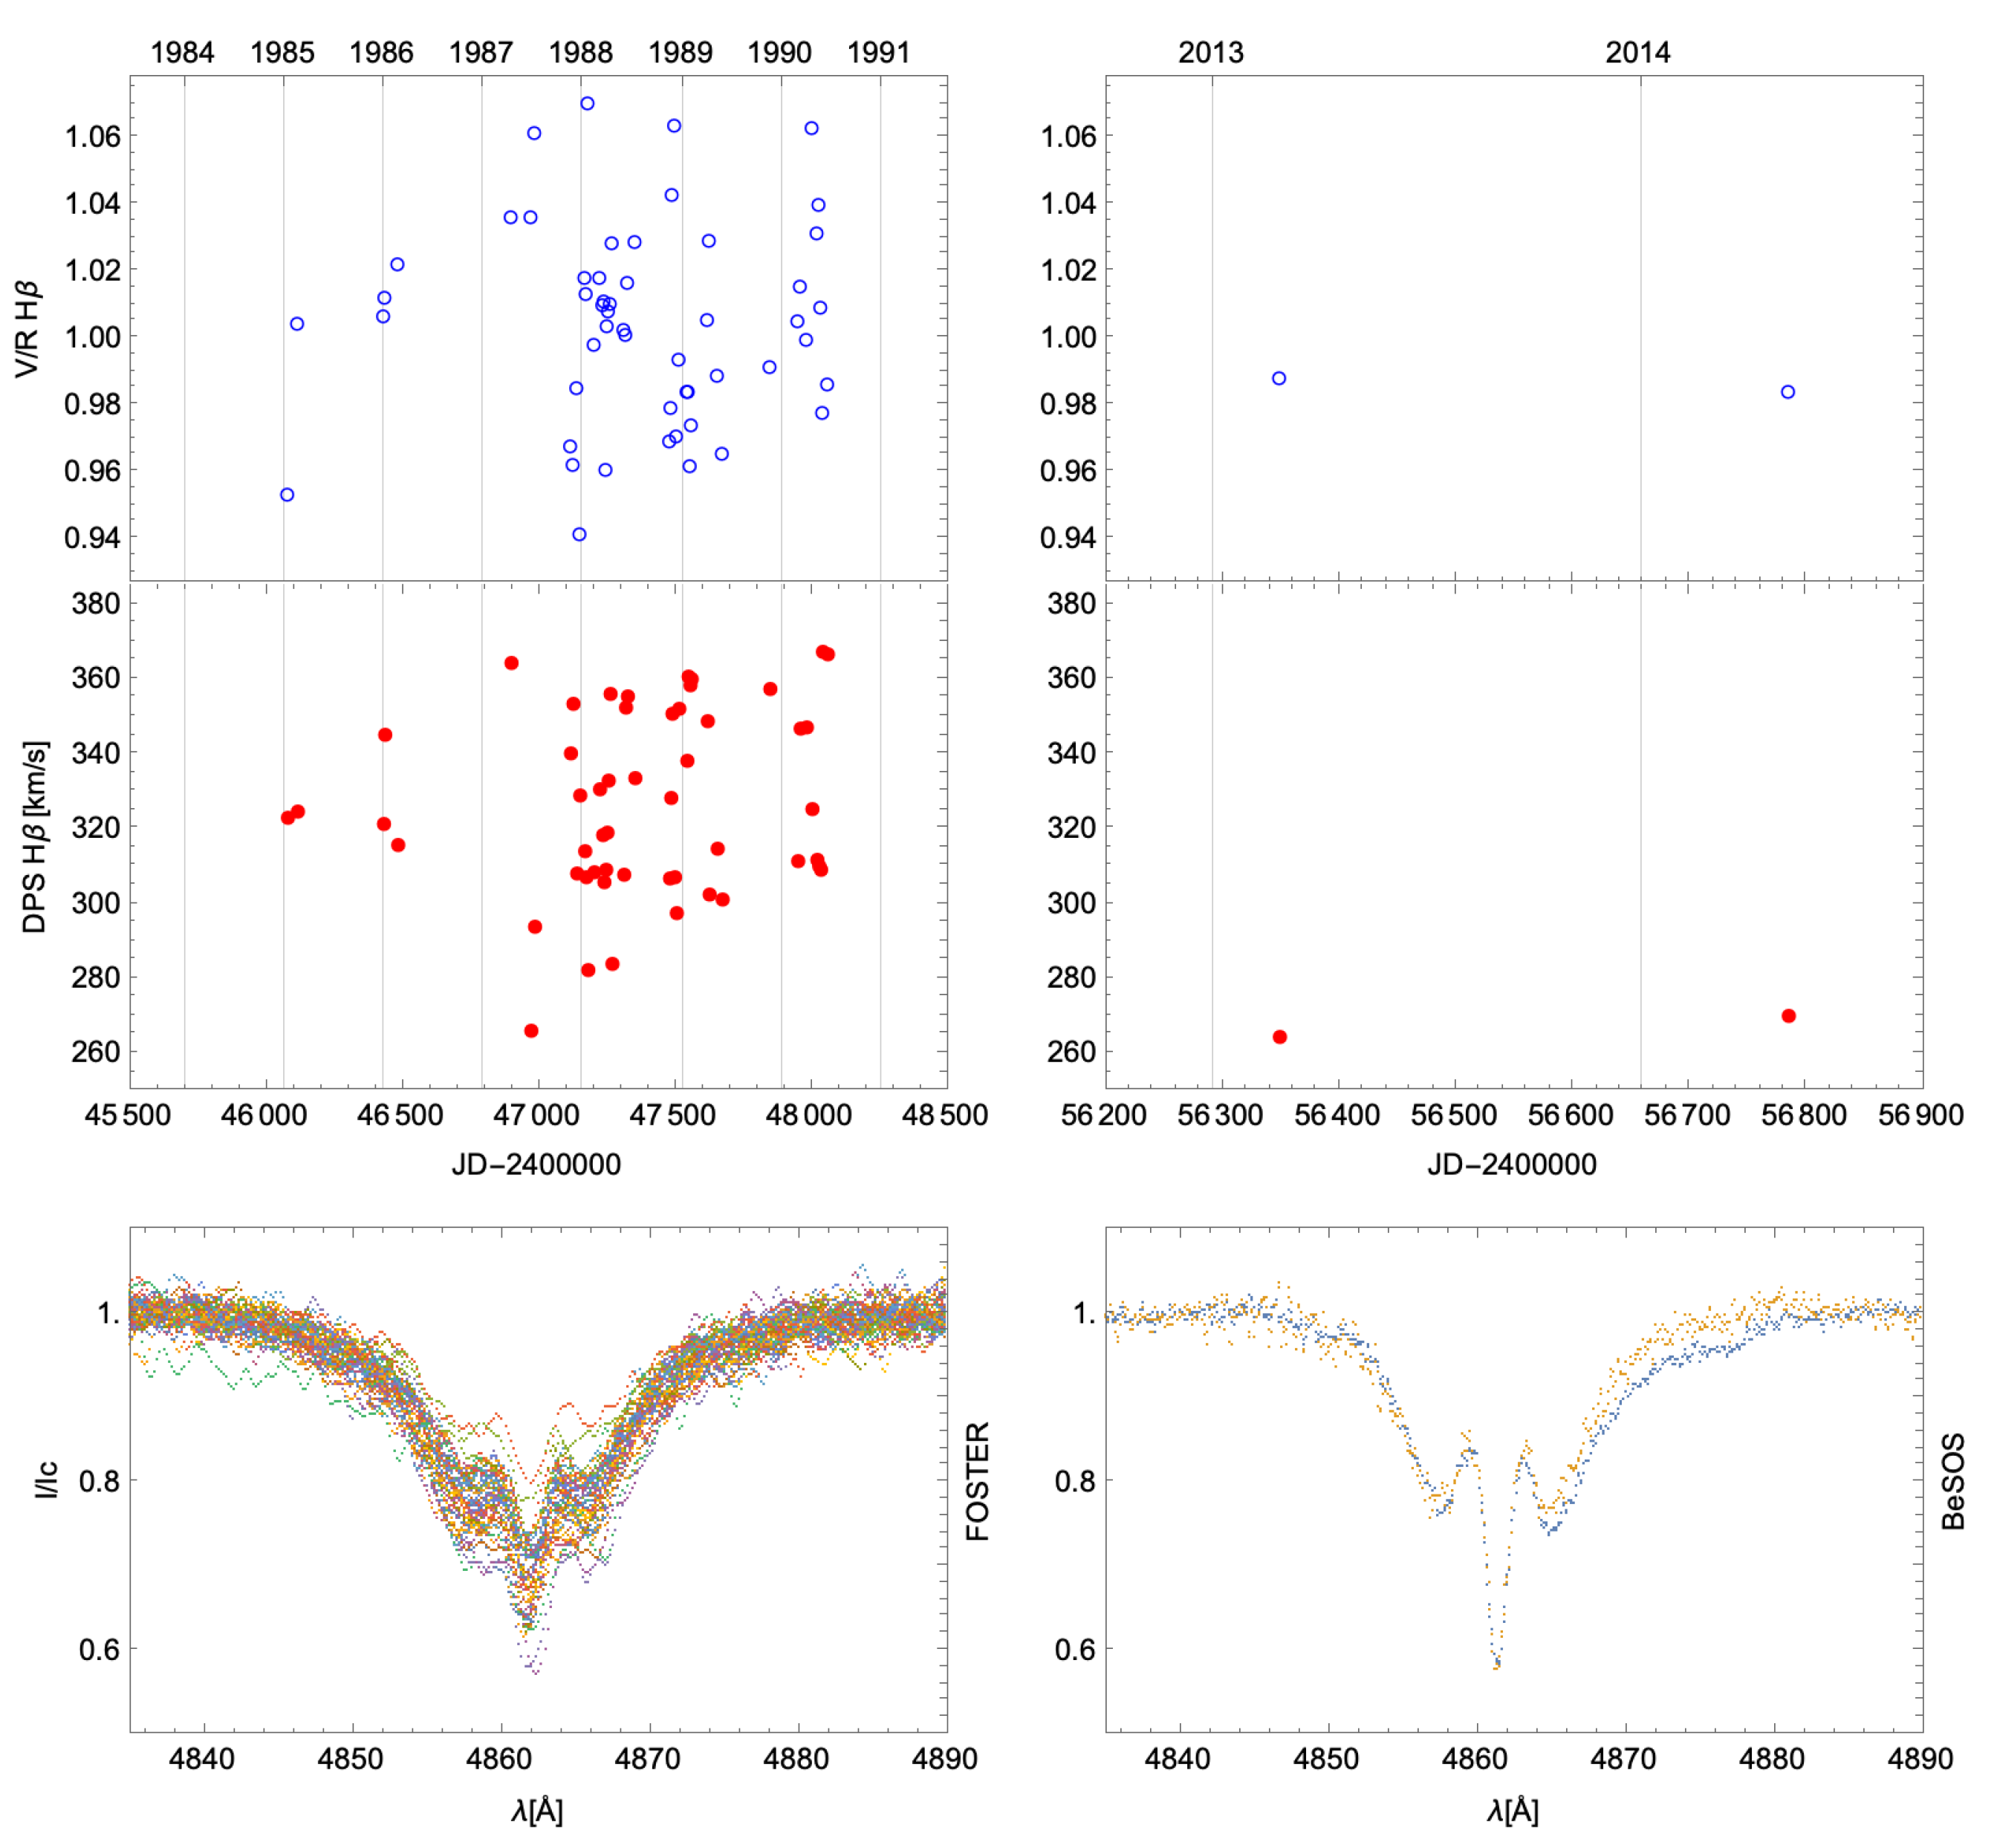
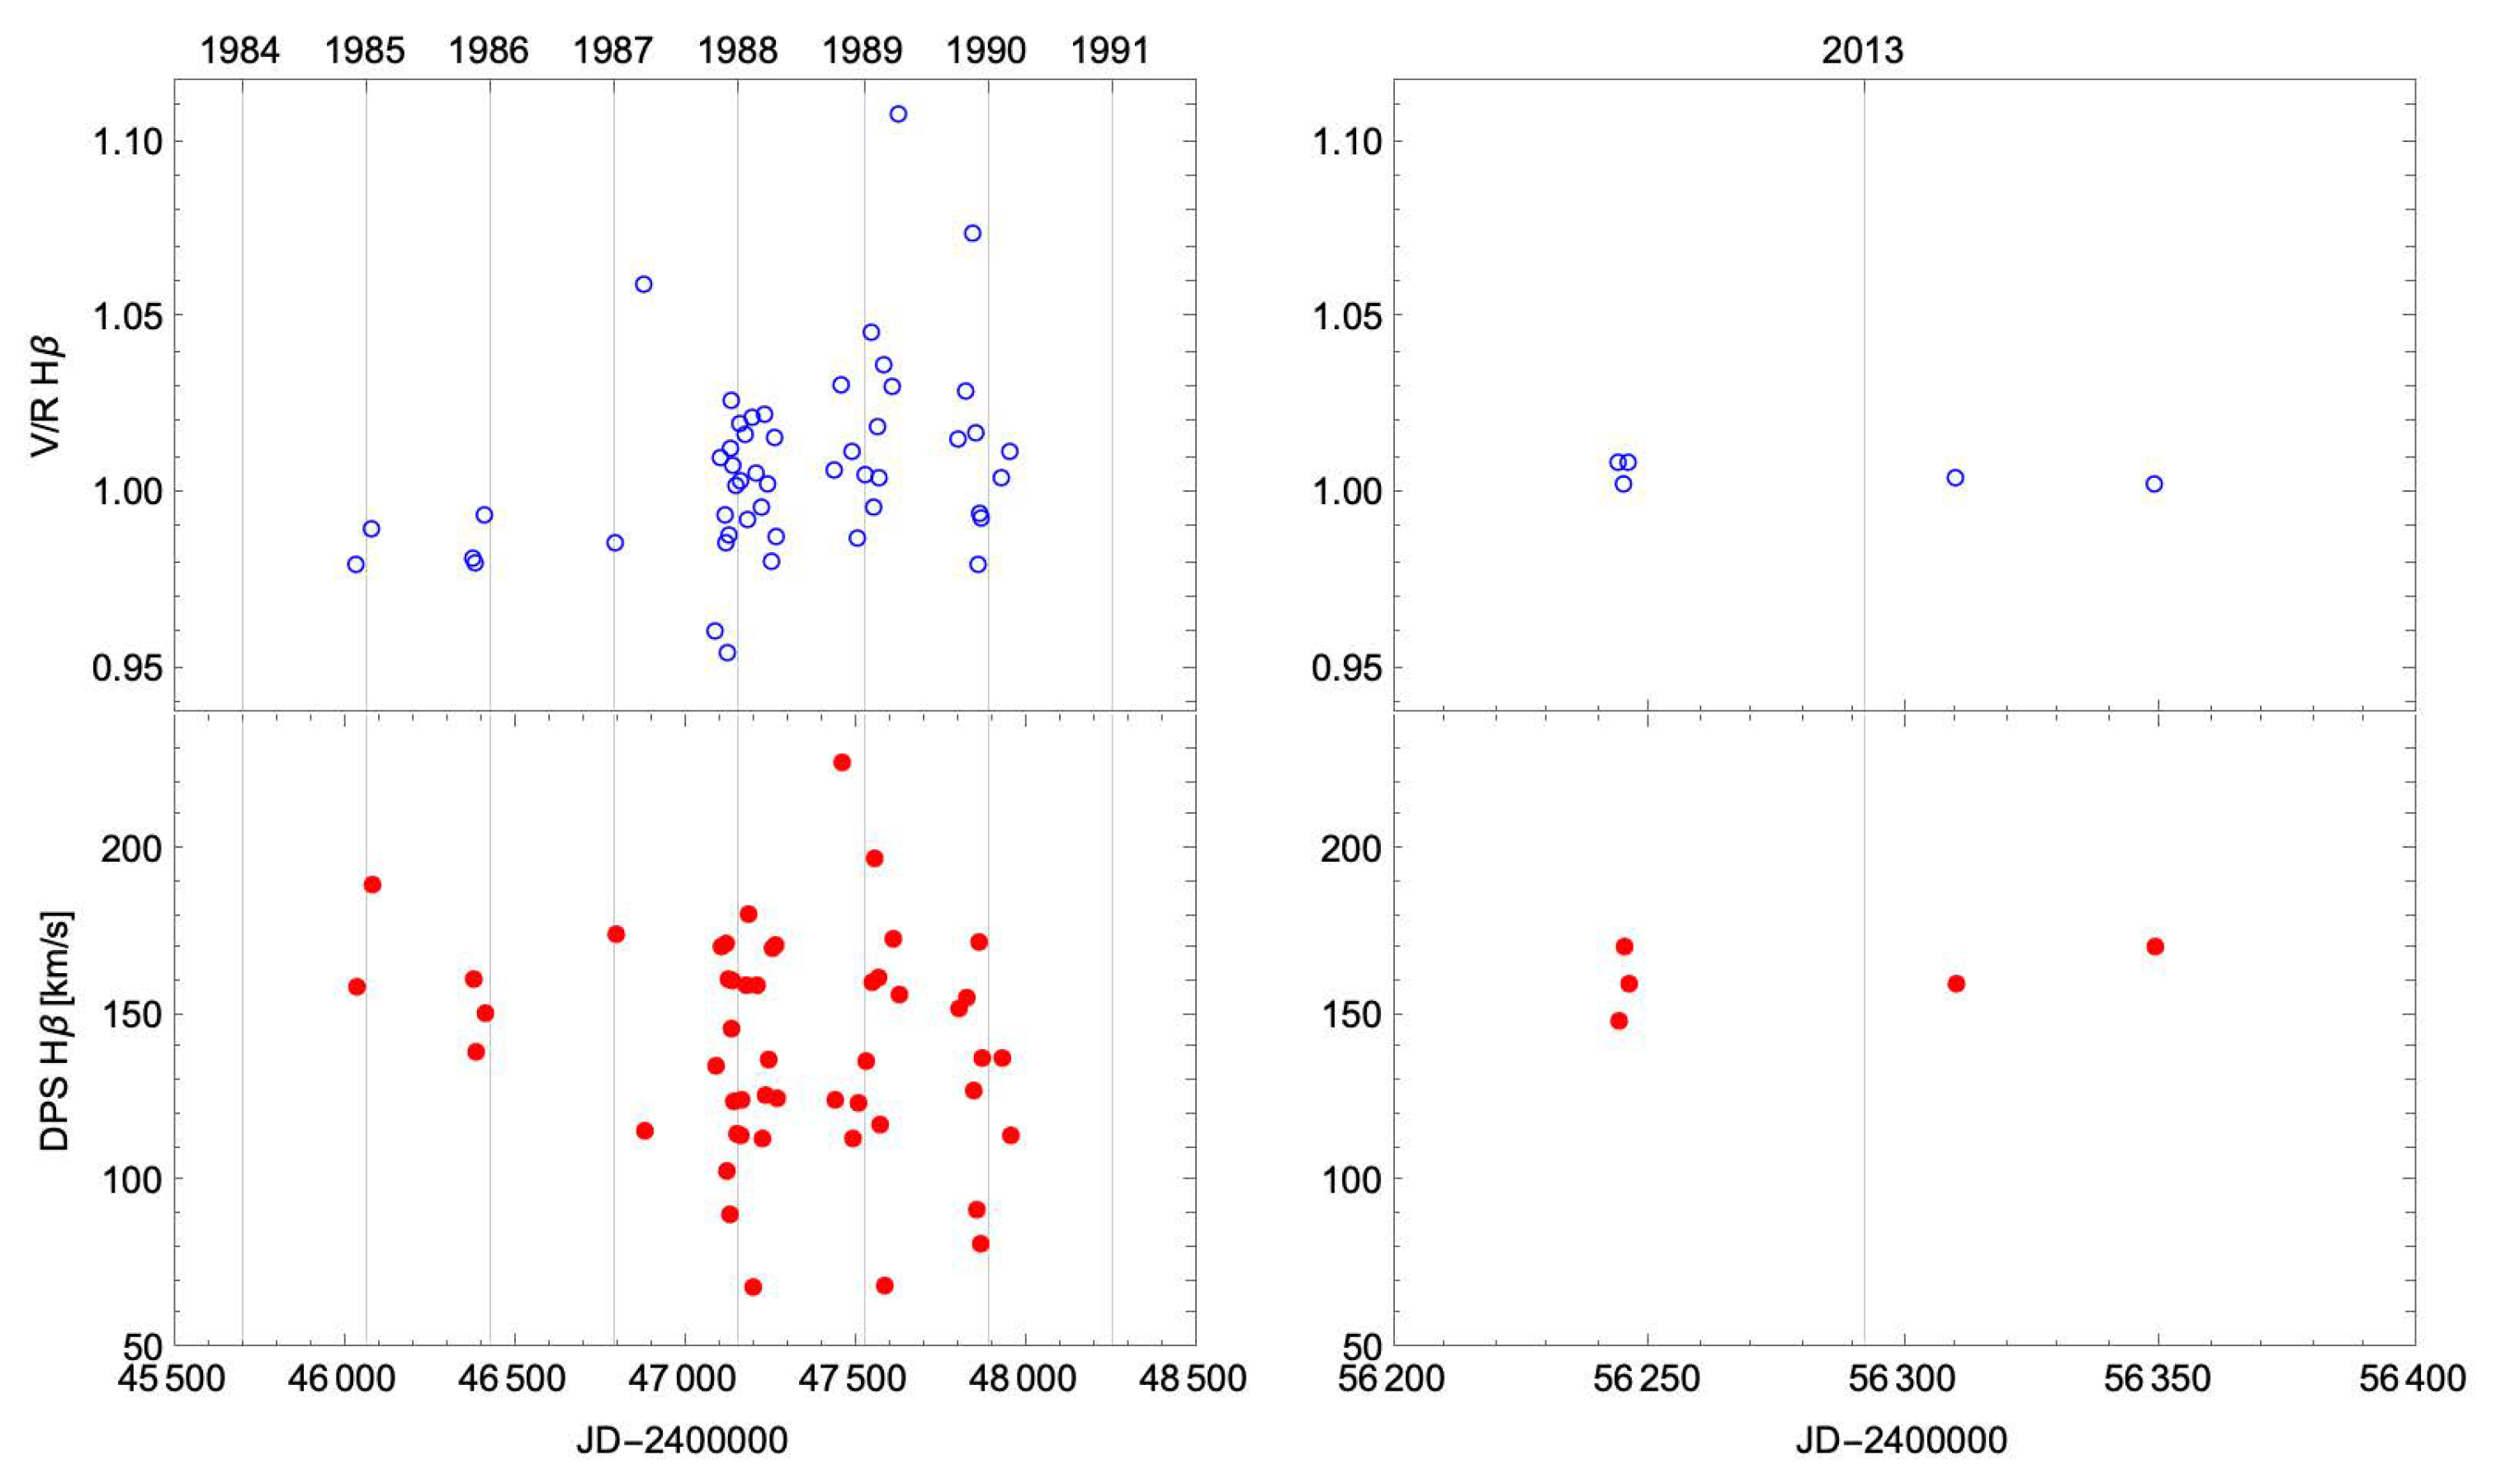
  • Measure the violet to red peak intensity ratio (V/R) and the double-peak separation (DPS) in the case of emission lines in the spectra;
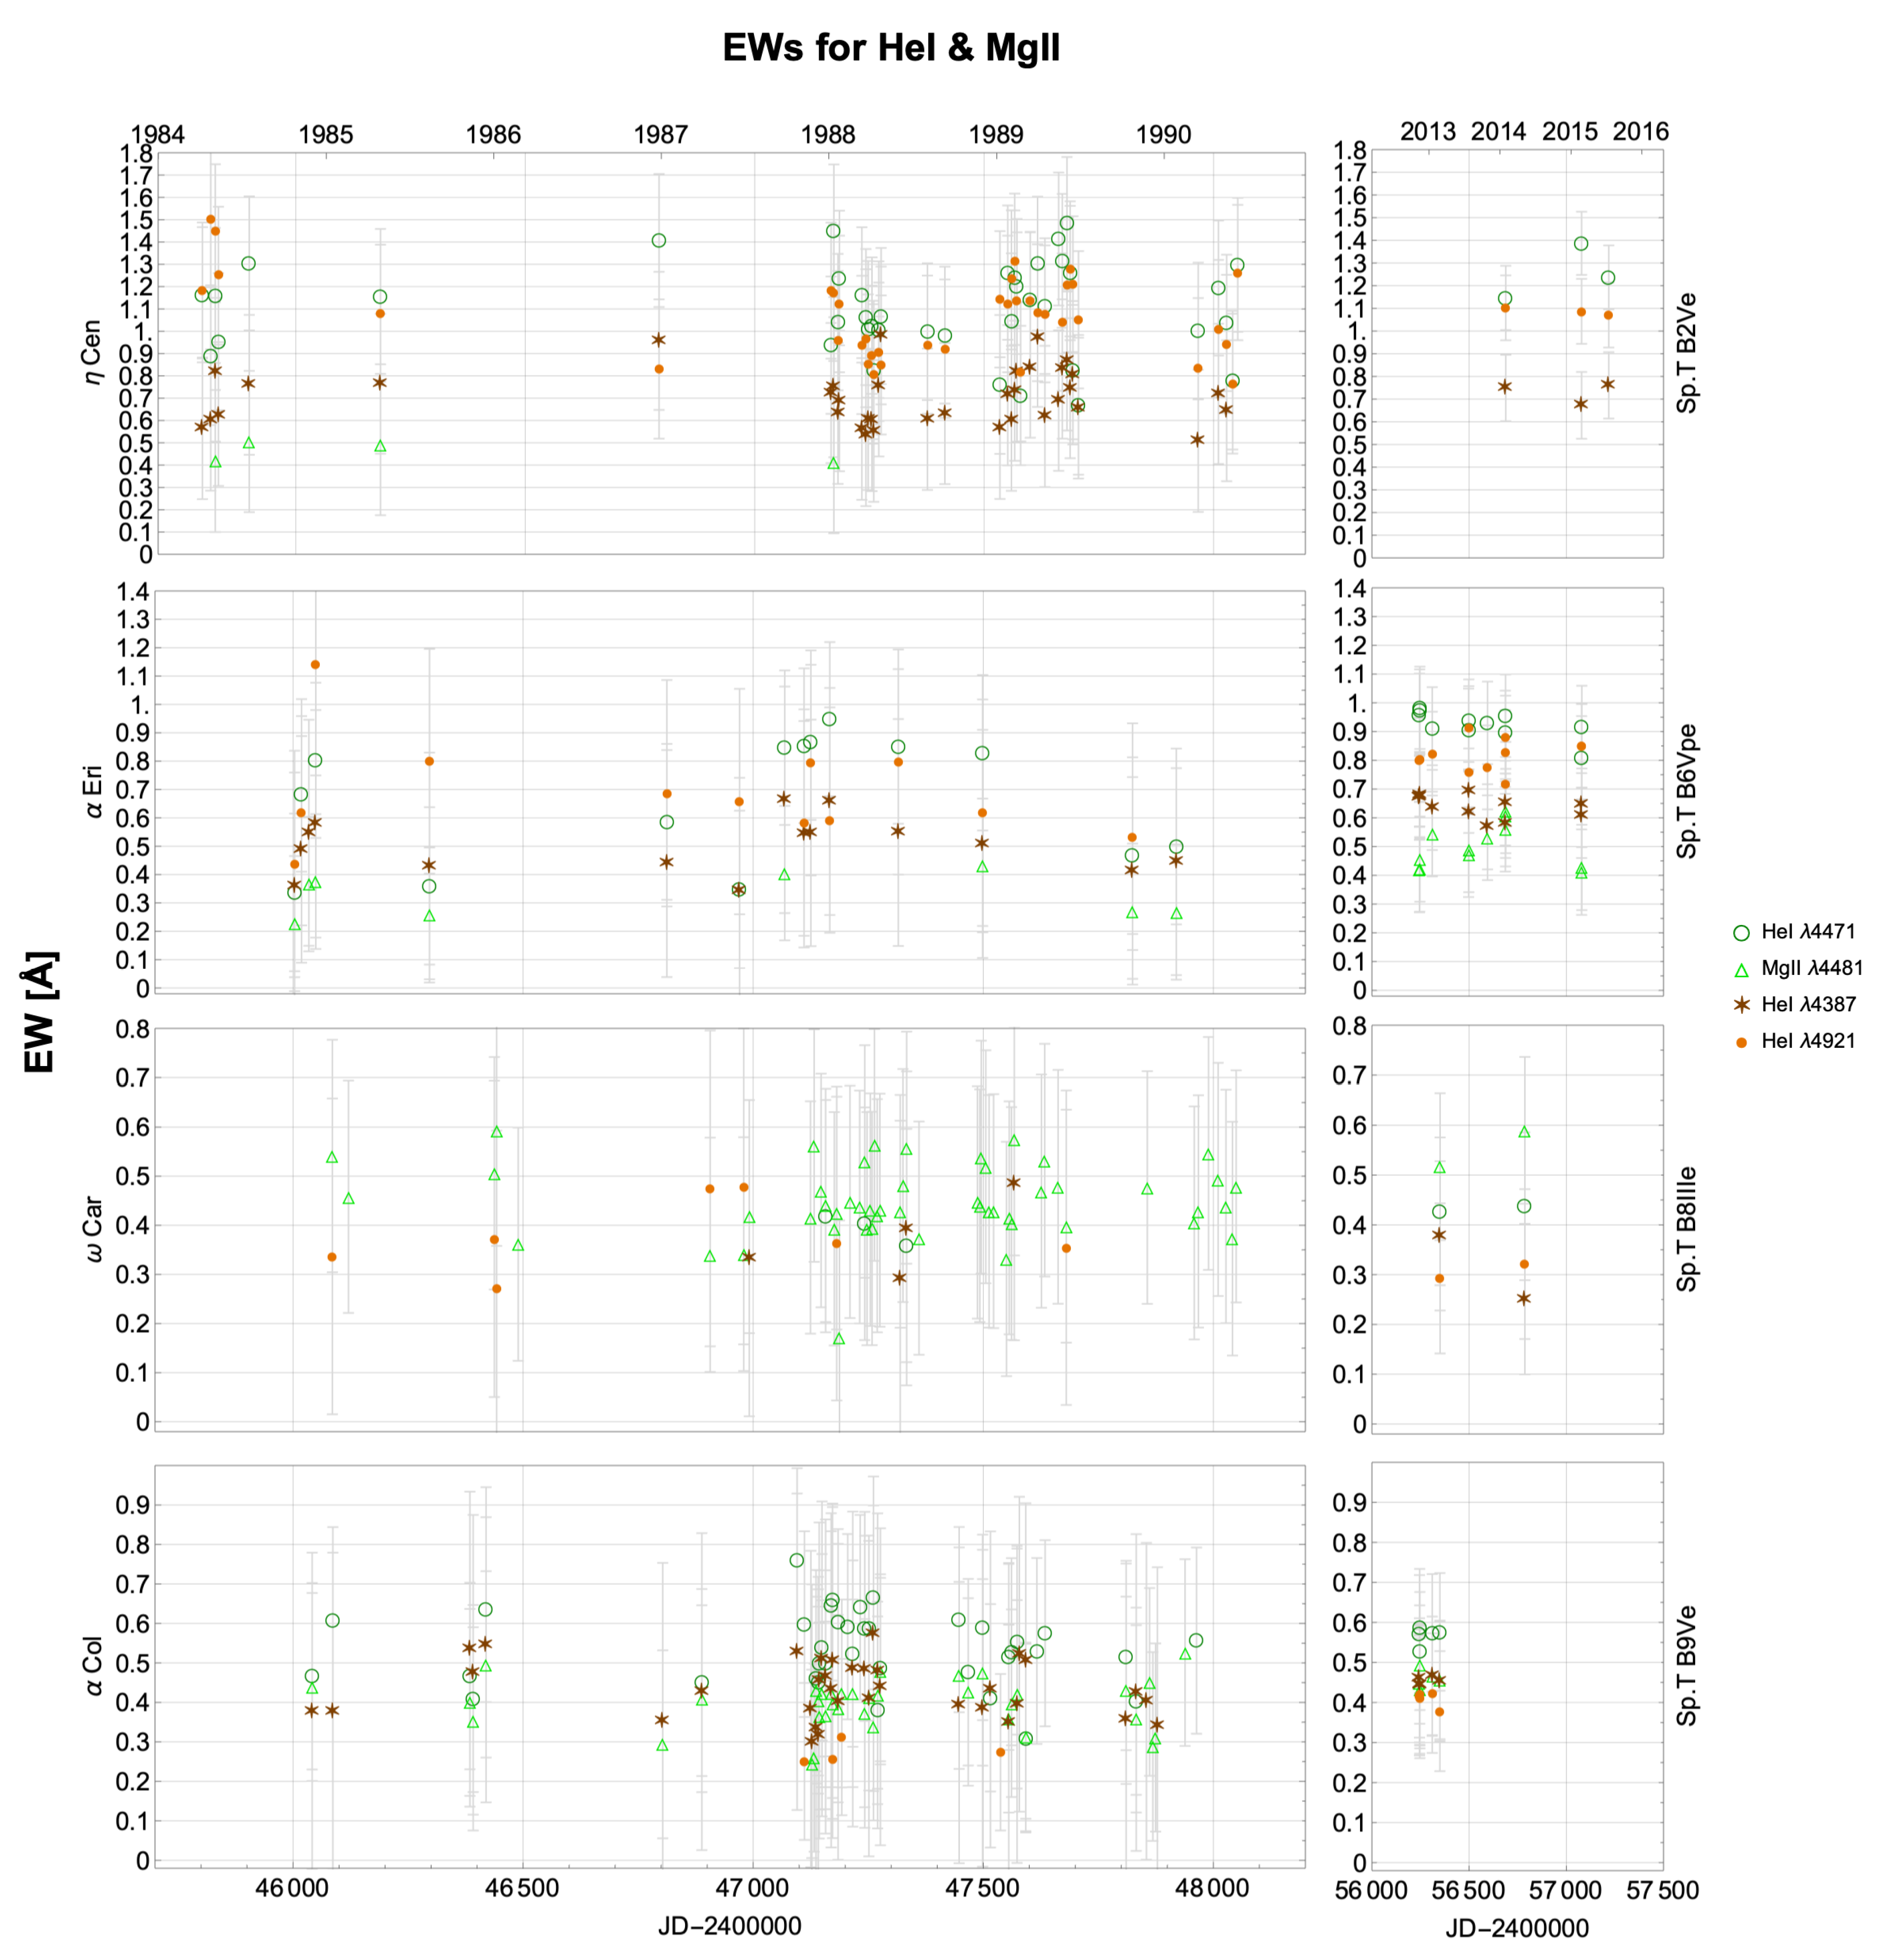
  • Measure EW variations in photospheric spectral lines, e.g., HeI/MgII;
  • Look for asymmetry in spectral lines.
In this work we analyze the spectral variability of four Southern Classical Be stars (CBes) observed with Foster. CBes are non-supergiant massive stars with spectral type spanning from late-O to early-A stars that show at least once in their life hydrogen lines and, sometimes, metal lines in emission in their spectra (e.g., H α , H β , Br γ ). This emission arises from a gas disk placed at the stellar equator in a thin geometric structure and rotating in a quasi-Keplerian motion [3,4,5]. The different disk stages, quiescence, active and disk-feeding (definitions proposed by Rivinius et al. [6] under which the disk goes through, are studied following temporal variations. The mid-term variations (order of months) are associated to V/R variations which are well explained by the theory of one-armed over-density wave [7]. The long-term line intensity variations (months to years) are directly associated to the formation or dissipation of the circumstellar disk.
Several works have been done in the last years to constrain Be stars’ disk and stellar parameters. The main question converges in understanding the mechanism(s) triggering a higher mass-loss rate at the stellar equator capable of driving a rotating equatorial gas disk. The proposed mechanisms include fast rotation [8,9], non-radial pulsations [10,11], stellar winds [12,13] and binarity [14,15] (see [16] for a complete review and references therein). To investigate these mechanisms it is necessary to study a large number of Be stars in different disk phases and monitor them over time to follow the evolution of their disks. Furthermore, looking for a correlation between the behavior of the spectral lines formed in the photosphere and the emission lines from the disk can give insight into the physics of the disk’s formation and dissipation. In this context, spectroscopic databases of massive stars covering extended period of time become very important to search for variability. Then, historical archives can reveal unexpected hidden treasures (see [17] as an example of the value of ancient spectra).
Spectroscopic plates from the Foster Observatory were used earlier in some research on Southern Be stars [18] including the study of optical spectra (3900–5100 Å) of 36 Be stars with measurements of hydrogen, HeI 4471 Å and MgII 4481 Å line profiles. They mostly focused on the variability of the HeI and MgII line profiles over time, finding an anti-correlation of the EW ratios that could be related to non-radial pulsations. A similar work was made by [19] for 10 Be stars and 4 “normal” B-type stars. They obtained similar values of HeI and MgII EWs when comparing a B star and a Be star of the same spectral type. However, they observed dependence of the HeI/MgII EW ratio with stellar rotation, i.e., HeI EWs become larger for faster rotators. Finally, in the case of [20] the authors found similar conclusions but using the measurement of H α EWs in the optical spectra of 42 Be stars observed at CTIO. They found a dependence between H α EWs and spectral types, being lower for later-type Be stars.
Other publications describing variability of Southern Be stars observed with Foster, as well as estimations of the disk cycle, disk size and rotational velocity of the star are reported in the literature (see [21,22,23] as examples), probing the potential information contained in these spectroscopic plates.

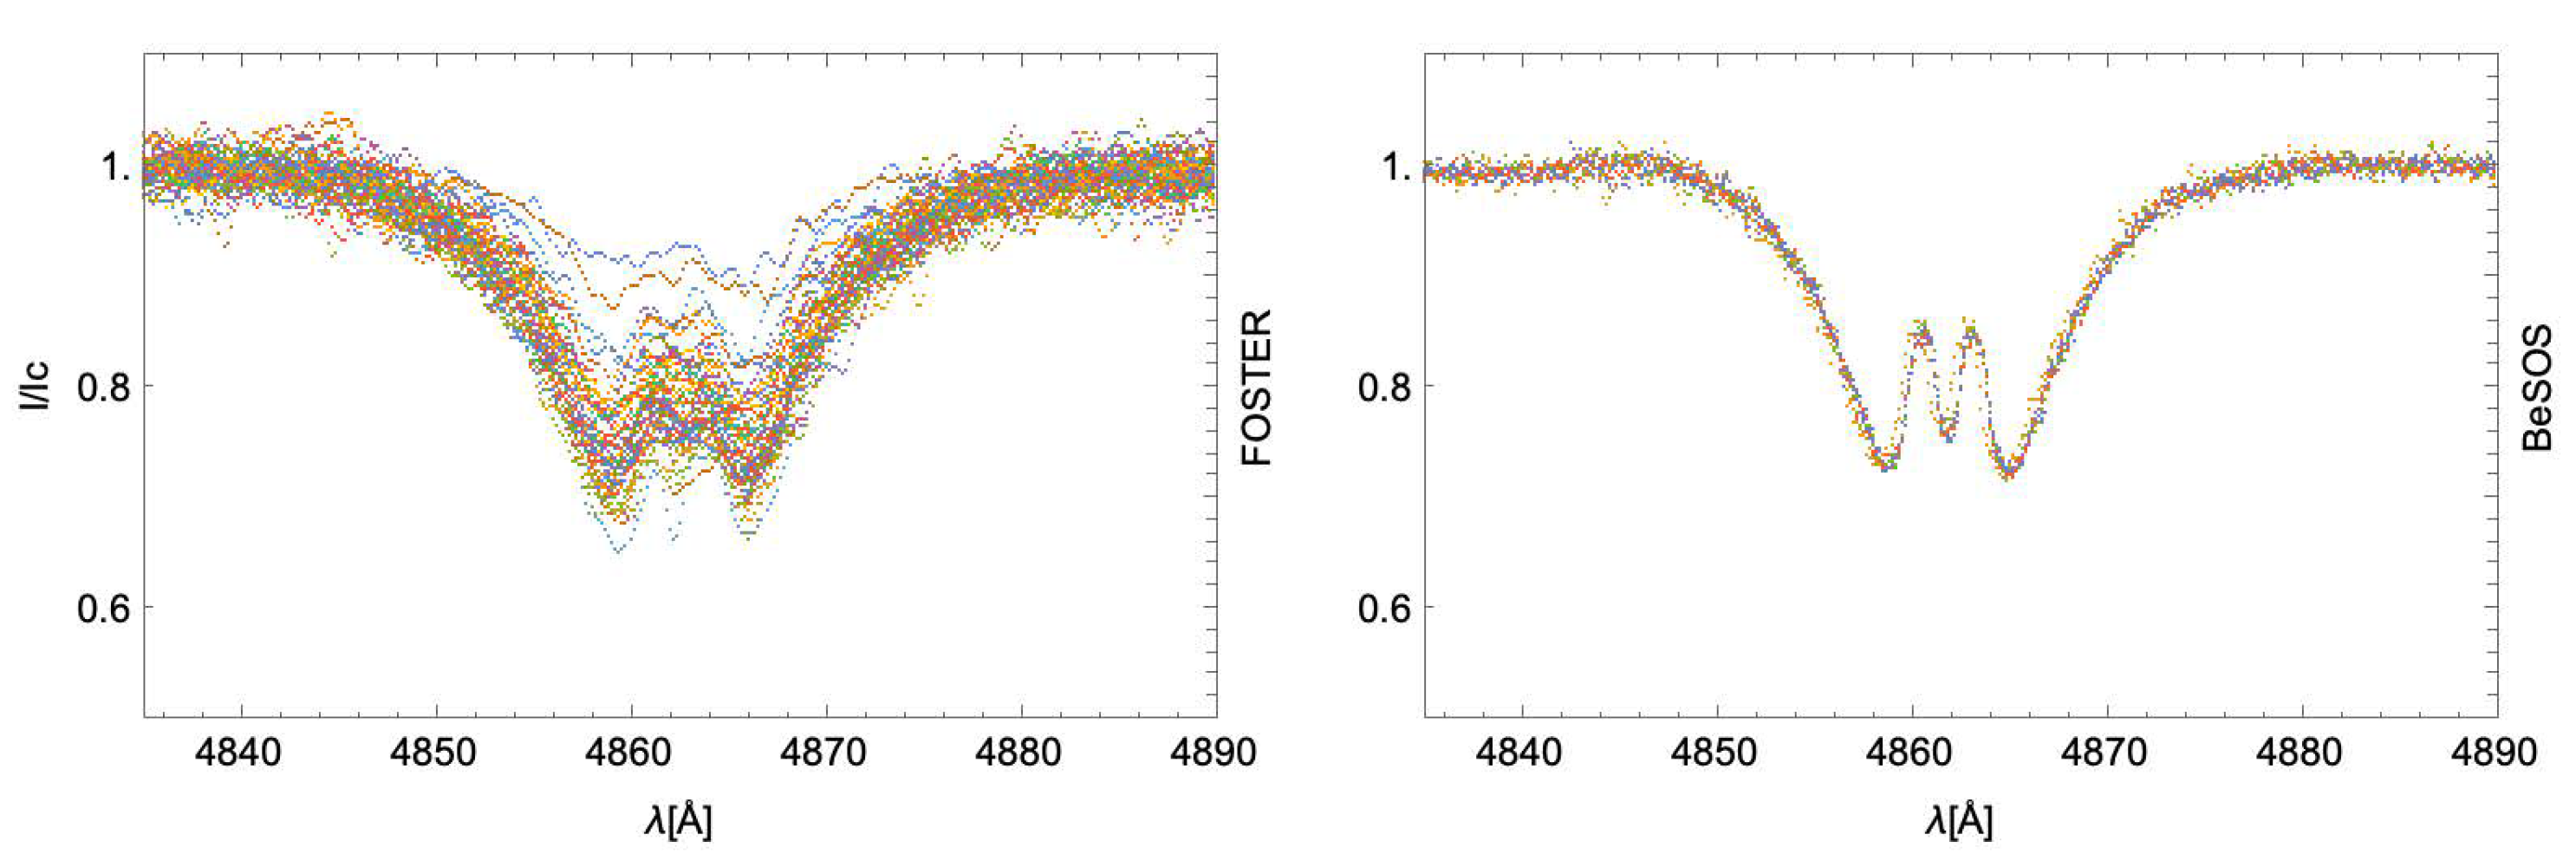
2. Extracting the Spectra from Foster Plates

2.1. Observations and Archive Properties

The 2-prism version of the Mills spectrograph, used during the latest activity period of the Manuel Foster observatory, gives a dispersion of 20 Å/mm at H γ and a useful wavelength range from 3900 to 5150 Å. The spectrograms were secured on Kodak II-aO plates (after baking with Forming gas). He-Ar lamps served as wavelength comparison line sources acquired before and after the science observations. The slit configuration of the spectrograph and the position of the He-Ar lamps can be seen in Figure 1 of [2] which also describes the method for intensity calibration. Calibration plates were taken during most observing nights; however, their posterior analysis showed that the final calibration curves (density to intensity relation) did not vary significantly from night to night, because during the entire campaign always the same plate type and the same baking and developing procedures had been applied. Therefore, we finally decided to use in our present analysis a mean calibration curve, as already presented in Figure 4 of [2].
The archive contains more than 4800 stellar spectrograms of 276 different target stars (see online excel document (https://docs.google.com/spreadsheets/d/1h2o_MItVYwjV8F2V3rpG0eLDCQiuq-43mYGuExAUFAY/edit#gid=0, accessed on 5 October 2022). For 88 of them ≥ 10 spectral plates at different epochs are available, the maximum number is 219 plates for the Wolf-Rayet star γ Velorum. 99 of these targets refer to B III-Ve spectral types with an average coverage of 45 spectrograms per star mostly observed between 1984 and 1990. The line profile variability was the main aim of this campaign. However, the number of plates should be taken as an upper limit, because some of the plates are probably not very useful, affected by bad weather conditions or technical problems, resulting in saturation or underexposure. The remaining targets refer to OB supergiants, A-K supergiants, A-M giants, A-F main sequence stars and Wolf-Rayet stars. The faintest star is V = 5.7 mag, but most of them are in the range 0.5 m V 4.5 m . We recompiled names and observation years of all Be stars in the Foster archive which are list in Table A1.

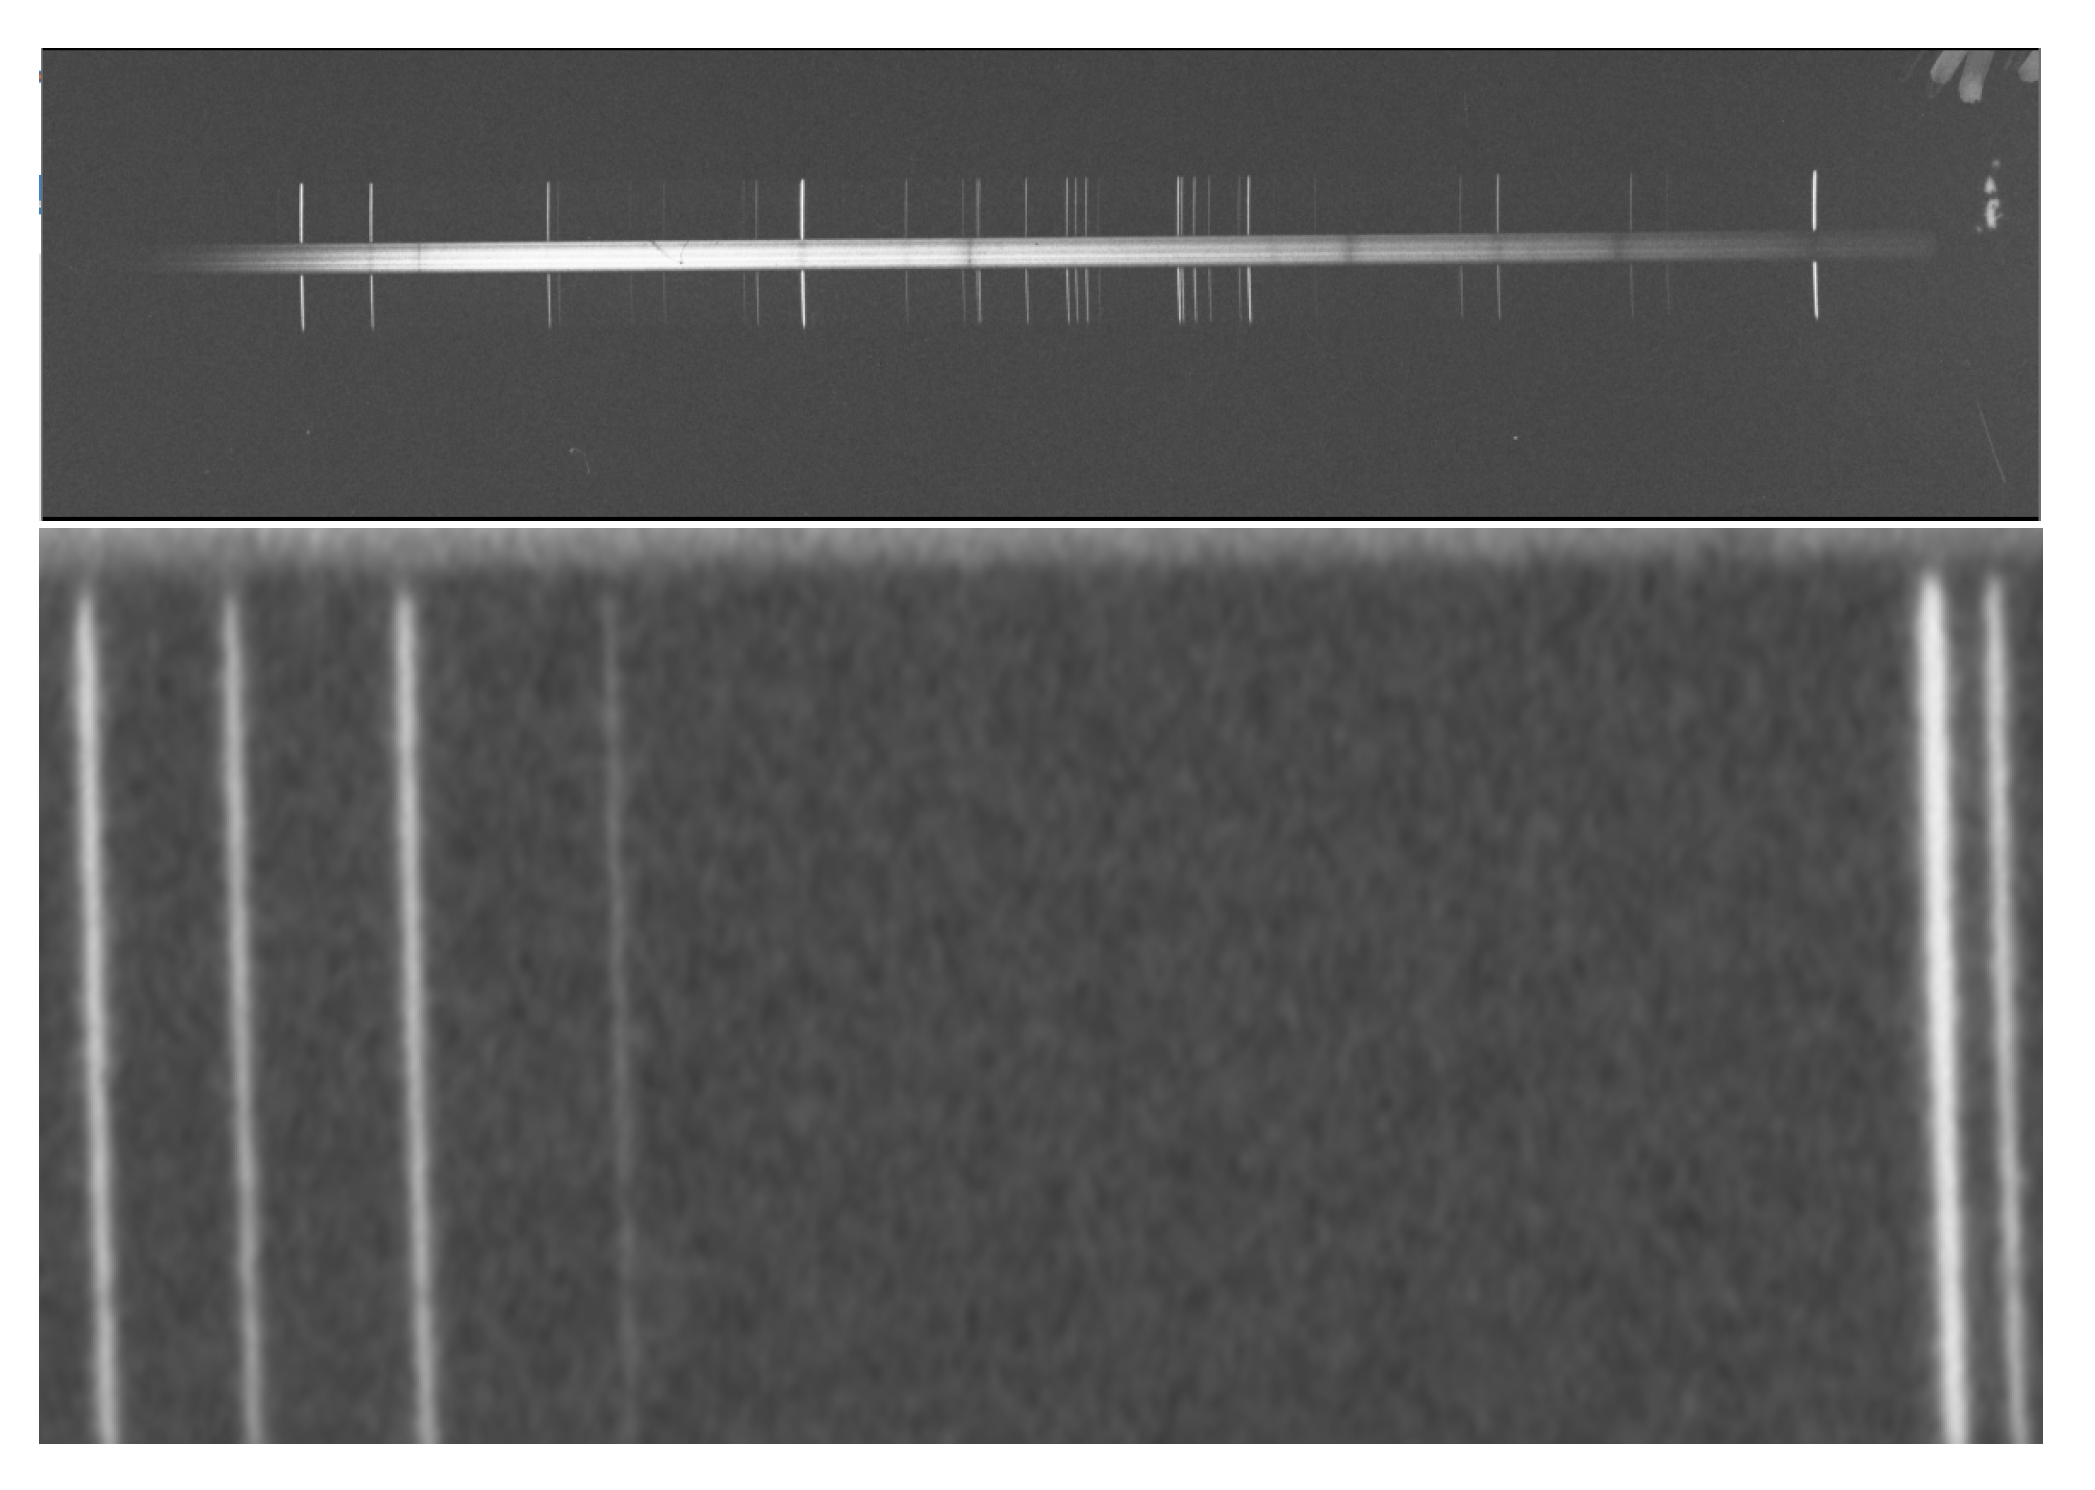
2.2. Digitalization and Data Processing

We developed a procedure of digitalization of the plates which include scanning, processing and data analysis. In this way we were able to extract scientific information at a much deeper level than it could be done with previously employed techniques. For the scanning of the plates we used a digital scanner EPSON Perfection V600 which allows to scan negative plates with resolution up to 12,800 dpi and 16 bits. The plates have sizes 100 × 27 mm, while the stellar spectra cover an area of approximately 50 × 0.8 mm. This allows to scan up to 6 plates at a time. The scanning time per plate is about 180 s at 3200 dpi. In the upper image of the Figure 1 we present a typical example of a digitalized plate. A zoomed region is shown in the lower image, where the photographic grains are just resolved at 3200 dpi, which is equivalent to 7.9 μ m per pixel.
Data processing is necessary to transform the digitalized images delivered by the scanner in images that can be used to measure quantities of scientific interest. In particular the processing of the digitalized plates include:
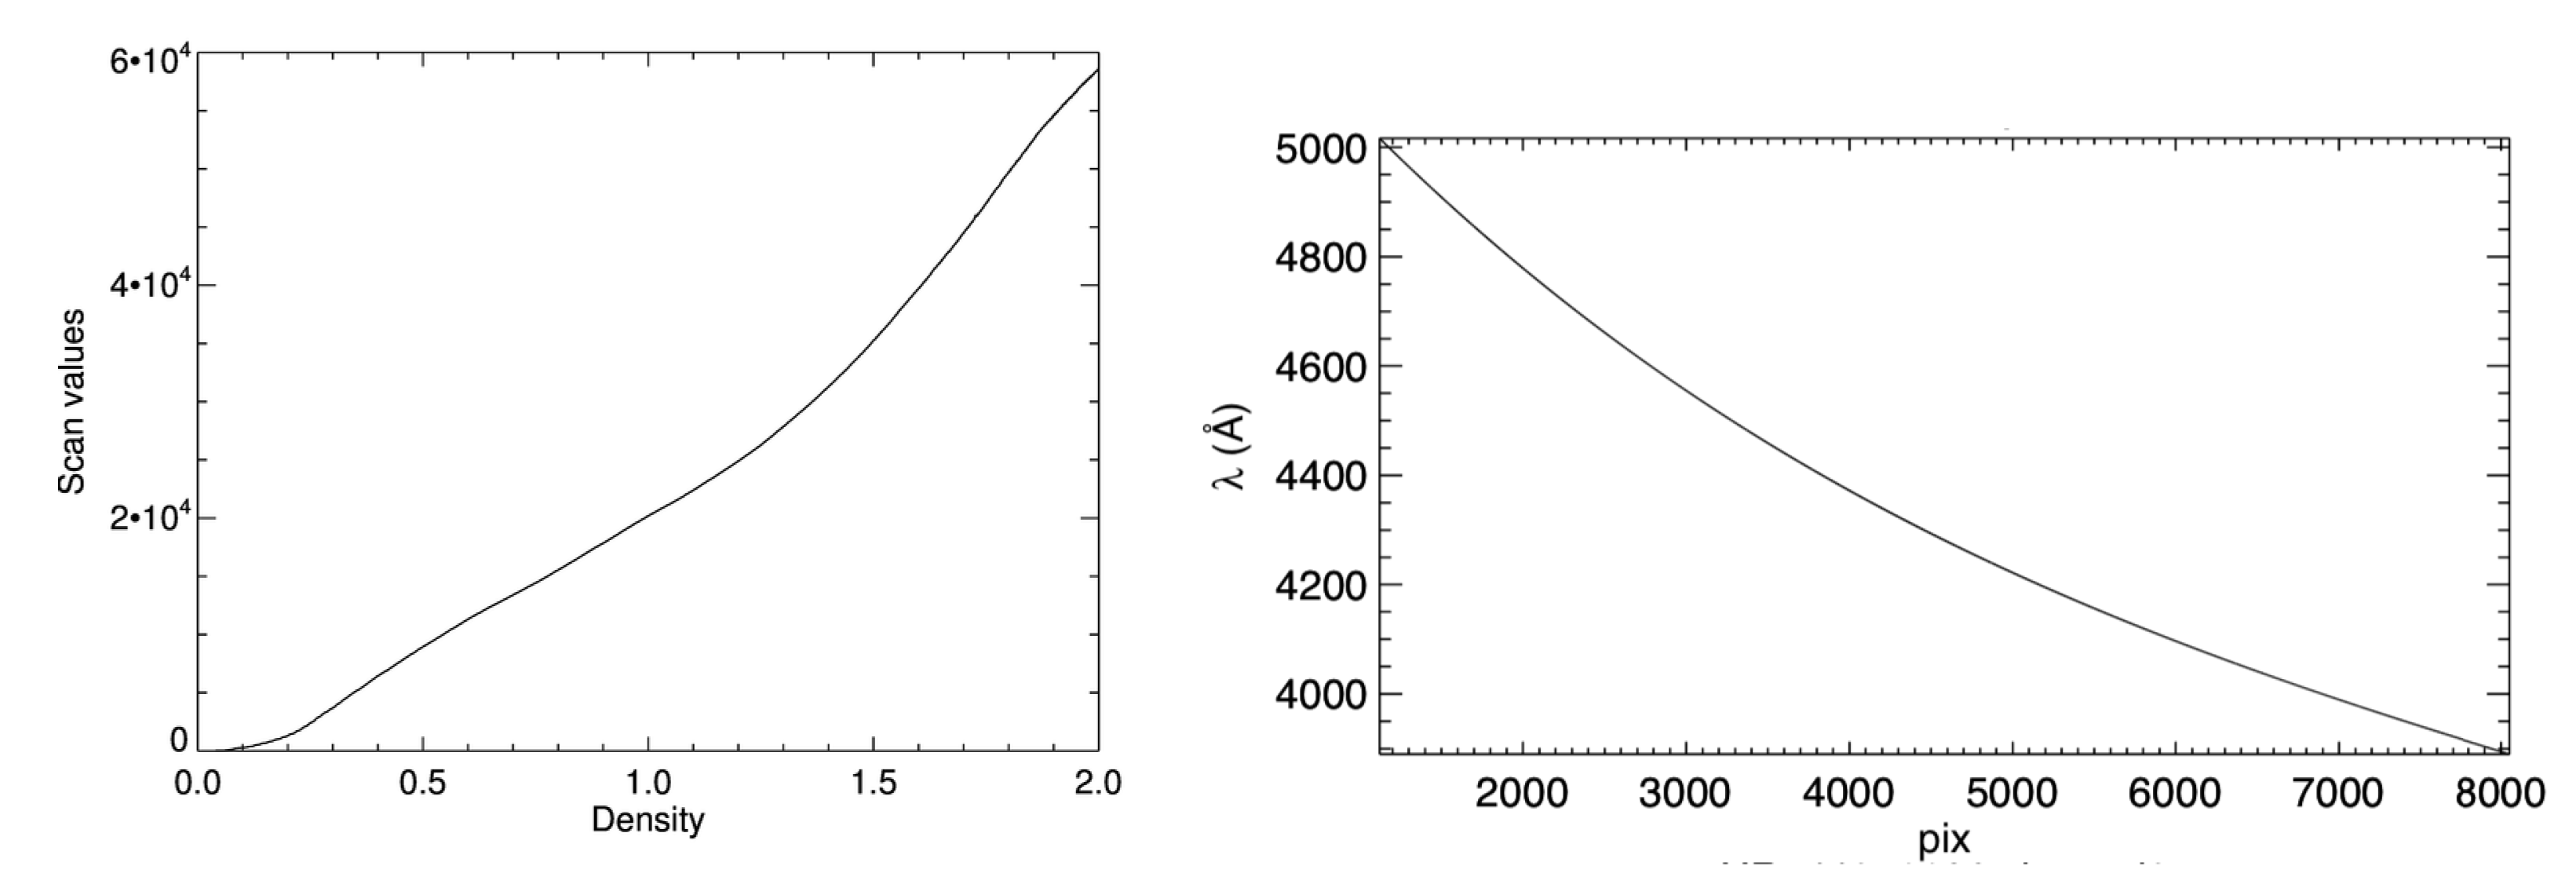
  • conversion from scanner units to photographic density,
  • conversion from photographic density to intensity,
  • extraction of the target and calibration spectra and
  • wavelength calibration.
The scanner was set to work linearly and provide an output image which, in principle must be proportional to the amount of light transmitted by the plate, i.e., to the transmission T. All color or grey-level correction algorithms included in the software were set to OFF.
The photographic density is given by D = log (T). To calibrate the relation between the 16-bit output of the scanner and the photographic density we used two neutral density filters spanning from density 0.04 to 2. One of them is a continuous filter with the density varying linearly with the position, in the other the density varies by known steps. We measured the transmission of the neutral density filters in the Lab and verified that their behavior was according to specs. The result obtained scanning the continuous filter is shown in Figure 2. The density to intensity conversion was made following the recipe of [2], in particular we fit the function (8) of [24] to the 130 points of Vogt & Barrera and inverted the function to calculate the relative illuminating 131 intensity.
A constant value of background was measured in the non exposed part of each plate and subtracted from each 2D spectrum once converted to intensity. The spectrum of the source was extracted with an aperture which traces the peak of emission in the direction of the spectral dispersion and averaged to produce a 1D spectrum. A linear trace proved to be good enough for this purpose, the optimization of the position and tilt of the extraction aperture is weighted for the brightness of the source. In this way possible misalignment of the plate or the scanning are compensated. Two calibration spectra are extracted following the same trace from the two sides of the spectrum of the scientific source. The extraction process was executed with an optimized procedure in IDL.
The wavelength calibration was performed with the task “identify” in IRAF using the comparison Argon spectra recorded in the plates on both sides of the scientific spectrum. Figure 2 shows a plot of lambda versus pixel position for the two-prism configuration of the spectrograph. Based on these results we found the average of the spectral dispersion to be 20 Å/mm and for the spectral resolution an average value λ / δ λ = 700, for the two-prism configuration. A typical 1D spectrum wavelength calibrated and normalized is shown in Figure 3.

3. The Sample

To conduct a pilot study of the variability of CBes and highlight the importance of the archives containing spectra observed several years ago, we started with four CBes which count on a large number of observations available: η Cen, α Eri, ω Car, and α Col. These stars were observed from 1980 to 1991 with Foster. In addition recent information about the disk phases is available in the literature making them perfect targets for this work. We complemented the data with spectra from BeSOS database 1 obtained with the “PUC High Echelle Resolution Optical Spectrograph”, Pucheros, [25] installed at the ESO 50 cm telescope of the Observatory Universidad Católica, Santa Martina, Santiago, Chile. These spectra cover the visible spectral range with a spectral resolution of ∼17,000. Observations were taken between 2012 and 2015, covering an effective wavelength range 4250–7000 Å. For details on the observations plan and reduction steps, the reader is referred to [26].

4. Method

Since the gas disk of Be stars is optically thin to the continuous radiation in the optical range, observing emission signatures in Balmer lines is usual, especially H α and H β . We selected the most relevant spectral lines in common between the first (Foster) and second period (BeSOS) from Table 1 to perform the measurements (e.g., EW, DPS, and V/R). Spectral lines in Be stars are usually asymmetric due to non-radial pulsations. Here, the Foster spectra do not have enough spectral resolution to study asymmetries and in several cases the spectral lines are distinguishable from the spectra but very noisy. To avoid adding extra flux in the EWs calculation, we fit a Voigt function to the observed absorption line profiles (HeI and MgII lines) and then we integrated this function over the wavelength range. Because Balmer lines are stronger and emission features are presented in the spectral lines, we performed a piecewise (order-3) polynomial fit to the data points and then integrated this function over the spectral range to obtain the line EW (see [27]). The errors were calculated by following the procedure described in [27] for weak and strong lines. An example of the method is shown in Figure 4 for a Foster spectrum line (solid black line). The EW area is indicated as the shaded region in pink. In the left and right panel, the fitted function is represented by a dashed red line and the continuum was set to 1 in all cases (dashed black line). As this emission feature grows inside the absorption line, the EW value will be smaller. Then, small values of Balmer lines, in this work, will mean emission features appearing in the line.
The DPS and V/R measurements were performed over the H β line profile. The only star with no evidence of emission (in the first period) was α Eri and in this case we set the DPS as the width of the wings. We select the violet and red peaks by visual inspection. An example of the method is shown in the left panel of Figure 5 for one epoch of the star ω Car in the Foster archive. To quantify the difference between values obtained with different spectral resolutions, we selected a BeSOS spectrum of the same star and convoluted it with several Gaussian profiles of different widths (i.e., spectral resolutions) and then we re-binned the degraded spectra. We did it up to fit an observed Foster spectrum (see right panel of Figure 5). We obtained an effective spectral resolution of R∼1500 measured on HeI 4471 Å and MgII 4481 Å line profiles (dashed red line). After this step, we measured the EW in the HR and LR spectrum. We obtained a difference of 38% between both lines. We used this effective spectral resolution to degrade a H β line profile to quantify the V/R and DPS measured difference. We obtained a large difference of 61.7% for the DPS value and 1.6% for the V/R value. Also, we note that for a spectral resolution R∼1500 the minimum DPS resolved in terms of velocity is ∼200 km/s.
In the following, We present a detailed description of the EWs variation for H γ and H β Balmer lines; HeI λ λ 4387, 4921, and 4471; and MgII line. In addition, we calculate the DPS and V/R variation for the H β emission line for the four CBes studied in this paper (see Table 1). Information obtained from these measurements is used to study the connection between the variability of the photospheric lines with the disk phase. EW values for each star are displayed in the same figure from the latest (bottom) to the earliest spectral type (top). Each subplot is separated into two periods scaled by ten years (the period between 48,100 to 55,000 JD does not contain data) due to the lack of observations in both archives. Grid lines in the vertical axes of the plots indicate ranges of 500 Julian days. Then, the EWs for Balmer and helium/MgII lines are displayed in Appendix B in Figure A1 and Figure A2, respectively. On the other hand, DPS and V/R variations are displayed together with the spectral lines for both periods and for each star.
We discarded low exposure plates by selecting continuum regions around the analyzed lines and obtaining an average value, and its standard deviation, σ s , for each normalized spectrum of each star2. The implemented selection criterion rejects all spectra with σ s 0.03. Because some σ s values were more significant than the standard deviation selection criterion for the Foster spectra, the number of EW values is not the same for each line, and the EW ratio between HeI 4471 Å and MgII 4481 Å is not presented.

5. Results

5.1. η Cen-HR 5440-HD 127972

η Cen is a B2 Ve type star [28,29] showing a shell signature in H α line profile since the ’60s [30]. By modeling the spectral energy distribution, [26] estimated an earlier spectral type, B1 Ve, where the best Kurucz model is represented for the following stellar parameters: T eff = 21,000 ± 210 K, log g = 3.95 ± 0.04, R = 6.10 ± 0.12 R and v sin i = 240 km/s. The truncation radius estimated by modeling the H α emission line is 12.5 R with a low density disk [31]. η Cen is the third occurrence of Be stars showing the particular case of Stêfl frequencies [10,32,33]. These frequencies are usually temporary and about 10–20% slower than those associated to typical non-radial pulsations in Be stars. It is strongly suggested that they correlate with an outburst (mass-loss episodes that increase the emission line). From our observations archive, we have 40 spectra between 1984 and 1990 (first period) and 3 spectra spanning 2014 to 2015 (second period). As we can see in the EW plot for Balmer lines (see Figure A1), between 1984 to 1985, the values are between 3 and 4 Å and from 1987 a recurrent variation is observed, overall for the H β EW, with values ranging between 1 and 4 Å being on average around 2 Å and representing an increment of the emission features in the line. In the second period these values are similar to those of early 1984. Although, as mentioned above, this star presents non-radial pulsations that seem connected with mass-loss episodes, a further study comparing photometric variations simultaneously with ground-based observations could help to determine the connection between these episodes and the changes observed in the disk. Balmer lines for this star have an EW value between ∼1.0 and 5.0 Å. At the top of Figure A2 the EW variation for helium lines and MgII is shown. The three lines of HeI maintain a similar behavior and constant range variation over time. The lines λ 4471 and 4921 Å are the strongest. MgII is weak during the first period, and it was distinguished only in a few plates. During the second period was very weak and not measurements could be performed. H β line profiles (see Figure 6) present emissions in the wings during a significant period and vary in time. This emission is present from 1984 to 1991 and it can still be seen from 2014 to 2016. V/R plot shows periodical variation and a small amplitude of ∼0.06. This variation correlates with the one observed in the DPS plot: V/R reaches the maximum value of ∼1.06 when also does the DPS, with a value of ∼750 km/s. The DPS ranges from 450 to 750 km/s. There are only three observations available in the second period and both quantities, V/R and DPS, also change in a correlated way. Since DPS is related to the rotational movement of the emitting region, e.g, Huang’s relation [34], these changes are also related with the EW of the H β emission line. There is no evidence in the spectra, or information in the literature for a companion. In general terms, the disk of η Cen maintains almost constant in size and mass over the analyzed range of time presenting small changes most likely associated with recurrent episodes of mass-loss rates.

5.2. α Eri-HR 0472-HD 10144

α Eridani or HD 10144 is the brightest Be star with a visual magnitude of 0.4 mag and is located at a distance of 44 pc (Hipparcos). It is classified as a B6 Vpe spectral type, with a T eff = 15,000 ± 600 K, log g = 3.60 ± 0.10 and a v sin i = 223 ± 15 km/s [28]. In a previous work, [31] studied the disk parameter for observations in BeSOS between 2013 and Jan 2014 (just a few months before a maximum intensity occurs in H α ). They found a base density disk of the order of ∼ 10 11 g/cm 3 and a truncation radius of 6.0 R . From the literature [35], we know the binary nature of this star. Using IR images, Refs. [35,36] detected a companion at a distance of ∼12.3 AU, with a projected angular separation of ∼6.7 AU and a spectral type A1/3V. They do not have enough data in their work but proposed an orbital period of about 15 years. There is no evidence that the companion influences the disk formation. Ref. [37] used spectroscopic observations of H α from 1991 to 2002, as well as data available in the literature to collect EWs values before 1990, to construct the line’s variation history. The disk cycle proposed in their work is around 14–15 years. In addition, they studied the stellar surface activity by doing measurements on the line HeI 6678 Å, suggesting that the variation is due to non-radial pulsations. The observation dates studied in this work cover the years 1984, 1985, 1987, 1988, 1989, 1990, 2013, 2014, and 2015. We have 31 scanned plates from Foster and 12 spectra from BeSOS. The EWs variations for Balmer lines are shown in the second subplot from top to bottom in Figure A1. The EWs of both lines are very similar in their values and behavior in the first period of time, ranging between 2 and 4.5 Å. We know from the emission in the spectral lines that a disk formation phase is present for this star during the second period. However, the EW of H β keep around 4.0 Å, which could mean that the emission is also present during the first period, also in a low-emission phase (e.g., years 1985, 1987 and 1990). This is also observed in intensity changes in the H β line in Figure 7. The strongest Helium lines is 4471 Å with an almost constant EW value of 1 Å in both periods, and always stronger than MgII line. The EW variation for this star in the second period (active phase) is very low compared to the first one (see Figure A2). Figure 7 shows the V/R and DPS variations for this star. As we mentioned before, we cannot distinguish the emission from the H β line profiles in the first period, but thanks to the EW values we can infer a low-emission phase; therefore, for this star we have selected the width of the wings to represent the DPS. From the V/R plot, a small asymmetry remains constant with an amplitude of ∼0.1, but with an opposite behavior compared to the second period. DPS values present an average value of ∼700 km/s during the first period corresponding to a small emitting size (similar to η Cen in its maximum DPS). During the visibly active phase, a smaller value of DPS ∼500 km/s is obtained. We remainder that a direct comparison between both periods, at least for the DPS, can not be done, and a difference of around 62% must be considered.

5.3. ω Car-HR 4037-HD 89080

ω Car is a B8 IIIe spectral type star, the stellar parameters have been derived by several authors, e.g., Ref. [8] estimated a T eff = 13,275 ± 251 K, log g = 3.581 ± 0.043 and a projected rotational velocity v sin i = 245 ± 13 km/s. Using stellar atmospheres model to reproduce the spectral energy distribution [26] found a lower temperature value of T eff = 11,600 ± 116 K, a log g = 3.50 ± 0.04 and a stellar radius R = 7.20 ± 0.14 R . Optical and Near-IR spectroscopic and interferometric observations from 2012 show evidence of a Keplerian disk around ω Car. The emitting region has been estimated to be 3.1 ± 0.9 R at Br γ ([5], they considered a R = 6.2 R ) and 25 R at H α ([31], they considered a R = 7.20 R ).
We used Foster spectra from 1985 to 1990 (52 observation dates) and the BeSOS database from 2013 to 2015 (2 spectra). The EWs of Balmer lines (see Figure A1) present a similar variability than η Cen but with deeper lines, where values go around 3.0 to 4.0 Å. In 1988/89 a higher dispersion is observed in both lines, and the emission increases (see Figure 8). The emission observed in the H β line profiles over time indicates that the disk has been present since the ’85s. Only two points are available in the second period, and maintain similar to the variation range of the first period. We note the strong separation in EW between H γ and H β in the second period. The helium lines for this star are weaker, with values between 0.5 and 0.6 Å, probably because of the low temperature. For the same reason a few EW values are available for this star because they do not fulfilled the criterion of σ . MgII is the strongest line present in this star with EW values between 0.3 and 0.6 Å. This is the only star of our sample showing FeII 5316 Å in its spectrum. The H β line profile shows a prominent DPS (see Figure 8) in both periods, but with the deepest central absorption during the second period. The variation of the V/R ratio is very similar to the one from η Cen, with a small amplitude of ∼0.06. The DPS ranges between ∼260 and 360 km/s.

5.4. α Col-HR 1956-HD 37795

α Col is classified as a B7 IIIe or B9 Ve spectral type [26,28]. First signatures of emission in Balmer lines was reported by [38] on Dec 1973. [8] derived the following stellar parameters: T eff = 13,695 ± 437 K, log g = 3.559 ± 0.069 and v sin i = 192 ± 12 km/s. Similar values were found by [28] with a higher T eff = 14,200 ± 400 K, a log g = 3.50 ± 0.10 and v sin i = 180 ± 15 km/s. Ref. [26] used rotational convoluted stellar atmosphere models and they found a T eff = 12,200 ± 122 K, a log g = 3.50 ± 0.04 and a R = 7.00 ± 0.14 R . On the other hand, Ref. [5] obtained for the first time simultaneous Br γ spectroscopic observations and high angular resolution in the K-band of α Col using the ESO VLTI/AMBER instrument. To constrain the disk parameters, they used the stellar parameters derived by [8] in a simple two-dimensional kinematic model. A disk extension of 1.5 ± 0.3 stellar radii was estimated in the formation region of Br γ line. Their observations were carried out between 2007 and 2011, indicating the existence of a disk at that time. [31] analyzed observations between 2012 and 2015 and found a truncation radius disk measured in H α of 50.0 R and a disk base density constant of 2.5 × 10 10 g / cm 3 ; they considered a B9 V spectral type for the central star. Our observations dates range from 1984 to 2015, corresponding to 50 scanned plates in Foster and 5 spectra in BeSOS. Figure A1 shows the EWs variation for Balmer lines. As α Col, Balmer lines are deeper compared to the other stars and the same EW separation from both lines, H β and H γ , is observed. From the plot an increment of the emission is observed in 1988 and 1990. EWs values for HeI and MgII, are displayed in Figure A2. The HeI 4471 Å is the strongest Helium line for this star, but MgII has similar EW values. A high dispersion is presented during the fist period, with values ranging between 0.2 and 0.8 Å. In the second period, values are almost constant. On the other hand, the V/R ratio (see Figure 9) remains slightly below 1.0 until 1987 and above 1.0 up to 1990. Then in the second period, the V/R is symmetric and constant. The emission observed in the H β line profile increases in the second half of this period. The star presents the highest variation range in DPS with values between ∼70 and 200 km/s and an almost constant value during the second period of 150 km/s. However, due to the low spectral resolution of Foster, we know that values lower than 200 km/s are not confident. Based on the DPS during the second period, we can trust values higher than 150 km/s in the first period of the plot, but having the consideration of 62% of difference that could exist between Foster and BeSOS data. From literature [17], a particular signature of a third peak is presented in H α line-emission, varying in the order of days, shifting towards the central absorption, and sometimes disappearing. There is no evidence nor information in the literature of a companion for this star.

6. Summary and Discussion

We have compiled spectroscopic observations from Foster and BeSOS databases for the southern Be stars: η Cen, α Eri, ω Car, and α Col. The archives cover different optical wavelength ranges, 3900 to 5150 Å for Foster and 4250 to 7000 Å for BeSOS. Furthermore, the spectral resolution differs between databases; Foster has an effective spectral resolution of R∼1500, while BeSOS spectra have a R∼17,000. We look at the spectra of these stars for Balmer, helium, iron, and Mg lines. A compilation of the lines present in each star and instrument is shown in Table 1. For the four stars, a DPS is observed in H β for both periods, and only α Eri appears to be in a low-emission phase during the Foster period. The only star confirmed as binary is α Eri with an orbital period of ∼15 years [37]. We note from Figure A1 that the coolest star, α Col, show a more pronounced difference in the EWs values of H γ and H β line profiles, compared to the rest of the stars. In general B-types stars at different luminosity classes show a difference of around ∼1 Å in Balmer lines EWs values [39]. In this case, the variation is in the order of ∼2 Å. Therefore, this observed difference may be due to the star’s disk or changes in the effective temperature of the star. As a comment and possible relation, [31] found that late spectral types host less massive disks with smaller emission region compared to early spectral types and thus, lower density disks.
We note that no star shows iron lines, except for the FeII 5313 Å observed in ω Car. This is the only star of our sample classified as a giant luminosity class. The hottest star in our work, η Cen, has the strongest helium lines with high values of EWs and very low, or no presence of MgII 4481 Å in both periods, agreeing with early spectra types classification. α Eri (mid spectral type) presents many HeI lines in the spectra with EWs values to η Cen but with the presence of MgII 4481 Å in low intensity during both periods. For the late spectral types, ω Car and α Col, both stars show weak helium lines, but the EW(HeI 4471 Å) ∼ EW(MgII 4481 Å) in α Col, while for ω Car, EW(MgII 4481 Å) > EW(HeI 4471 Å). It is possible that this star corresponds to a later spectral type, but other studies must be done in comparison with line variability to re-classify it. Also, this star present a high Magnesium variability. This kind of variability has been reported before for magnetic chemically peculiar stars, which are mainly characterized by a dipolar magnetic field and their symmetry axis is inclined with respect to the rotational axis [40]. However, in the literature there is no evidence of magnetic fields for this star. Among the lines studied in this work, the four CBes are variable in helium. Also, the usual anti-correlation between MgII 4481 Å and HeI 4471 Å is also observed, i.e., as the EWs of MgII 4481 Å increase, the EWs of HeI 4471 Å decrease. Most likely, these changes are associated with the stellar photosphere rather than the disk.
From the EW variations plots, similar behavior is observed from Balmer and Helium lines. We remind the opposite meaning of EW values between absorption and emission features in the spectral lines. Then, when the EW value of H β increases, we can say that the emission coming from the disk is decreasing. By looking at Figure A1 and comparing the same observations years, when this happens, in general, EW values of Helium lines in Figure A2 increase. This is seen in η Cen, between 1989 and 1990, when the disk decreases Helium lines, λ 4387 increases from an average of 0.6 to 0.9 Å, same for λ 4921, increases for an average of 1 to 1.2 Å. This is also observed in α Eri around 1988 and between 1989 to 1990. The other two targets present a larger error bar (because of the weakness of the lines and the low S/N in the Foster archive) and therefore it is difficult to attempt the same conclusion. A possible explanation could be the changes in the effective temperature of the star, which are also associated to non-radial pulsations. A next step will be to use stellar atmospheres models that consider the oblateness of the star due to fast rotation and try to measure the changes of the temperature. We test FT analysis of the V/R, DPS and EW data of the four targets, with the program PERIOD04 [41]. However, the data presented here include several gaps, leading spectral windows of the FT with very low signal to noise of the order of ∼3. Therefore, in order to estimate reliable periods is necessary to complement this set of data with information available in the literature or even in other spectroscopic plates.
Stellar parameters from the literature, together with DPS and V/R measurement on H β line profiles are summarized in Table 2. η Cen and α Eri have the largest DPS and, therefore, should have the smallest emitting region sizes. On the other hand, ω Car and α Col have the smallest DPS and the largest sizes. We note that the size of the emitting region increases toward late spectral types in our sample (based on DPS values).

7. Conclusions

From 1928 to 1991, about 4800 spectroscopic plates were collected at the Observatory Universidad Católica Manuel Foster in Santiago, Chile. The plates contain spectra of various stellar sources in the southern hemisphere. We recovered the plates from the archive and developed a method of digitalization, processing, and analysis to extract valuable scientific information, which is useful to study long-term variability in different systems in the Foster archive. So the Foster archive stands in the tradition of those archive from the past that can contribute information about bright stars for several decades. In the same line, for example, the 2-meter telescope in Ondřejov, Czech Republic has been operating since 1967. The archive contains several thousands of photographic (up to 1992) and electronic (from 1992 to 2000) spectra. The spectra have been used to study Be stars, multiple spectroscopic systems, chemically peculiar stars, stellar pulsations, and symbiotic stars. A list of publications is available on the website https://stelweb.asu.cas.cz/en/telescope/date-archives/ (accessed on 5 October 2022). Recently, a digitalization project of spectroscopic plates taken in La Plata (Argentina) and Cerro Tololo (Chile) observatories between the ’20s and ’80s started at Universidad Nacional de La Plata, Argentina [42]. In total, there are around 15,000 photographic plates covering variable stars. Information on the ongoing project can be found on the website https://retroh.fcaglp.unlp.edu.ar/ (accessed on 5 October 2022).
As a final remark, the International Astronomical Union has a commission Working Group (B2) on the Preservation and Digitization of Photographic Plates. This archive is in the context of the group aims and the analyzed and published spectra will be available in a section in the BeSOS database for the use of the community.
Besides their historical value, these plates and their ongoing efforts to recover the spectra represent a rich database that we believe can still be of scientific interest to modern researchers.

Author Contributions

Conceptualization, C.A., L.V. and N.V.; Observations and data provider of Foster plates: S.G., V.O., N.V., E.A. and L.V.; Data extraction of Foster plates, S.G.; Data analysis, C.A. and S.G.; writing—original draft preparation, C.A., L.V. and N.V.; writing—review and editing, C.A., L.V. and N.V.; funding acquisition, C.A. and L.V. All authors have read and agreed to the published version of the manuscript.

Funding

C.A thanks to Fondecyt iniciación n. 11190945. This work has been possible thanks to the support of the fund comite mixto ESO Chile. We acknowledge financial support from the Centro de Astrofísica de Valparaíso (CAV). We also acknowledge support from CONICYT project Fondecyt n. 1130849. LV acknowledges support from ANID Fondecyt n. 1211162, Quimal ASTRO20-0025 and ANID BASAL CATA, FB210003.

Institutional Review Board Statement

Not applicable.

Informed Consent Statement

Not applicable.

Data Availability Statement

The data underlying this article will be shared on reasonable request to the corresponding author.

Acknowledgments

We are grateful for suggestions and comments from reviewers to improve this manuscript. We thank the collaboration of Abel Barrera and Gaston LeCerf. This work has made use of the BeSS database, operated at LESIA, Observatoire de Meudon, France: http://basebe.obspm.fr (accessed on 5 October 2022) and BeSOS archive, operated by the Instituto de Física y Astronomía, Universidad de Valparaíso, Chile: http://besos.ifa.uv.cl (accessed on 5 October 2022) and funded by Fondecyt iniciación N 11130702.

Conflicts of Interest

The authors declare no conflict of interest.

Abbreviations

The following abbreviations are used in this manuscript:
PucherosPontificia Universidad Católica High Echelle Resolution Optical Spectrograph
PUCPontificia Universidad Católica
BeSOSBe Star Observation Survey
EWEquivalent Width
DPSDouble Peak Separation
HRHigh Resolution
LRLow Resolution

Appendix A. List of Be Stars Observed in the Foster Archive

Table A1. Be stars in the Foster archive.
IDHRHDHIPSpectral Type1981198319841985198619871988198919901991
alf Eri47210,1447588B6Vpe xxxxxxx
228 Eri142328,49720,922B2(V)ne xxxx
56 Eri150830,07622,024B2(V)nne xx x
3 Ori155230,83622,549B2III x
69 Eri167933,32823,972B2III(e)p xxxxxx
HD 35165177235,16525,007B2Vnpe xxx
25 Ori178935,43925,302B1Vn xxxx
123 Tau191037,20226,451B1IVe s h e l l x
47 Ori193437,49026,594B3Ve xxxxxx
alf col195637,79526,634B9Ve xxxxxxx
HD 41335214241,33528,744B3/5Vnne xxxx
HD 42054217042,05428,992B5Ve xx
HD 43285223143,28529,728B6Ve xx
HD 43544224943,54429,771B2/B3Ve x
HD 44458228444,45830,214B1.5IVe x
HD 44506228844,50630,143B3V xx
bet01 Mon235645,725-B4Veshell xxxxxx
HD 45871236445,87130,840B3Ve x
15 Mon245647,83931,978O7V+B1.5/2V xx
10 Cma249248,91732,292B2V xx xx
13 Cma253850,01332,759B1.5Ve xxxxxxx
HD 50123254550,12332,810B6IVe+A x
19 Mon264852,91833,971B2Vn(e) xxx
HD 54309269054,30934,360B3Vne x
27 Cma274556,01434,981B3IIIe xxxxxx
28 Cma274956,13935,037B2.5Ve xxxxxxx
ups01 Pup278757,15035,363B2V+B3IVne xxxxxx
ups02 Pup279057,21935,406B3Vne xxxxx
HD 58155281958,15535,795B3V xx
HD 58343282558,34335,951B2Vne xxx
bet Cmi284558,71536,188B8Ve xxxxxx
HD 58978285558,97836,168B0.5IVe xxx
z Pup291160,60636,778B2Vne x x
HD 60855292160,85536,981B2Ve xxx
omi Pup303463,46238,070B1IVe xxxxxx x
HD 66194314766,19438,994B3Vn x
r Pup323768,98040,274B2ne xxxxxx
HD 71510333071,51041,296B3IV xxx
HD 72067335672,06741,621B2/3V x
f Car349875,31143,105B3V(n) xxxxxxx
HD 77320359377,32044,213B2Vnn(e) x x
E Car364278,76444,626B2(IV)n xxxxxx
HD 81753374581,75346,329B5V(e) x
I Hya385883,95347,522B5V xxxxxx
HD 86612394686,61248,943B5Ve x
HD 88661400988,66149,934B5Vne xxxx
HD 88825401888,82550,044B5(III)e x
ome Car403789,08050,099B8IIIe xxxxxxx
J Vel407489,89050,676B5II xxxxxx
HD 91120412391,12051,491B8/9IV/V xxxx
p Car414091,46551,576B4Vne xxxxxxxx
HD 93237420693,23752,340B5III x
HD 93563422193,56352,742B8/9III xx
A Cen4460100,67356,480B9V xxxxx
j Cen4540102,87057,757B3Vx
HD 1053824618105,38259,173B3/5III xxxx
del Cen4621105,43559,196B2Vne xxxxxxx
HD 1055214625105,52159,232B3IVe xxxx
zet Crv4696107,34860,189B8V x
39 cru4823110,33561,966B5III xxxxx
HD 1104324830110,43262,027B0.5IVpe x
lam Cru4897112,07863,007B3Vne xxxxxxx
mu.02 Cru4899112,09163,005B5Vne xx xxx
mu. Cen5193120,32467,472B2Vnpe xxxxxxx
HD 1209915223120,99167,861B2Ve xx
HD 1243675316124,36769,618B4Vne xxxxxxx
eta Cen5440127,97271,352B2Ve xxxxxxx
HD 1299545500129,95472,438B2V xx
tet Cir5551131,49273,129B2IV/V xxxx
kap Lup5646134,48174,376B9.5Vne x xxxxx
mu. Lup5683135,73474,911B8Ve x xxxxx
kap01 Aps5730137,38776,013B2Vnpe x xx
d Lup5781138,76976,371B3V x xx
HD 1421845907142,18477,859B2V x
48 Lib5941142,98378,207B5IIIp s h x xxxx
7 Oph6118148,18480,569B2Vne xxxxxx
eta01 TrA6172149,67181,710B7V x
13 Oph6175149,75781,377O9.2IVnn xxxxxxx
HD 1558066397155,80684,401O7.5V((f))z(e) xx
iot Ara6451157,04285,079B2(V)nne xxxx x
alf Ara6510158,42785,792B2Vne xxxxxxx
51 Oph6519158,64385,755A0V x x
66 Oph6712164,28488,149B2Ve xxxxxx
HD 1671286819167,12889,605B3II/III x xx
lam Pav7074173,94892,609B2Ve xxxxxxx
HD 1781757249178,17593,996B2Ve x xx
46 Sgr7342181,61595,176B2Vp s h xxxx
39 Cap8260205,637106,723B3V xxxxxx
12 PsA8386209,014108,661B8/9V+B8/9 x x
31 Aqr8402209,409108,874B7IVe xxxxx
HD 2095228408209,522108,975B4IVe x x
31 Peg8520212,076110,386B2IV-Ve xxx
52 Aqr8539212,571110,672B1III-Ive xxxxx
18 PsA8628214,748111,954B8Ve xxxxxx
4 Psc8773217,891113,889B6Ve xxxxxx
eps Tuc9076224,686118,322B8V xxxx

Appendix B. EWs Variation for the Four CBes Studied in This Work

Figure A1. EWs variation for H γ and H β for each star. Plots are sorted from the latest stellar type (Bottom), to the earliest type (Top). In each plot the name and spectral type of the star is indicated in the vertical axes. Vertical grid lines are disposed every 500 Julian days.
Galaxies 10 00106 g0a1
Figure A2. EWs variation for HeI lines λ λ 4387, 4471, 4921 and MgII 4481 lines for each star.
Galaxies 10 00106 g0a2

Notes

1
http://besos.ifa.uv.cl/, (accessed on 5 October 2022)
2
Spectra are normalized by intensity leading the continuum to 1.

References

  1. Campbell, W.W. The Mills spectrograph of the Lick Observatory. Astrophys. J. 1898, 8, 123–156. [Google Scholar] [CrossRef]
  2. Vogt, N.; Barrera, L.H. A simple method to calibrate intensities of photographic slit spectrograms. Astron. Astrophys. 1985, 148, 237–239. [Google Scholar]
  3. Quirrenbach, A.; Bjorkman, K.S.; Bjorkman, J.E.; Hummel, C.A.; Buscher, D.F.; Armstrong, J.T.; Mozurkewich, D.; Elias, N.M., II; Babler, B.L. Constraints on the Geometry of Circumstellar Envelopes: Optical Interferometric and Spectropolarimetric Observations of Seven Be Stars. Astrophys. J. 1997, 479, 477–496. [Google Scholar] [CrossRef]
  4. Meilland, A.; Stee, P.; Vannier, M.; Millour, F.; Domiciano de Souza, A.; Malbet, F.; Martayan, C.; Paresce, F.; Petrov, R.G.; Richichi, A.; et al. First direct detection of a Keplerian rotating disk around the Be star α Arae using AMBER/VLTI. Astron. Astrophys. 2007, 464, 59–71. [Google Scholar] [CrossRef] [Green Version]
  5. Meilland, A.; Millour, F.; Kanaan, S.; Stee, P.; Petrov, R.; Hofmann, K.H.; Natta, A.; Perraut, K. First spectro-interferometric survey of Be stars. I. Observations and constraints on the disk geometry and kinematics. Astron. Astrophys. 2012, 538, A110. [Google Scholar] [CrossRef]
  6. Rivinius, T.; Baade, D.; Carciofi, A.C. Short-term variability and mass loss in Be stars. II. Physical taxonomy of photometric variability observed by the Kepler spacecraft. Astron. Astrophys. 2016, 593, A106. [Google Scholar] [CrossRef] [Green Version]
  7. Okazaki, A.T. Long-term V/R variations of Be stars due to global one-armed oscillations of equatorial disks. PASJ 1991, 43, 75–94. [Google Scholar]
  8. Frémat, Y.; Zorec, J.; Hubert, A.M.; Floquet, M. Effects of gravitational darkening on the determination of fundamental parameters in fast-rotating B-type stars. Astron. Astrophys. 2005, 440, 305–320. [Google Scholar] [CrossRef]
  9. Granada, A.; Ekström, S.; Georgy, C.; Krtička, J.; Owocki, S.; Meynet, G.; Maeder, A. Populations of rotating stars. II. Rapid rotators and their link to Be-type stars. Astron. Astrophys. 2013, 553, A25. [Google Scholar] [CrossRef]
  10. Rivinius, T.; Baade, D.; Štefl, S. Non-radially pulsating Be stars. Astron. Astrophys. 2003, 411, 229–247. [Google Scholar] [CrossRef] [Green Version]
  11. Labadie-Bartz, J.; Carciofi, A.C.; Henrique de Amorim, T.; Rubio, A.; Luiz Figueiredo, A.; Ticiani dos Santos, P.; Thomson-Paressant, K. Classifying Be Star Variability with TESS. I. The Southern Ecliptic. Astron. J. 2022, 163, 226. [Google Scholar] [CrossRef]
  12. Porter, J.M. On outflowing viscous disc models for Be stars. Astron. Astrophys. 1999, 348, 512–518. [Google Scholar]
  13. Curé, M.; Meneses, R.; Araya, I.; Arcos, C.; Peña, G.; Machuca, N.; Rodriguez, A. Revisiting Viscous Transonic Decretion Disks of Be Stars. arXiv 2022, arXiv:2206.09031. [Google Scholar] [CrossRef]
  14. Klement, R.; Carciofi, A.C.; Rivinius, T.; Ignace, R.; Matthews, L.D.; Torstensson, K.; Gies, D.; Vieira, R.G.; Richardson, N.D.; Domiciano de Souza, A.; et al. Prevalence of SED Turndown among Classical Be Stars: Are All Be Stars Close Binaries? Astrophys. J. 2019, 885, 147. [Google Scholar] [CrossRef]
  15. Wang, L.; Gies, D.R.; Peters, G.J.; Götberg, Y.; Chojnowski, S.D.; Lester, K.V.; Howell, S.B. The Detection and Characterization of Be+sdO Binaries from HST/STIS FUV Spectroscopy. Astron. J. 2021, 161, 248. [Google Scholar] [CrossRef]
  16. Rivinius, T.; Carciofi, A.C.; Martayan, C. Classical Be stars. Rapidly rotating B stars with viscous Keplerian decretion disks. Astron. Astrophys. Rev. 2013, 21, 69. [Google Scholar] [CrossRef] [Green Version]
  17. Neiner, C.; de Batz, B.; Cochard, F.; Floquet, M.; Mekkas, A.; Desnoux, V. The Be Star Spectra (BeSS) Database. Astron. J. 2011, 142, 149. [Google Scholar] [CrossRef]
  18. Barrera, L.H.; Vogt, N. Spectroscopic monitoring of southern Be stars. Rev. Mex. Astron. Astrofis. 1987, 14, 323–329. [Google Scholar]
  19. Vogt, N.; Barrera, L.H.; Navarro, M. Correlation and variability of the He I 4471 and MG II 4481 absorption lines in Be stars—A possible diagnositc tool for nonradial pulsations. Astrophys. Space Sci. 1990, 173, 145–156. [Google Scholar] [CrossRef]
  20. Mennickent, R.E.; Vogt, N.; Barrera, L.H.; Covarrubias, R.; Ramirez, A. On the rotation properties of Be stars and their envelopes. Astron. Astrophys. Suppl. Ser. 1994, 106, 427–439. [Google Scholar]
  21. Mennickent, R.E.; Vogt, N. Spectroscopy of southern Be stars 1984–1987. Astron. Astrophys. Suppl. Ser. 1988, 74, 497–506. [Google Scholar]
  22. Mennickent, R.E.; Vogt, N. V/R variations in H-beta emission profiles of Be stars. Astron. Astrophys. 1991, 241, 159. [Google Scholar]
  23. Mennickent, R.E. H-beta line profile variability of seven southern Be stars. Astron. Astrophys. Suppl. Ser. 1991, 88, 1. [Google Scholar]
  24. Moffat, A.F.J. A Theoretical Investigation of Focal Stellar Images in the Photographic Emulsion and Application to Photographic Photometry. Astron. Astrophys. 1969, 3, 455. [Google Scholar]
  25. Vanzi, L.; Chacon, J.; Helminiak, K.G.; Baffico, M.; Rivinius, T.; Štefl, S.; Baade, D.; Avila, G.; Guirao, C. PUCHEROS: A cost-effective solution for high-resolution spectroscopy with small telescopes. Mon. Not. R. Astron. Soc. 2012, 424, 2770–2777. [Google Scholar] [CrossRef] [Green Version]
  26. Arcos, C.; Kanaan, S.; Chávez, J.; Vanzi, L.; Araya, I.; Curé, M. Stellar parameters and H α line profile variability of Be stars in the BeSOS survey. Mon. Not. R. Astron. Soc. 2018, 474, 5287–5299. [Google Scholar] [CrossRef] [Green Version]
  27. Vollmann, K.; Eversberg, T. Remarks on statistical errors in equivalent widths. Astron. Nachrichten 2006, 327, 862. [Google Scholar] [CrossRef] [Green Version]
  28. Levenhagen, R.S.; Leister, N.V. Spectroscopic analysis of southern B and Be stars. Mon. Not. R. Astron. Soc. 2006, 371, 252–262. [Google Scholar] [CrossRef] [Green Version]
  29. Vieira, R.G.; Carciofi, A.C.; Bjorkman, J.E.; Rivinius, T.; Baade, D.; Rímulo, L.R. The life cycles of Be viscous decretion discs: Time-dependent modelling of infrared continuum observations. Mon. Not. R. Astron. Soc. 2017, 464, 3071–3089. [Google Scholar] [CrossRef]
  30. Burton, W.M.; Evans, R.G. Spectroscopic Observations of the be Stars η CEN, γ CAS, and φ Per. Be and Shell Stars; Slettebak, A., Ed.; International Astronomical Union: Bass River, MA, USA, 1976; Volume 70, p. 199. [Google Scholar]
  31. Arcos, C.; Jones, C.E.; Sigut, T.A.A.; Kanaan, S.; Curé, M. Evidence for Different Disk Mass Distributions between Early- and Late-type Be Stars in the BeSOS Survey. Astrophys. J. 2017, 842, 48. [Google Scholar] [CrossRef] [Green Version]
  32. Stefl, S.; Baade, D.; Rivinius, T.; Stahl, O.; Wolf, B.; Kaufer, A. Circumstellar Quasi-periods Accompanying Stellar Periods of Be Stars. In Proceedings of the A Half Century of Stellar Pulsation Interpretation, Los Alamos, NM, USA, 16–20 June 1997; ASP Conference, Astronomical Society of the Pacific Conference Series. Bradley, P.A., Guzik, J.A., Eds.; 1998; Volume 135, p. 348. [Google Scholar]
  33. Baade, D.; Rivinius, T.; Pigulski, A.; Carciofi, A.C.; Martayan, C.; Moffat, A.F.J.; Wade, G.A.; Weiss, W.W.; Grunhut, J.; Handler, G.; et al. Short-term variability and mass loss in Be stars. I. BRITE satellite photometry of η and μ Centauri. Astron. Astrophys. 2016, 588, A56. [Google Scholar] [CrossRef] [Green Version]
  34. Huang, S.S. Profiles of Emission Lines in be Stars. Astrophys. J. 1972, 171, 549. [Google Scholar] [CrossRef]
  35. Kervella, P.; Domiciano de Souza, A. The environment of the fast rotating star Achernar. High-resolution thermal infrared imaging with VISIR in BURST mode. Astron. Astrophys. 2007, 474, L49–L52. [Google Scholar] [CrossRef] [Green Version]
  36. Kervella, P.; Domiciano de Souza, A.; Bendjoya, P. The close-in companion of the fast rotating Be star Achernar. Astron. Astrophys. 2008, 484, L13–L16. [Google Scholar] [CrossRef]
  37. Vinicius, M.M.F.; Zorec, J.; Leister, N.V.; Levenhagen, R.S. α Eridani: Rotational distortion, stellar and circumstellar activity. Astron. Astrophys. 2006, 446, 643–660. [Google Scholar] [CrossRef]
  38. Mineva, V.A.; Kovachev, B.Z.; Radoslavova, T.B. Spectrophotometric exploration of the Alpha Col star. Bolg. Akad. Nauk. Dokl. 1981, 34, 1625–1628. [Google Scholar]
  39. Didelon, P. Largeurs equivalentes de raies spectrales dans les etoiles B. Astron. Astrophys. Suppl. Ser. 1982, 50, 199–207. [Google Scholar]
  40. Leone, F.; Catalano, F.A.; Malaroda, S. Magnesium abundance in main sequence B-type and magnetic chemically peculiar stars. Astron. Astrophys. 1997, 325, 1125–1131. [Google Scholar]
  41. Breger, M. Amplitude variations of the multimode nonradial pulsator 4 Canum Venaticorum. Astron. Astrophys. 1990, 240, 308. [Google Scholar]
  42. Meilán, N.; Collazo, S.; Alessandroni, M.R.; López Durso, M.; Peralta, R.A.; Aidelman, Y.; Cidale, L.S.; Gamen, R. Proyecto de digitalización de placas espectrográficas del Observatorio de La Plata. Bol. Asoc. Argent. Astron. Plata Argentina 2020, 61B, 251–253. [Google Scholar]
Figure 1. (Upper) Example of a digitalized plate from the Foster archive scanned with 3200 dpi. (Lower) Zoom of the previous plate where emission lines of the calibrated spectrum and the photographic grains are visible.
Galaxies 10 00106 g001
Figure 2. (Left) Signal generated by the scanner for the neutral density filter. The 2D image has been averaged in the spatial direction. The curve shows the conversion from scanner output to photographic density assuming linear behavior for the filter according to the manufacturer specifications and also verified by measurements in the Lab. (Right) Example of typical wavelength versus position solution for the 2 prism configuration.
Galaxies 10 00106 g002
Figure 3. View of a typical 1D spectrum extracted from a scanned plate. The flux normalized spectrum corresponds to the star η Cen (HR 5540).
Galaxies 10 00106 g003
Figure 4. Example of the method used to measure the EW in Helium/MgII lines (Left) and Balmer lines (Right). The shaded region in pink indicates the EW.
Galaxies 10 00106 g004
Figure 5. Example of the method used. (left) visual inspection to select V and R peaks on the H β line profile in the Foster archive. (right) degraded BeSOS spectrum (solid blue line) to lower resolutions of R = 1500 (dashed red line) and R = 700 (dotted pink line). In both panels the Foster spectrum is represented by a solid black line.
Galaxies 10 00106 g005
Figure 6. η Cen: V/R (Top) and DPS (Middle) variation measured on the H β emission line. Results are separated into two plots for the Foster (first column) and BeSOS (second column) periods. Spectral lines (Bottom) are over-plotted only to show variability purposes. Grid lines in the vertical axes are displayed every one year. DPS values measured in the first period can present until ∼62% of difference respect to the second period.
Galaxies 10 00106 g006
Figure 7. Same than Figure 6 but for α Eri. Changes in the spectral lines during the Foster period (first column) indicate a low-emission phase. In the Foster period we measured the DPS as the width of the wings.
Galaxies 10 00106 g007
Figure 8. Same than Figure 6 but for ω Car. The disk has been present since the ’85s.
Galaxies 10 00106 g008
Figure 9. Same than Figure 6 but for α Col. The star present the lowest variation range in DPS. Only values higher than 150 km/s are reliable in the first period of data.
Galaxies 10 00106 g009aGalaxies 10 00106 g009b
Table 1. Lines present in at least one observed epoch in each star.
Lines
(Å)
H ζ
3889
H ϵ
3970
HeI
4009
HeI
4026
H δ
4101
HeI
4143
H γ
4340
HeI
4387
HeI
4471
MgII
4481
HeI
4713
H β
4861
HeI
4921
HeI
5015
HeI
5047
FeII
5316
HeI
5876
H α
6562
HeI
6678
Name/Sp.T
η  Cen
B2Ve
FFFFFFF/BF/BF/BF/BBF/BF/BF/BF/B-BBB
α  Eri
B6Vpe
FFFFFFF/BF/BF/BF/BBF/BF/BBB-BBB
ω  Car
B8IIIe
FF-FF-F/BBBF/B-F/BBB-B-B-
α  Col
B9Ve
FF-FF-F/BF/BF/BF/B-F/BF/BBB--B-
Note: F and B symbols indicate if the line is present in Foster and BeSOS spectra, respectively. For cases without a line (or difficult to distinguish), the symbol–appears. In the case of FeII lines λλ 4549, 4556, 4584, 4629, 4667 and HeI λλ 4437, 4120, there are no signatures of these lines in the spectra.
Table 2. Summary of the measurements on the emission lines for the 4 Be Stars.
Literature
NameSp.TT eff vsiniR H α N N V/R DPS (H β )
(K)(km/s)(R )FosterBeSOS (km/s)
η  CenB1Ve21,000 a240 a12.5 d4030.95–1.05450–750
α  EriB6Ve15,000 b223 bd31120.95–1.20500–700
ω  CarB8IIIe11,600 a245 c25 d5220.94–1.07260–360
α  ColB9Ve12,200 a180 b50 d5050.95–1.1170–200
References: a [26], b [28], c [8] and d [31]. R is the disk size calculated by comparing theoretical Hα line profiles with observations. DPS(Hβ) is the double-peak separation measured on the Hβ emission line. Comments: α Eri is in a binary system and is the only target with a low-emission phase during the first period. For the other targets there is not evidence of binary systems and they are in an active phase during both periods.
Publisher’s Note: MDPI stays neutral with regard to jurisdictional claims in published maps and institutional affiliations.

