
Integrating Optical Genome Mapping and Whole Genome Sequencing in Somatic Structural Variant Detection
 , ,
, ,
Abstract
:1. Introduction
2. Materials and Methods
- Patient population
- Development of PDX models
- DNA isolation
- Optical Mapping
- Whole Genome Sequencing
- RNA-Seq
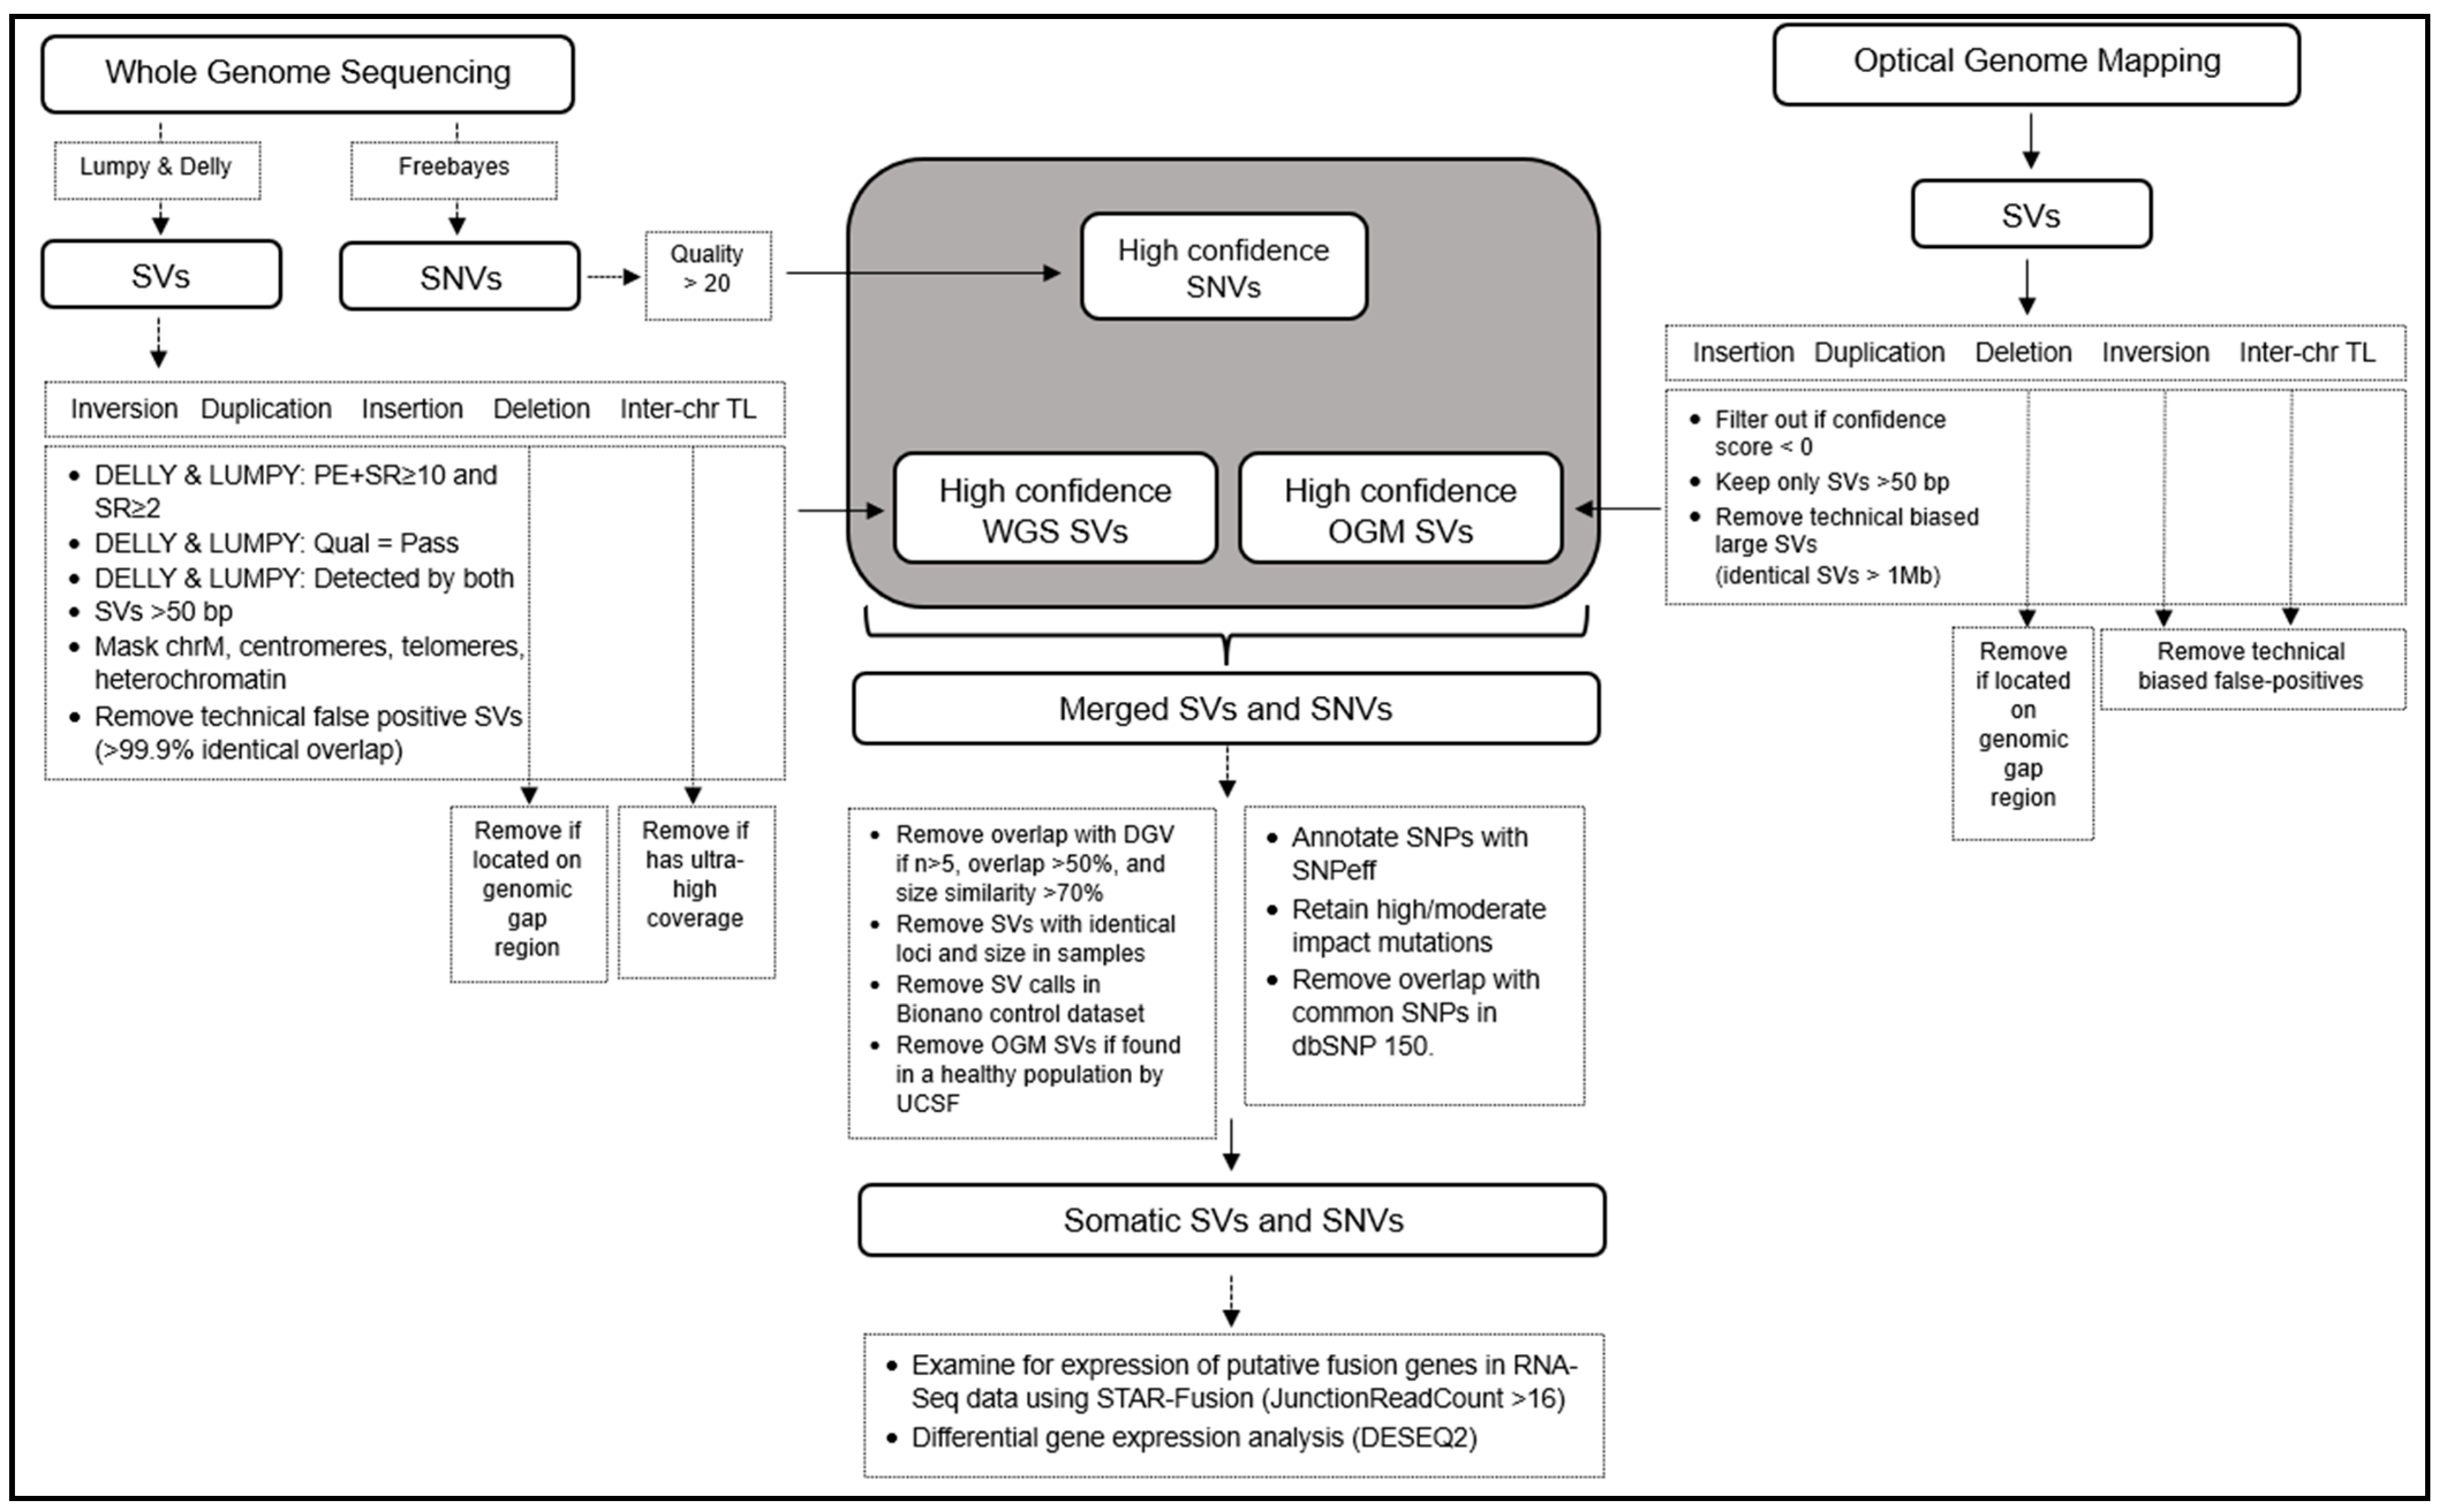
- SV workflow for WGS
- Integrating WGS and OGM variants
- Annotation of SV files
- Statistics
3. Results
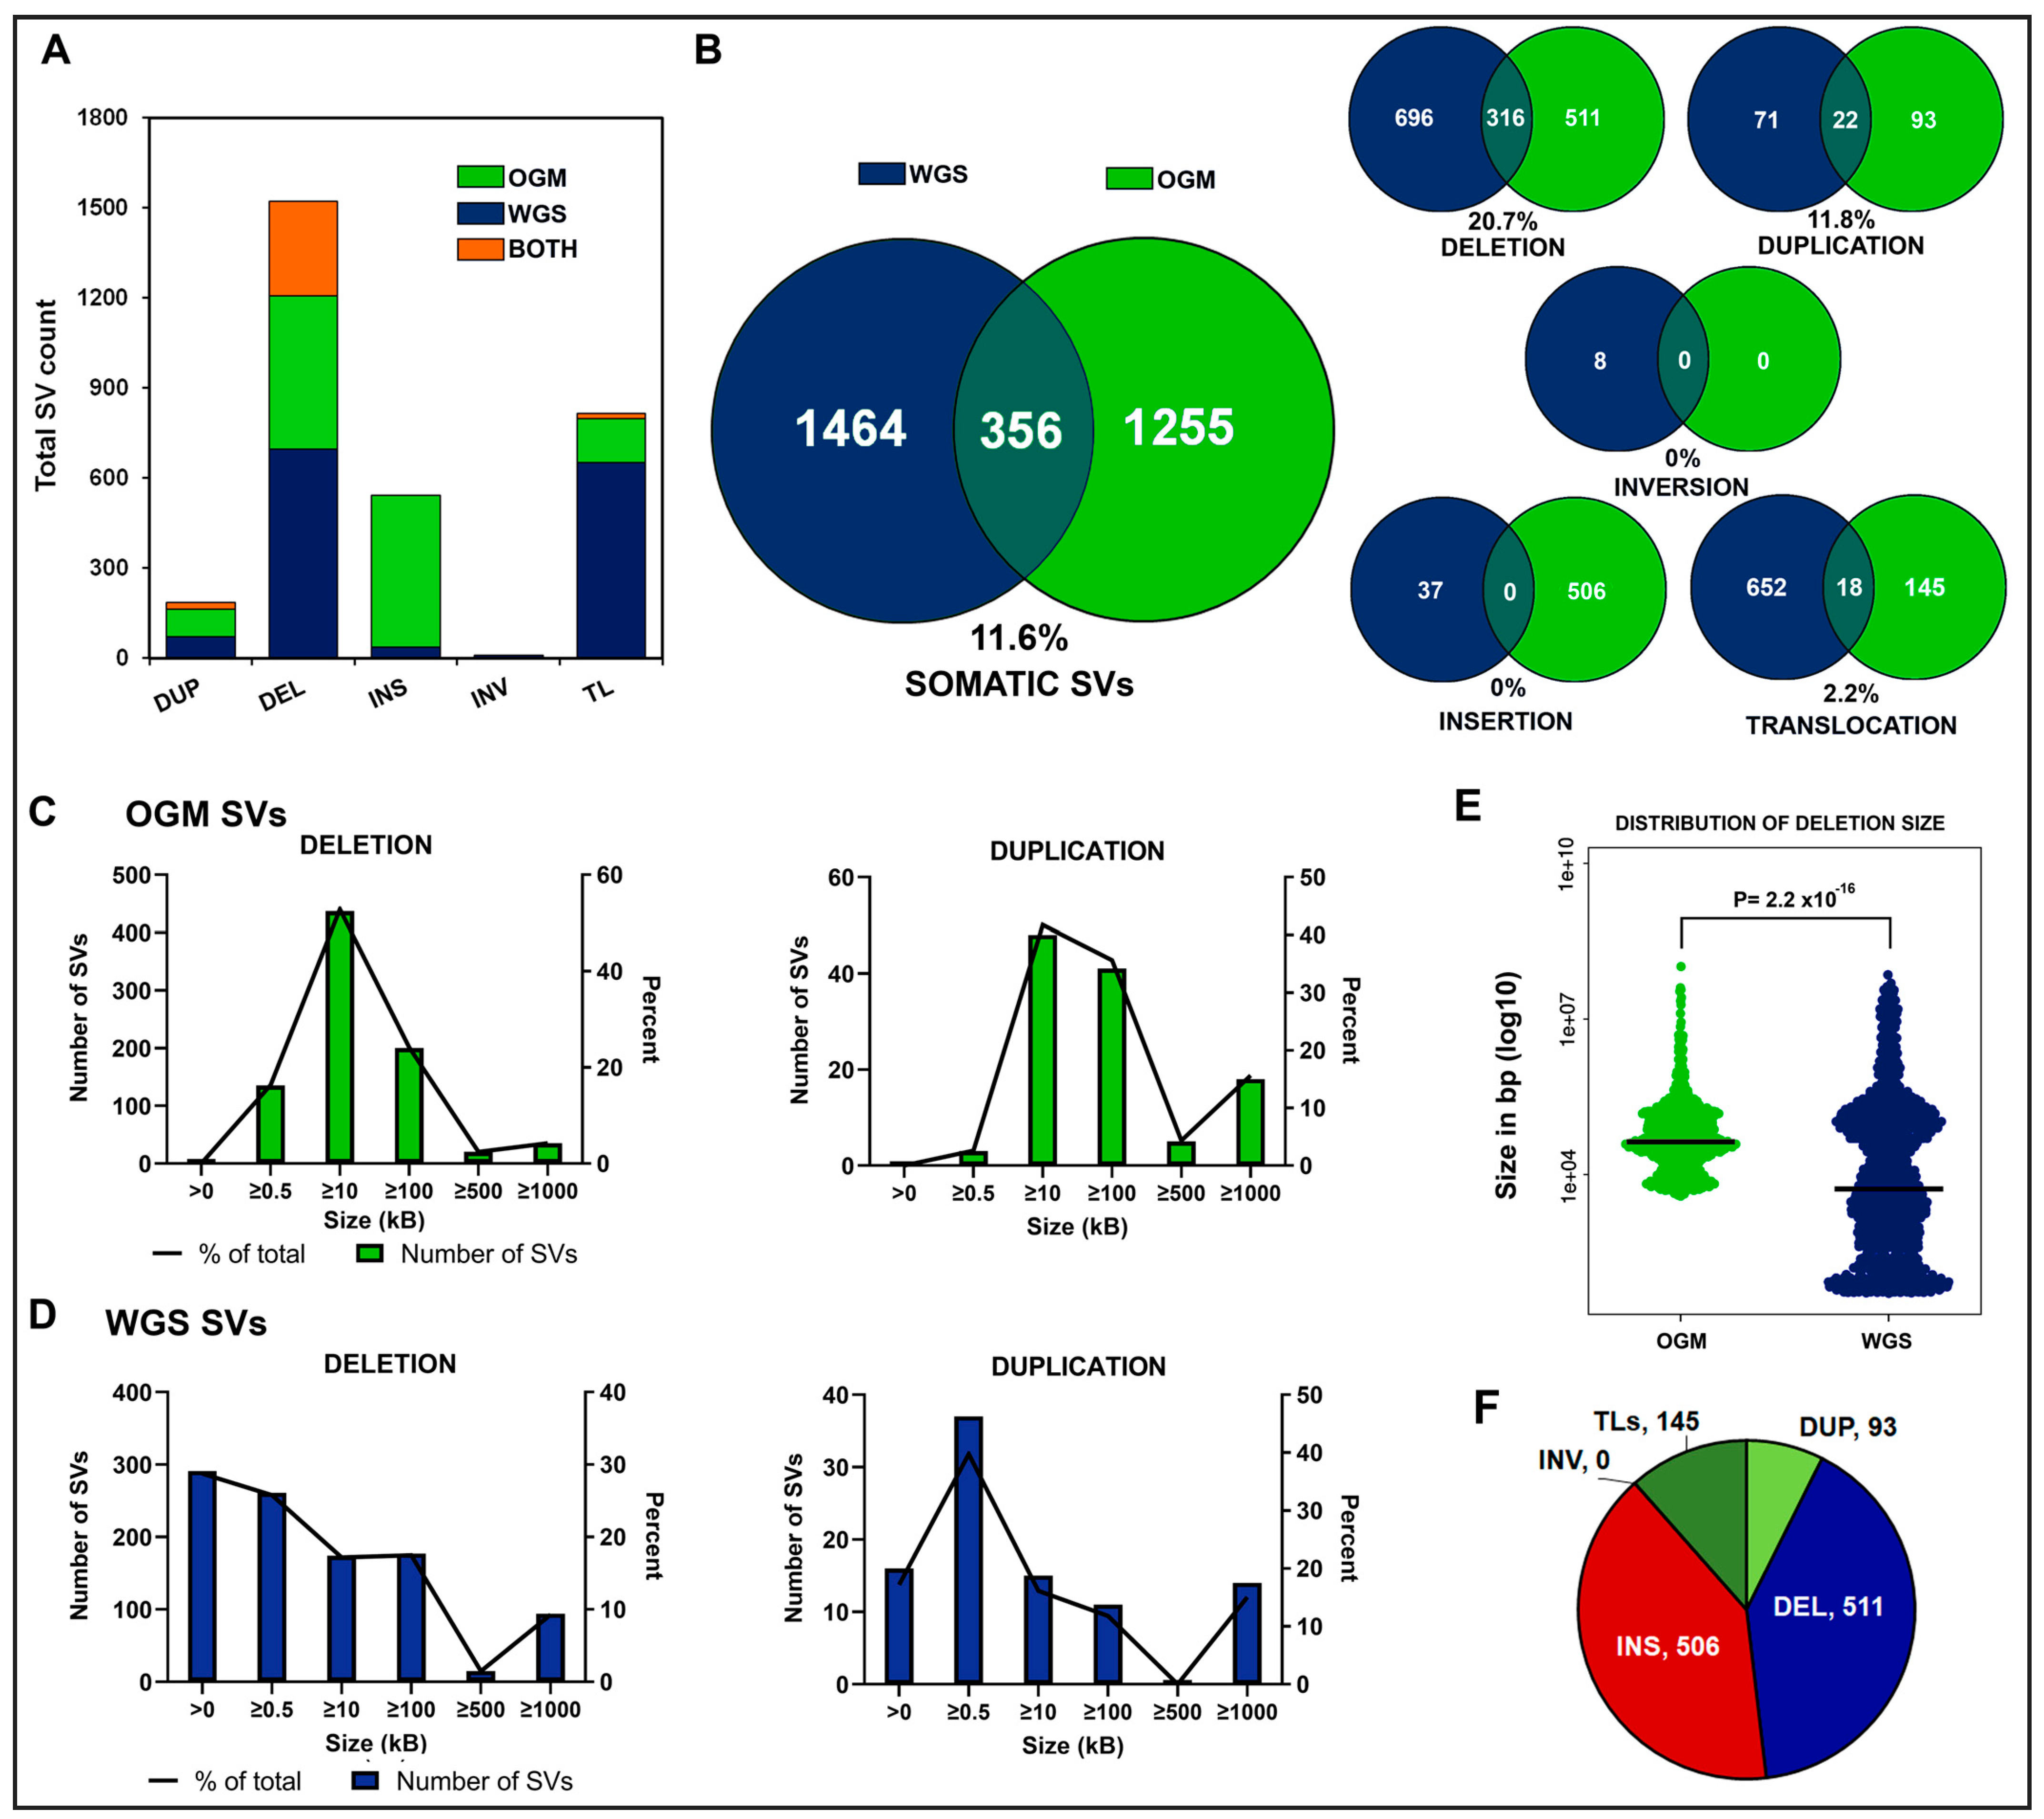
3.1. Identification of Somatic Structural Variants in B-ALL
3.2. Discordance of WGS and OGM in Somatic SV Detection
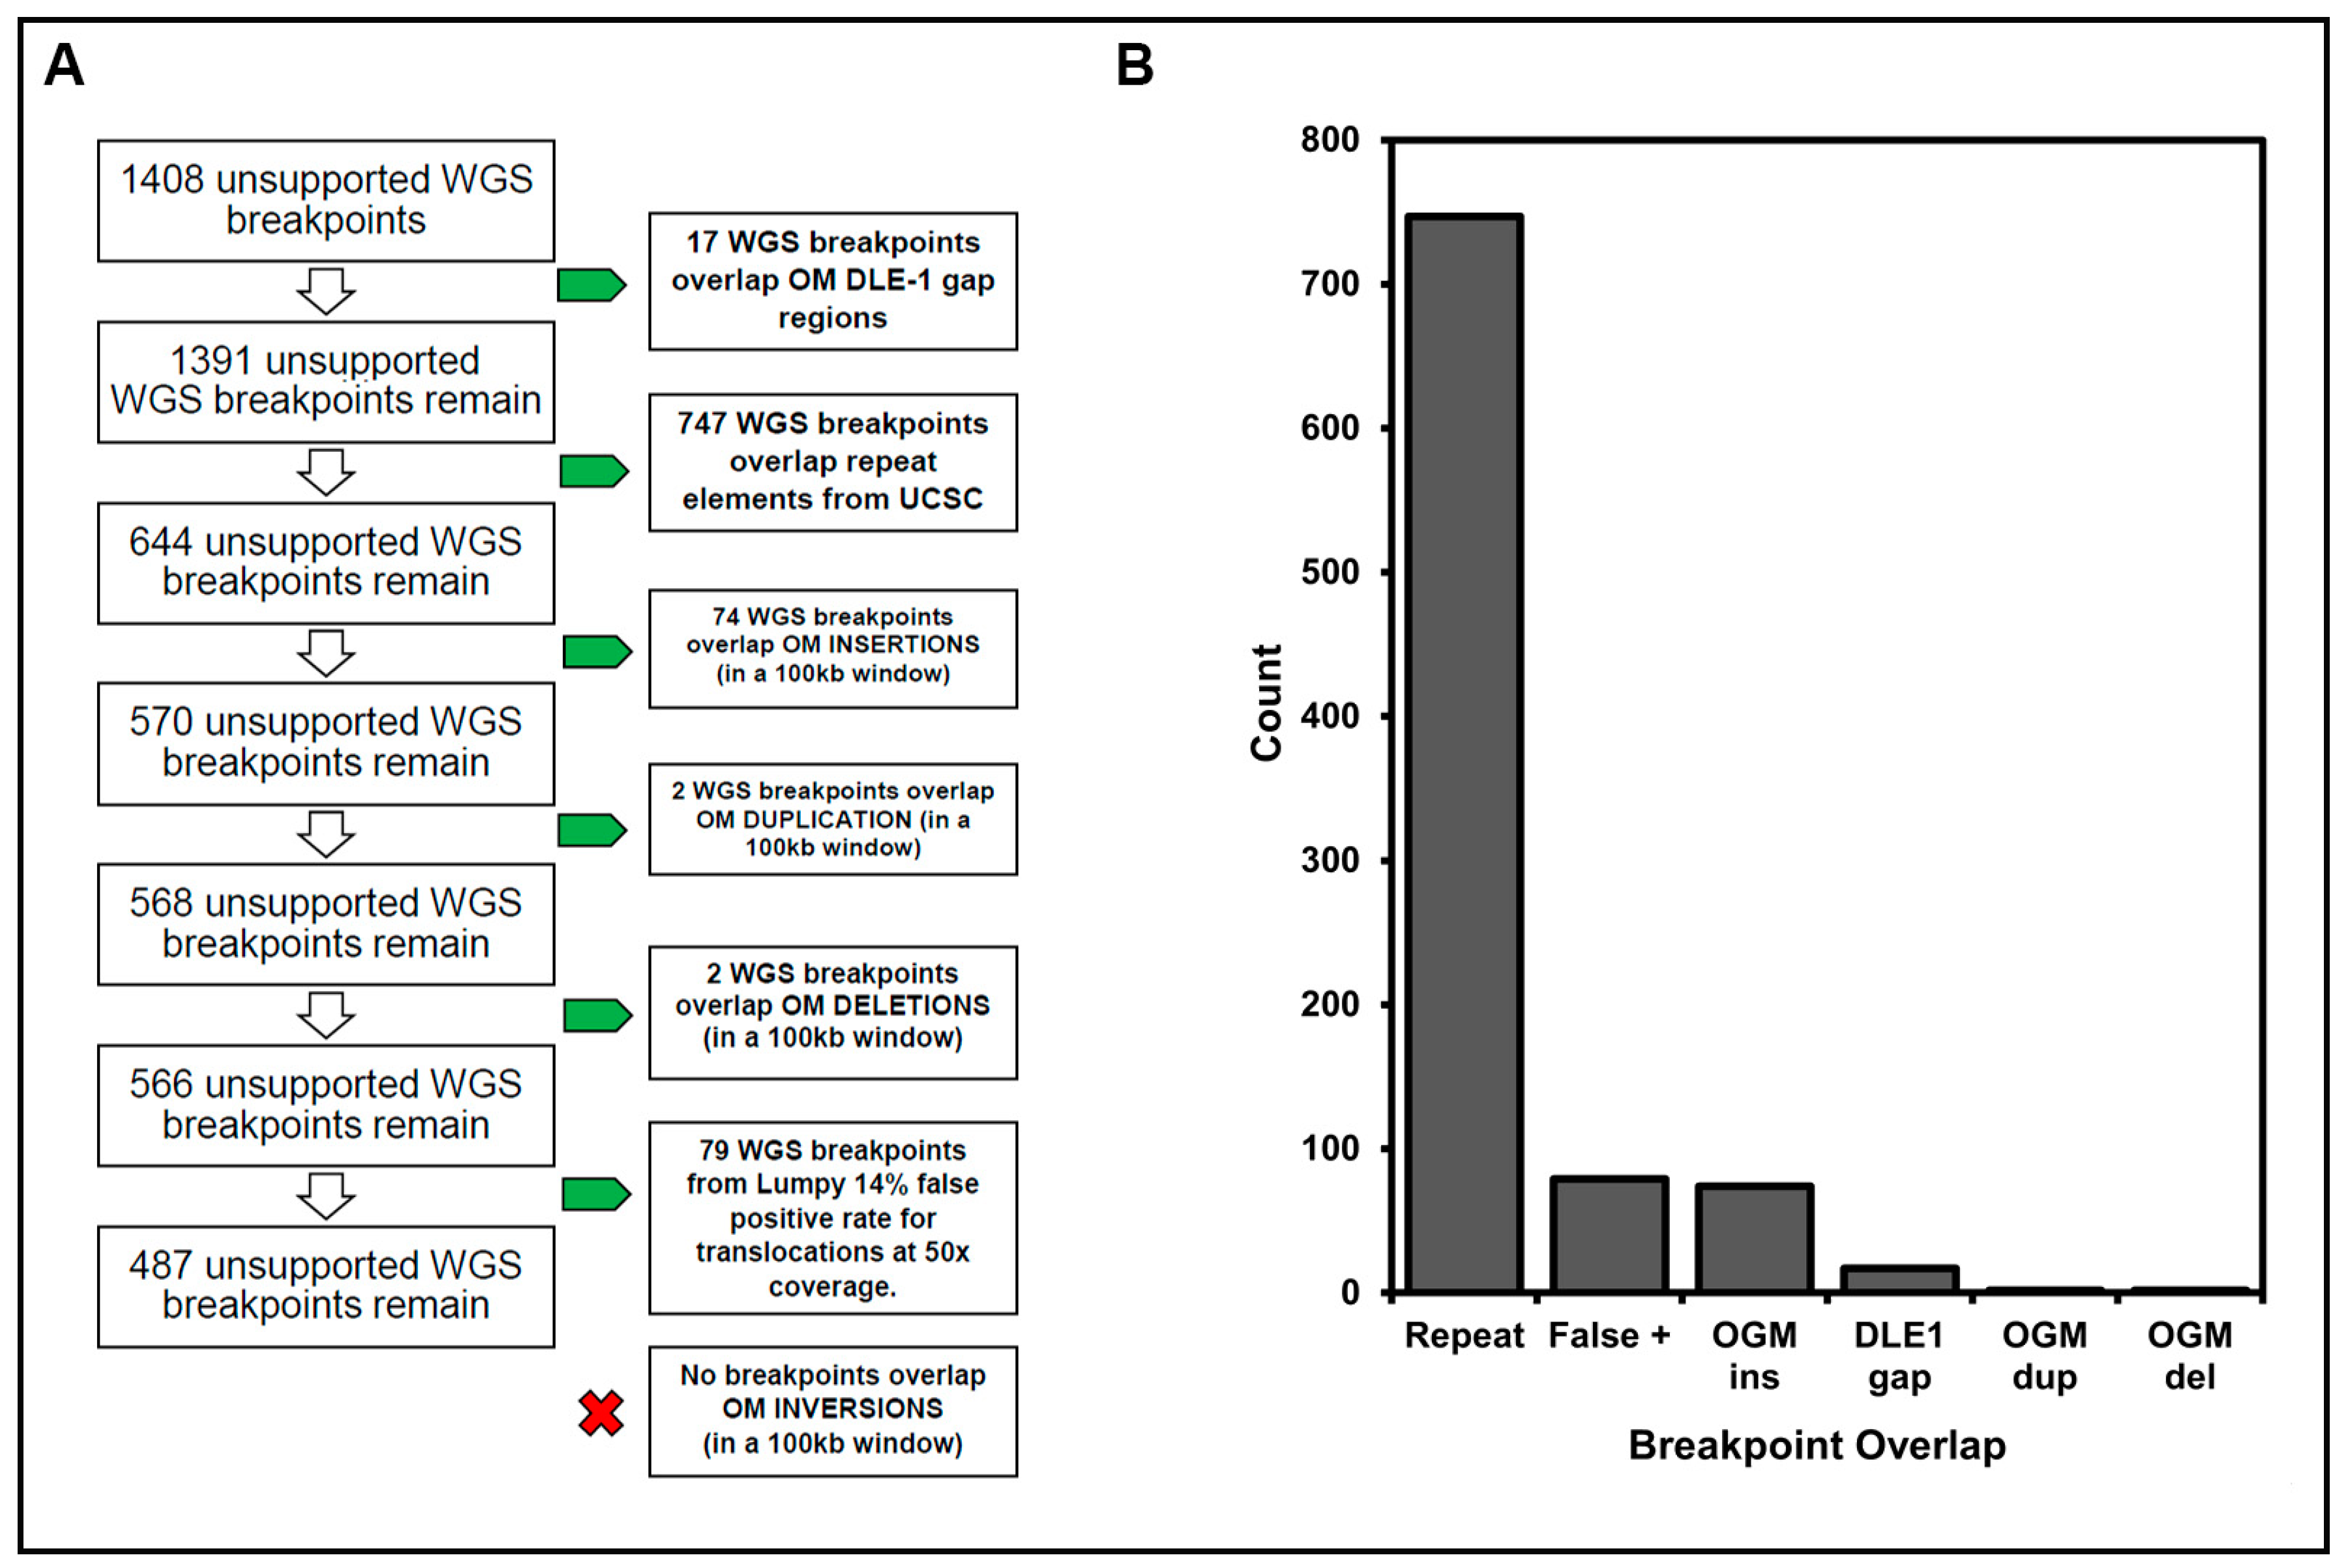
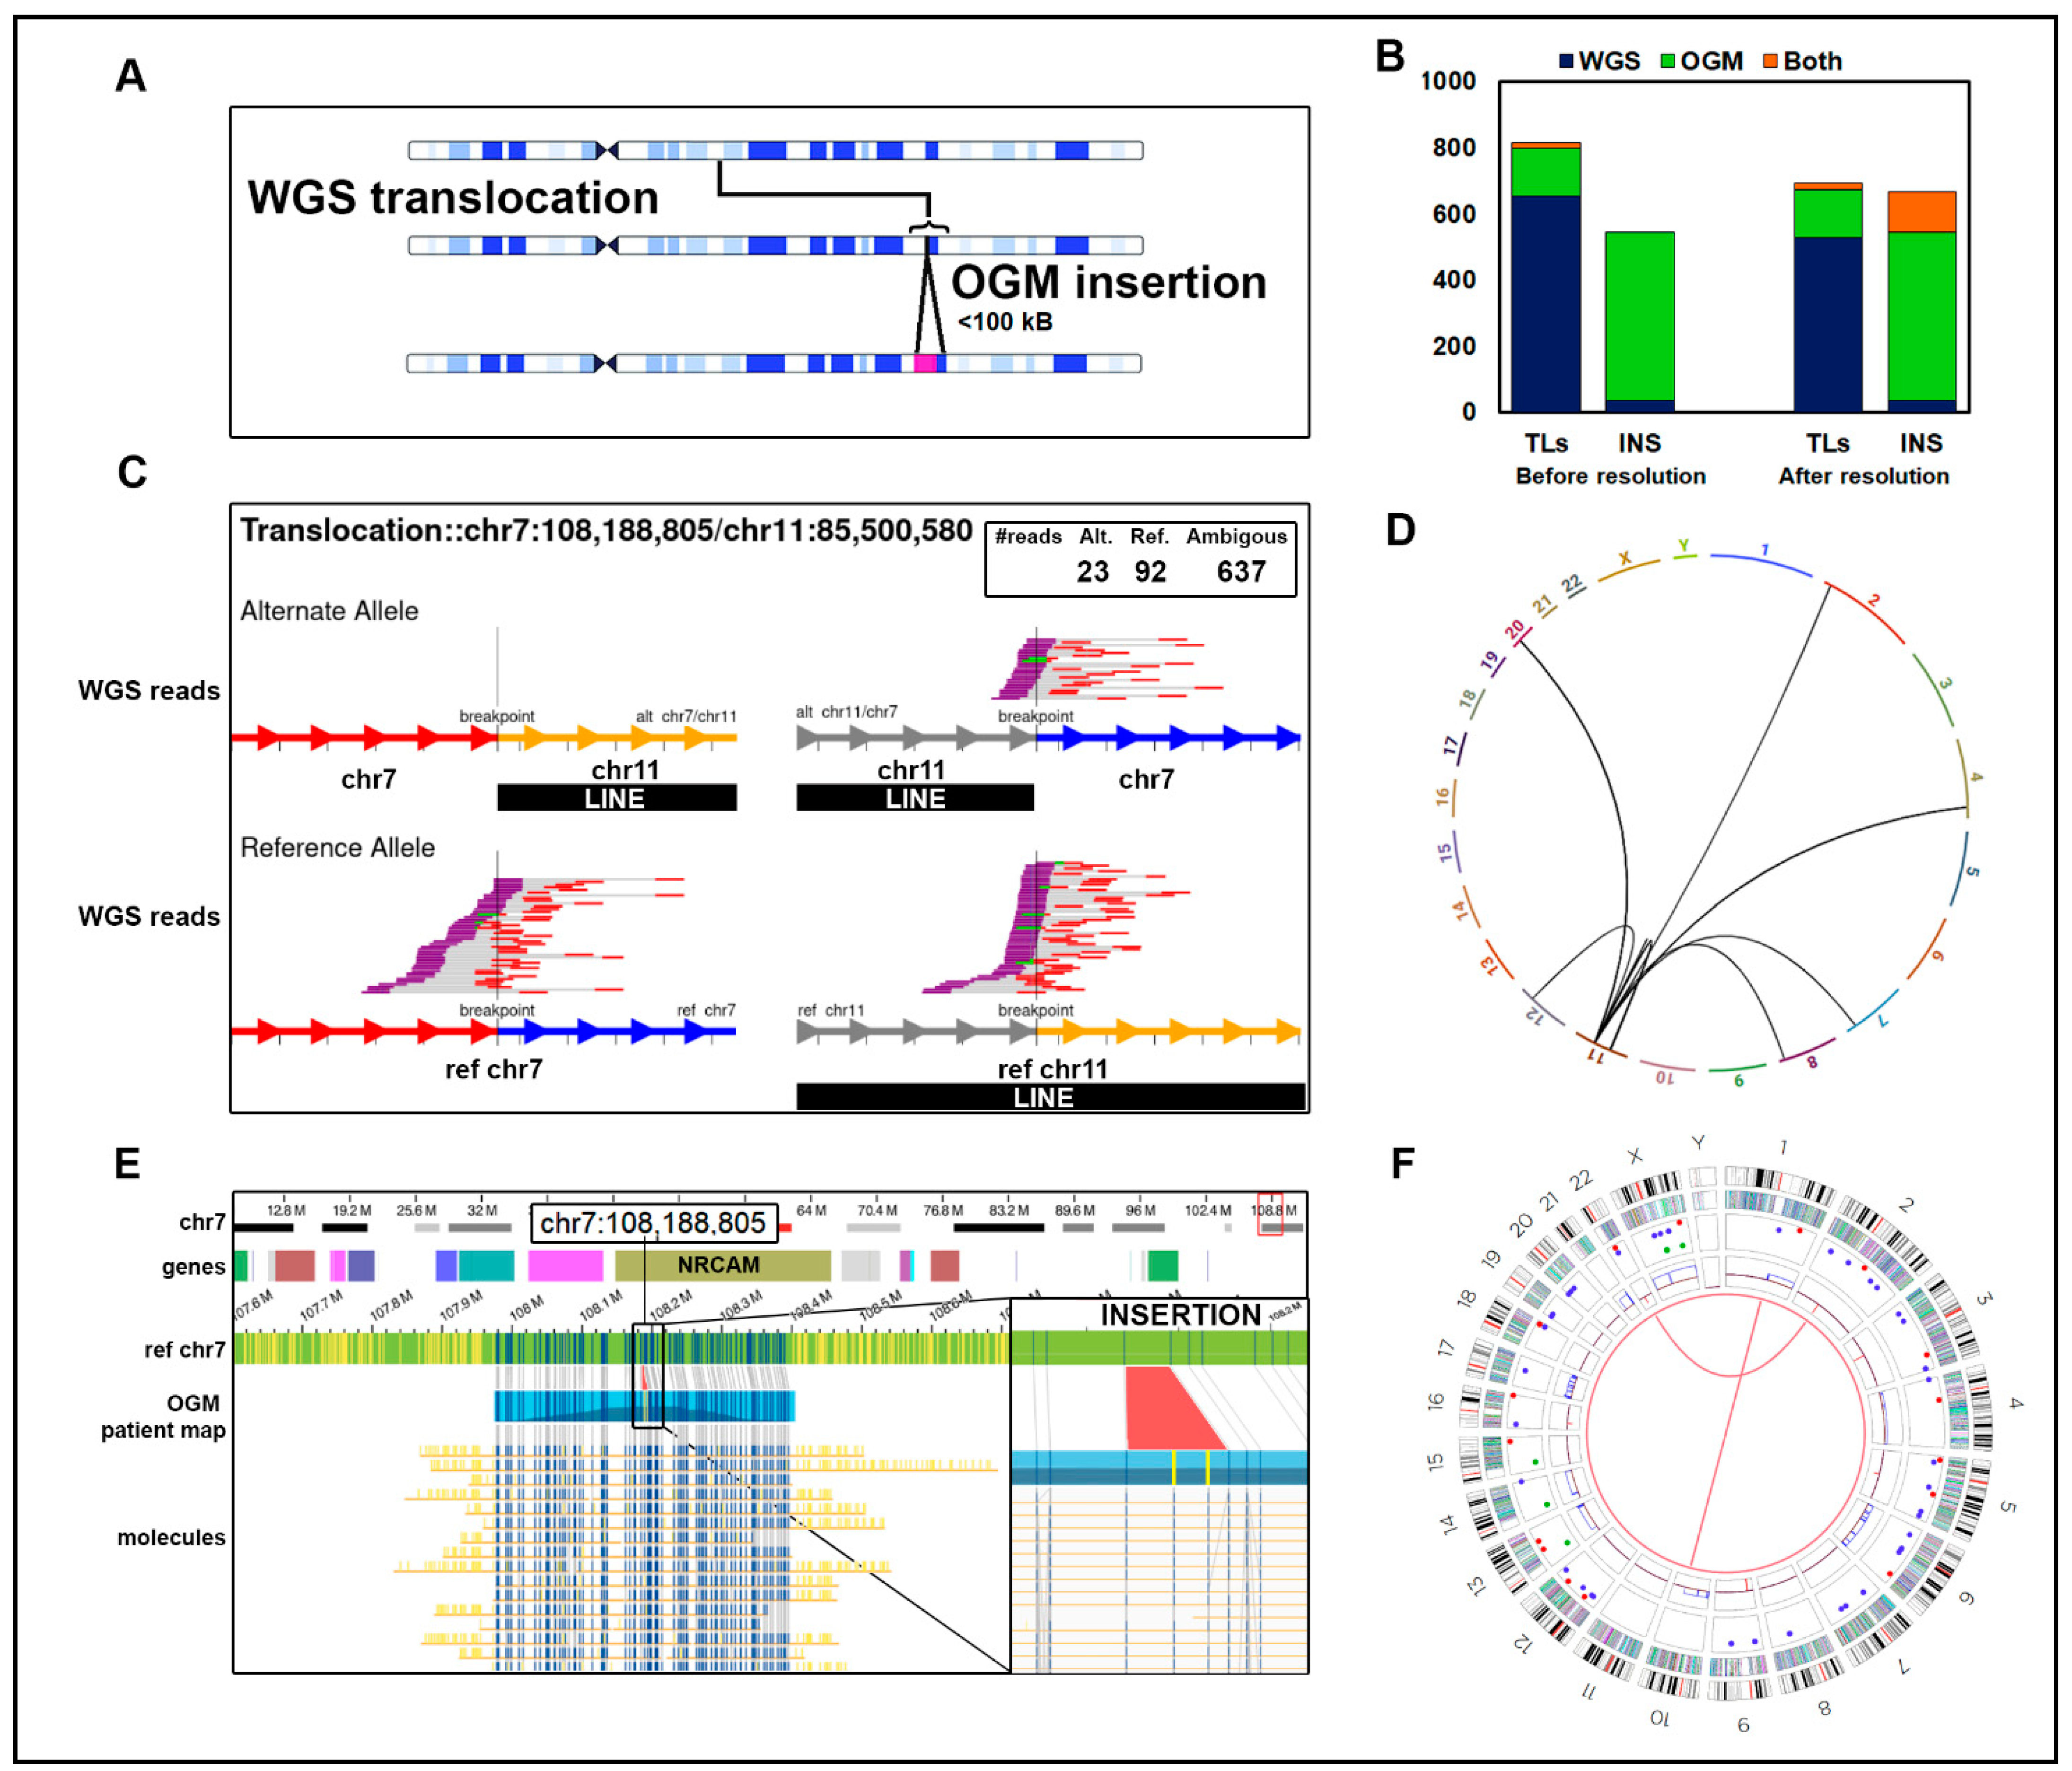
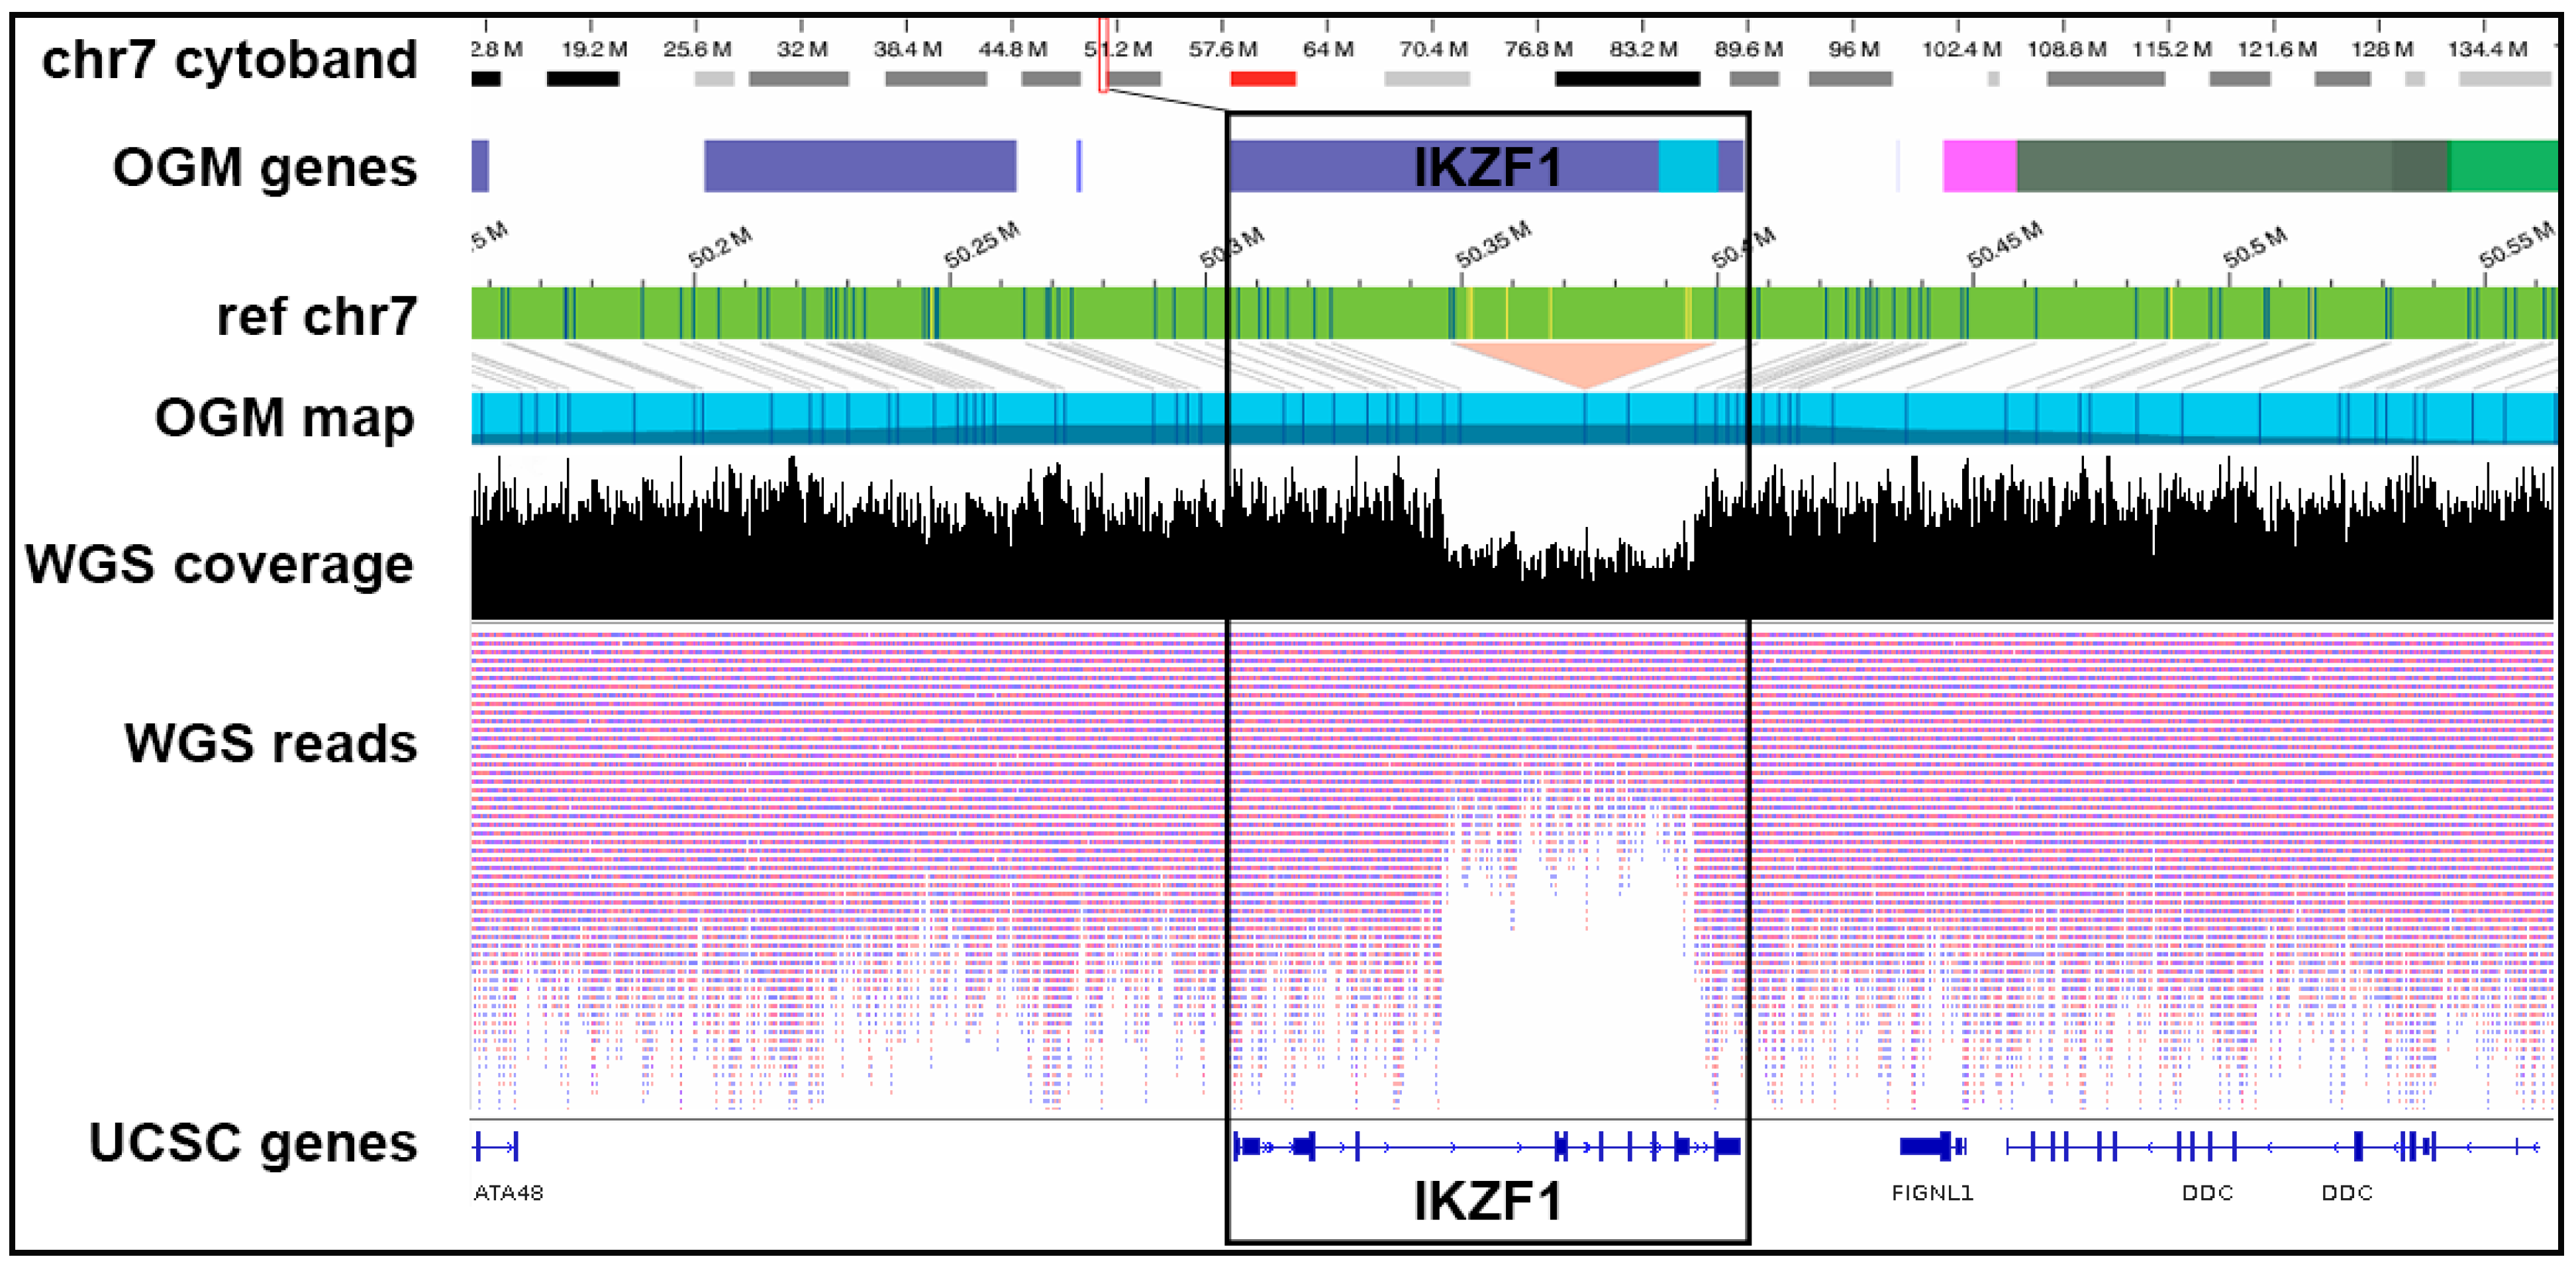
3.3. Resolution of Unsupported Breakpoints
3.4. Comparison of OGM and WGS to Cytogenetic Data
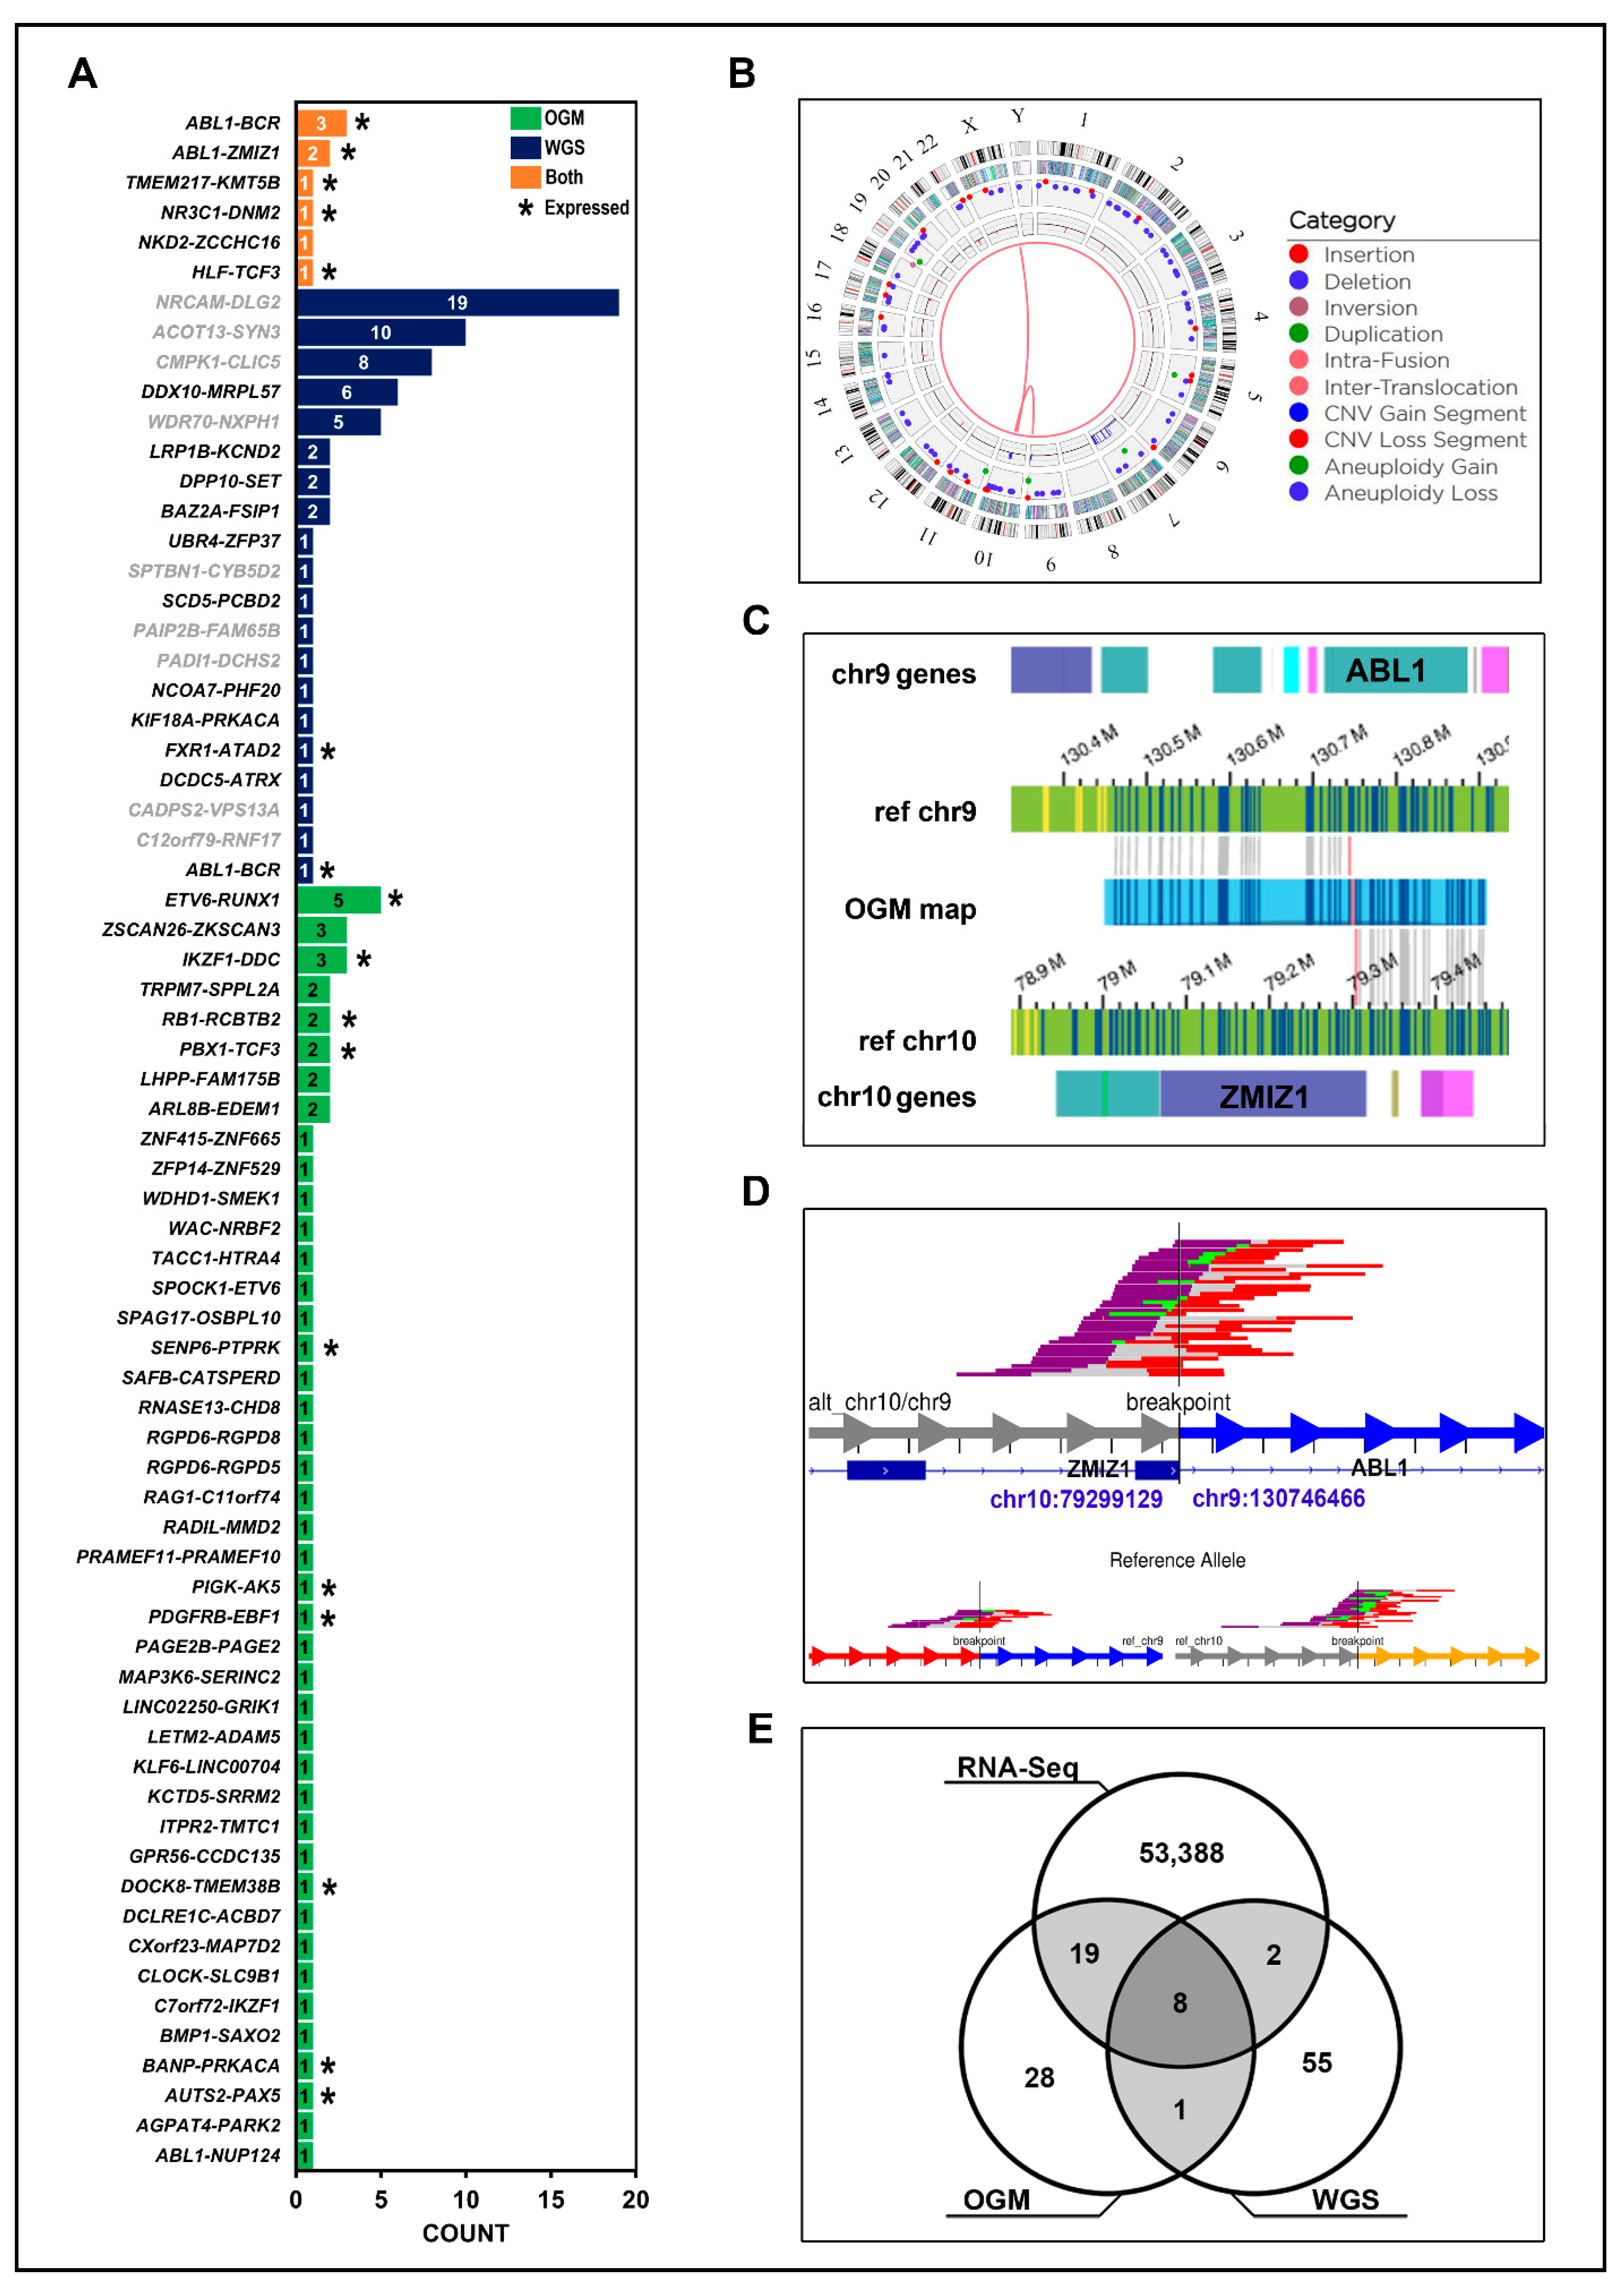
3.5. Integrating WGS, OGM, and RNA-Seq for Gene Fusion Detection
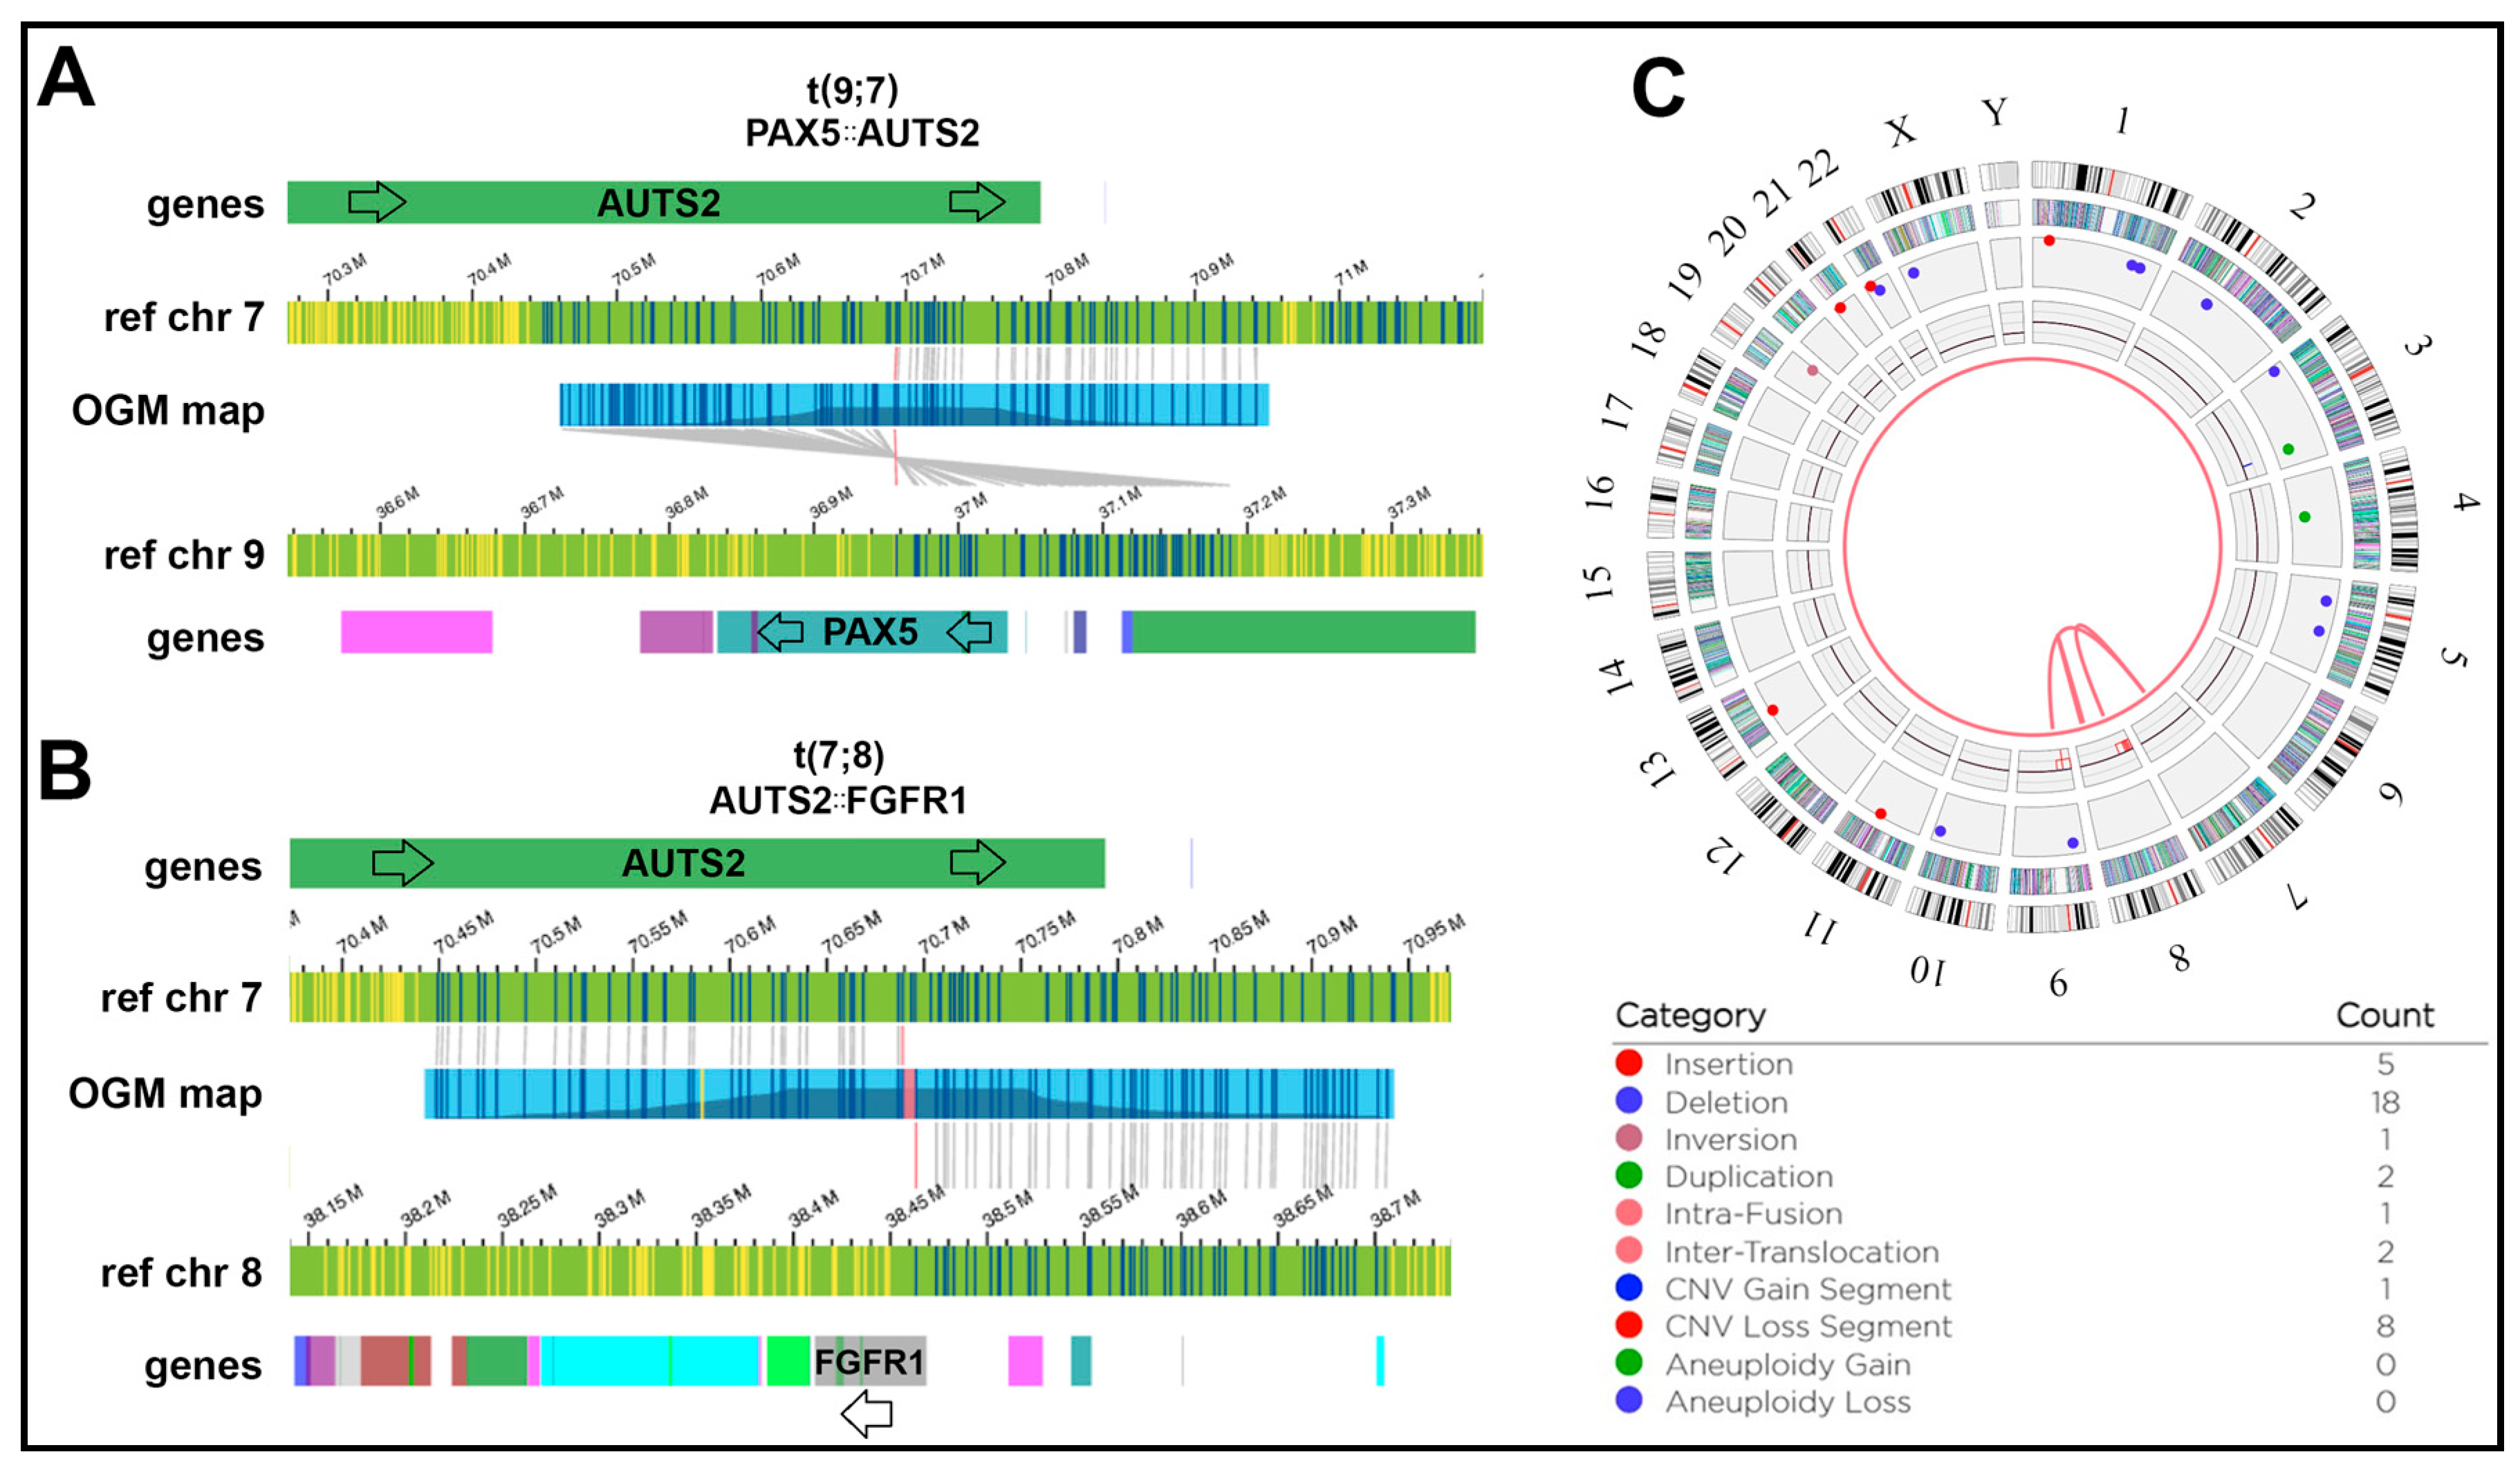
3.6. Detection of Novel Gene Fusion Events with OGM
4. Discussion
Supplementary Materials
Author Contributions
Funding
Institutional Review Board Statement
Informed Consent Statement
Data Availability Statement
Acknowledgments
Conflicts of Interest
References
- Abel, H.J.; Larson, D.E.; Regier, A.A.; Chiang, C.; Das, I.; Kanchi, K.L.; Layer, R.M.; Neale, B.M.; Salerno, W.J.; Reeves, C.; et al. Mapping and Characterization of Structural Variation in 17,795 Human Genomes. Nature 2020, 583, 83–89. [Google Scholar] [CrossRef] [PubMed]
- Chiaretti, S.; Brugnoletti, F.; Messina, M.; Paoloni, F.; Fedullo, A.L.; Piciocchi, A.; Elia, L.; Vitale, A.; Mauro, E.; Ferrara, F.; et al. CRLF2 Overexpression Identifies an Unfavourable Subgroup of Adult B-Cell Precursor Acute Lymphoblastic Leukemia Lacking Recurrent Genetic Abnormalities. Leuk. Res. 2016, 41, 36–42. [Google Scholar] [CrossRef] [PubMed]
- Hamadeh, L.; Enshaei, A.; Schwab, C.; Alonso, C.N.; Attarbaschi, A.; Barbany, G.; den Boer, M.L.; Boer, J.M.; Braun, M.; Pozza, L.D.; et al. Validation of the United Kingdom Copy-Number Alteration Classifier in 3239 Children with B-Cell Precursor ALL. Blood Adv. 2019, 3, 148–157. [Google Scholar] [CrossRef] [PubMed]
- Mirebeau, D.; Acquaviva, C.; Suciu, S.; Bertin, R.; Dastugue, N.; Robert, A.; Boutard, P.; Méchinaud, F.; Plouvier, E.; Otten, J.; et al. The Prognostic Significance of CDKN2A, CDKN2B and MTAP Inactivation in B-Lineage Acute Lymphoblastic Leukemia of Childhood. Results of the EORTC Studies 58881 and 58951. Haematologica 2006, 91, 881–885. [Google Scholar]
- Moorman, A.V.; Enshaei, A.; Schwab, C.; Wade, R.; Chilton, L.; Elliott, A.; Richardson, S.; Hancock, J.; Kinsey, S.E.; Mitchell, C.D.; et al. A Novel Integrated Cytogenetic and Genomic Classification Refines Risk Stratification in Pediatric Acute Lymphoblastic Leukemia. Blood 2014, 124, 1434–1444. [Google Scholar] [CrossRef] [PubMed]
- Tørresen, O.K.; Star, B.; Mier, P.; Andrade-Navarro, M.A.; Bateman, A.; Jarnot, P.; Gruca, A.; Grynberg, M.; Kajava, A.V.; Promponas, V.J.; et al. Tandem Repeats Lead to Sequence Assembly Errors and Impose Multi-Level Challenges for Genome and Protein Databases. Nucleic Acids Res. 2019, 47, 10994–11006. [Google Scholar] [CrossRef]
- Treangen, T.J.; Salzberg, S.L. Repetitive DNA and Next-Generation Sequencing: Computational Challenges and Solutions. Nat. Rev. Genet. 2011, 13, 36–46. [Google Scholar] [CrossRef] [PubMed]
- Dremsek, P.; Schwarz, T.; Weil, B.; Malashka, A.; Laccone, F.; Neesen, J. Optical Genome Mapping in Routine Human Genetic Diagnostics—Its Advantages and Limitations. Genes 2021, 12, 1958. [Google Scholar] [CrossRef]
- Canaguier, A.; Guilbaud, R.; Denis, E.; Magdelenat, G.; Belser, C.; Istace, B.; Cruaud, C.; Wincker, P.; Le Paslier, M.C.; Faivre-Rampant, P.; et al. Oxford Nanopore and Bionano Genomics Technologies Evaluation for Plant Structural Variation Detection. BMC Genomics 2022, 23, 317. [Google Scholar] [CrossRef]
- Lam, E.T.; Hastie, A.; Lin, C.; Ehrlich, D.; Das, S.K.; Austin, M.D.; Deshpande, P.; Cao, H.; Nagarajan, N.; Xiao, M.; et al. Genome Mapping on Nanochannel Arrays for Structural Variation Analysis and Sequence Assembly. Nat. Biotechnol. 2012, 30, 771–776. [Google Scholar] [CrossRef]
- de Koning, A.P.J.; Gu, W.; Castoe, T.A.; Batzer, M.A.; Pollock, D.D. Repetitive Elements May Comprise Over Two-Thirds of the Human Genome. PLOS Genet. 2011, 7, e1002384. [Google Scholar] [CrossRef]
- Mahmoud, M.; Gobet, N.; Cruz-Dávalos, D.I.; Mounier, N.; Dessimoz, C.; Sedlazeck, F.J. Structural Variant Calling: The Long and the Short of It. Genome Biol. 2019, 20, 246. [Google Scholar] [CrossRef] [PubMed]
- Rang, F.J.; Kloosterman, W.P.; De Ridder, J. From Squiggle to Basepair: Computational Approaches for Improving Nanopore Sequencing Read Accuracy. Genome Biol. 2018, 19, 90. [Google Scholar] [CrossRef] [PubMed]
- Kumar, A.; Adhikari, S.; Kankainen, M.; Heckman, C.A. Comparison of Structural and Short Variants Detected by Linked-Read and Whole-Exome Sequencing in Multiple Myeloma. Cancers 2021, 13, 1212. [Google Scholar] [CrossRef] [PubMed]
- Savara, J.; Novosád, T.; Gajdoš, P.; Kriegová, E. Comparison of Structural Variants Detected by Optical Mapping with Long-Read next-Generation Sequencing. Bioinformatics 2021, 37, 3398–3404. [Google Scholar] [CrossRef]
- Eisfeldt, J.; Pettersson, M.; Vezzi, F.; Wincent, J.; Käller, M.; Gruselius, J.; Nilsson, D.; Syk Lundberg, E.; Carvalho, C.M.B.; Lindstrand, A. Comprehensive Structural Variation Genome Map of Individuals Carrying Complex Chromosomal Rearrangements. PLoS Genet. 2019, 15, e1007858. [Google Scholar] [CrossRef]
- Peng, Y.; Yuan, C.; Tao, X.; Zhao, Y.; Yao, X.; Zhuge, L.; Huang, J.; Zheng, Q.; Zhang, Y.; Hong, H.; et al. Integrated Analysis of Optical Mapping and Whole-Genome Sequencing Reveals Intratumoral Genetic Heterogeneity in Metastatic Lung Squamous Cell Carcinoma. Transl. Lung Cancer Res. 2020, 9, 670–681. [Google Scholar] [CrossRef]
- Bionano Genomics. Bionano Solve Theory of Operations: Structural Variant Calling; Bionano Genomics, Inc.: San Diego, CA, USA, 2022. [Google Scholar]
- Dixon, J.R.; Xu, J.; Dileep, V.; Zhan, Y.; Song, F.; Le, V.T.; Yardımcı, G.G.; Chakraborty, A.; Bann, D.V.; Wang, Y.; et al. Integrative Detection and Analysis of Structural Variation in Cancer Genomes. Nat. Genet. 2018, 50, 1388–1398. [Google Scholar] [CrossRef]
- Xu, J.; Song, F.; Schleicher, E.; Pool, C.; Bann, D.; Hennessy, M.; Sheldon, K.; Batchelder, E.; Annageldiyev, C.; Sharma, A.; et al. An Integrated Framework for Genome Analysis Reveals Numerous Previously Unrecognizable Structural Variants in Leukemia Patients’ Samples. bioRxiv 2019, 563270. [Google Scholar] [CrossRef]
- Song, C.; Ge, Z.; Ding, Y.; Tan, B.-H.; Desai, D.; Gowda, K.; Amin, S.; Gowda, R.; Robertson, G.P.; Yue, F.; et al. IKAROS and CK2 Regulate Expression of BCL-XL and Chemosensitivity in High-Risk B-Cell Acute Lymphoblastic Leukemia. Blood 2020, 136, 1520–1534. [Google Scholar] [CrossRef]
- Goldrich, D.Y.; Labarge, B.; Chartrand, S.; Zhang, L.; Sadowski, H.B.; Zhang, Y.; Pham, K.; Way, H.; Lai, C.Y.J.; Pang, A.W.C.; et al. Identification of Somatic Structural Variants in Solid Tumors by Optical Genome Mapping. J. Pers. Med. 2021, 11, 142. [Google Scholar] [CrossRef] [PubMed]
- Layer, R.M.; Chiang, C.; Quinlan, A.R.; Hall, I.M. LUMPY: A Probabilistic Framework for Structural Variant Discovery. Genome Biol. 2014, 15, 6. [Google Scholar] [CrossRef]
- Rausch, T.; Zichner, T.; Schlattl, A.; Stütz, A.M.; Benes, V.; Korbel, J.O. DELLY: Structural Variant Discovery by Integrated Paired-End and Split-Read Analysis. Bioinformatics 2012, 28, i333–i339. [Google Scholar] [CrossRef]
- MacDonald, J.R.; Ziman, R.; Yuen, R.K.C.; Feuk, L.; Scherer, S.W. The Database of Genomic Variants: A Curated Collection of Structural Variation in the Human Genome. Nucleic Acids Res. 2014, 42, D986–D992. [Google Scholar] [CrossRef] [PubMed]
- Geoffroy, V.; Herenger, Y.; Kress, A.; Stoetzel, C.; Piton, A.; Dollfus, H.; Muller, J. AnnotSV: An Integrated Tool for Structural Variations Annotation. Bioinformatics 2018, 34, 3572–3574. [Google Scholar] [CrossRef] [PubMed]
- Shugay, M.; De Mendíbil, I.O.; Vizmanos, J.L.; Novo, F.J. Oncofuse: A Computational Framework for the Prediction of the Oncogenic Potential of Gene Fusions. Bioinformatics 2013, 29, 2539–2546. [Google Scholar] [CrossRef]
- Levy-Sakin, M.; Pastor, S.; Mostovoy, Y.; Li, L.; Leung, A.K.Y.; Mccaffrey, J.; Young, E.; Lam, E.T.; Hastie, A.R.; Wong, K.H.Y.; et al. Genome Maps across 26 Human Populations Reveal Population-Specific Patterns of Structural Variation. Nat. Commun. 2019, 10, 1025. [Google Scholar] [CrossRef] [PubMed]
- Sun, H.; Cao, S.; Mashl, R.J.; Mo, C.-K.; Zaccaria, S.; Wendl, M.C.; Davies, S.R.; Bailey, M.H.; Primeau, T.M.; Hoog, J.; et al. Comprehensive Characterization of 536 Patient-Derived Xenograft Models Prioritizes Candidates for Targeted Treatment. Nat. Commun. 2021, 12, 5086. [Google Scholar] [CrossRef]
- Levy, B.; Baughn, L.B.; Akkari, Y.; Chartrand, S.; LaBarge, B.; Claxton, D.; Lennon, P.A.; Cujar, C.; Kolhe, R.; Kroeger, K.; et al. Optical Genome Mapping in Acute Myeloid Leukemia: A Multicenter Evaluation. Blood Adv. 2023, 7, 1297. [Google Scholar] [CrossRef]
- Papavasiliou, F.; Casellas, R.; Suh, H.; Qin, X.F.; Besmer, E.; Pelanda, R.; Nemazee, D.; Rajewsky, K.; Nussenzweig, M.C. V(D)J Recombination in Mature B Cells: A Mechanism for Altering Antibody Responses. Science 1997, 278, 298–301. [Google Scholar] [CrossRef]
- Kim, P.; Zhou, X. FusionGDB: Fusion Gene Annotation DataBase. Nucleic Acids Res. 2019, 47, D994–D1004. [Google Scholar] [CrossRef]
- Liu, H.; Bai, H.; Zhang, S.; Zhao, X.; Mao, D.; Xi, R. Dasatinib for Chronic Myelomonocytic Leukemia with ZMIZ1-ABL1 Fusion Gene: A Case Report. Int. J. Hematol. 2023, 117, 929–932. [Google Scholar] [CrossRef] [PubMed]
- Soler, G.; Radford-Weiss, I.; Ben-abdelali, R.; Mahlaoui, N.; Ponceau, J.F.; Macintyre, E.A.; Vekemans, M.; Bernard, O.A.; Romana, S.P. Fusion of ZMIZ1 to ABL1 in a B-Cell Acute Lymphoblastic Leukaemia with a t(9;10)(Q34;Q22.3) Translocation. Leukemia 2007, 22, 1278–1280. [Google Scholar] [CrossRef] [PubMed]
- Jang, Y.E.; Jang, I.; Kim, S.; Cho, S.; Kim, D.; Kim, K.; Kim, J.; Hwang, J.; Kim, S.; Kim, J.; et al. ChimerDB 4.0: An Updated and Expanded Database of Fusion Genes. Nucleic Acids Res. 2020, 48, D817–D824. [Google Scholar] [CrossRef] [PubMed]
- Balamurali, D.; Gorohovski, A.; Detroja, R.; Palande, V.; Raviv-Shay, D.; Frenkel-Morgenstern, M. ChiTaRS 5.0: The Comprehensive Database of Chimeric Transcripts Matched with Druggable Fusions and 3D Chromatin Maps. Nucleic Acids Res. 2020, 48, 825–834. [Google Scholar] [CrossRef] [PubMed]
- Coyaud, E.; Struski, S.; Dastugue, N.; Brousset, P.; Broccardo, C.; Bradtke, J. PAX5-AUTS2 Fusion Resulting from t(7;9)(Q11.2;P13.2) Can Now Be Classified as Recurrent in B Cell Acute Lymphoblastic Leukemia. Leuk. Res. 2010, 34, e323–e325. [Google Scholar] [CrossRef] [PubMed]
- Denk, D.; Nebral, K.; Bradtke, J.; Pass, G.; Möricke, A.; Attarbaschi, A.; Strehl, S. PAX5-AUTS2: A Recurrent Fusion Gene in Childhood B-Cell Precursor Acute Lymphoblastic Leukemia. Leuk. Res. 2012, 36, e178–e181. [Google Scholar] [CrossRef]
- Barnes, E.J.; Leonard, J.; Medeiros, B.C.; Druker, B.J.; Tognon, C.E. Functional Characterization of Two Rare BCR-FGFR1+ Leukemias. Cold Spring Harb. Mol. Case Stud. 2020, 6, a004838. [Google Scholar] [CrossRef]
- Shimanuki, M.; Sonoki, T.; Hosoi, H.; Watanuki, J.; Murata, S.; Mushino, T.; Kuriyama, K.; Tamura, S.; Hatanaka, K.; Hanaoka, N.; et al. Acute Leukemia Showing t(8;22)(P11;Q11), Myelodysplasia, CD13/CD33/CD19 Expression and Immunoglobulin Heavy Chain Gene Rearrangement. Acta Haematol. 2013, 129, 238–242. [Google Scholar] [CrossRef]
- Haas, B.J.; Dobin, A.; Li, B.; Stransky, N.; Pochet, N.; Regev, A. Accuracy Assessment of Fusion Transcript Detection via Read-Mapping and de Novo Fusion Transcript Assembly-Based Methods. Genome Biol. 2019, 20, 213. [Google Scholar] [CrossRef]
- Yeoh, A.E.J.; Lu, Y.; Chin, W.H.N.; Chiew, E.K.H.; Lim, E.H.; Li, Z.; Kham, S.K.Y.; Chan, Y.H.; Abdullah, W.A.; Lin, H.P.; et al. Intensifying Treatment of Childhood B-Lymphoblastic Leukemia With IKZF1 Deletion Reduces Relapse and Improves Overall Survival: Results of Malaysia-Singapore ALL 2010 Study. J. Clin. Oncol. 2018, 36, 2726–2735. [Google Scholar] [CrossRef] [PubMed]


| Sample | Known Cytogenetics | WGS | OGM | Differences from Cytogenetics |
|---|---|---|---|---|
| W0 | IKZF1 deletion | IKZF1 deletion confirmed. | IKZF1 deletion confirmed. | Concur |
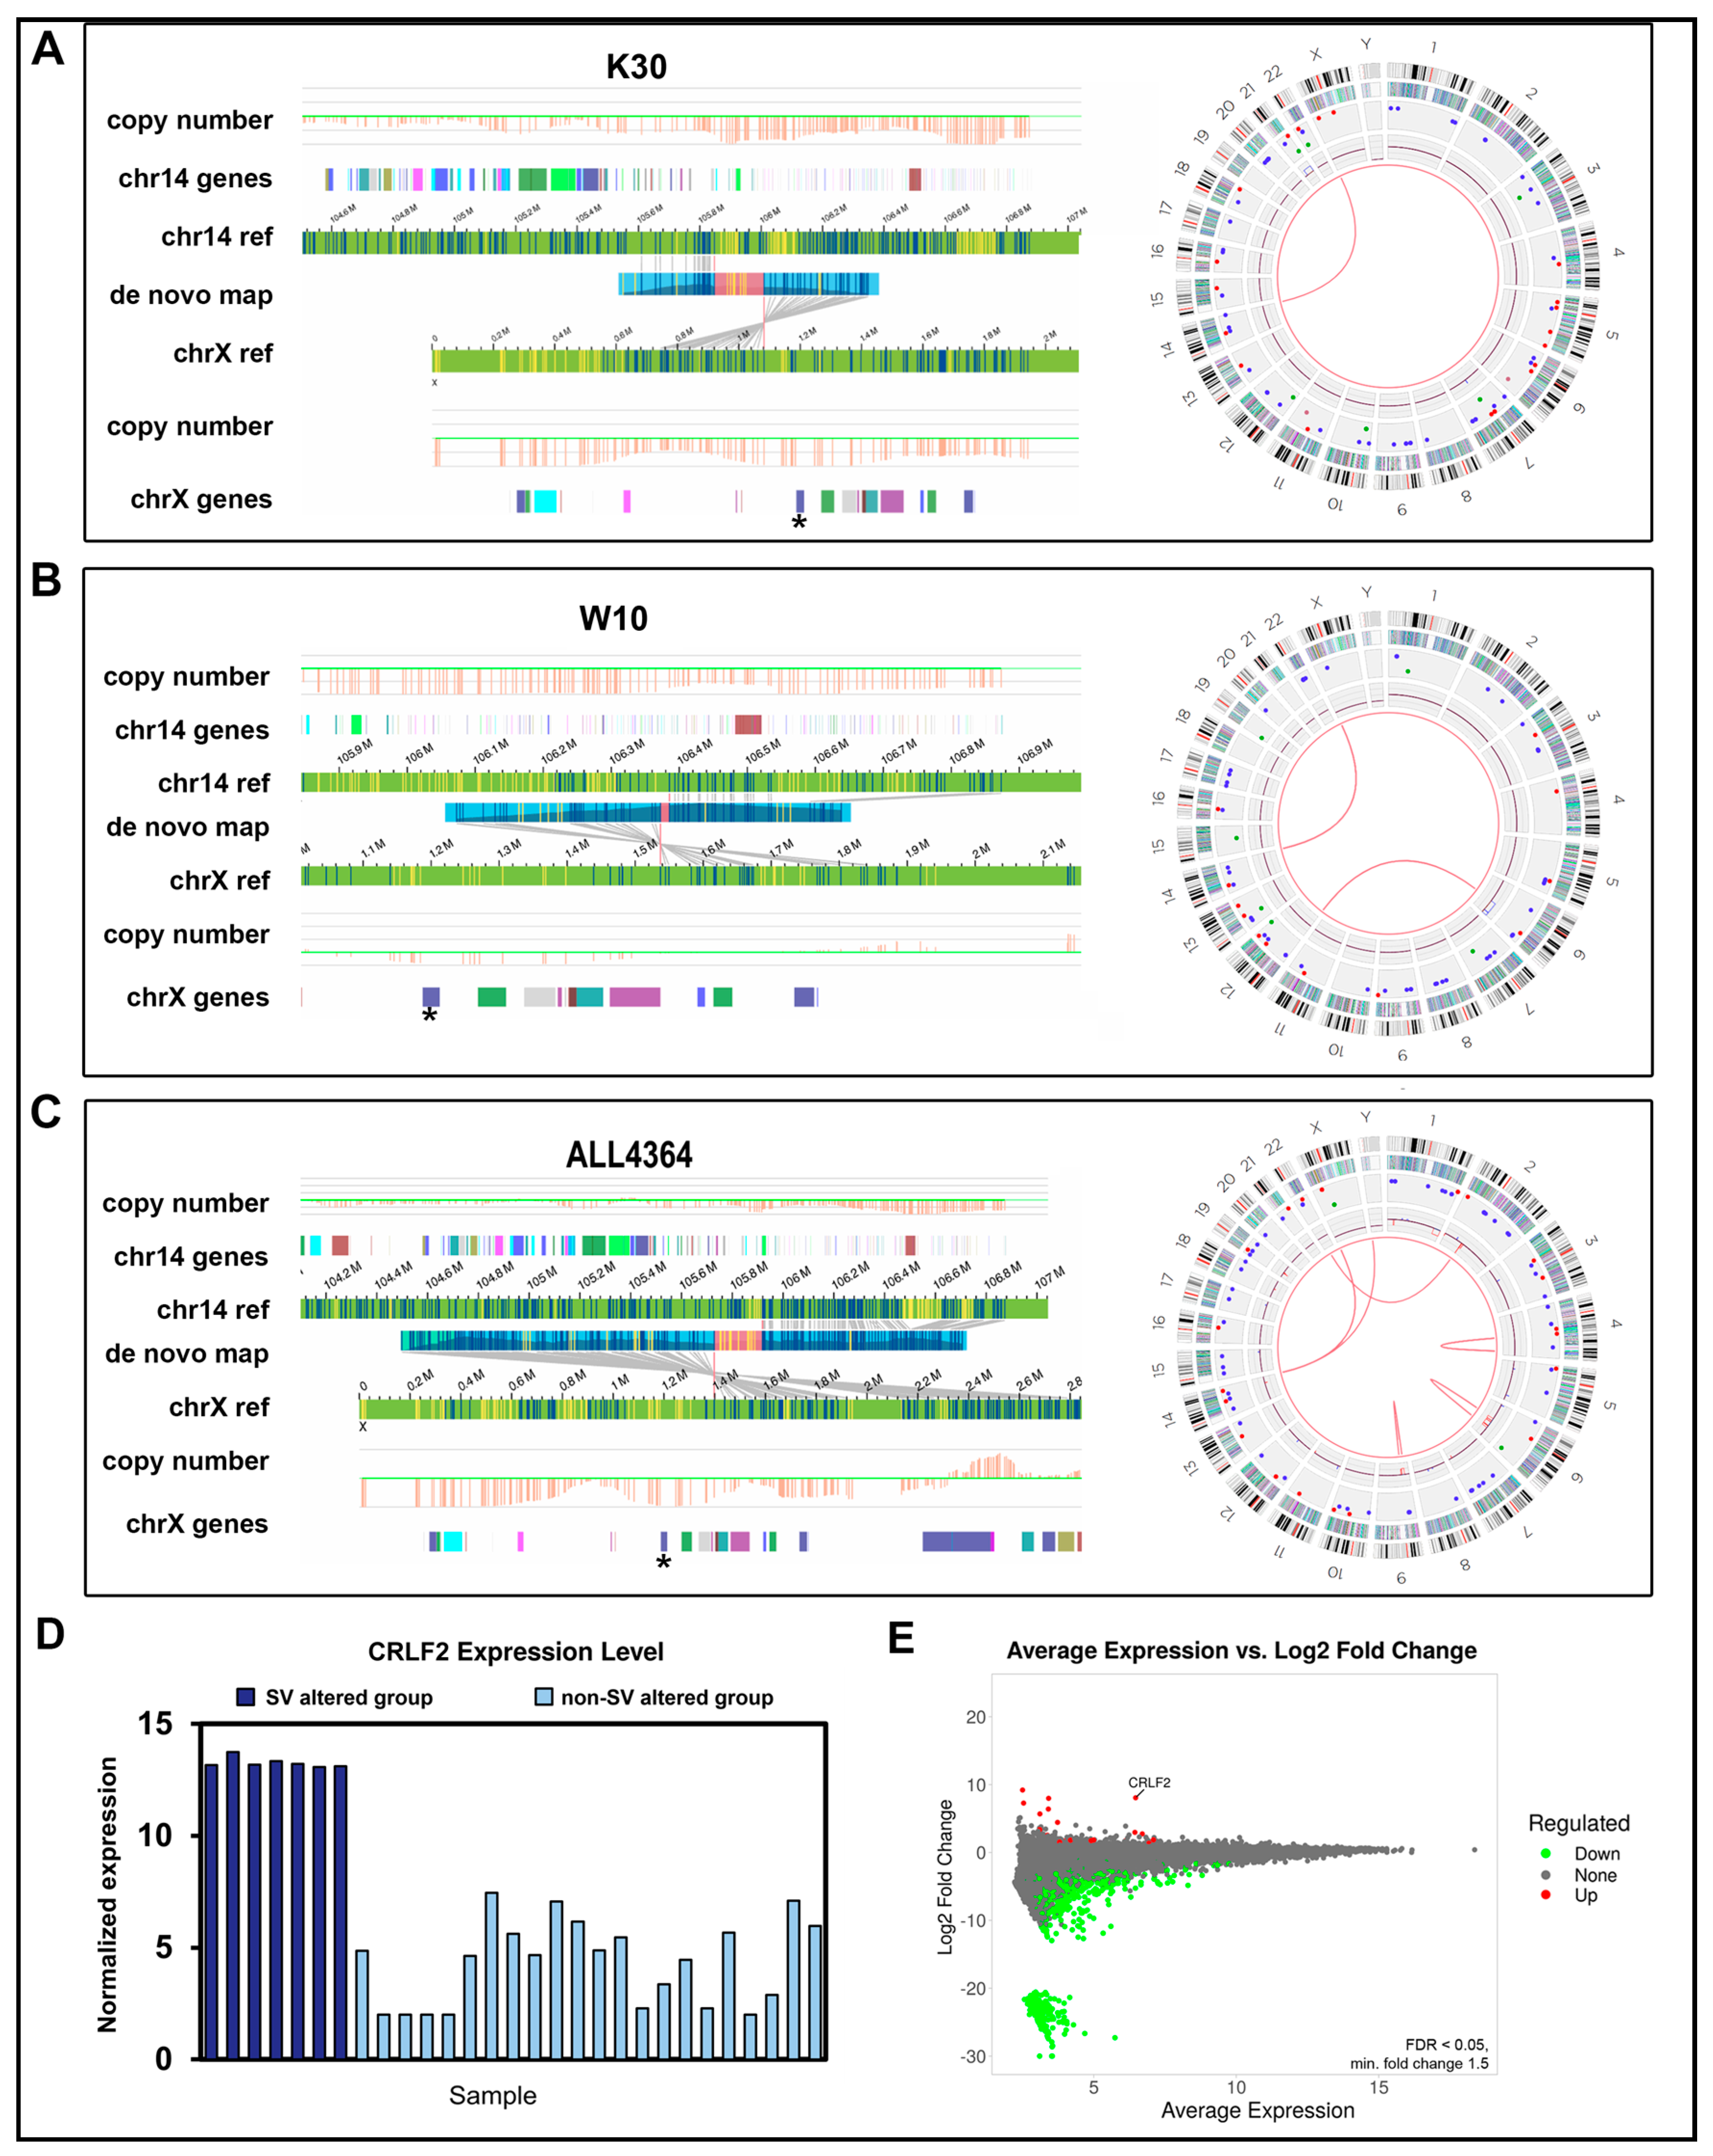
| W10 | IKZF1 deletion | IKZF1 deletion confirmed. | IKZF1 deletion confirmed. IGH::CRLF2 translocation | OGM reports IGH::CRLF2 translocation |
| W13 | IKZF1 wild type | Normal IKZF1 confirmed | Normal IKZF1 confirmed | Concur |
| W31 | IKZF1 wild type | IKZF1 deletion reported | IKZF1 deletion reported | WGS and OGM report deletion in IKZF1 (Figure 5) |
| MXP3 | BCR::ABL1 translocation, IKZF1 deletion, PAX5 deletion | IKZF1 and PAX5 deletions confirmed. BCR::ABL1 translocation confirmed | IKZF1 and PAX5 deletions confirmed. BCR::ABL1 translocation confirmed | Concur |
| ICN1 | BCR::ABL1 translocation | BCR::ABL1 translocation confirmed | BCR::ABL1 translocation confirmed | Concur |
| ALL4364 | IGH::CRLF2 | IGH::CRLF2 translocation reported but does not pass filtering | abParts::KIAA0125 translocation near but not involving CRLF2 | OGM and WGS do not report IGH::CRLF2 but OGM identifies a nearby translocation |
| PVCRK | IGH::EPOR translocation, CDKN2A, IKZF1, and JAK2 deletions | No IGH::EPOR translocation reported. CDKN2A and IKZF1 deletion confirmed. No JAK2 SV reported. | No IGH::EPOR translocation. IKZF1, PAX5, and CDKN2A deletions confirmed. No JAK2 SV reported | Additional PAX5 deletion identified by OGM. No IGH::EPOR translocations reported in WGS or OGM. No JAK2 SV reported by OGM or WGS |
| PAVDRS | IGH::EPOR, CDKN2A, IKZF1, and PAX5 deletions | No IGH::EPOR translocation. IKZF1, CDKN2A deletions confirmed. No PAX5 deletion reported | No IGH::EPOR translocation. IKZF1, CDKN2A, and PAX5 deletions confirmed. | WGS does not report the PAX5 deletion |
| Fusion | Sample | Location | OGM | WGS | RNA-Seq |
|---|---|---|---|---|---|
| TMEM217::KMT5B | ALL-19 | chr6:37,243,578 > chr11:68,174,277 | ✓ | ✓ | ✓ |
| BCR::ABL1 | G2650 | chr9:130,854,197 > chr22:23,219,813 | ✓ | ✓ | ✓ |
| NR3C1::DNM2 | G2650 | chr5:143,350,483 > chr19:10,739,595 | ✓ | ✓ | ✓ |
| BCR::ABL1 | ICN1 | chr9:130,846,798 > chr22:23,290,277 | ✓ | ✓ | ✓ |
| BCR::ABL1 | MXP3 | chr9:130,821,448 > chr22:23,290,361 | ✓ | ✓ | ✓ |
| ABL1::ZMIZ1 | PAVCYL | chr9:130,746,469 > chr10:79,299,033 | ✓ | ✓ | ✓ |
| HLF::TCF3 | ALL-07 | chr17:55,319,005 > chr19:1,619,186 | ✓ | ✓ | ✓ |
| ABL1::ZMIZ1 | PAWFUU | chr9:130,746,466 > chr10:79,299,129 | ✓ | ✓ | ✓ |
| NKD2::ZCCHC16 | ICN1 | chr5_KI270792v1alt:30755 > chrX:112,294,171 | ✓ | ✓ | ✕ |
Disclaimer/Publisher’s Note: The statements, opinions and data contained in all publications are solely those of the individual author(s) and contributor(s) and not of MDPI and/or the editor(s). MDPI and/or the editor(s) disclaim responsibility for any injury to people or property resulting from any ideas, methods, instructions or products referred to in the content. |
© 2024 by the authors. Licensee MDPI, Basel, Switzerland. This article is an open access article distributed under the terms and conditions of the Creative Commons Attribution (CC BY) license (https://creativecommons.org/licenses/by/4.0/).
Share and Cite
Budurlean, L.; Tukaramrao, D.B.; Zhang, L.; Dovat, S.; Broach, J. Integrating Optical Genome Mapping and Whole Genome Sequencing in Somatic Structural Variant Detection. J. Pers. Med. 2024, 14, 291. https://doi.org/10.3390/jpm14030291
Budurlean L, Tukaramrao DB, Zhang L, Dovat S, Broach J. Integrating Optical Genome Mapping and Whole Genome Sequencing in Somatic Structural Variant Detection. Journal of Personalized Medicine. 2024; 14(3):291. https://doi.org/10.3390/jpm14030291
Chicago/Turabian StyleBudurlean, Laura, Diwakar Bastihalli Tukaramrao, Lijun Zhang, Sinisa Dovat, and James Broach. 2024. "Integrating Optical Genome Mapping and Whole Genome Sequencing in Somatic Structural Variant Detection" Journal of Personalized Medicine 14, no. 3: 291. https://doi.org/10.3390/jpm14030291