Article

Integrated Bioinformatics Investigation of Novel Biomarkers of Uterine Leiomyosarcoma Diagnosis and Outcome

1
The Obstetrics and Gynecology Clinic Narodni Front, 11000 Belgrade, Serbia
2
School of Medicine, University of Belgrade, 11000 Belgrade, Serbia
3
Faculty of Mathematics, Natural Sciences and Information Technologies, University of Primorska, 6000 Koper, Slovenia
*
Author to whom correspondence should be addressed.
J. Pers. Med. 2023, 13(6), 985; https://doi.org/10.3390/jpm13060985
Submission received: 10 May 2023 / Revised: 30 May 2023 / Accepted: 8 June 2023 / Published: 13 June 2023
(This article belongs to the Special Issue Bioinformatics and Medicine)

Abstract

:
Uterine leiomyosarcomas (uLMS) have a poor prognosis and a high percentage of recurrent disease. Bioinformatics has become an integral element in rare cancer studies by overcoming the inability to collect a large enough study population. This study aimed to investigate and highlight crucial genes, pathways, miRNAs, and transcriptional factors (TF) on uLMS samples from five Gene Expression Omnibus datasets and The Cancer Genome Atlas Sarcoma study. Forty-one common differentially expressed genes (DEGs) were enriched and annotated by the DAVID software. With protein–protein interaction (PPI) network analysis, we selected ten hub genes that were validated with the TNMplotter web tool. We used the USCS Xena browser for survival analysis. We also predicted TF-gene and miRNA-gene regulatory networks along with potential drug molecules. TYMS and TK1 correlated with overall survival in uLMS patients. Finally, our results propose further validation of hub genes (TYMS and TK1), miR-26b-5p, and Sp1 as biomarkers of pathogenesis, prognosis, and differentiation of uLMS. Regarding the aggressive behavior and poor prognosis of uLMS, with the lack of standard therapeutic regimens, in our opinion, the results of our study provide enough evidence for further investigation of the molecular basis of uLMS occurrence and its implication in the diagnosis and therapy of this rare gynecological malignancy.

1. Introduction

Even though they represent only 3–9% of all uterine malignancies, uterine leiomyosarcomas (uLMS) are aggressive neoplasms with poor prognosis, resistance to standard treatment protocols, and a high percentage of recurrent disease [1,2]. No imaging method or laboratory test can differentiate uLMS preoperatively with enough certainty [1,3]. The definitive diagnosis is still related to histology and, nowadays, molecular testing [4].
The main diagnostical challenge is to differentiate uLMS from uterine leiomyomas (ULM), a benign uterine smooth-muscle tumor with similar clinical and imaging findings. Since usual uterine leiomyoma treatment has a conservative or minimally invasive approach, the misdiagnosis between these entities could significantly increase morbidity and mortality [5,6].
Surgery and early complete resection is the only evidence-based effective treatment, with the standard protocol being total abdominal hysterectomy and bilateral salpingo-oophorectomy [7,8]. By the current consensus, chemotherapy is ineffective, and there are no standard regimens for adjuvant chemotherapy after complete resection [7,8,9,10]. On the other hand, doxorubicin monotherapy is still the superior regimen for metastatic, unresectable, and recurrent disease [8]. To date, none of the clinical trials performed a biomarker-specific patient selection [8].
Bioinformatics provides methodologies and databases for the analysis, integration, and interpretation of multi-omics Big Data [11]. Moreover, bioinformatics has become an integral element in rare cancer studies by overcoming the inability to collect a large enough study population [12]. With this study, we wanted to explore driving genes and significant pathways and identify potential novel biomarkers of diagnosis and outcome in uLMS patients using an integrated bioinformatics analysis.

2. Materials and Methods

2.1. Microarray Data Mining and Identification of DEGs

Supported by the National Center for Biotechnology Information (NCBI), Gene Expression Omnibus (GEO) (https://www.ncbi.nlm.nih.gov/geo/, accessed on 3 March 2023) is an open-access database that stores raw and processed gene expression data retrieved by a variety of methods, such as DNA microarray, high-through output sequencing, and RT-PCR [13,14]. We used advanced search queries to obtain datasets that include information regarding gene expression from uLMS, normal myometrium, and ULM. We included datasets that stored processed expression profiles obtained by array analysis of human uLMS, ULM, and normal myometrial tissue, with the number of samples > 8. Finally, we included the following datasets for further analysis: GSE764, GSE36610, GSE64763, GSE68312, and GSE32507. Information regarding the platforms, the total number of samples, and the specific number of tumor samples are presented in Table 1.
The Cancer Genome Atlas (TCGA) (https://www.cancer.gov/ccg/research/genome-sequencing/tcga, accessed on 4 March 2023), a joint project between the National Cancer Institute (NCI) and the National Human Genome Research Institute, is a publicly available storage of over 2.5 petabytes of genomic, epigenomic, transcriptomic, and proteomic data from over 20,000 cancer and matched normal tissue samples [15]. The TCGA-SARC dataset includes samples from several sarcoma subtypes, including leiomyosarcoma arising from gynecological tissue. The University of California, Santa Cruz (UCSC) Xena (https://xena.ucsc.edu/, accessed on 4 March 2023) is an online, freely available tool for visualizing and analysis of large public repositories and datasets, including TCGA [16]. The RNA sequencing (RNA-Seq) data, clinical data, and probe annotation files of 33 uLMS patients in TCGA-SARC were downloaded and analyzed by the UCSC Xena.
GEO includes an R-based tool for the analysis and visualization of differentially expressed genes between user-determined groups of samples from the exact GEO dataset, GEO2R (https://www.ncbi.nlm.nih.gov/geo/geo2r/, accessed on 5 March 2023) [17]. We used GEO2R to detect DEGs between uLMS and normal myometrium, uLMS and ULM, and uLMS and UCS samples. The screening of DEGS was carried out using a threshold of ∣log2 FC| ≥ 1 and p < 0.05. We used an online tool, InteractiVenn (http://www.interactivenn.net/, accessed on 10 March 2023) [18], to plot Venn diagrams of the DEGs of datasets. The overlapping DEGs from GSE764, GSE36610, GSE64763, and GSE68312 between uLMS and normal myometrium were enrolled in further analysis. DEGs between uLMS and uterine fibroids from GSE764 and GSE64763 were also screened and further analyzed. We screened DEGs between uLMS and UCS from GSE32507. Finally, we constructed Venn diagrams of the overlapped DEGs between two (uLMS-normal myometrium and uLMS-ULM) and all three cohorts, respectively.

2.2. Gene Ontology (GO) and Kyoto Encyclopedia of Genes and Genomes (KEGG) Pathway Analysis

GO is a bioinformatic resource that provides annotations supported by evidence to describe the biological roles of genes, proteins, and complexes, among others, by classifying them using predetermined ontologies [19]. The biological domain is explained by GO using three aspects: Molecular Function (MF), Cellular Component (CC), and Biological Process (BP). Kyoto Encyclopedia of Genes and Genomes (KEGG) integrates eighteen databases which are categorized into systems, genomic, chemical, and health information [20]. The central database in KEGG is PATHWAY, consisting of pathway maps. There are six categories of pathway maps: metabolism, genetic information processing, environmental information processing, cellular processes, organismal systems, and human diseases [20,21]. A comprehensive set of functional annotation tools is available in the Database for Annotation, Visualization, and Integrated Discovery (DAVID, https://david.ncifcrf.gov/home.jsp, accessed on 15 March 2023) to assist investigators in understanding the biological meaning behind large lists of genes. Using DAVID Gene as the foundation, these tools assemble functional annotations from multiple sources using the DAVID Knowledgebase. All DEGs were uploaded, separately analyzed, and visualized through DAVID software with a cutoff p-value < 0.05.

2.3. Protein-Protein Interaction (PPI) Network Construction

The STRING database (https://string-db.org/, accessed on 16 March 2023) is an online resource for the investigation of organism-wide protein association and interaction [22]. Each protein–protein association is accompanied by an online viewer allowing for visual inspection of the supporting evidence [22]. We used STRING version 11.5 with a cutoff confidence score > 0.4 for the construction of PPI between overlapped DEGs between uLMS and normal myometrium and uLMS and ULM.

2.4. Identification of Hub Genes

We uploaded and visualized the PPI network to Cytoscape version 3.9.1 software. We also used The Molecular Complex Detection (MCODE) [23], a Cytoscape plug-in, to contemplate the most significant nodes with degree cutoff = 2, K-Core = 2, and Node Score Cutoff = 0.2. Another Cytoscape plug-in, CytoHubba [24], was used to find the top genes with the Maximal Clique Centrality (MCC) analysis method, which has proven to be the superior method in predicting the essential proteins from the PPI network [24]. We also investigated the functional annotation and pathways enrichment of the selected genes. Finally, we constructed a gene co-expression network using GeneMANIA (https://genemania.org/, accessed on 20 March 2023) [25].

2.5. Validation of Hub Genes and Survival Analysis

Using TNMplot software (https://tnmplot.com/analysis/, accessed on 25 March 2023) [26], we compared the expression of selected hub genes between tumor and normal uterine tissue (both paired tumor and adjacent normal tissue and non-paired tumor and normal tissue platforms were used). To further verify the relationship between hub genes and clinical outcomes, we analyzed the data from the TCGA-SARC database for verification. Overall survival (OS) and disease-free interval (DFI) for the selected genes was performed using the USCS Xena browser.

2.6. TFs and miRNAs Related to Hub Genes

In order to map hub genes to their corresponding transcription factors (TFs) and miRNAs, we used NetworkAnalyst 3.0 (https://www.networkanalyst.ca/, accessed on 27 March 2023), a web-based visualization tool that facilitates the search for TF-gene and miRNA-gene interactions in gene regulatory networks [27]. miRNAs with a degree cutoff value = 1.0 were found for each of the hub genes.
We constructed TF-gene and miRNA-gene networks with Cytoscape. Furthermore, we obtained a table of the most significant TFs and miRNAs correlated with hub genes, ranked by an adjusted p-value, from miRTarBase (https://mirtarbase.cuhk.edu.cn/~miRTarBase/miRTarBase_2022/php/index.php, accessed on 30 March 2023) and TRRUST (https://www.grnpedia.org/trrust/, accessed on 30 March 2023), using Enrichr (https://maayanlab.cloud/Enrichr/, accessed on 30 March 2023) [28].

2.7. Drug–Hub Gene Interaction

We uploaded the hub genes to NetworkAnalyst 3.0 (https://www.networkanalyst.ca/, accessed on 10 April 2023) to obtain a drug-hub gene interaction network.

3. Results

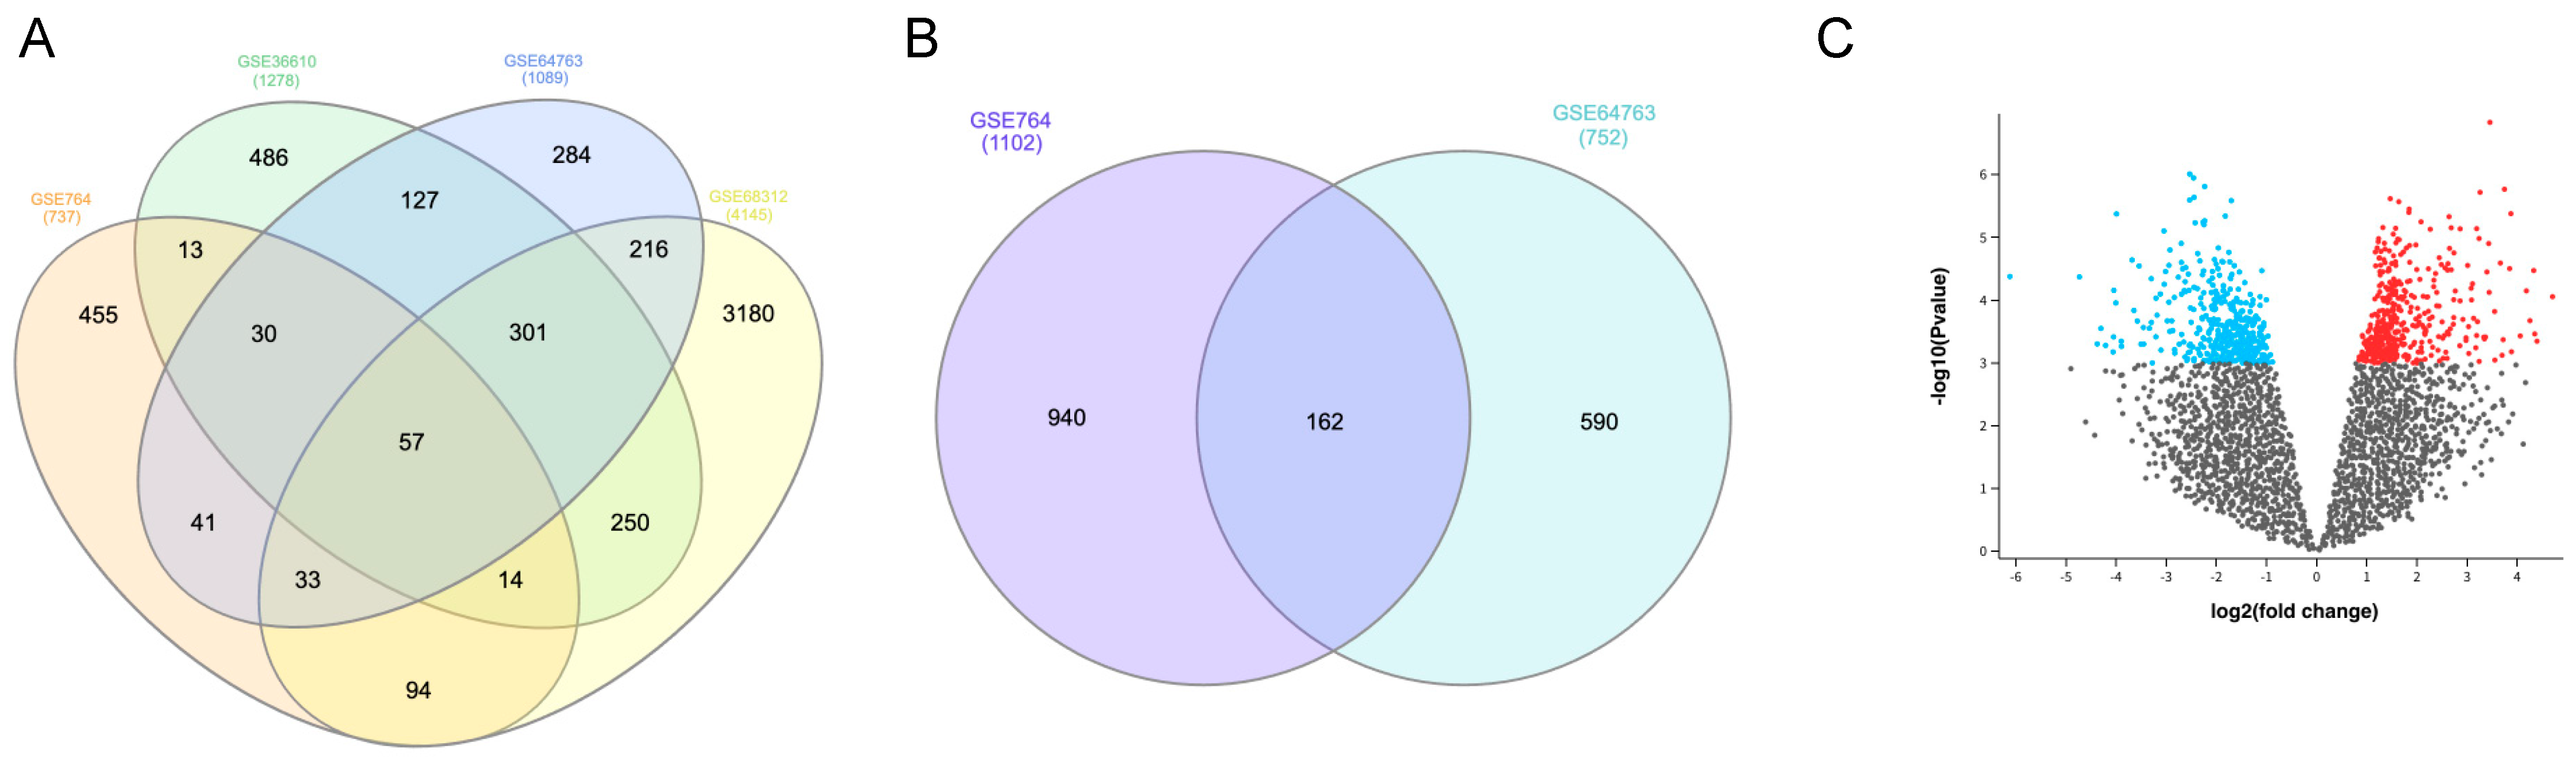
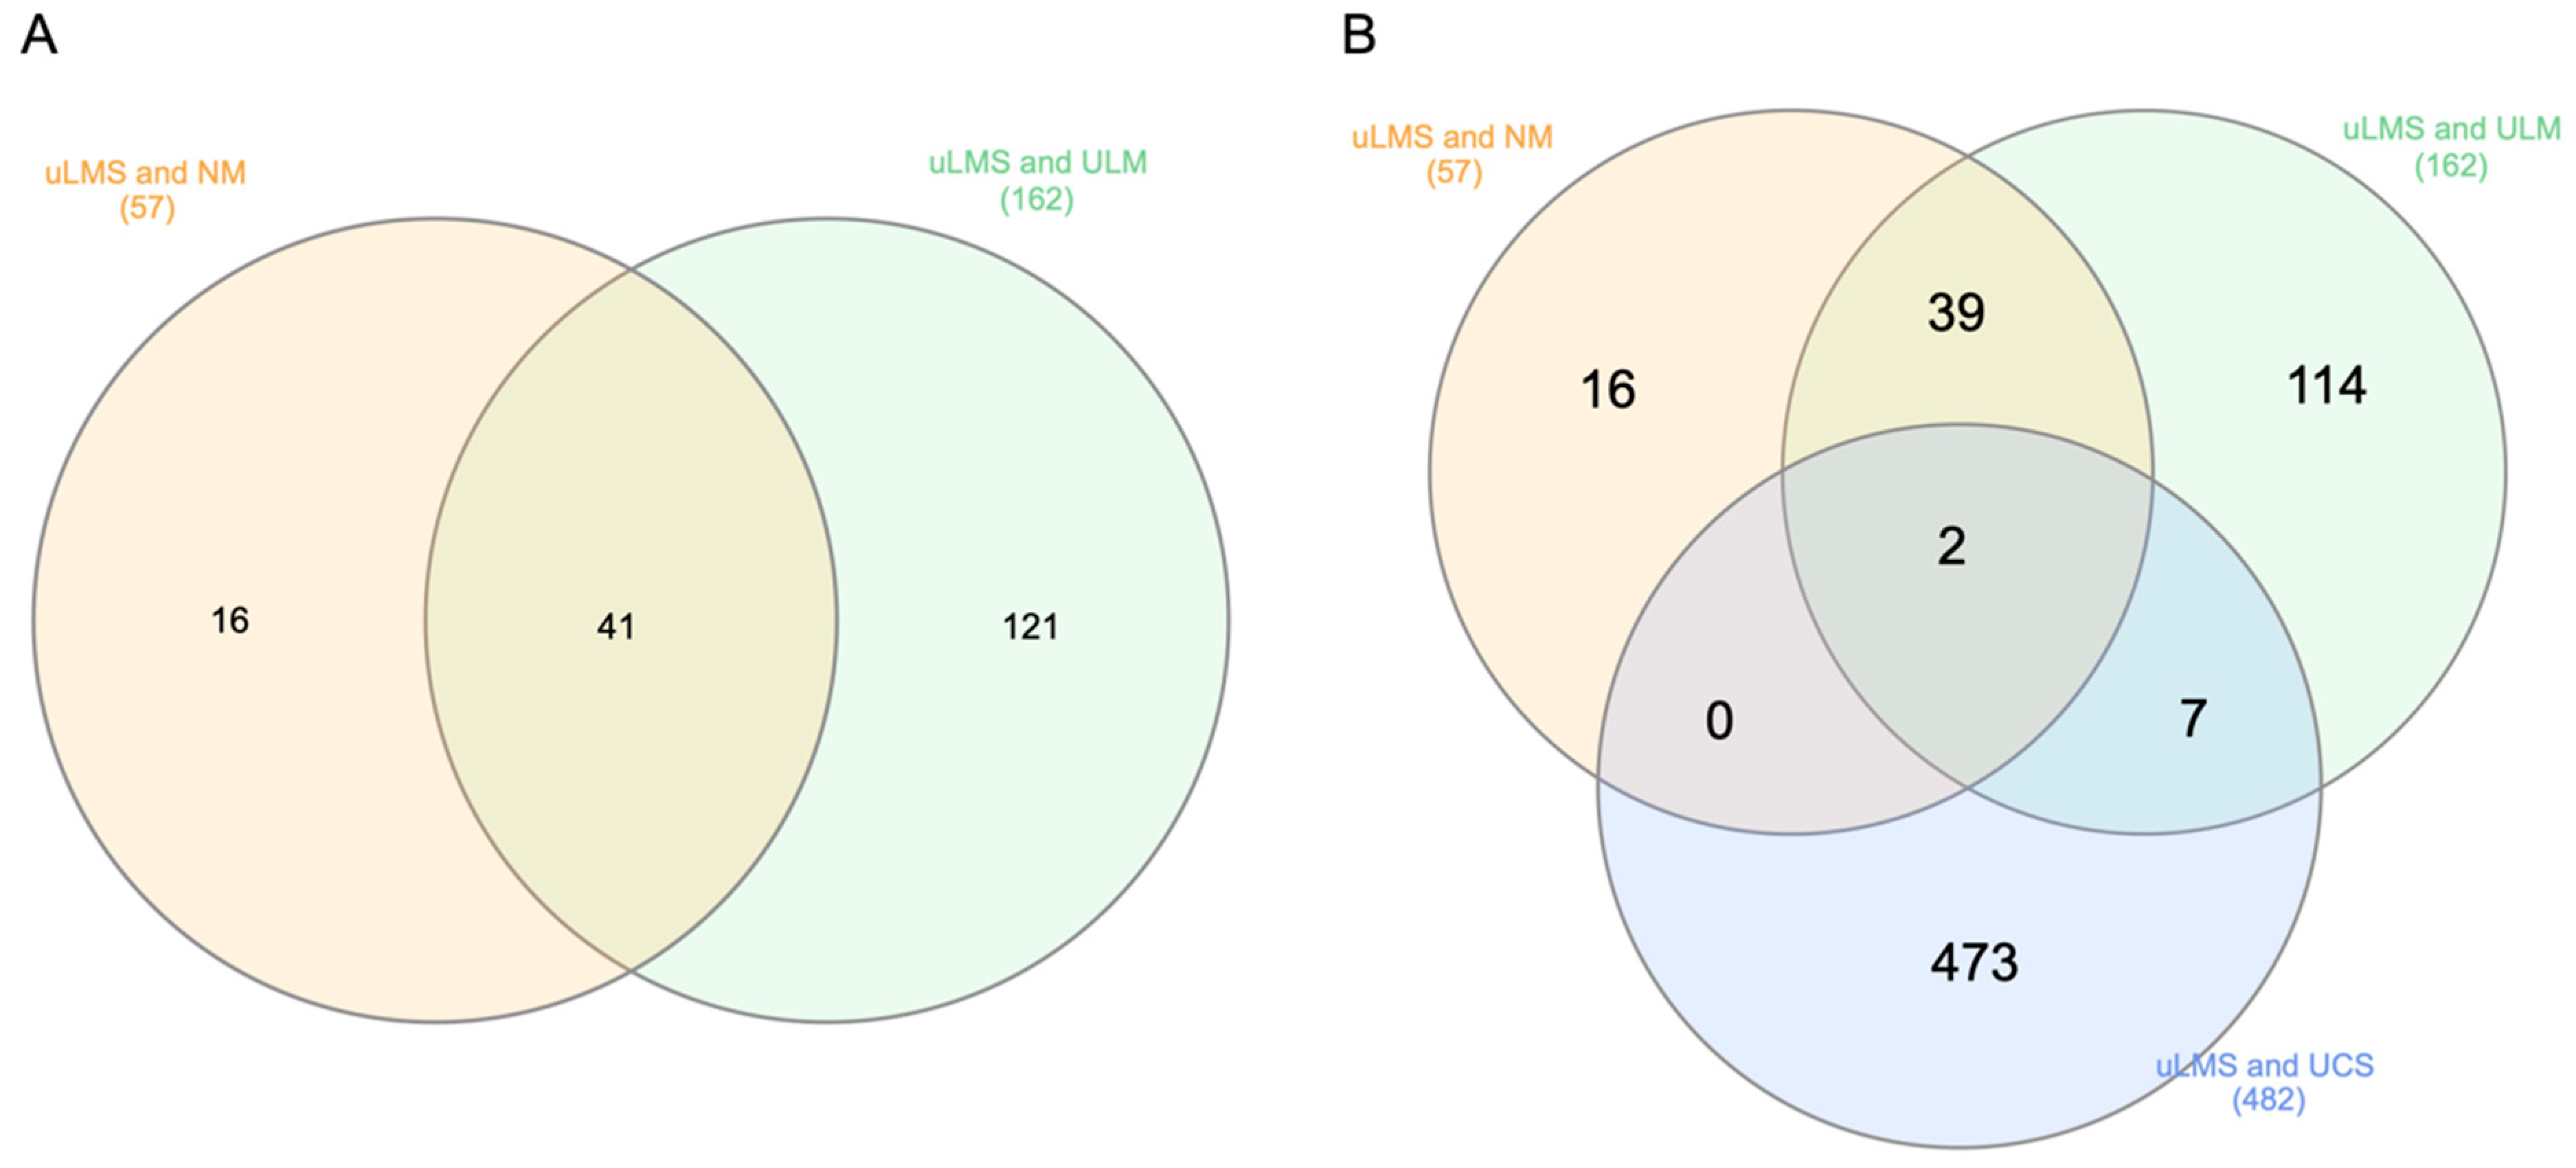
3.1. Identification of DEGs

The analysis revealed 737 (266 upregulated and 471 downregulated), 1278 (504 upregulated and 774 downregulated), 1089 (392 upregulated and 697 downregulated), and 4145 (1986 upregulated and 2159 downregulated) DEGs between uLMS and normal myometrium, from GSE764, GSE36610, GSE64763, and GSE68312, respectively.
Furthermore, we found 57 overlapping DEGs (Figure 1A) from the four datasets (14 upregulated and 43 downregulated). There were 1102 (396 upregulated and 706 downregulated) and 752 (258 upregulated and 494 downregulated) DEGs between uLMS and ULM from GSE764 and GSE64763, respectively.
A total of 162 overlapped DEGs (Figure 1B) from these two databases were identified (32 upregulated and 130 downregulated). A volcano plot in Figure 1C shows 483 (290 upregulated and 193 downregulated) DEGs between uLMS and UCS from the GSE32507 dataset.
Figure 2A shows the intersected DEGs between uLMS and normal myometrium and uLMS and ULM. Two overlapping DEGs between all three cohorts are shown in Figure 2B. The only two overlapped DEGs between the three cohorts were ATRX and PTGER3, both downregulated.

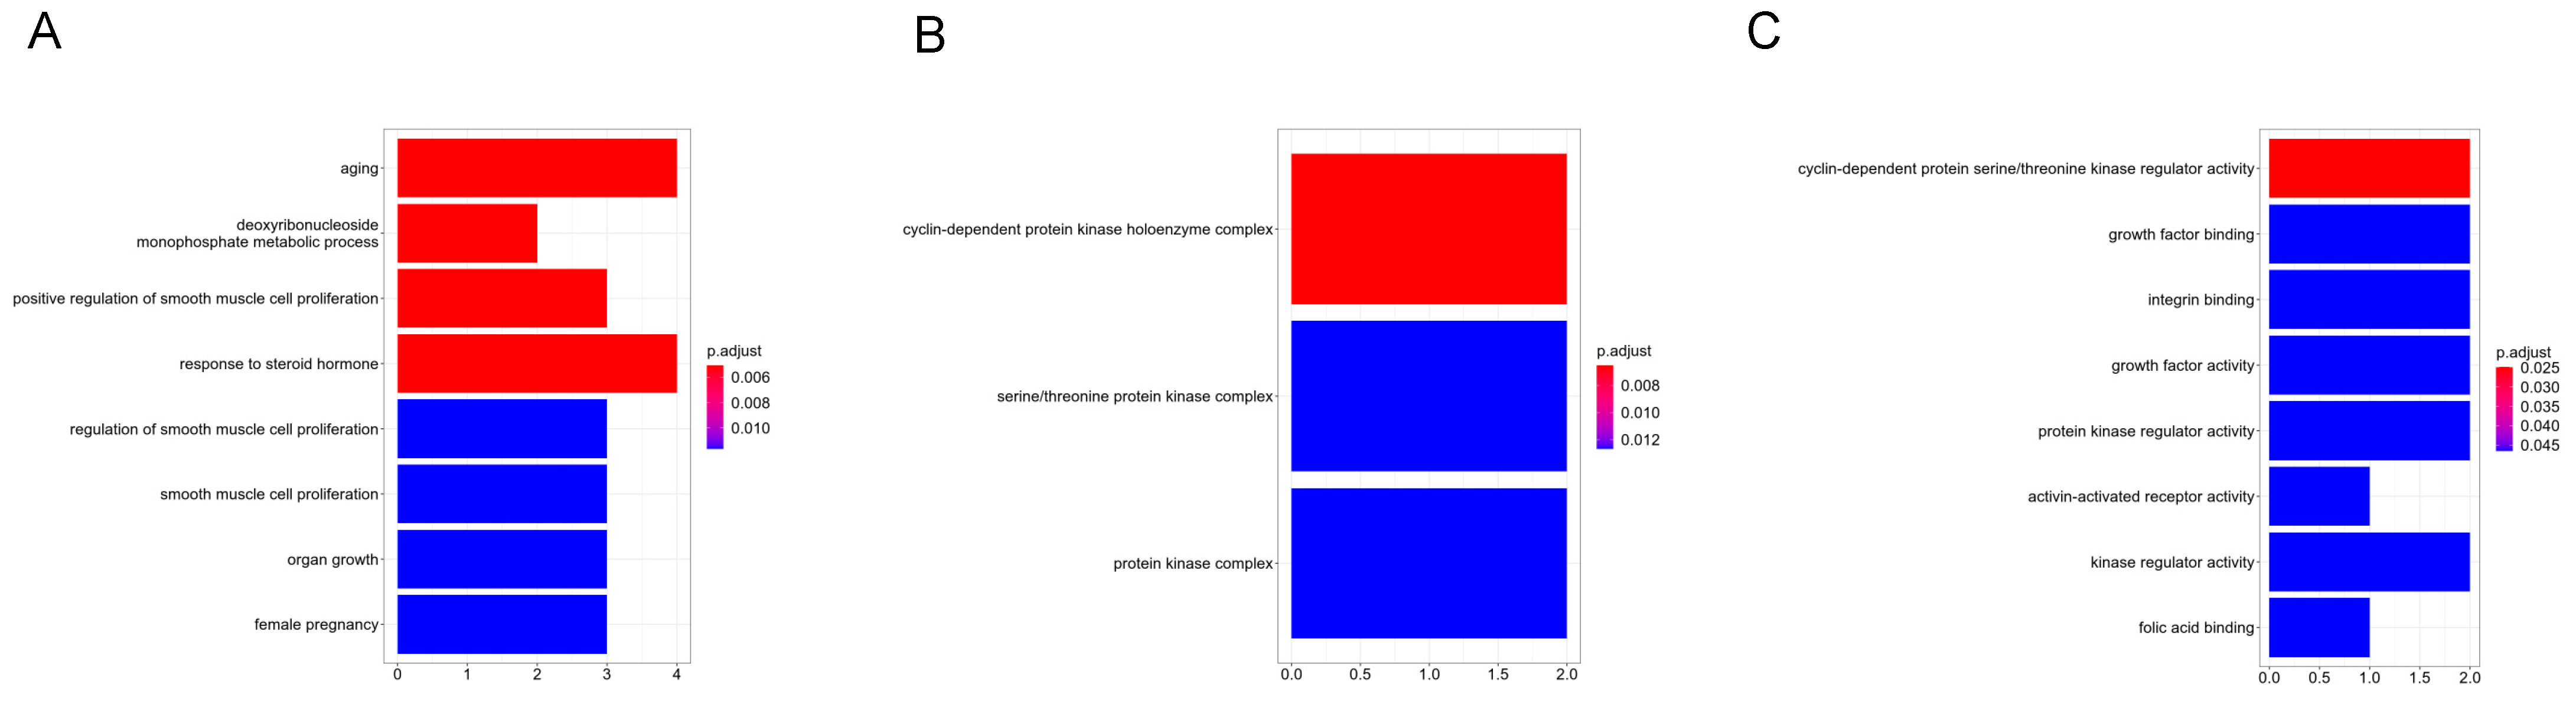
3.2. GO and KEGG Pathway Enrichment Analysis

The most enriched GO terms and KEGG pathways for DEGs between uLMS and normal myometrium are presented in Table 2.
The most enriched GO terms and KEGG pathways for DEGs between uLMS and ULM are presented in Table 3.
Table 4 presents the most enriched GO terms and KEGG pathways for DEGs between uLMS and UCS.
The most enriched GO terms and KEGG pathways of the upregulated and downregulated overlapped DEGs between uLMS and normal myometrium and uLMS and ULM are presented in Table 5.

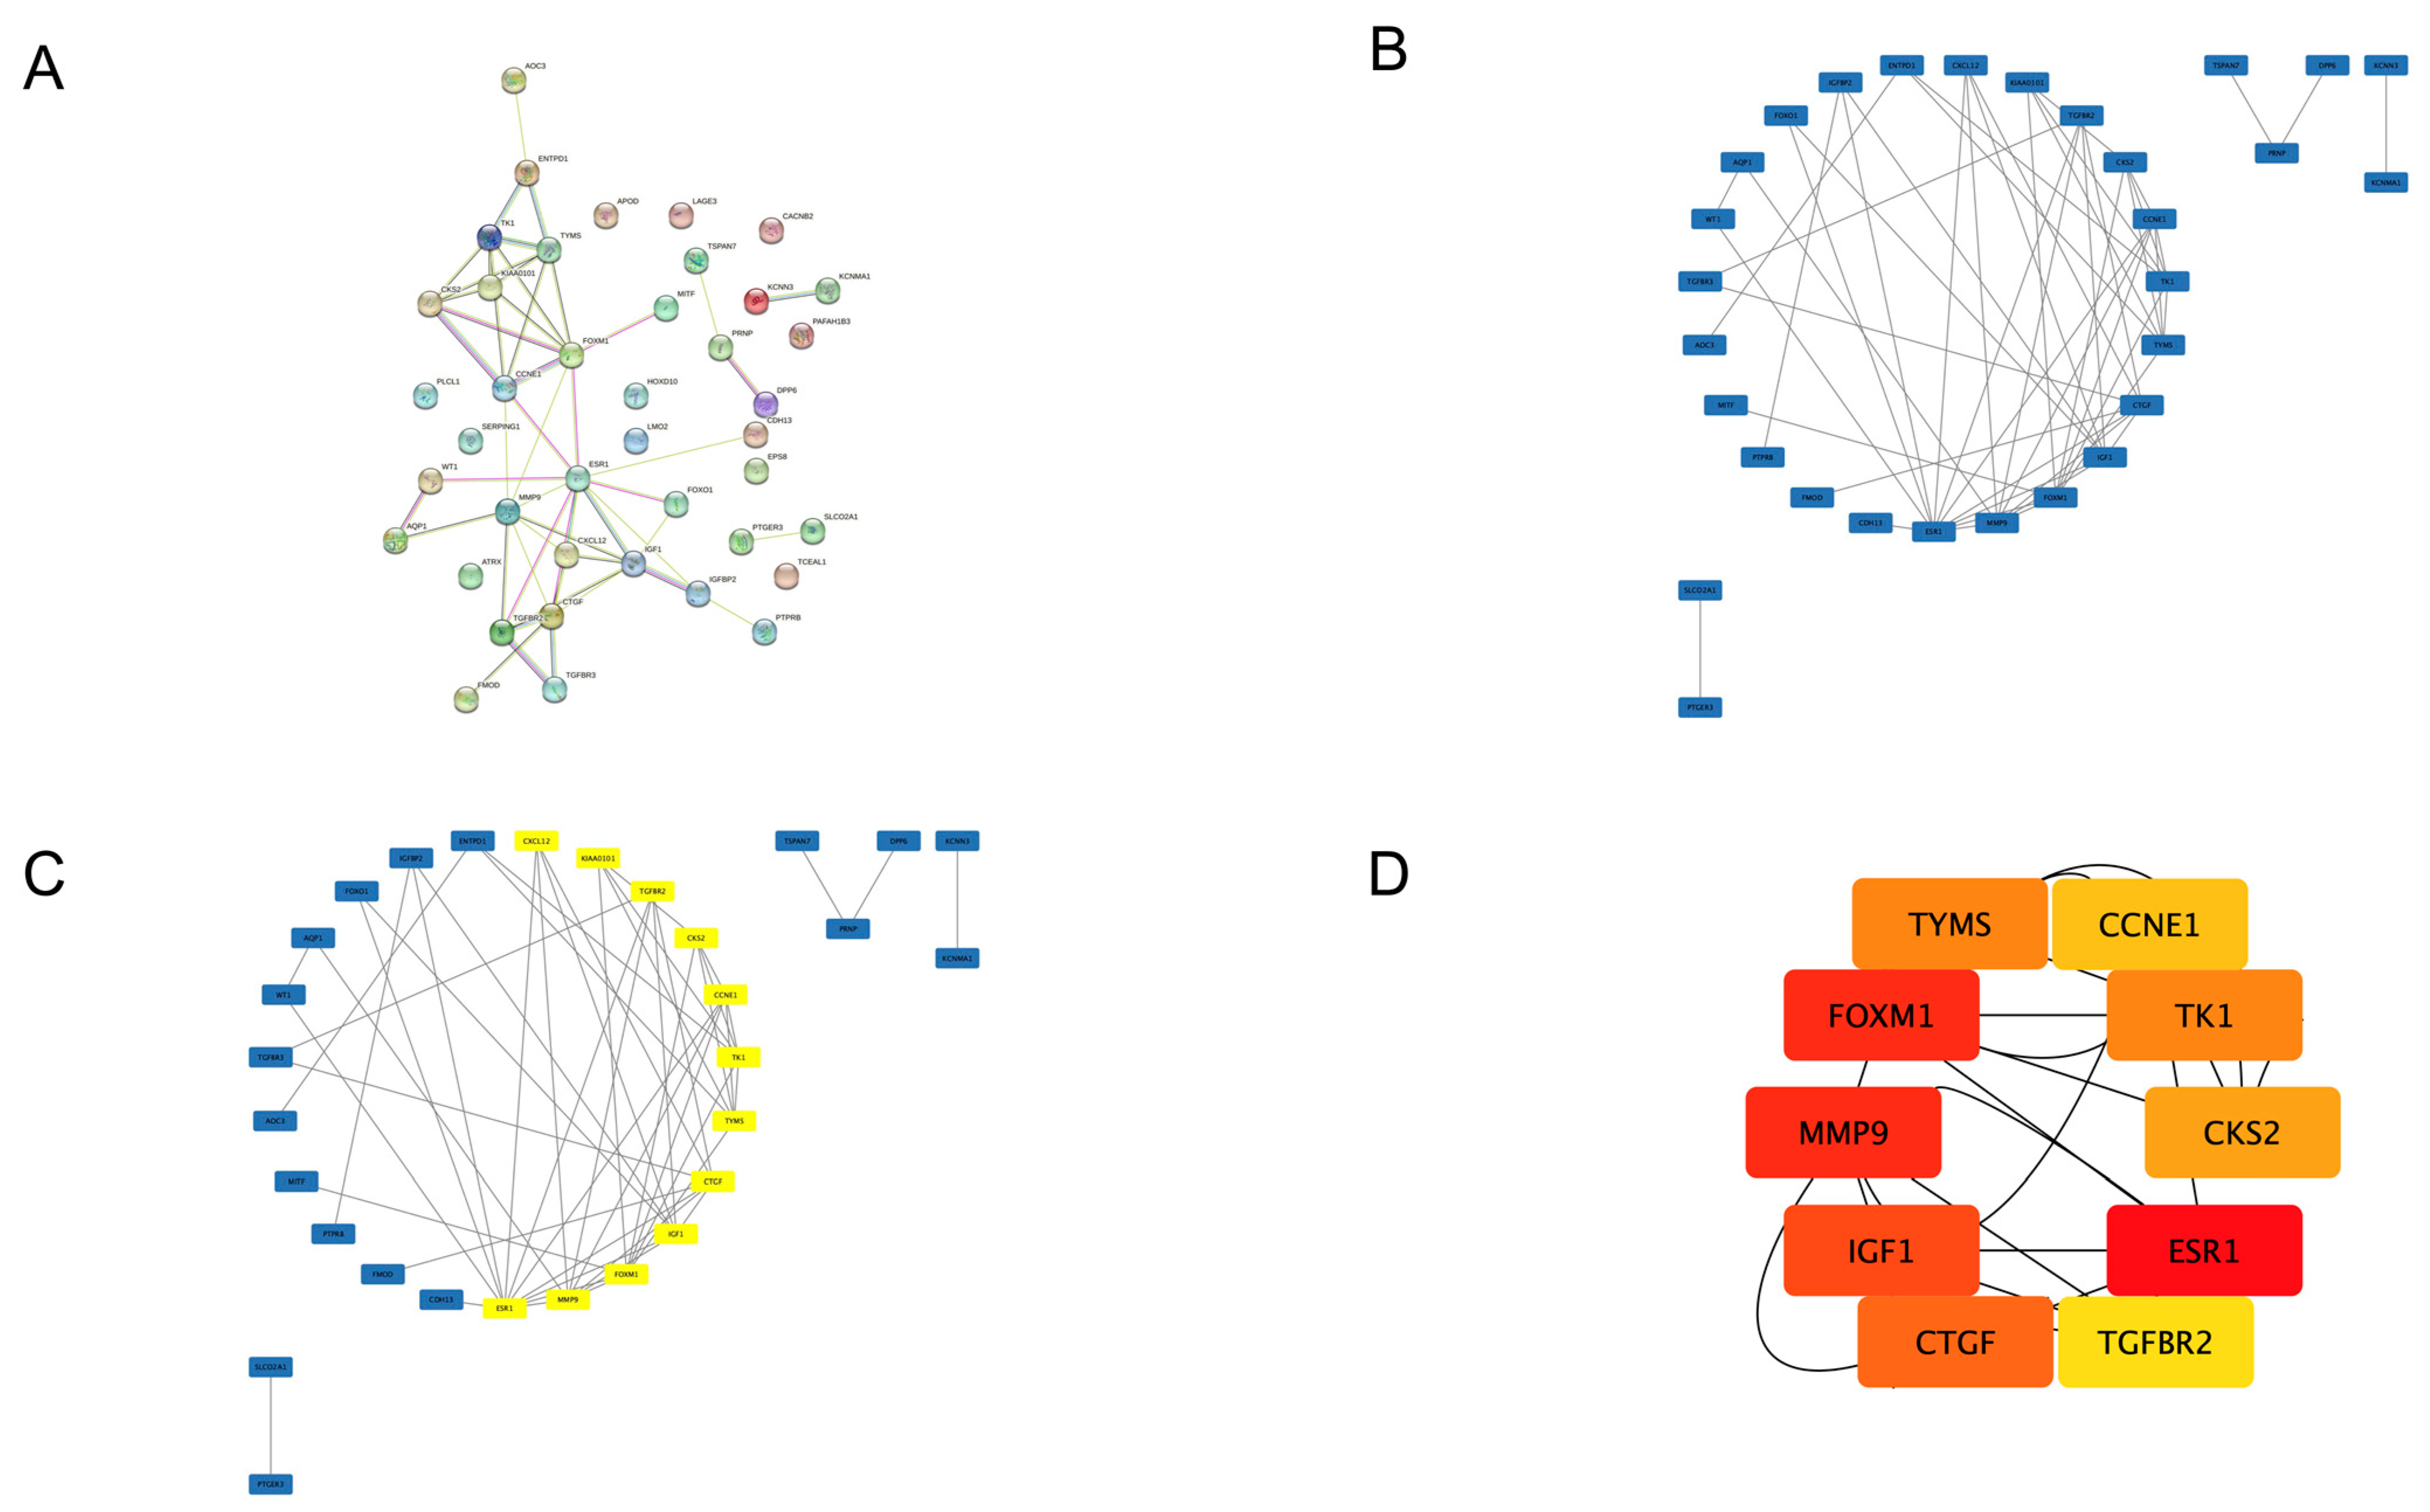
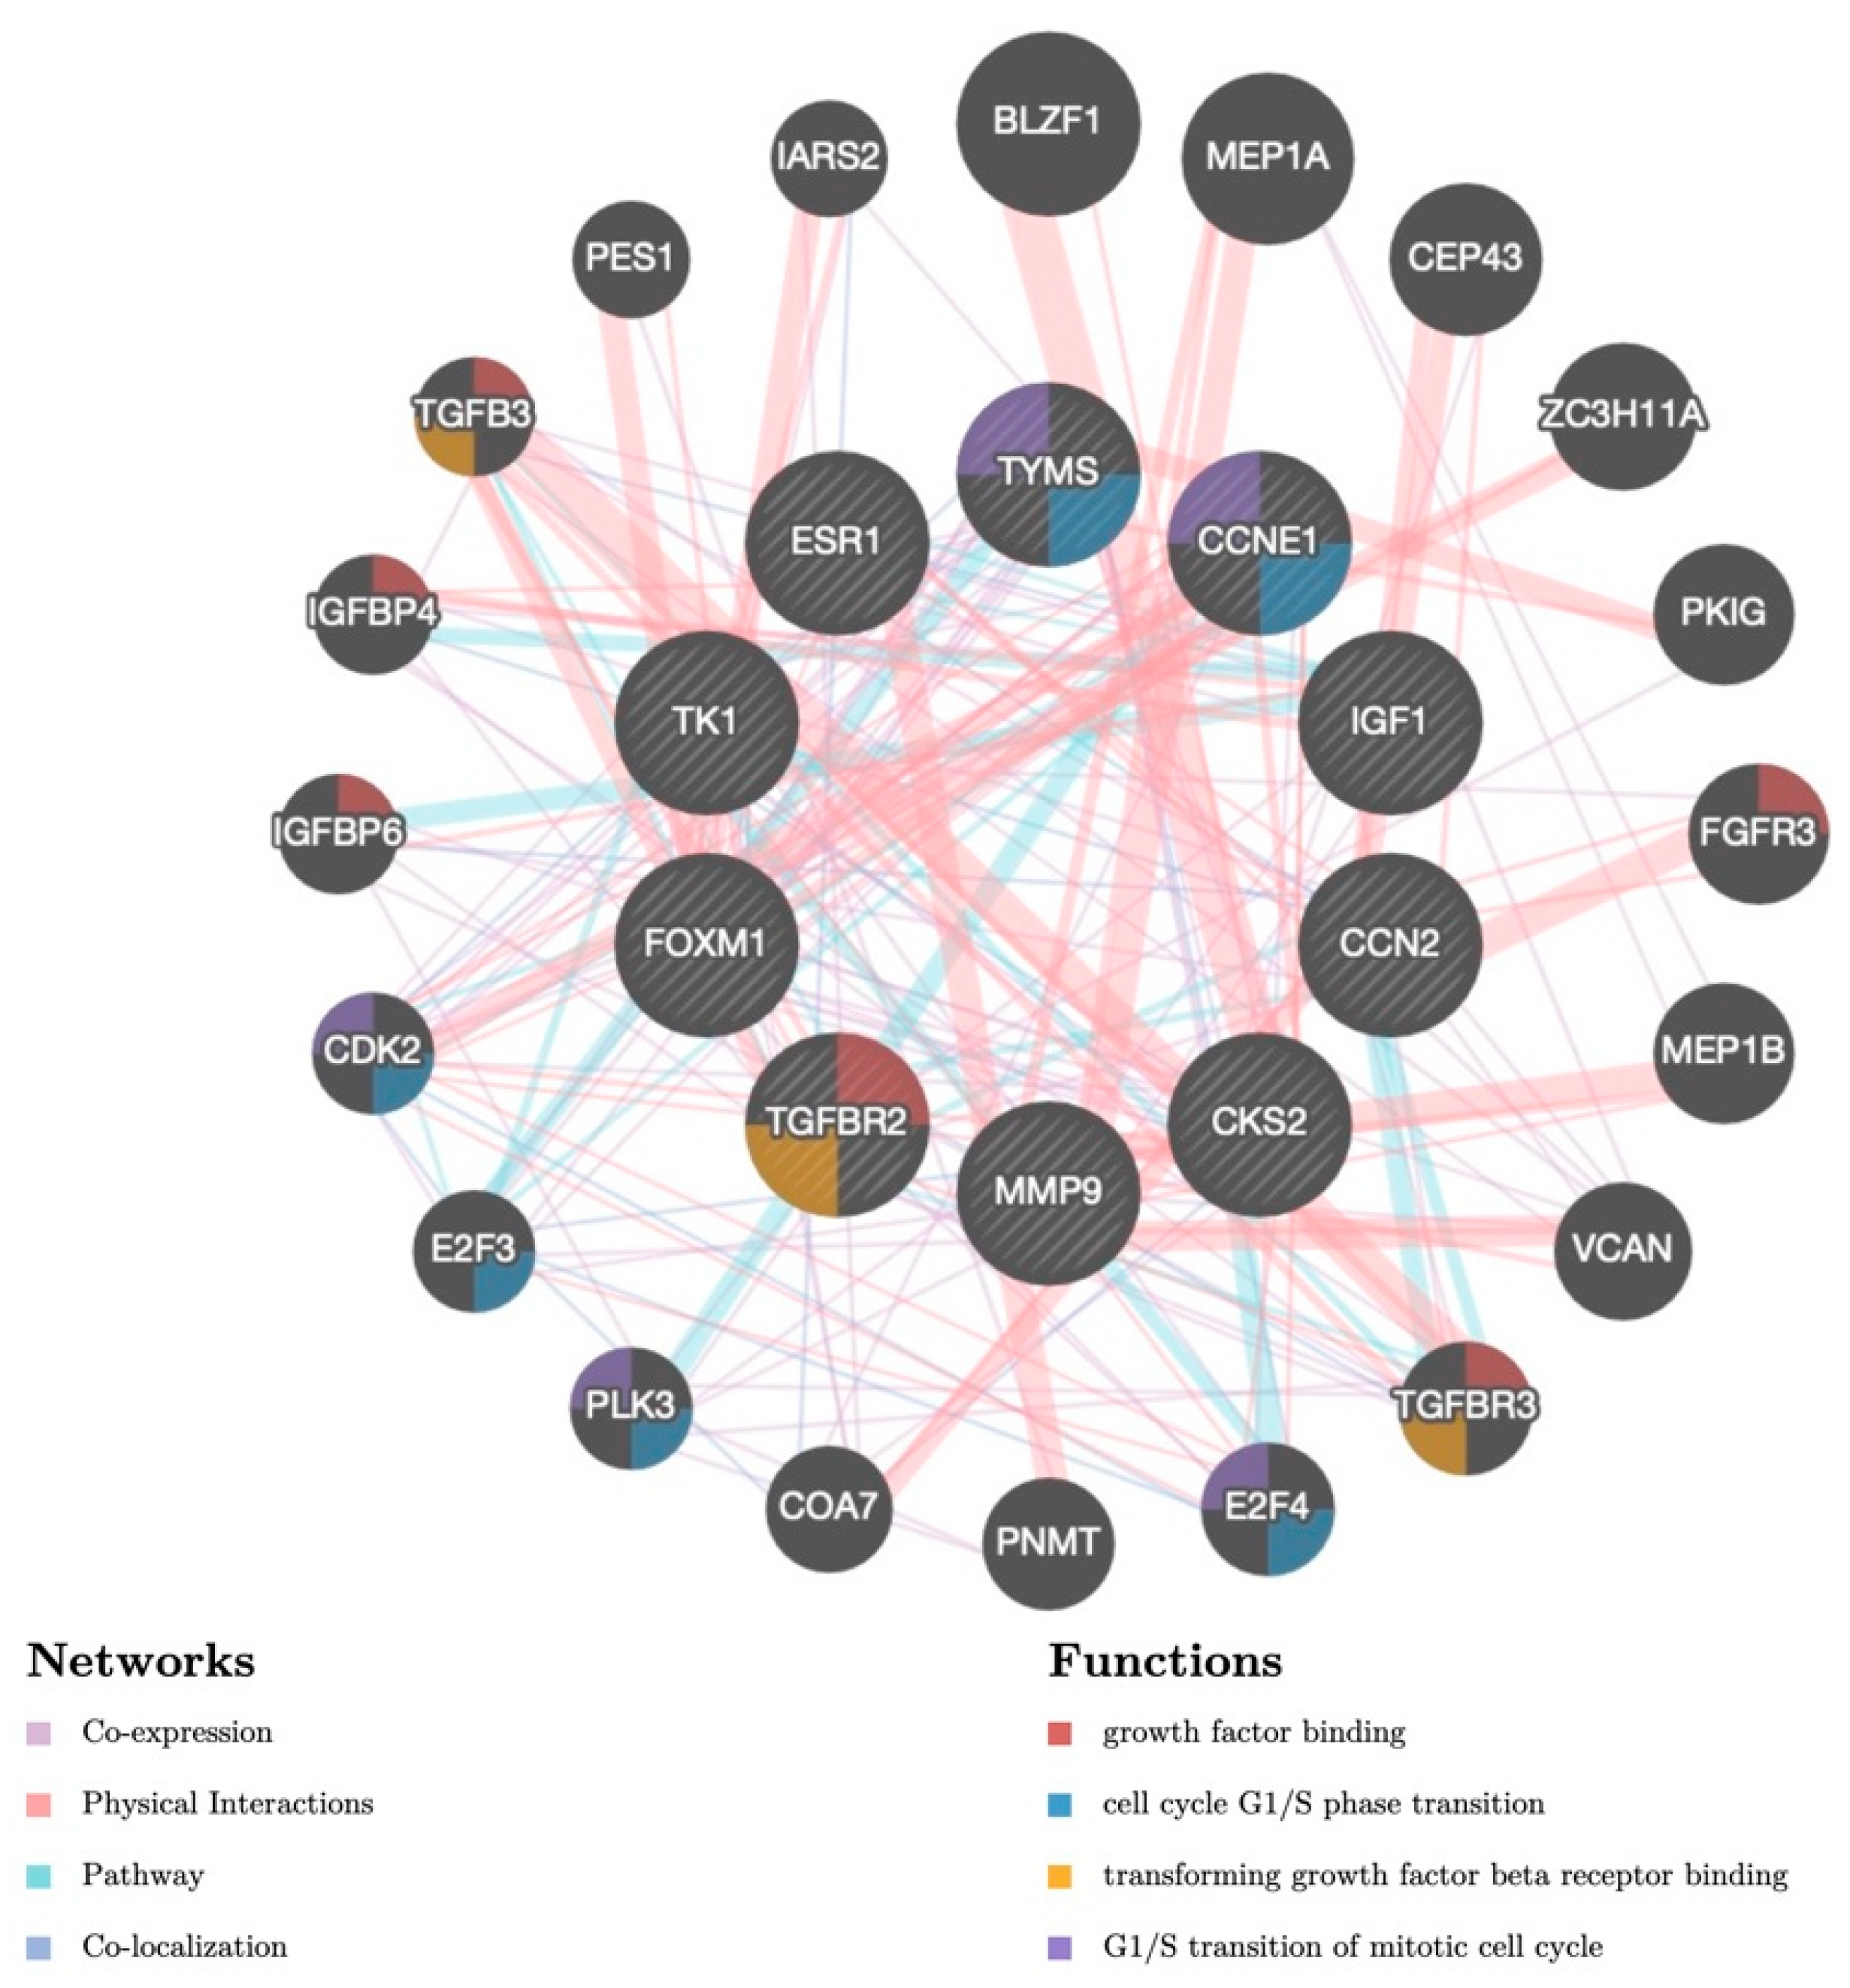
3.3. PPI Network and Hub Gene Selection

We uploaded overlapping DEGs between uLMS and normal myometrium and uLMS and ULM into the STRING database (Figure 3A). Then, the STRING data was uploaded to Cytoscape, where a PPI network with 30 nodes and 52 edges was constructed (Figure 3B). One module fulfilled the MCODE cutoff criteria (Figure 3C). This module consisted of: TK1, TYMS, KIAA0101, CKS2, FOXM1, CCNE1, ESR1, MMP9, CXCL12, TGFBR2, CTGF, and IGF1. Finally, the Cytohubba MCC module ranked the top 10 genes, which were classified as hub genes (Figure 3D, Table 6).
Among hub genes, there were six major upregulated (TYMS, FOXM1, MMP9, CCNE1, CKS2, and TK1) and four downregulated genes (ESR1, CTGF, IGF1, and TGFBR2). Figure 4 presents hub genes’ GO BP (Figure 4A), CC (Figure 4B), and MF (Figure 4C) annotations. Hub genes were enriched only in the “pathways in cancer” KEGG pathway.
The present study utilized the GeneMANIA database to extract information regarding the interaction relationship and potential regulatory mechanism of the hub genes. Subsequently, a gene interaction network was constructed based on the obtained data. The network consists of 30 genes, including 10 hub genes and another 20 genes extracted from the GeneMANIA (Figure 5). The results displayed that the hub genes were co-expressed interactively with BLZF1, MEP1A, CEP43, ZC3H11A, PKIG, FGFR3, MEP1B, VCAN, TGFBR3, E2F4, PNMT, COA7, PLK3, E2F3, CDK2, IGFBP6, IGFBP4, TGFB3, PES1, and IARS2. The functions of the hub genes were mainly associated with growth factor binding, cell cycle G1/S phase transitions, transforming growth factor beta receptor (TGFBR) binding, and G1/S transition of the mitotic cell cycle (Figure 5).

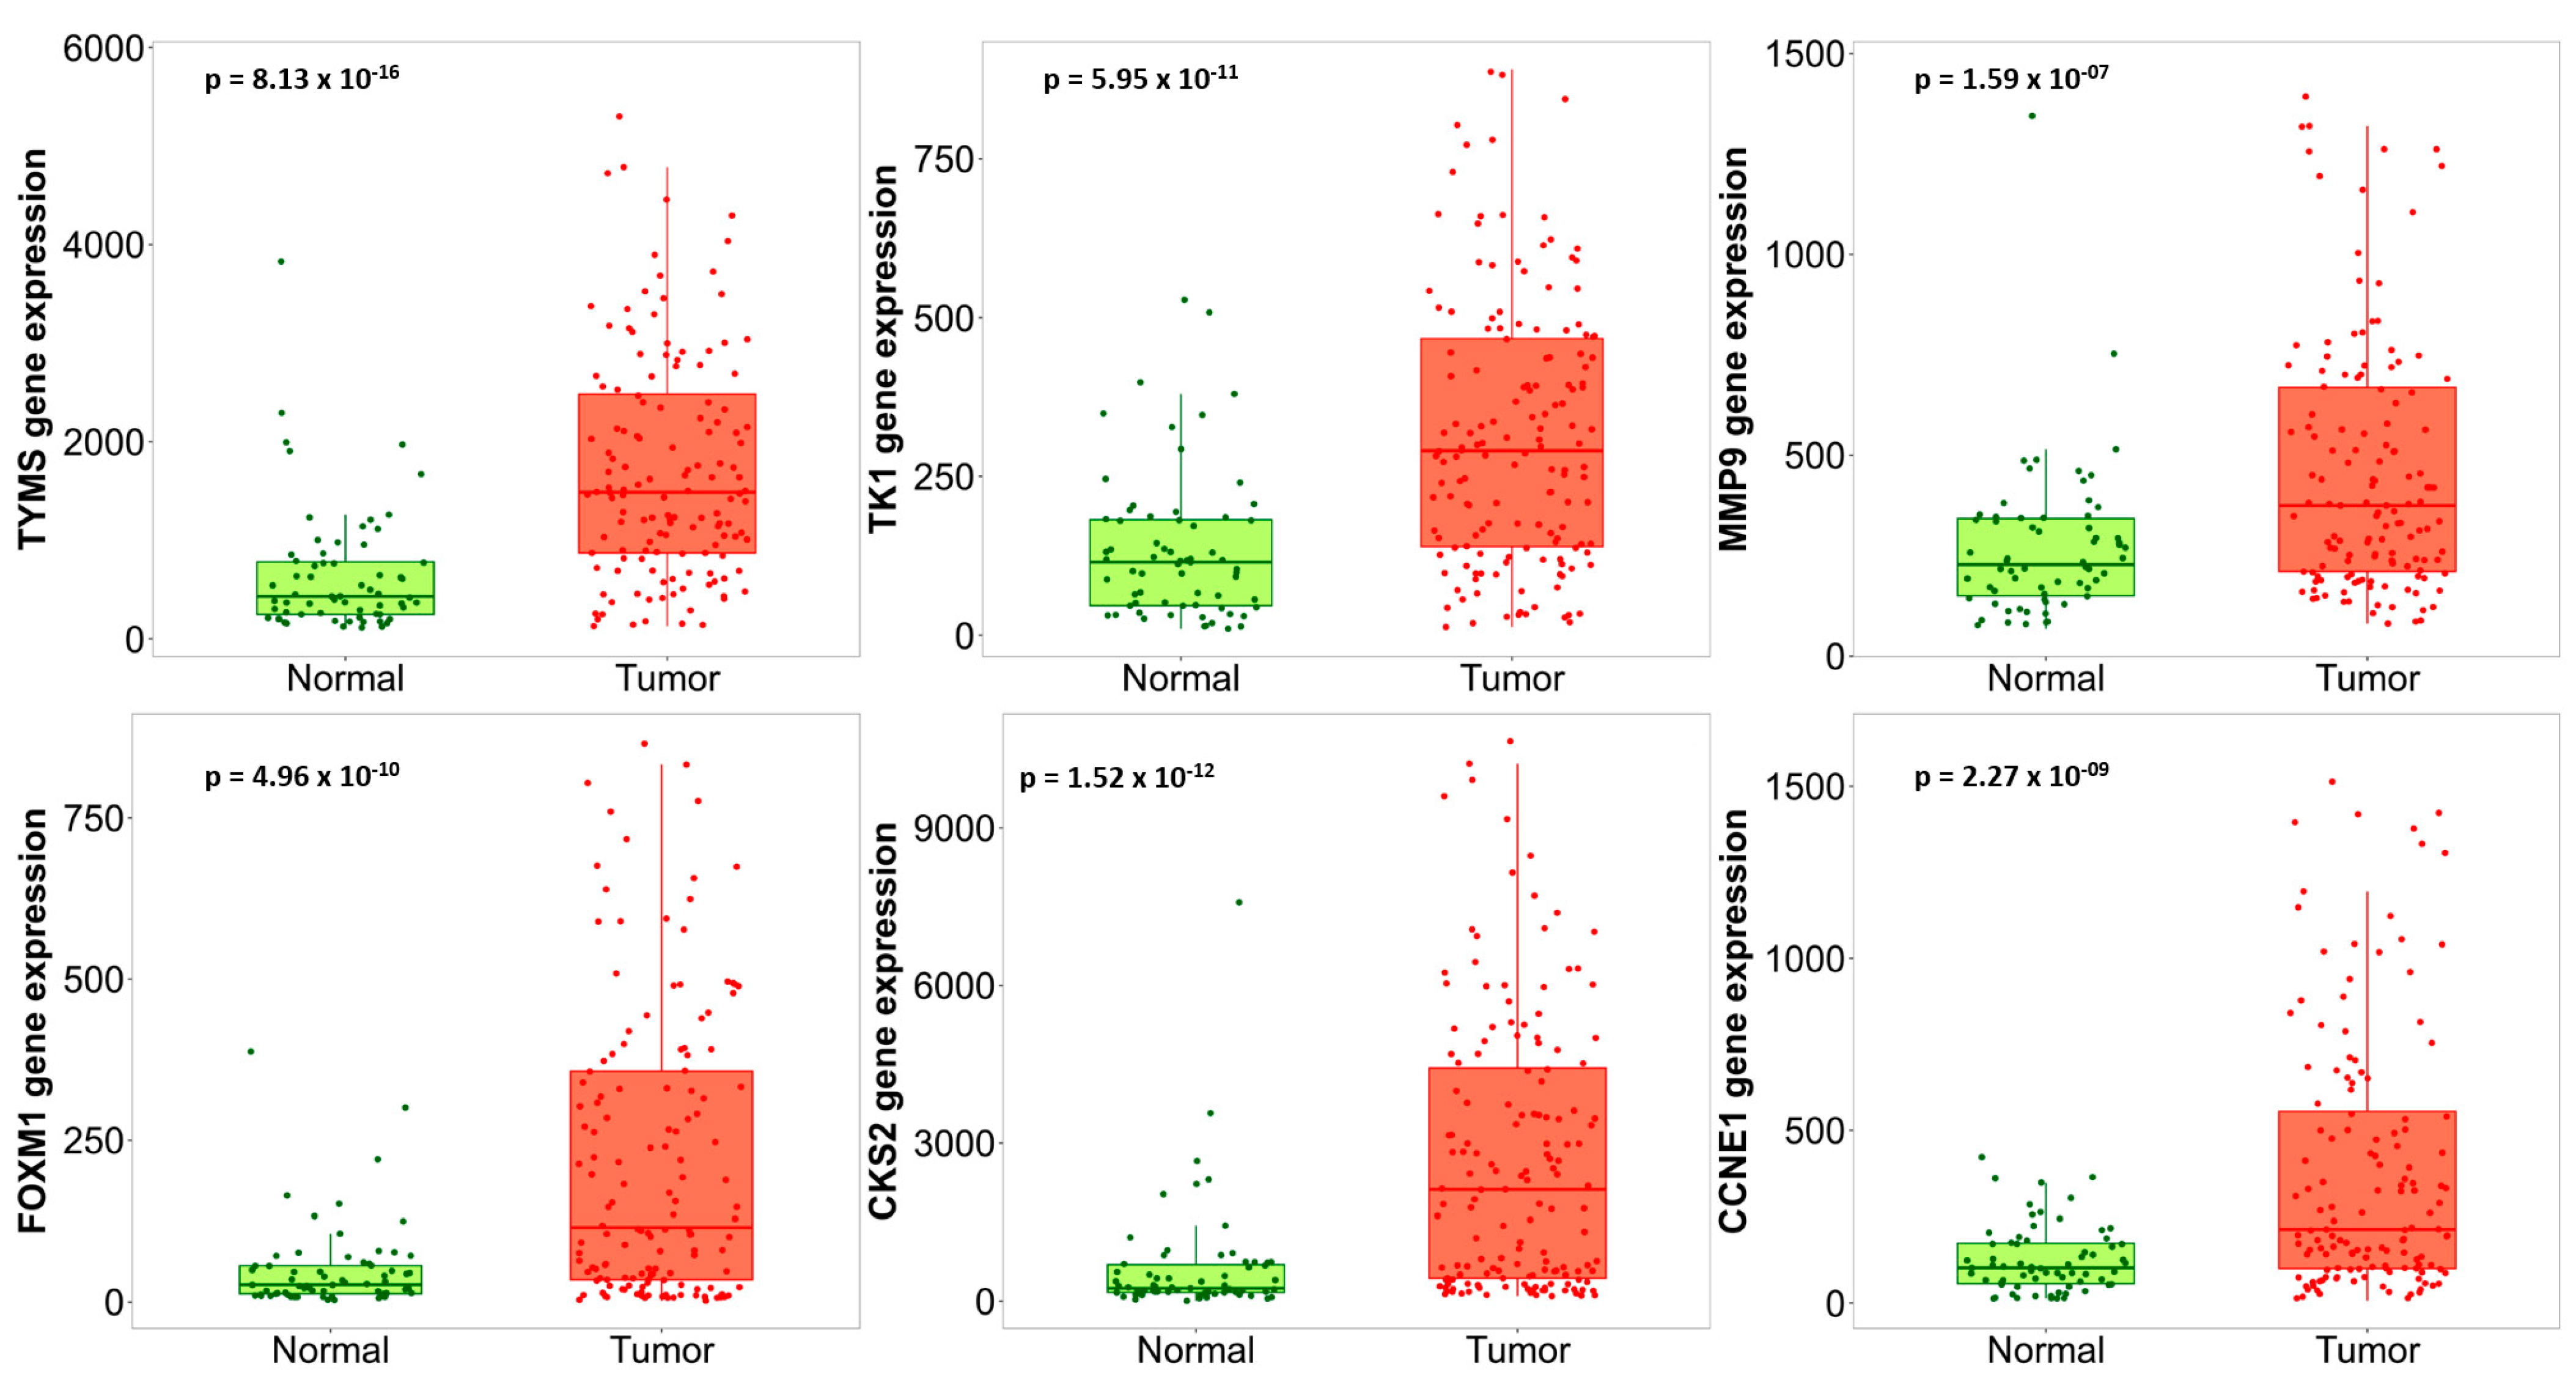
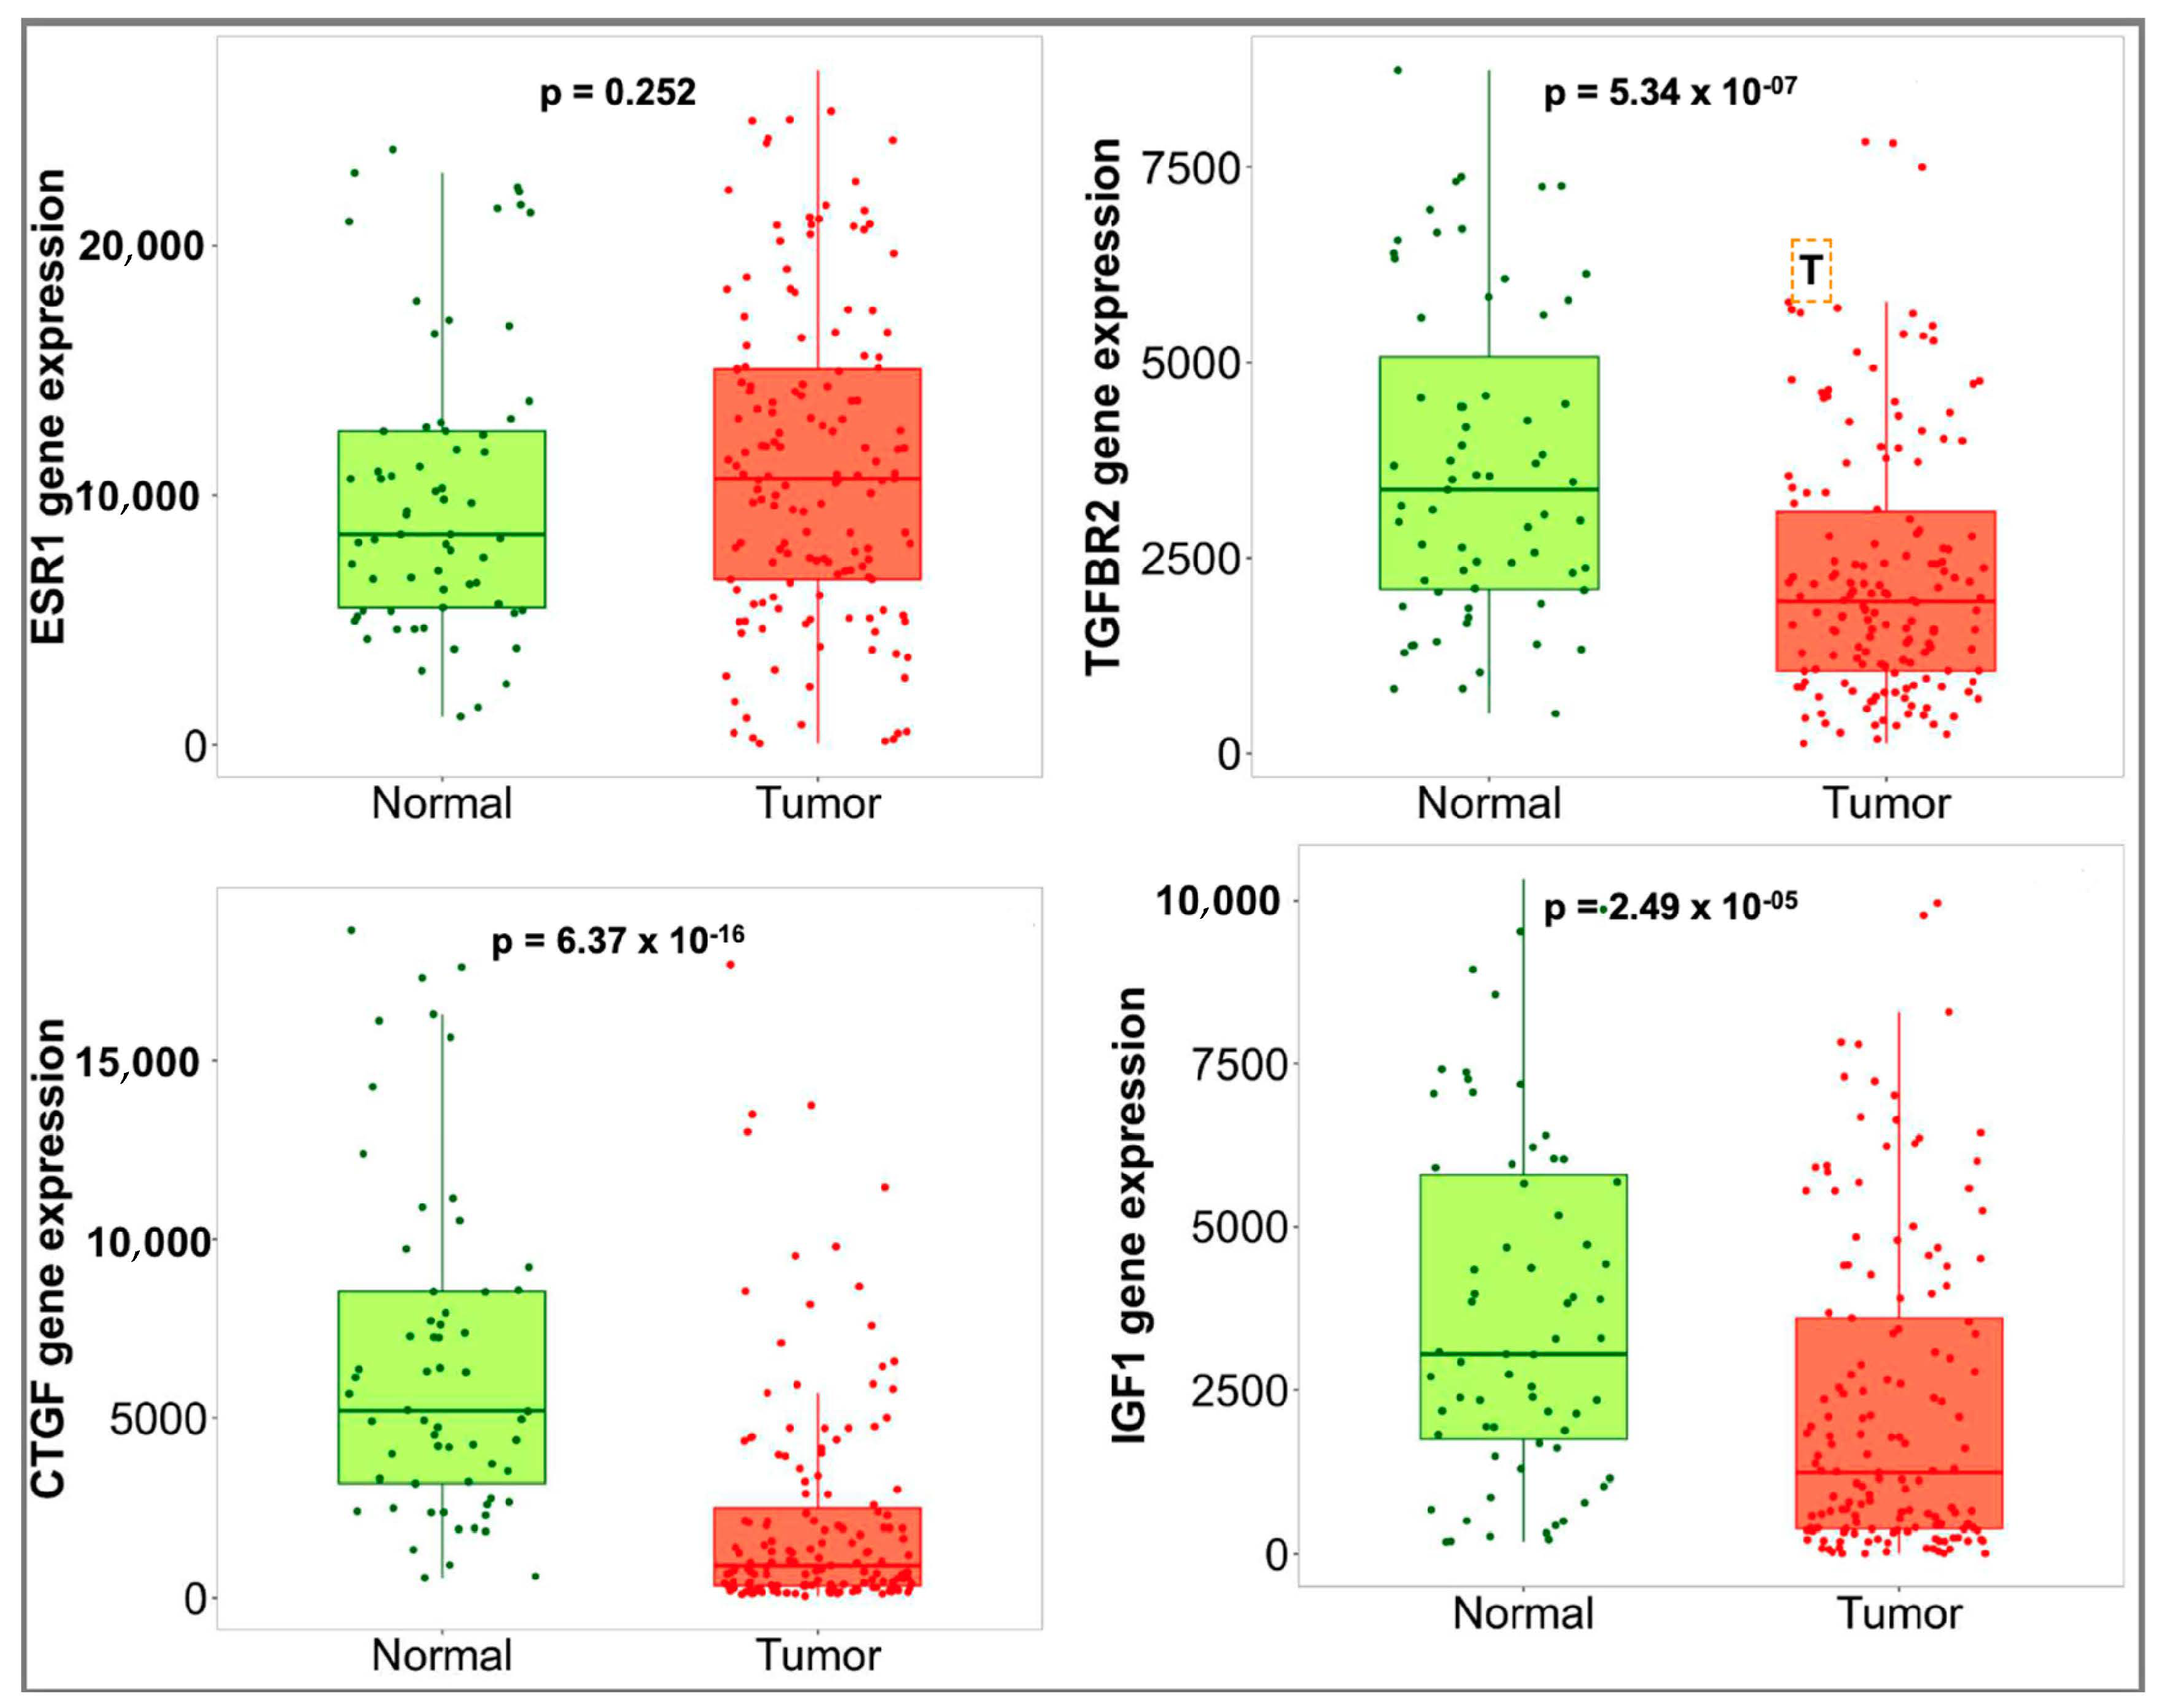
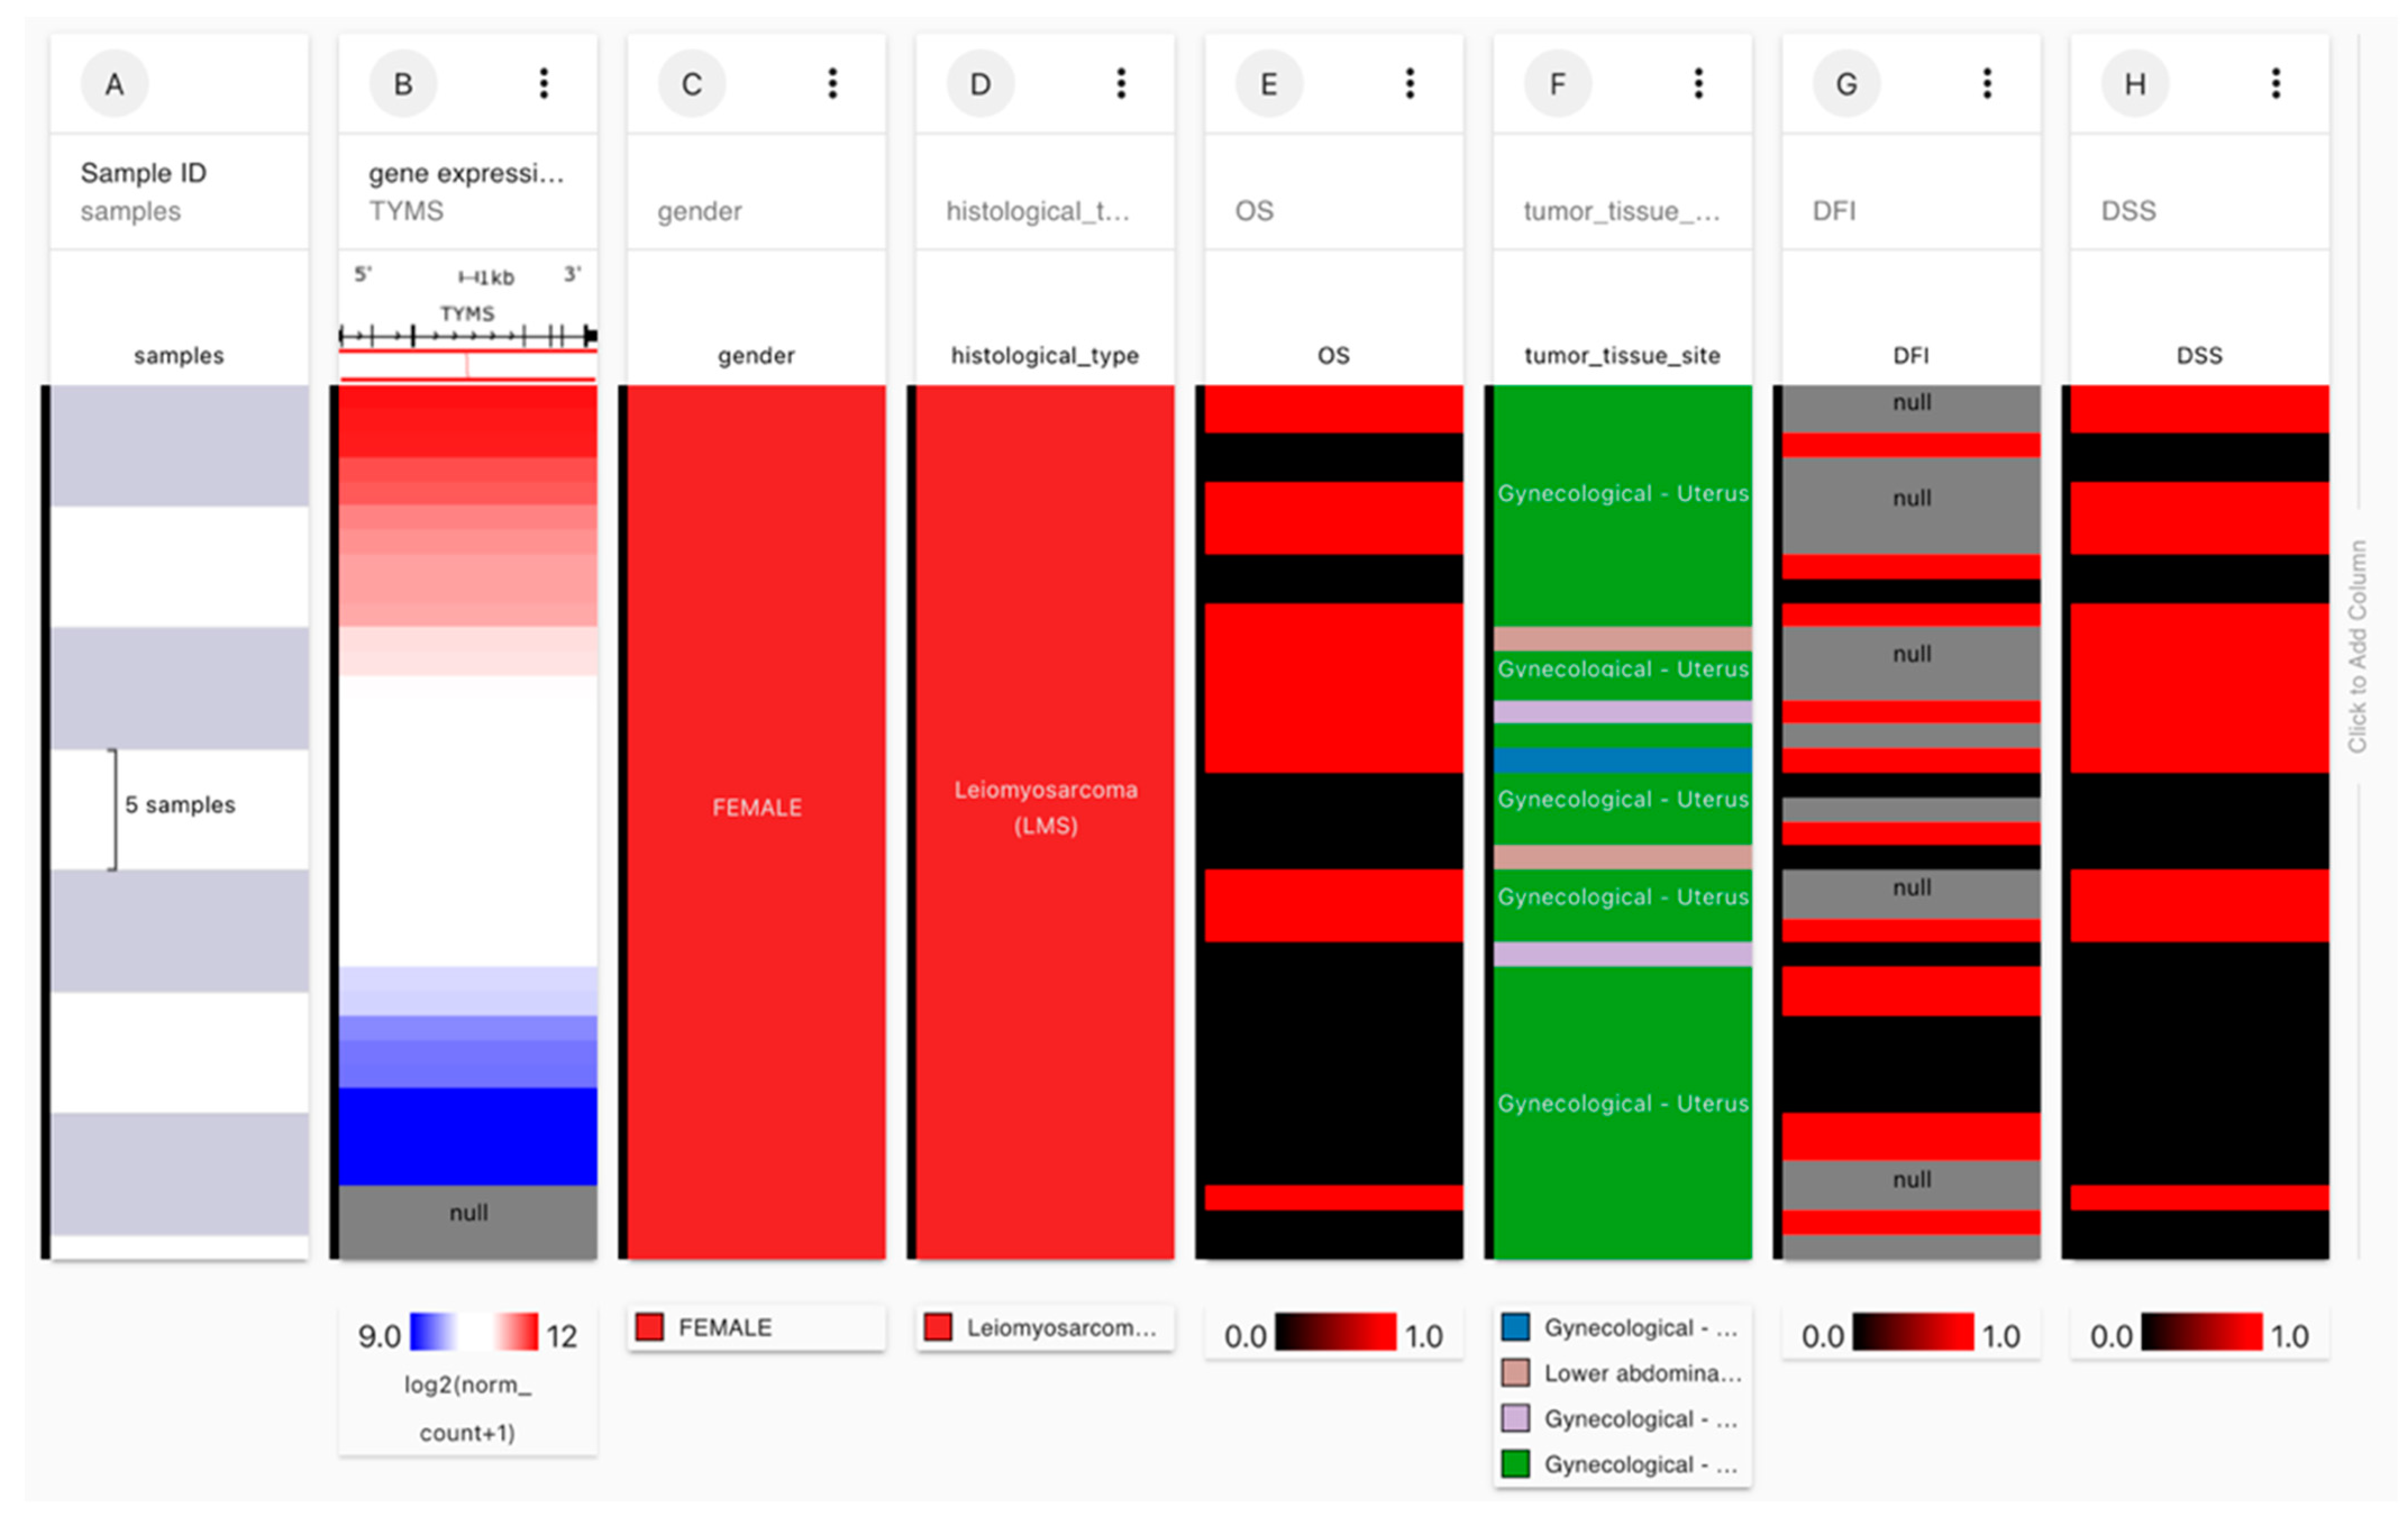
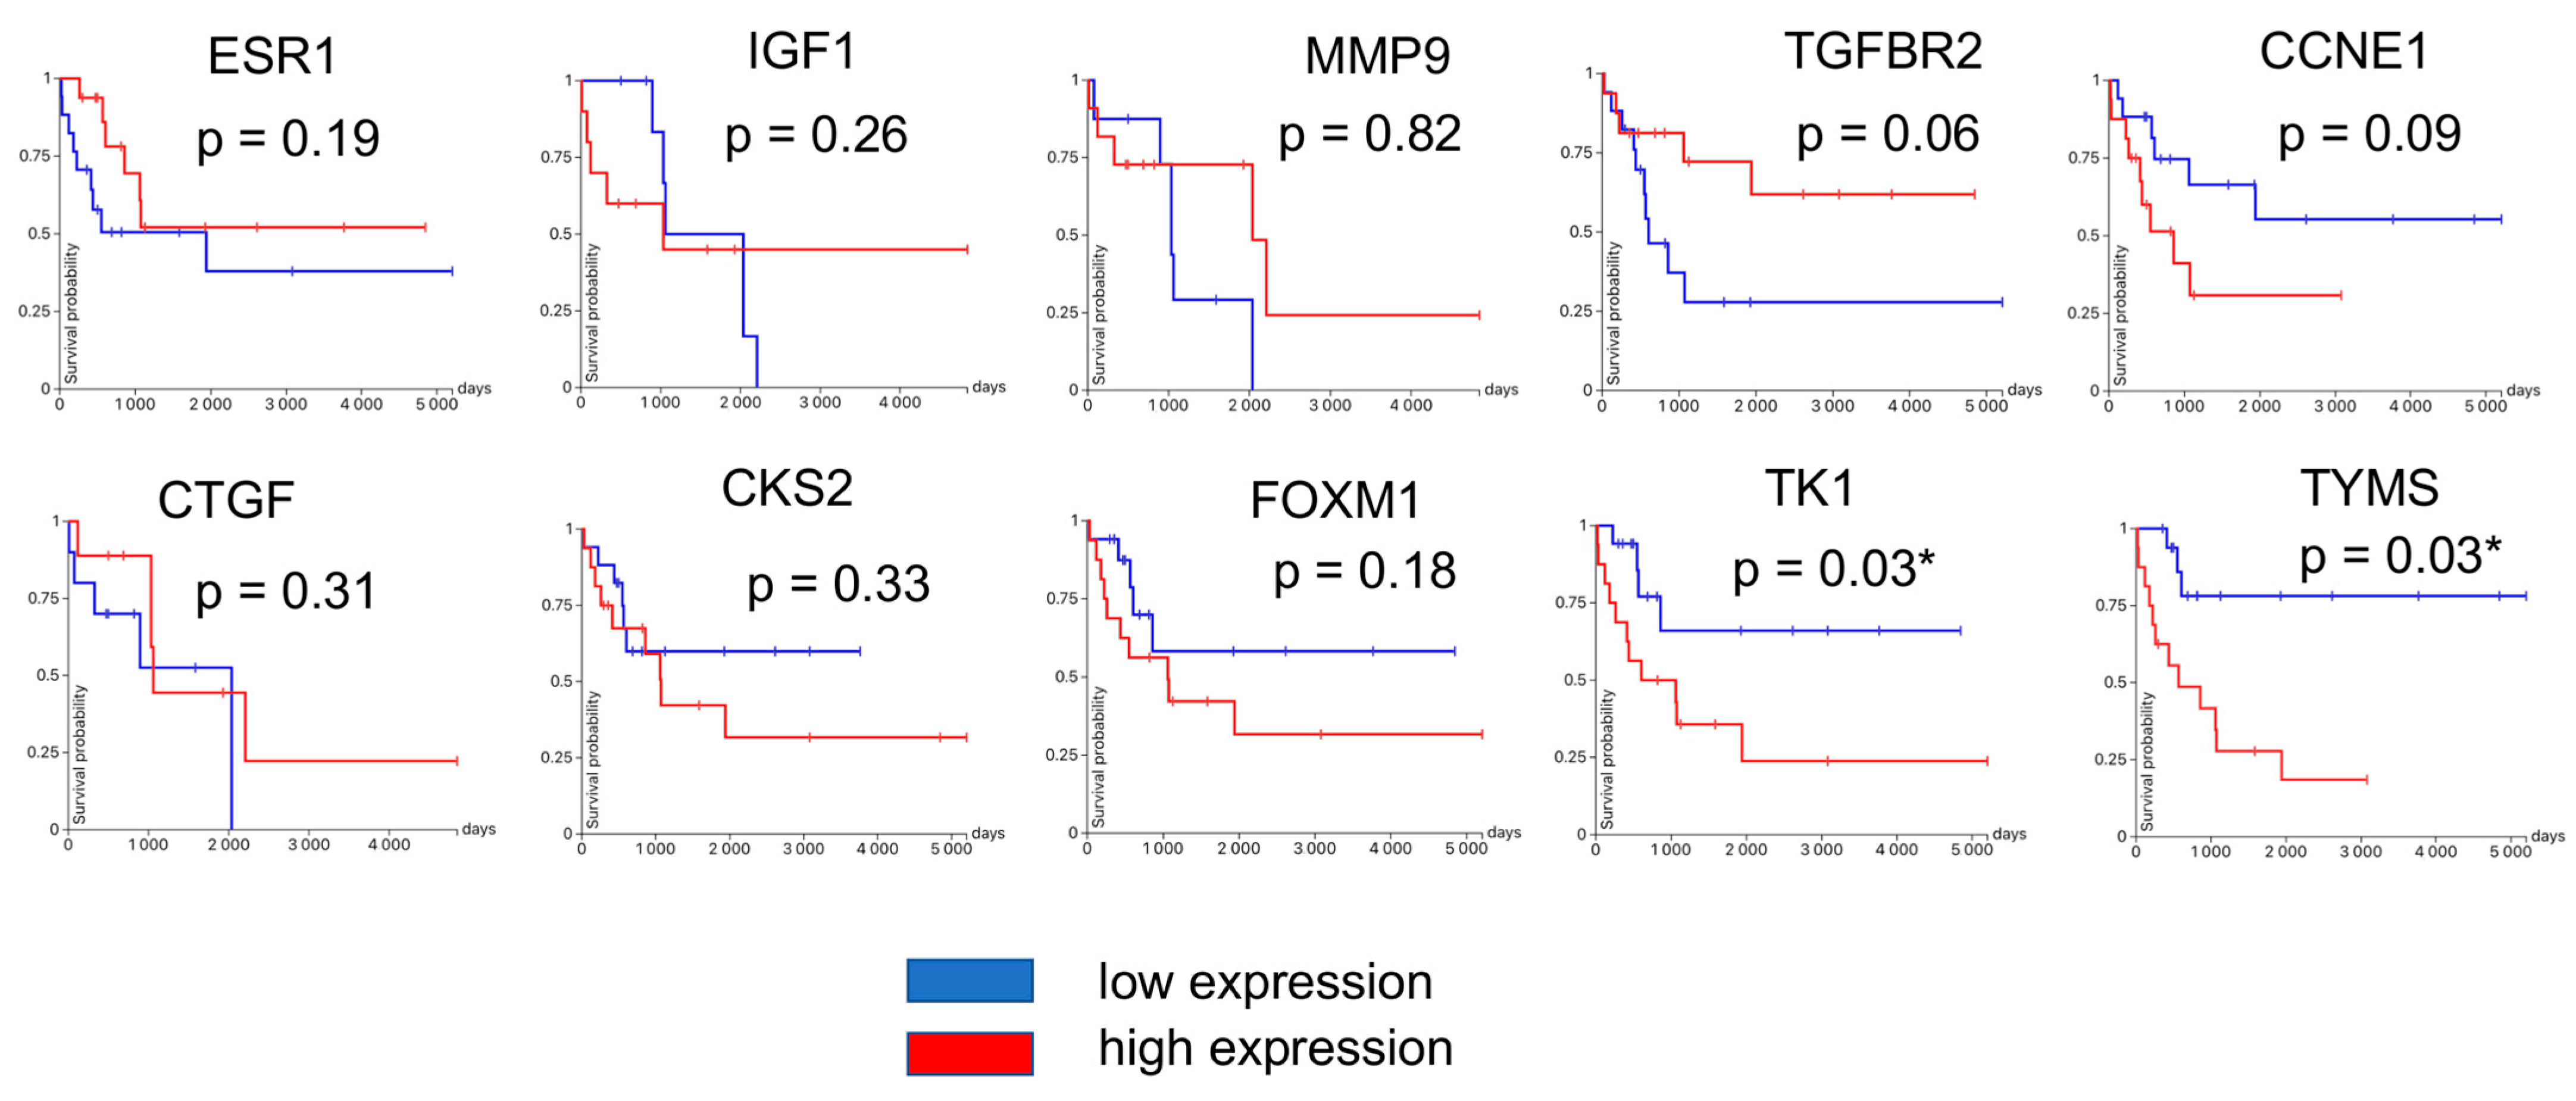
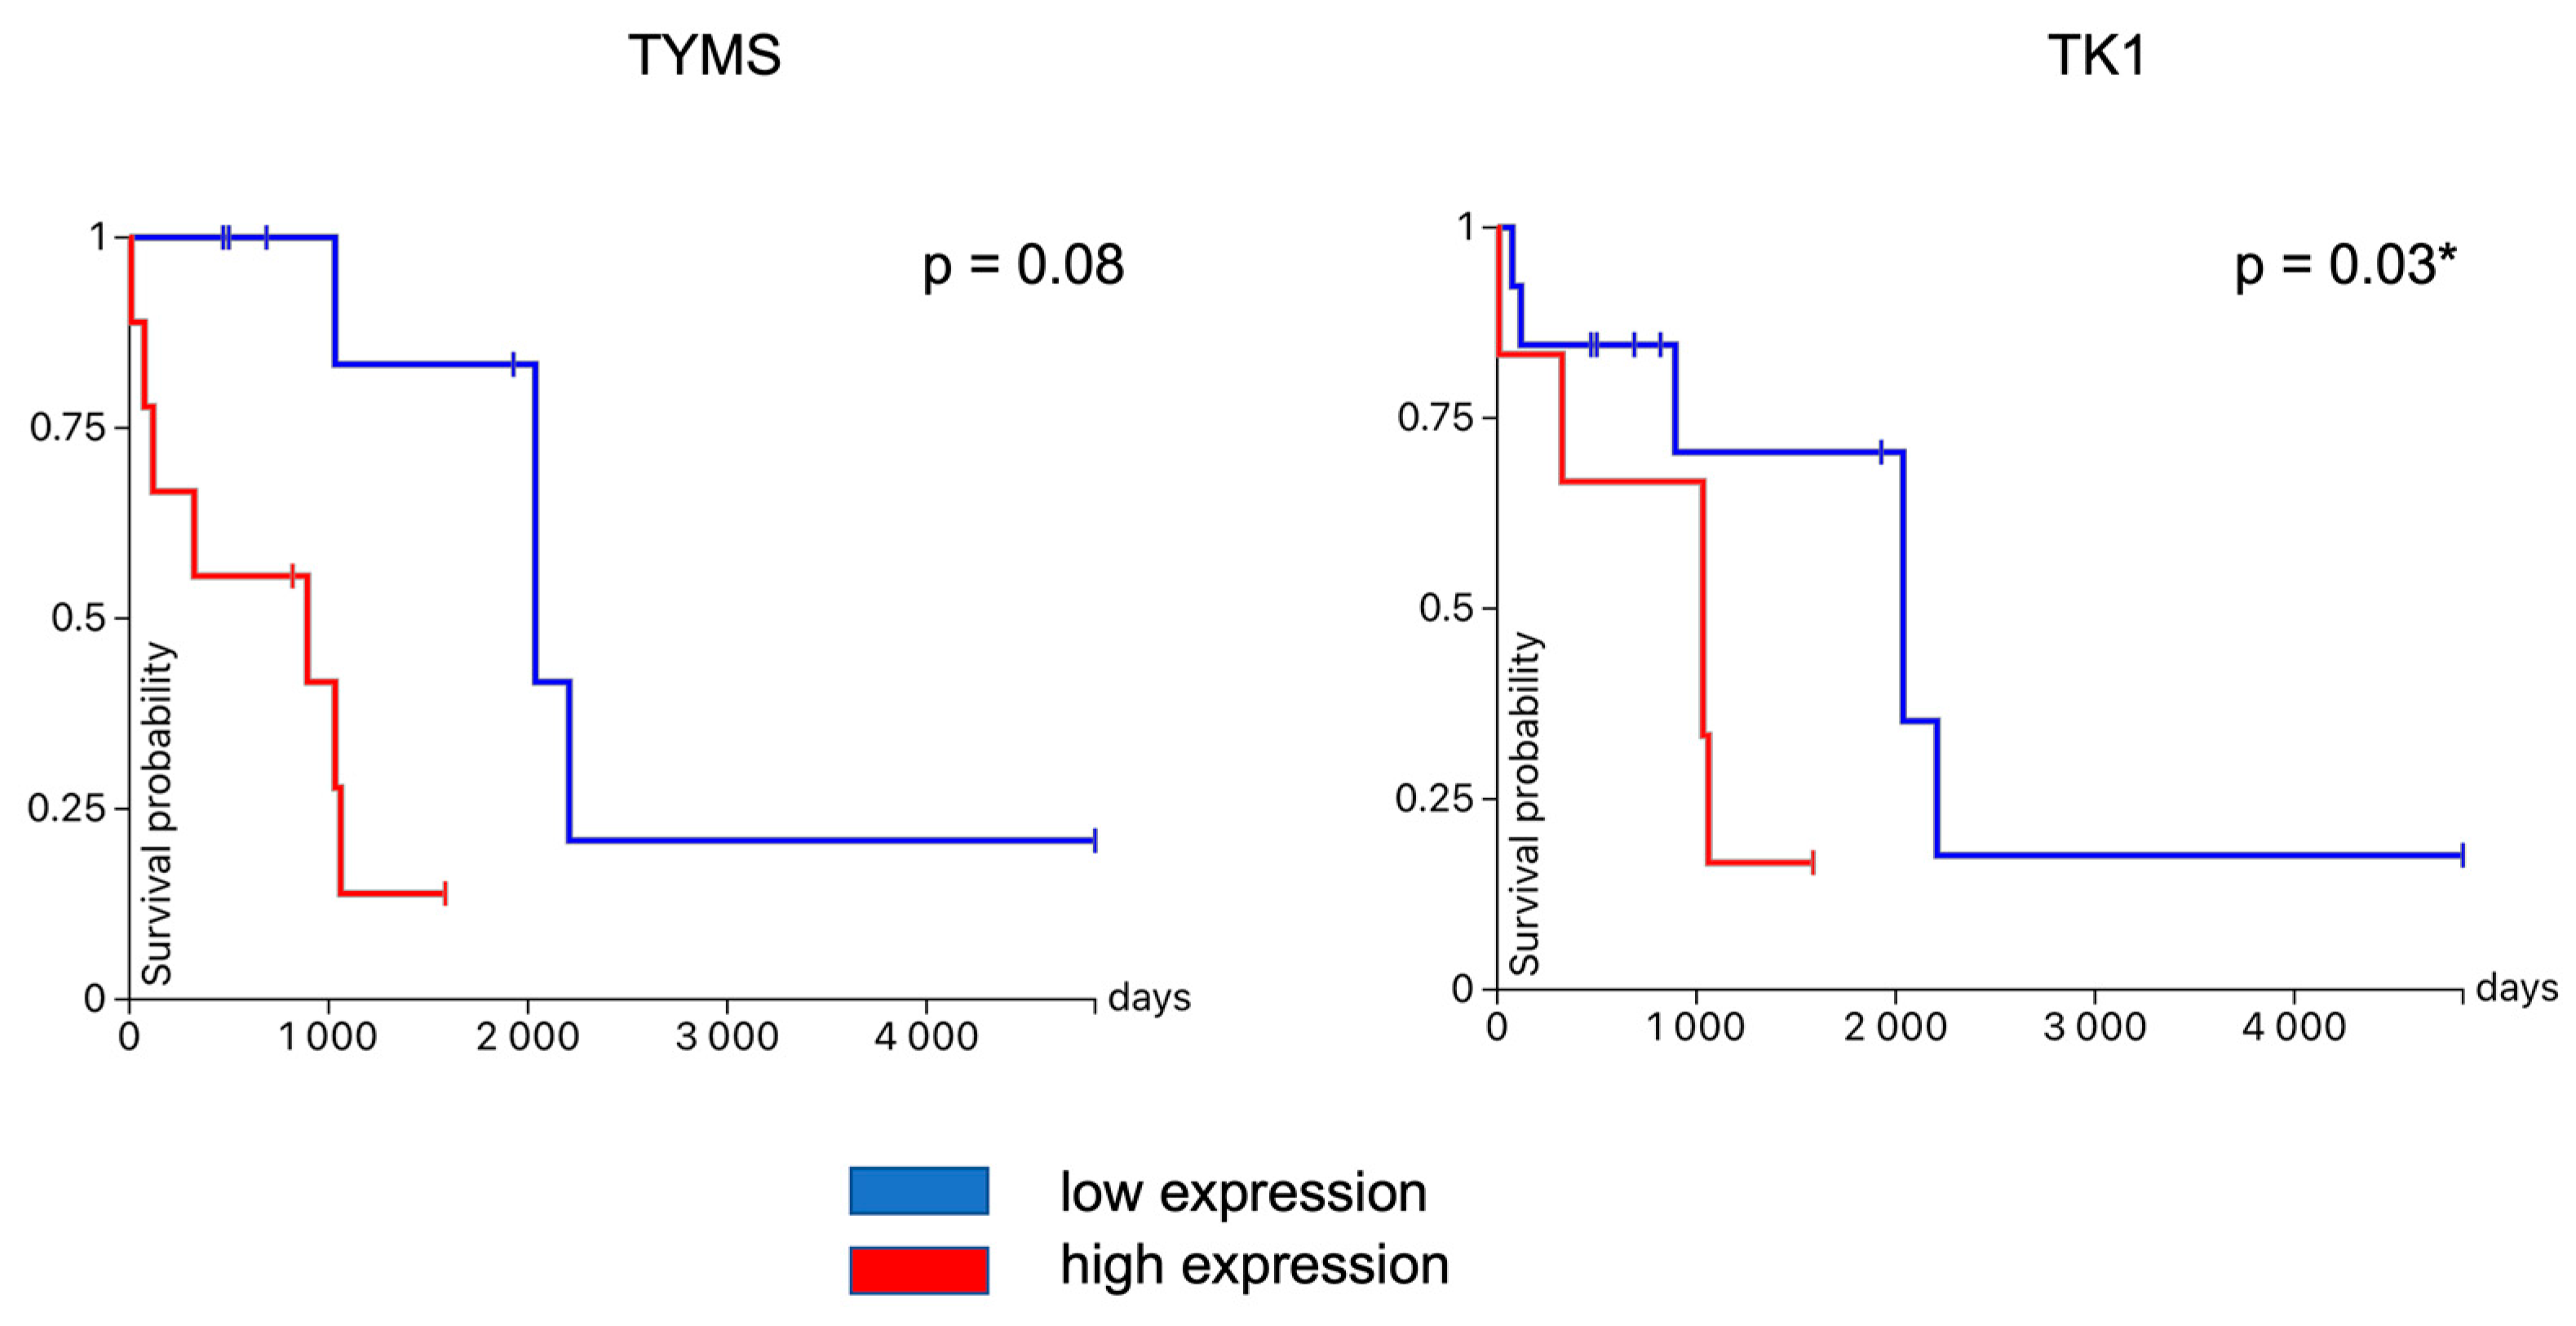
3.4. Hub Gene Validation and Survival Analysis

The expression of overlapped DEGs between uLMS and normal myometrium and uLMS and ULM were validated using TNMplot. All upregulated overlapped DEGs were also overly expressed in tumor tissue compared to the normal uterine tissue (Figure 6). All downregulated overlapped DEGs except ESR1 were significantly expressed in the normal uterine tissue compared to tumor tissue (Figure 7).
USCS Xena browsers’ advanced query isolated samples of uterine leiomyosarcoma with OS, DSS, and DFI data (Figure 8). Figure 9 shows the survival probability plots compared to the expression of previously identified hub genes. Since the analysis revealed that TYMS and TK1 expression significantly correlated with overall survival, we further analyzed the DFI compared to the expression of these genes—lower TK1 expression correlated with longer DFI. The correlation between TYMS expression and DFI was not significant (Figure 10).

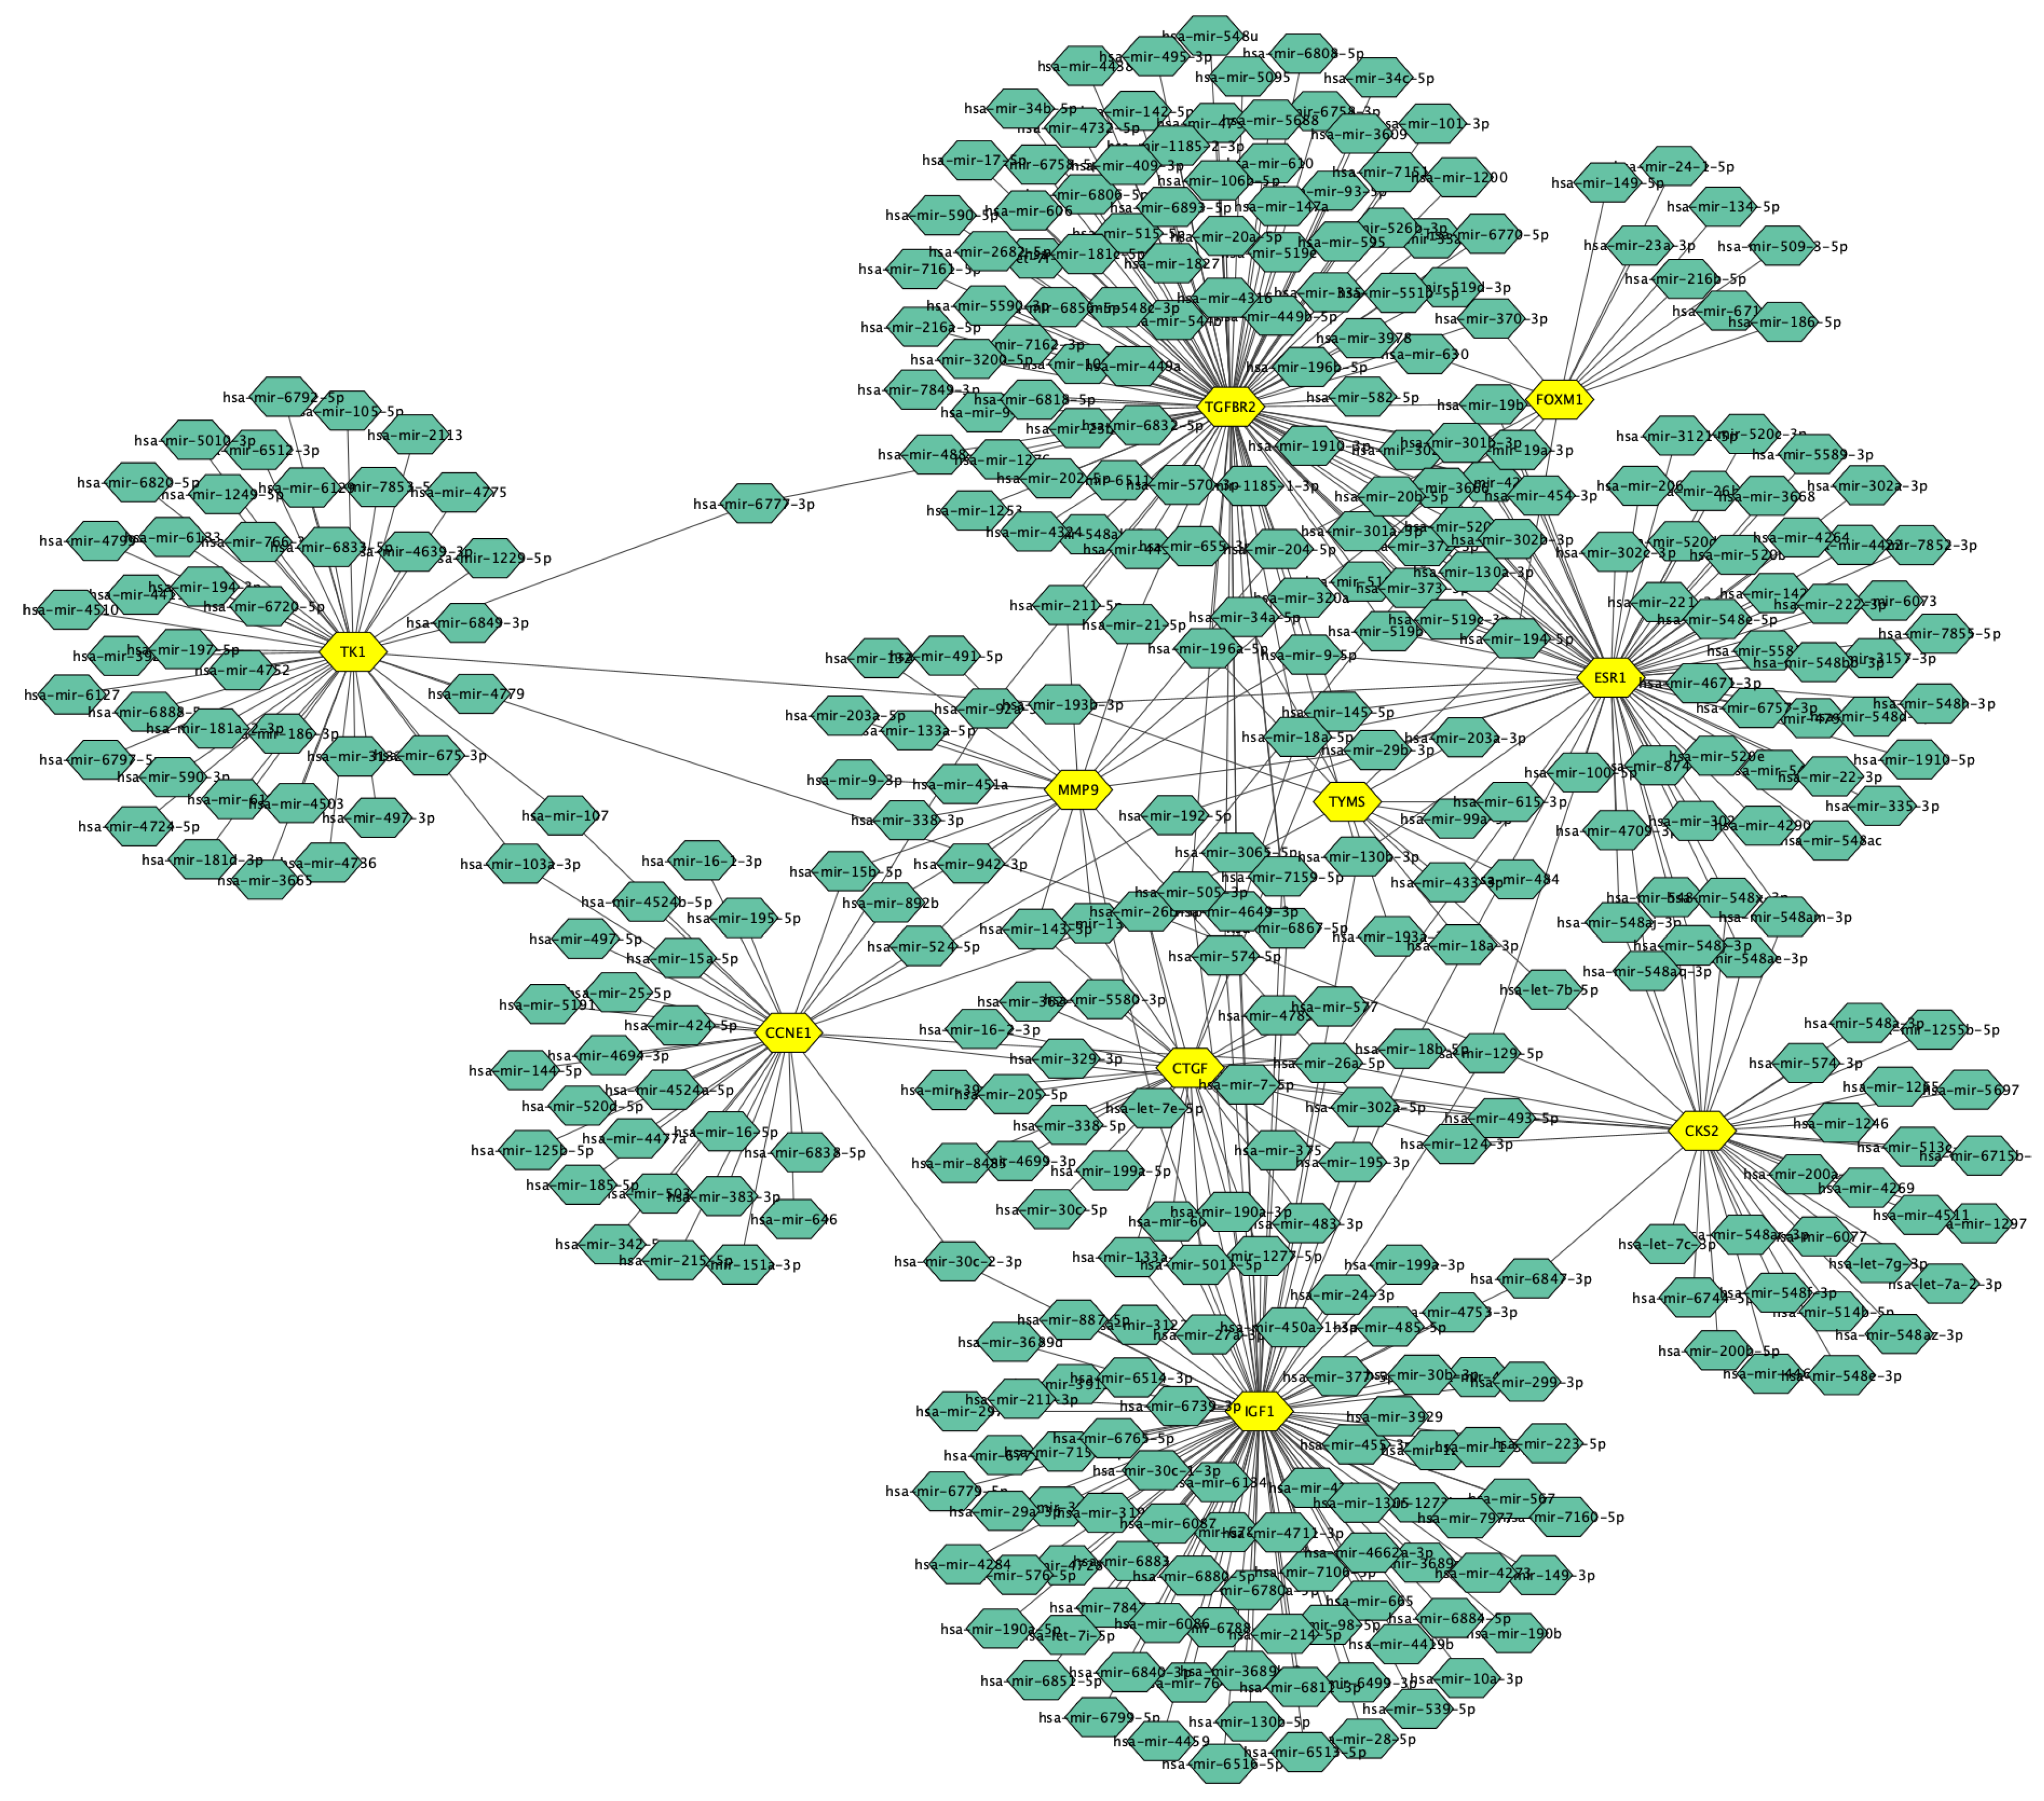
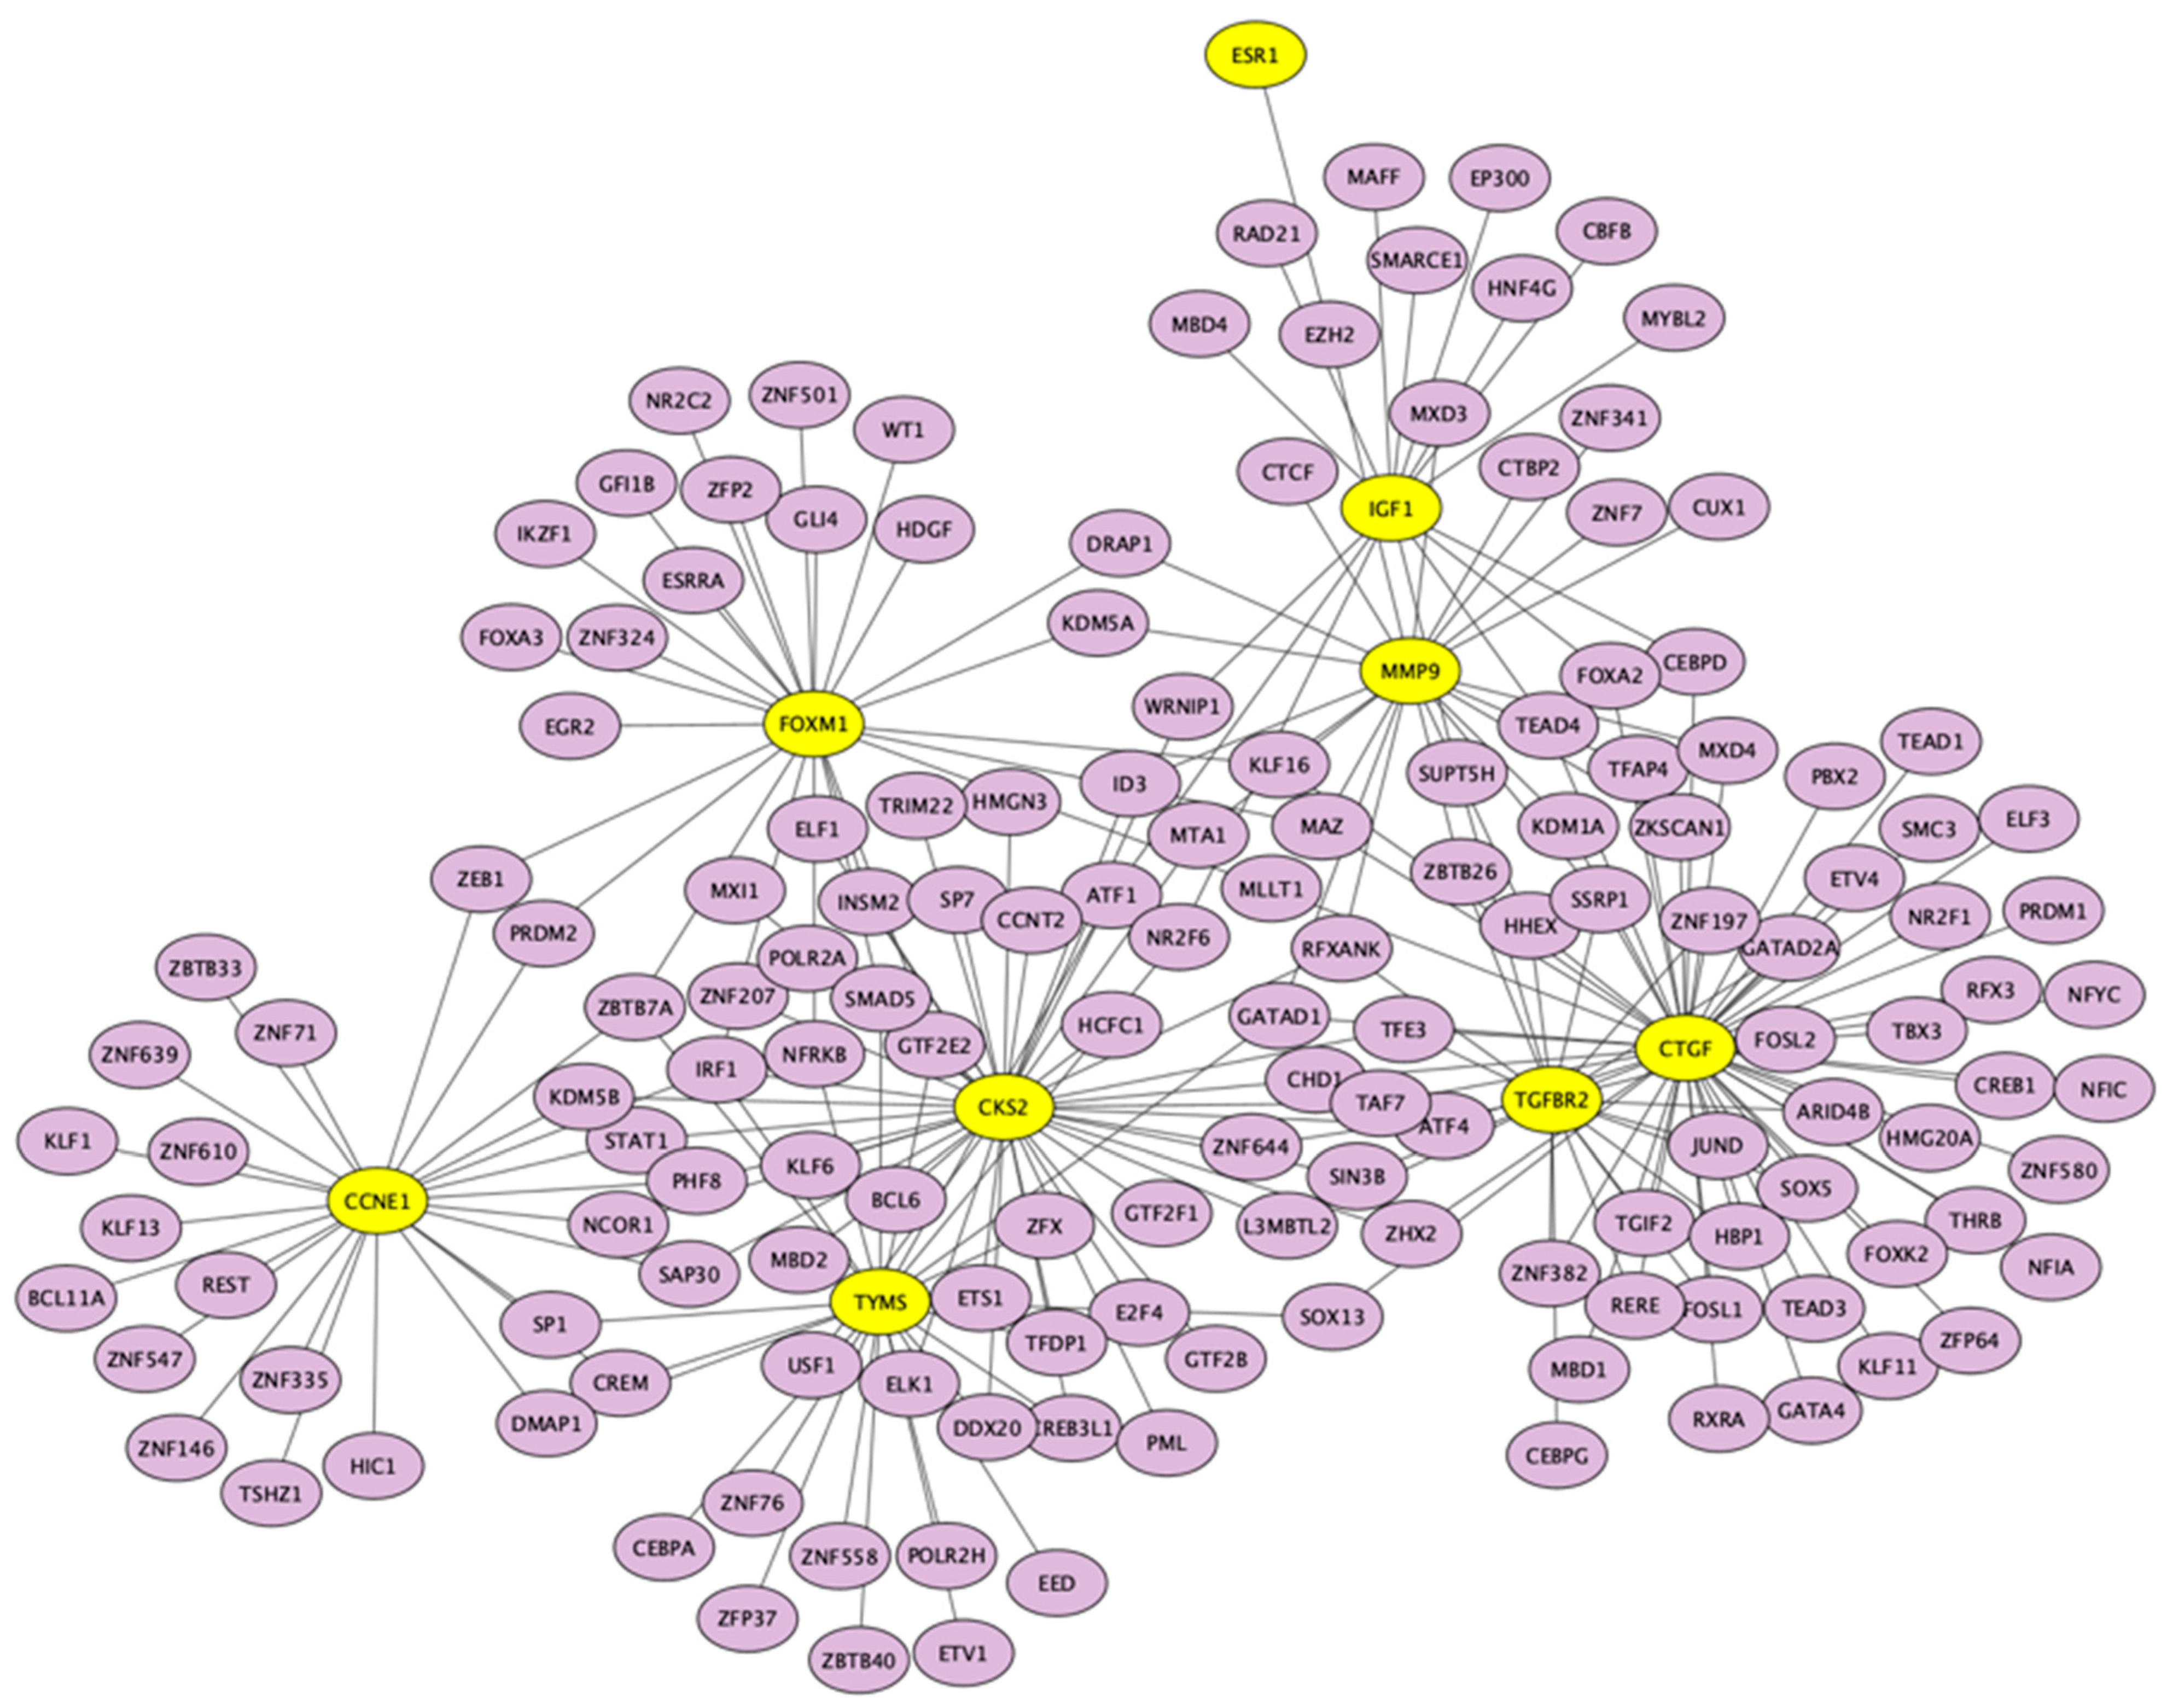
3.5. Candidate TFs and miRNAs Related to Hub Genes

We constructed a miRNAs-target gene network with 397 nodes and 476 edges (Figure 11). Table 7 consists of six candidate miRNAs based on an adjusted p-value. miR-26a-5p and miR-26b-5p, two of the most significant miRNAs, were connected to five and seven hub genes, respectively. Candidate miRNAs targeting hub genes with adjusted p-values are presented in Table 7.
TF-hub gene network with 163 nodes and 227 edges is presented in Figure 12. Arguably the most significant TF, SP1, regulated seven hub genes (TGFBR2, FOXM1, TYMS, CTGF, MMP9, TK1, and ESR1). The rest of the TFs and overlapped genes are presented in Table 8.

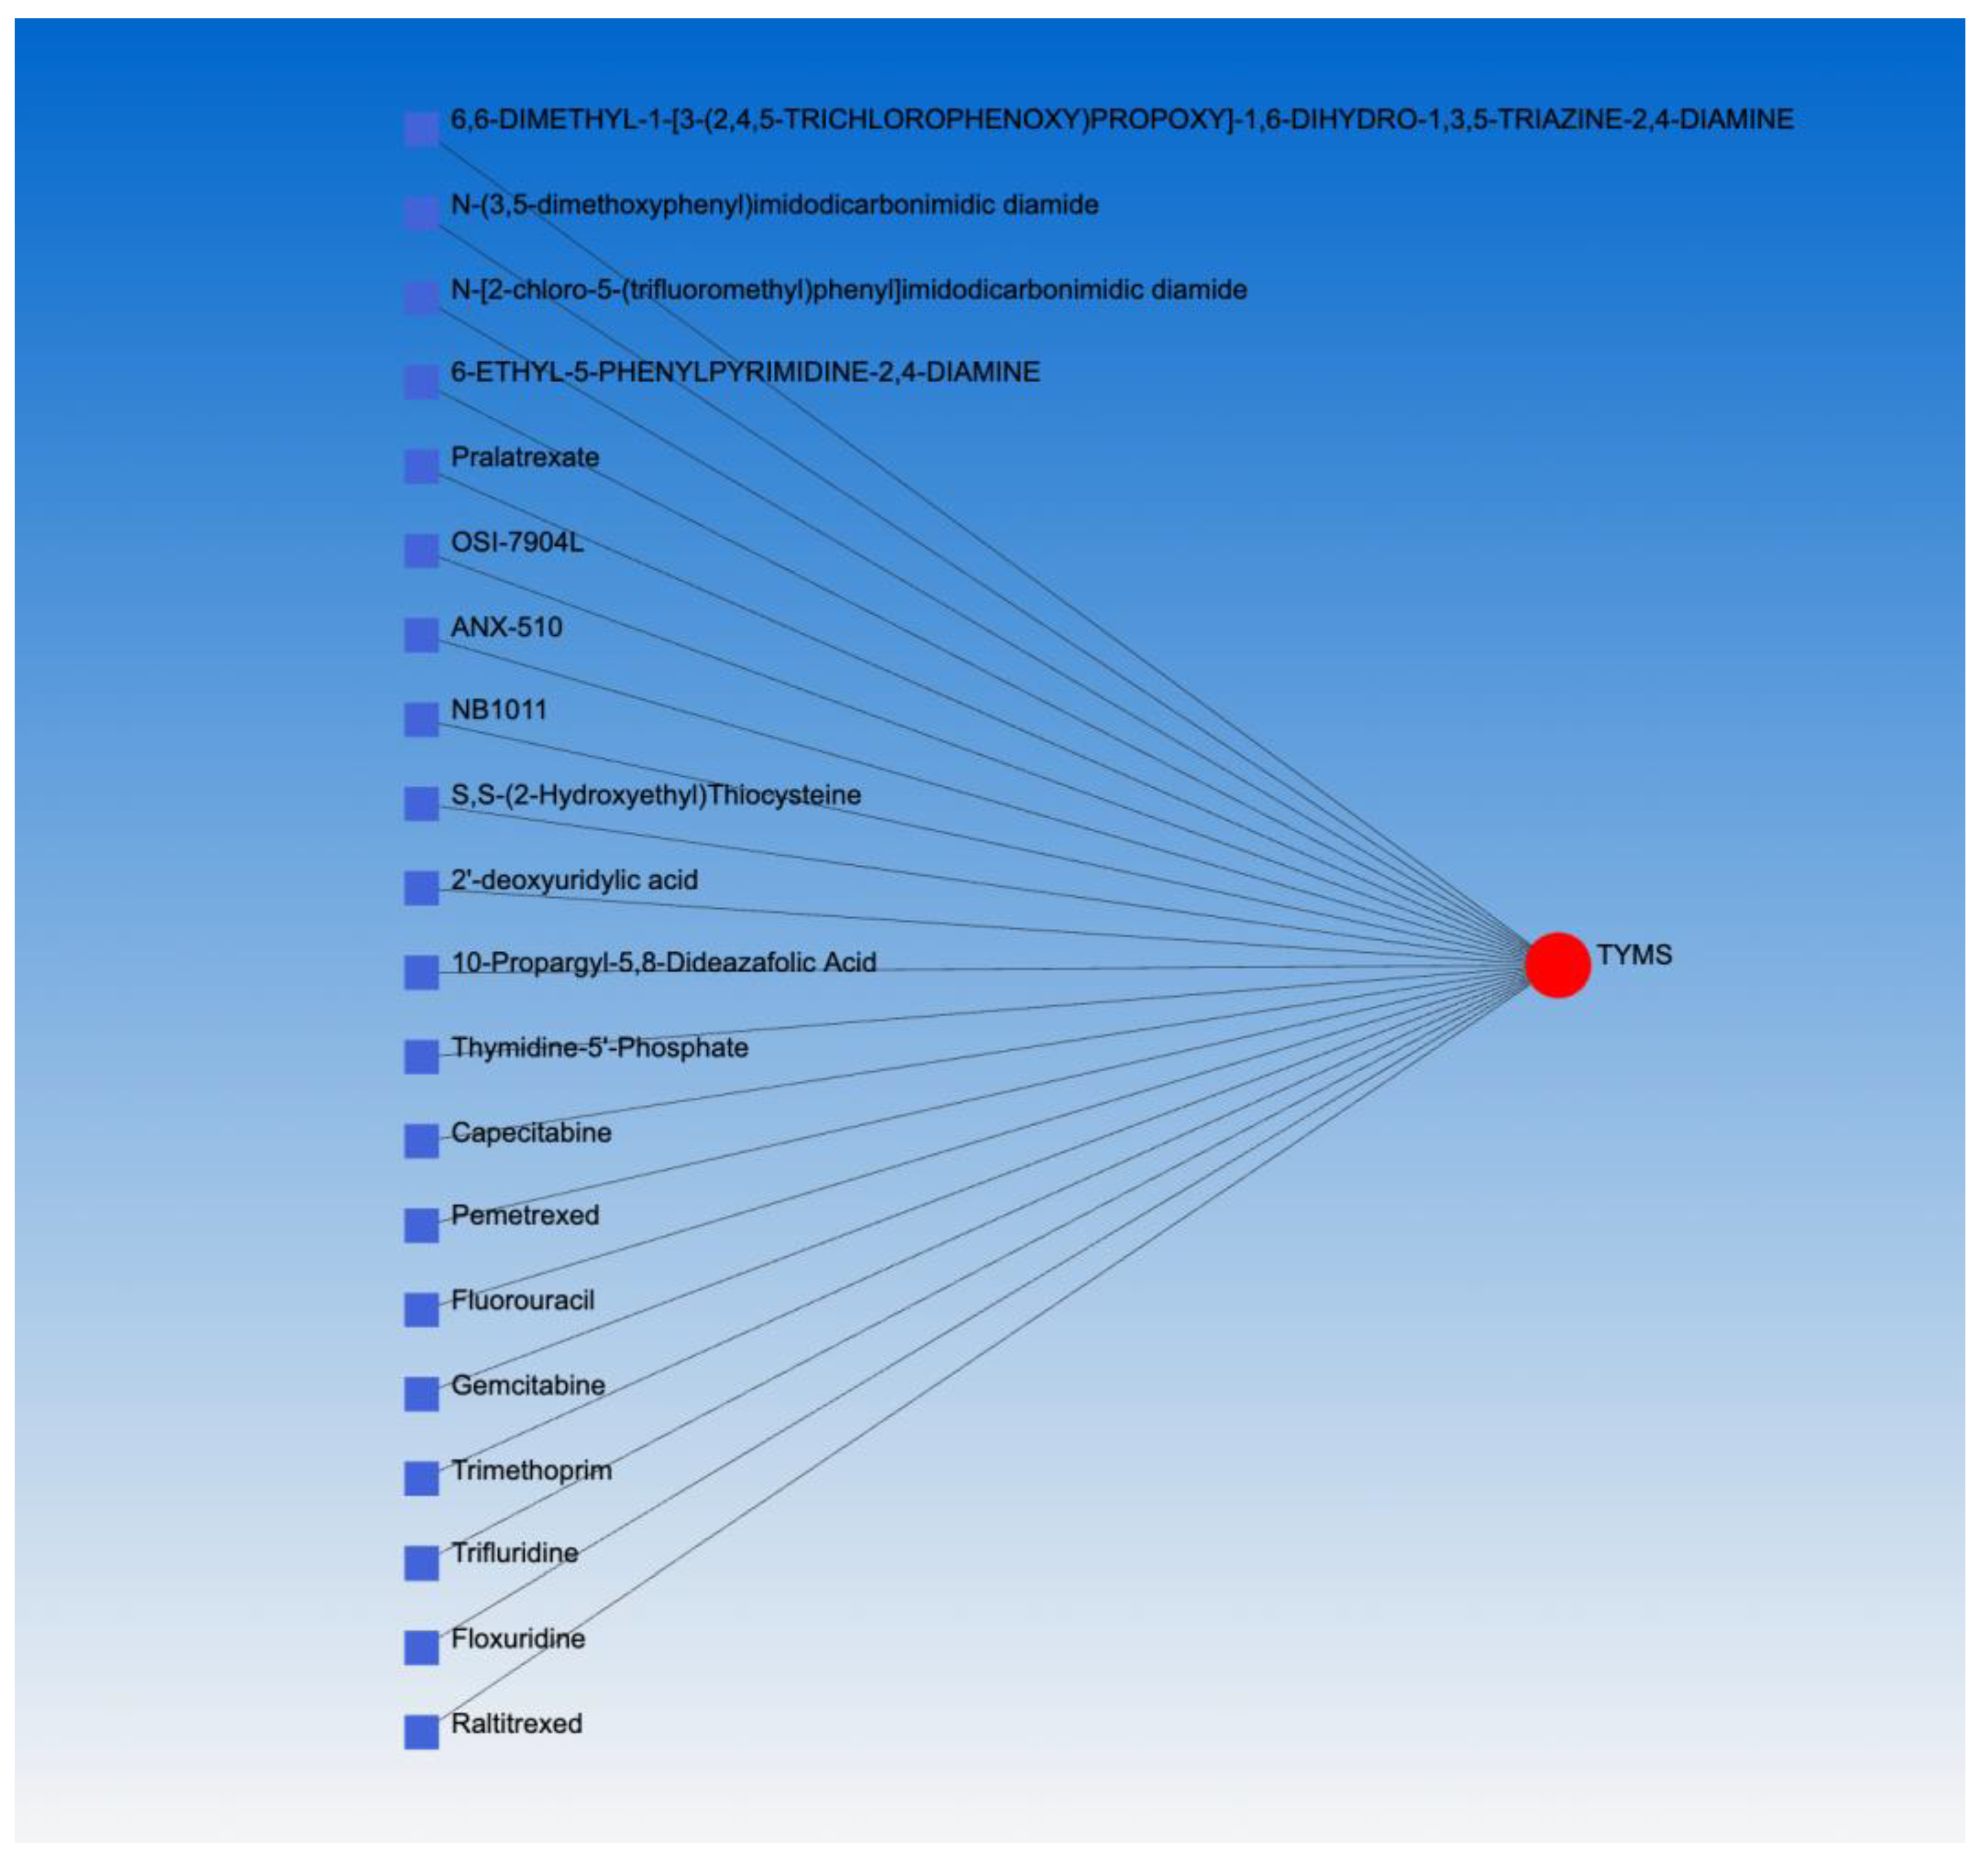
3.6. Drug-Gene Interaction Network

Based on NetworkAnalyst, the only significant drug-gene interaction network was concentrated around TYMS. Figure 13 presents 20 potential drugs with which TYMS potentially interacts. Among them, we would highlight the interaction between TYMS and gemcitabine.

4. Discussion

With a low incidence, uLMS represents a rare gynecological malignancy. On the other hand, its aggressive behavior and molecular diversity urge studies and trials about the proper stratification of patients according to the molecular fingerprints to find the best therapeutic regimens for advanced and unresectable diseases. With an integrated bioinformatic approach, we wanted to explore the driver genes and relevant pathways of uLMS development, progression, and survival using the maximized available data. We used datasets with uLMS and healthy myometrial samples to investigate the potential genes included in malignant transformation. With the inclusion of DEGs between uLMS and ULM and uLMS and UCS, we wanted to highlight the genes that could potentially distinguish these entities preoperatively. Finally, GO and KEGG pathways enrichment, the construction of PPI to select the hub genes, validation and survival analysis of overlapped DEGs between uLMS, myometrium, and ULM could initiate a further investigation of highlighted genes as useful biomarkers of prognosis and therapy response.
DEGs between uLMS and myometrial tissue were enriched in the “response to estrogen” and “negative regulation of the apoptotic process” BP categories. The expression of estrogen receptors is present in approximately 50% of uLMS, with a range of 25–100% [29,30,31,32]. Estrogen receptor 1 (ESR1) was one of the most downregulated genes between uLMS and myometrium, as well as the downregulated hub gene in our study. TCGA study showed hypomethylation of ESR1 response genes, which was one of the uLMS unique features compared to other sarcomas included in this study (mainly soft tissue sarcoma) [33]. Moreover, estrogen and progesterone receptors are considered biomarkers of prognosis in uLMS patients [30,34]. In correlation with rather high hormonal receptors expression in uLMS, there is evidence that uLMS shows a good response to aromatase inhibitors as an adjuvant therapy in newly-diagnosed patients with grade I uLMS, as well as those with recurrent, unresectable, and metastatic disease [31,35,36]. To date, only one clinical study showed that longer progression-free survival correlated with higher expression of the mentioned hormonal receptors [36].
One of the top upregulated DEGs across uLMS-normal myometrium and uLMS-ULM, also a hub gene in our study, was matrix metalloproteinase 9 (MMP9). MMP9 is one of the most investigated members of this particular zinc-dependent endopeptidases family. The roles of MMP9 occur as a result of extracellular matrix (ECM) degradation [37]. As a result of ECM and basement membrane degradation, it is believed that MMP9 is involved in tumor migration, invasion, metastasis, and angiogenesis [38,39,40,41,42]. MMP9 dysregulation is often associated with poor prognosis in ovarian, breast, and colon cancer patients [37]. MMP9 is a well-studied biomarker in non-small cell lung, cervical, ovarian, and pancreatic cancer [37]. In our study, MMP9, a hub gene and upregulated DEG between uLMS-normal myometrium and uLMS-ULM cohorts, was part of the “negative regulation of apoptotic process” GO BP category, as well as “transcriptional misregulation in cancer” KEGG pathway enrichment. ESR1 and MMP9 were also components of the only significant module of the PPI network. One study suggested that the change in MMP expression and cell motility, as a part of the decidualization process, could be estrogen-dependent and mediated by E2–ESR1–FOSL1 signaling pathway [43]. More studies should further investigate the relationship between ESR1 and MMP9 in the pathogenesis of uLMS, but it is possible that these two genes, alone or combined, have an influence on tumor behavior.
Besides MMP9, FOXM1 (Forkhead Box M1) was a component of GO BP categories “negative regulation of the apoptotic process”, “positive regulation of cell proliferation”, and KEGG pathways “transcriptional misregulations in cancer”, and “pathways in cancer”, as well as major upregulated hub gene. FOXM1 activates the expression of target genes at the transcriptional level, and the dysregulation of its activity can be observed in all hallmarks of tumor cells [44]. Substantial evidence highlights the role of FOXM1 in cancer development: significant expression in a variety of human cancers [44], poor prognosis of most solid tumors with FOXM1 overexpression [45], and the attenuation of angiogenesis, metastatic potential, and proliferation in some cancer types as a result of FOXM1 inhibition [46].
CKS2 (Cyclin-dependent kinase subunit 2) gene was upregulated hub gene in our study. CKS2 is one of the two members of the human CKS family, believed to be an important factor in the process of somatic cell division during early embryonic development as well as the first metaphase/anaphase transition of meiosis [47,48]. Overexpression and upregulation of CKS2 have been reported in breast [49], gastric [50], colorectal [51], and hepatocellular [52] cancer. Only one study to date investigated the role of CKS2 in uLMS [53]. Deng et al. demonstrated significantly higher expression of CKS2 in uLMS compared to ULM [53]. Furthermore, CKS2 was associated with increased tumor size and poor overall prognosis in patients with uLMS [53]. Finally, silencing of CKS2 inhibited cell proliferation, colony formation, migration, and invasion, and resulted in cell cycle arrest [53]. The authors hypothesize that CKS2 may act as a cell cycle checkpoint protein for the G1/S transition [53]. These results, along with our findings, not only highlight the potential of CKS2 as an excellent marker of differentiation between uLMS and ULM but provides enough evidence for the further investigation of this gene as a biomarker of prognosis and therapy response, as well as a novel therapy target in uLMS patients.
ATRX, TK1, and TYMS were essential genes in our study. In addition, PTGER3 and ARTX were the only overlapped DEGs between the three cohorts, while TK1 and TYMS were associated with the overall survival of the uLMS patients.
Studies recently highlighted the α-thalassemia/mental retardation syndrome X-linked (ATRX) gene as a central player in genome stability and function maintenance [54]. Gene expression, conservation of telomeric integrity, DNA damage repair, response to replication stress, and homologous recombination are processes in which ATRX has a crucial role [55,56,57]. Naturally, it is no coincidence that the ATRX is now one of the most studied tumor suppressors in a variety of human cancers. Telomeres, a non-coding sequence at each end of chromosomes, regulate chromosomal stability and genome integrity. As chromosome replication occurs in somatic cells, telomeres shorten with every duplication, since Okazaki fragments are synthesized with RNA primers attached ahead on the lagging strand, which leads to 3′ overhangs as the gap between the RNA primer and the end of the chromosome cannot be completed [58]. The majority of cells undergo programmed death when they encounter a barrier called “crisis” [58]. On the other hand, premalignant cells may overcome the crisis barrier by altering the telomere length pathway. These cells avoid the telomere shortening by two telomere maintenance mechanisms: telomerase-mediated telomere maintenance and alternative lengthening of telomeres (ALT) [59]. Emerging reports highlight the correlation between ATRX loss and the ALT process in human cancers [60]. In 2017, The Cancer Genome Atlas Research Network provided a multi-platform analysis of 206 different types of sarcomas, and they concluded that sarcomas are mostly characterized by copy-number changes, that they have relatively low mutational loads, and only a few genes highly mutated across all sarcoma types, one of them being ATRX [33]. A recent study found alterations of ATRX in 51% of uLMS [61]. Another gene mutated in 19% of uLMS, DAXX, is known to functionally cooperate with ATRX [61]. When Choi et al. investigated RNA levels between ATRX/DAXX mutation carriers and noncarriers, they confirmed that the detected alterations led to decreased gene expression [61]. This finding was also associated with ALT [61]. Finally, mutations in ATRX and TP53 correlated with poor prognosis in patients with uLMS [62].
Thymidine-kinase 1 (TK1) is involved in pyrimidine metabolisms and catalyzes gamma-phosphate group addition to thymidine [63]. TK1 plays a significant role in the recovery pathways of pyrimidine nucleotide for DNA damage synthesis and repair [64]. TK1 is also considered a valuable marker of cell proliferation, along with Ki-67 [63,64]. Some authors give an advantage to TK1, since its tight association with the S phase, while Ki-67 is present in all phases of the cell cycle [63,65]. So far, TK1 has been applied as a biomarker in the lung [66], breast [64], prostate [63], and gastric cancer [67], and its overexpression was associated with poor prognosis. Furthermore, several studies identified TK1’s correlation with tumor aggressiveness [68,69,70]. A study by Wang et al. demonstrated the superiority of serum TK1 over Carcinoembryonic antigen (CEA) and Alpha-fetoprotein (AFP) as a marker in the cancer screening of 56,286 people [71]. In this study, serum TK1 correlated with tumor growth rate and was also a prognostic biomarker for death at the follow-up [71]. Serum TK1 was more sensitive than CEA and AFP in discovering people with malignant tumors [71].
As far as we know, the role of TK1 has yet to be studied in patients with uLMS. In our integrated bioinformatic analysis, TK1 was the upregulated hub gene, and its lower expression correlated with overall and disease-free survival. We urge for the studies of TK1 in uLMS since it could be a valuable biomarker for uLMS aggressiveness and a marker of the outcome in patients with uLMS.
TYMS, a gene that encodes thymidylate synthase, was upregulated hub gene in our study. Lower TYMS expression correlated with the overall survival of patients with uLMS. In DNA replication and repair, thymidylate synthase (TS) plays an essential role in the biosynthesis of thymidylate (dTTP) [72]. A study in vitro demonstrated that overexpression of TYMS causes immortalized mammalian cells to develop malignant phenotypes [73]. There is evidence that TYMS up-regulation is associated with adverse clinical behavior in a variety of solid tumor types, such as lung, breast, gastric, and colorectal cancer. In their bioinformatics study, Fu et al. demonstrated the upregulation of TYMS in pancreatic cancer and its association with poor overall survival and recurrence-free survival [74]. They concluded the study by proposing TYMS as a diagnostic and prognostic biomarker for patients with pancreatic cancer [74]. Zhang et al. demonstrated that the patients with higher TYMS expression had worse overall and disease-free survival in patients with retroperitoneal liposarcoma [75]. In this study, the knockdown of TYMS promoted apoptosis and reduced cell migration and invasion of retroperitoneal liposarcoma cells [75]. In a recent study, CRISPR-Cas9 functional telomere length screening revealed that thymidine nucleotide metabolism limits human telomere maintenance [76]. Targeted genetic disruption revealed several control points that included thymidine metabolism: deletion of the TK1 decreased thymidine nucleotide salvage, while de novo knockout of TYMS decreased telomere length [76].
Specificity protein 1 (Sp1) is a transcriptional factor regulating the essential genes involved with cell proliferation and metastasis of various human neoplasms [77]. Patients with higher levels of Sp1 have a worse prognosis in several cancer types [77]. Dauer et al. found that the inhibition of Sp1 also causes cell death in pancreatic cancer [78]. Our results showed that Sp1 regulated seven hub genes. There is also a documented relationship between Sp1 and the upregulation of MMP9, a previously highlighted gene involved with tumor invasion and metastasis [79]. Several factors associated with telomere length regulation have been linked with Sp1 [79]. The relationship between Sp1, TYMS (which was found to be regulated by Sp1 in our study), and telomere length should be investigated in future studies.
In our study, miR-26a-5p and miR-26b-5p were the most significant miRNAs associated with hub genes. Both miRNAs were recently proposed as circulating biomarkers of several cancer types, including breast and cervical cancer [80,81]. The results of our study found an interesting link between TYMS, miR-26b-5p, and gemcitabine. First, we previously mentioned that TYMS expression correlated with OS in uLMS patients. Among seven hub genes, miR-26b-5p also targeted TYMS. Finally, our significant drug-gene interaction network highlighted the interaction between TYMS and gemcitabine. Adjuvant chemotherapy in uLMS patients remains controversial [82]. Gemcitabine is currently part of the Phase II trial as second-line chemotherapy for uLMS [8]. A multicenter study in Japan showed that the most frequent adjuvant chemotherapy was docetaxel and gemcitabine regimen [83]. A 2004 Phase II trial highlighted gemcitabine activity in uLMS patients and proposed its’ inclusion in multiagent regimens [84]. On the other hand, a recent study marked miR-26b-5p as one of the markers of gemcitabine resistance in patients with bladder cancer [85]. In addition to all these findings, the results of our study provide enough evidence for the future investigation of the role of TYMS in the pathogenesis of uLMS. Finally, TYMS could potentially serve as a valuable biomarker in uLMS prognosis.
There are several limitations to our study. Firstly, the conducted research via bioinformatic analysis does provide valuable results and novel insights into uLMS pathogenesis and prognosis, but these results require validation in the clinical setting. Furthermore, the expression of DEGs and hub genes should be verified via immunohistochemistry or even genetic studies and correlated with the clinical features of the uLMS patients. There are helpful, validated web tools for the verification of gene expression in various tissues and cancer types, such as The Human Protein Atlas (https://www.proteinatlas.org/, accessed on 1 May 2023). Unfortunately, there are no uLMS samples available for analysis. Finally, by integrating several datasets, we included a total of 90 uLMS patients. More uLMS samples are required to further validate our results.

5. Conclusions

Our integrated bioinformatic analysis identified several hub genes, candidate miRNAs, TFs, and signaling pathways associated with uLMS. Most importantly, TYMS, TK1, miR-26b-5p, and Sp1 panel should be further investigated as biomarkers of pathogenesis, prognosis, and differentiation of uLMS from other benign and malignant uterine tumors. Regarding the aggressive behavior and poor prognosis of uLMS, with the lack of standard therapeutic regimens, in our opinion, the results of our study provide enough evidence for studies to further investigate the molecular basis of uLMS occurrence and its implication in the diagnosis and therapy of this rare gynecological malignancy.

Author Contributions

Conceptualization, A.R. and M.R.; methodology, A.R. and L.N.; software, A.R. and M.R.; validation, A.R. and M.R.; formal analysis, L.N.; investigation, A.R., R.A. and M.R.; resources, R.A. and L.N.; data curation, A.R. and M.R.; writing—original draft preparation, A.R.; writing—review and editing, A.R.; visualization, A.R. and M.R.; supervision, R.A. and L.N.; project administration, L.N. All authors have read and agreed to the published version of the manuscript.

Funding

This research received no external funding.

Institutional Review Board Statement

Not applicable.

Informed Consent Statement

Not applicable.

Data Availability Statement

Microarray data from uterine leiomyosarcomas, normal myometrium, uterine leiomyomas, and uterine carcinosarcomas are available in Gene expression omnibus datasets (https://www.ncbi.nlm.nih.gov/geo/, accessed on 3 March 2023). Survival data from uterine leiomyosarcoma patients are available in The Cancer Genome Atlas Sarcoma (TCGA-SARC) study (https://portal.gdc.cancer.gov/projects/TCGA-SARC, accessed on 4 March 2023).

Conflicts of Interest

The authors declare no conflict of interest.

References

  1. Roberts, M.E.; Aynardi, J.T.; Chu, C.S. Uterine leiomyosarcoma: A review of the literature and update on management options. Gynecol. Oncol. 2018, 151, 562–572. [Google Scholar] [CrossRef]
  2. Hosh, M.; Antar, S.; Nazzal, A.; Warda, M.; Gibreel, A.; Refky, B. Uterine Sarcoma: Analysis of 13,089 Cases Based on Surveillance, Epidemiology, and End Results Database. Int. J. Gynecol. Cancer 2016, 26, 1098–1104. [Google Scholar] [CrossRef]
  3. Juhasz-Böss, I.; Gabriel, L.; Bohle, R.M.; Horn, L.C.; Solomayer, E.-F.; Breitbach, G.-P. Uterine Leiomyosarcoma. Oncol. Res. Treat. 2018, 41, 680–686. [Google Scholar] [CrossRef]
  4. de Almeida, B.C.; dos Anjos, L.G.; Dobroff, A.S.; Baracat, E.C.; Yang, Q.; Al-Hendy, A.; Carvalho, K.C. Epigenetic Features in Uterine Leiomyosarcoma and Endometrial Stromal Sarcomas: An Overview of the Literature. Biomedicines 2022, 10, 2567. [Google Scholar] [CrossRef]
  5. Sun, S.; Bonaffini, P.A.; Nougaret, S.; Fournier, L.; Dohan, A.; Chong, J.; Smith, J.; Addley, H.; Reinhold, C. How to differentiate uterine leiomyosarcoma from leiomyoma with imaging. Diagn. Interv. Imaging 2019, 100, 619–634. [Google Scholar] [CrossRef]
  6. Kaganov, H.; Ades, A.; Fraser, D.S. Preoperative Magnetic Resonance Imaging Diagnostic Features of Uterine Leiomyosarcomas: A Systematic Review. Int. J. Technol. Assess. Health Care 2018, 34, 172–179. [Google Scholar] [CrossRef]
  7. Seagle, B.-L.L.; Sobecki-Rausch, J.; Strohl, A.E.; Shilpi, A.; Grace, A.; Shahabi, S. Prognosis and treatment of uterine leiomyosarcoma: A National Cancer Database study. Gynecol. Oncol. 2017, 145, 61–70. [Google Scholar] [CrossRef]
  8. Asano, H.; Isoe, T.; Ito, Y.M.; Nishimoto, N.; Watanabe, Y.; Yokoshiki, S.; Watari, H. Status of the Current Treatment Options and Potential Future Targets in Uterine Leiomyosarcoma: A Review. Cancers 2022, 14, 1180. [Google Scholar] [CrossRef]
  9. Reed, N.S.; Mangioni, C.; Malmström, H.; Scarfone, G.; Poveda, A.; Pecorelli, S.; Tateo, S.; Franchi, M.; Jobsen, J.J.; Coens, C.; et al. Phase III randomised study to evaluate the role of adjuvant pelvic radiotherapy in the treatment of uterine sarcomas stages I and II: An European Organisation for Research and Treatment of Cancer Gynaecological Cancer Group Study (protocol 55874). Eur. J. Cancer 2008, 44, 808–818. [Google Scholar] [CrossRef]
  10. Chae, S.H.; Shim, S.-H.; Chang, M.; Choi, A.Y.; Kang, G.G.; Lee, S.J.; Kim, S.-N. Effect of adjuvant therapy on the risk of recurrence in early-stage leiomyosarcoma: A meta-analysis. Gynecol. Oncol. 2019, 154, 638–650. [Google Scholar] [CrossRef]
  11. Athieniti, E.; Spyrou, G.M. A guide to multi-omics data collection and integration for translational medicine. Comput. Struct. Biotechnol. J. 2023, 21, 134–149. [Google Scholar] [CrossRef]
  12. Abbas-Aghababazadeh, F.; Mo, Q.; Fridley, B.L. Statistical genomics in rare cancer. Semin. Cancer Biol. 2020, 61, 1–10. [Google Scholar] [CrossRef]
  13. Clough, E.; Barrett, T. The Gene Expression Omnibus Database. In Statistical Genomics: Methods and Protocols; Mathé, E., Davis, S., Eds.; Methods in Molecular Biology; Springer: New York, NY, USA, 2016; pp. 93–110. ISBN 978-1-4939-3578-9. [Google Scholar]
  14. Wang, Z.; Lachmann, A.; Ma’ayan, A. Mining data and metadata from the gene expression omnibus. Biophys. Rev. 2019, 11, 103–110. [Google Scholar] [CrossRef] [Green Version]
  15. Ganini, C.; Amelio, I.; Bertolo, R.; Bove, P.; Buonomo, O.C.; Candi, E.; Cipriani, C.; Di Daniele, N.; Juhl, H.; Mauriello, A.; et al. Global mapping of cancers: The Cancer Genome Atlas and beyond. Mol. Oncol. 2021, 15, 2823–2840. [Google Scholar] [CrossRef]
  16. Goldman, M.J.; Craft, B.; Hastie, M.; Repečka, K.; McDade, F.; Kamath, A.; Banerjee, A.; Luo, Y.; Rogers, D.; Brooks, A.N.; et al. Visualizing and interpreting cancer genomics data via the Xena platform. Nat. Biotechnol. 2020, 38, 675–678. [Google Scholar] [CrossRef]
  17. Barrett, T.; Wilhite, S.E.; Ledoux, P.; Evangelista, C.; Kim, I.F.; Tomashevsky, M.; Marshall, K.A.; Phillippy, K.H.; Sherman, P.M.; Holko, M.; et al. NCBI GEO: Archive for functional genomics data sets—Update. Nucleic Acids Res. 2013, 41, D991–D995. [Google Scholar] [CrossRef] [Green Version]
  18. Heberle, H.; Meirelles, G.V.; da Silva, F.R.; Telles, G.P.; Minghim, R. InteractiVenn: A Web-Based Tool for the Analysis of Sets through Venn Diagrams. BMC Bioinform. 2015, 16, 169. [Google Scholar] [CrossRef] [Green Version]
  19. The Gene Ontology Consortium. Gene Ontology Consortium: Going forward. Nucleic Acids Res. 2015, 43, D1049–D1056. [Google Scholar] [CrossRef]
  20. Kanehisa, M.; Furumichi, M.; Sato, Y.; Ishiguro-Watanabe, M.; Tanabe, M. KEGG: Integrating viruses and cellular organisms. Nucleic Acids Res. 2021, 49, D545–D551. [Google Scholar] [CrossRef]
  21. Kanehisa, M.; Furumichi, M.; Tanabe, M.; Sato, Y.; Morishima, K. KEGG: New perspectives on genomes, pathways, diseases and drugs. Nucleic Acids Res. 2017, 45, D353–D361. [Google Scholar] [CrossRef] [Green Version]
  22. Szklarczyk, D.; Gable, A.L.; Nastou, K.C.; Lyon, D.; Kirsch, R.; Pyysalo, S.; Doncheva, N.T.; Legeay, M.; Fang, T.; Bork, P.; et al. The STRING database in 2021: Customizable protein–protein networks, and functional characterization of user-uploaded gene/measurement sets. Nucleic Acids Res. 2021, 49, D605–D612. [Google Scholar] [CrossRef]
  23. Bader, G.D.; Hogue, C.W.V. An automated method for finding molecular complexes in large protein interaction networks. BMC Bioinform. 2003, 4, 2–27. [Google Scholar] [CrossRef] [Green Version]
  24. Chin, C.-H.; Chen, S.-H.; Wu, H.-H.; Ho, C.-W.; Ko, M.-T.; Lin, C.-Y. cytoHubba: Identifying hub objects and sub-networks from complex interactome. BMC Syst. Biol. 2014, 8, S11. [Google Scholar] [CrossRef] [Green Version]
  25. Warde-Farley, D.; Donaldson, S.L.; Comes, O.; Zuberi, K.; Badrawi, R.; Chao, P.; Franz, M.; Grouios, C.; Kazi, F.; Lopes, C.T.; et al. The GeneMANIA prediction server: Biological network integration for gene prioritization and predicting gene function. Nucleic Acids Res. 2010, 38, W214–W220. [Google Scholar] [CrossRef] [Green Version]
  26. Bartha, Á.; Győrffy, B. TNMplot.com: A Web Tool for the Comparison of Gene Expression in Normal, Tumor and Metastatic Tissues. Int. J. Mol. Sci. 2021, 22, 2622. [Google Scholar] [CrossRef]
  27. Zhou, G.; Soufan, O.; Ewald, J.; Hancock, R.E.W.; Basu, N.; Xia, J. NetworkAnalyst 3.0: A visual analytics platform for comprehensive gene expression profiling and meta-analysis. Nucleic Acids Res. 2019, 47, W234–W241. [Google Scholar] [CrossRef] [Green Version]
  28. Xie, Z.; Bailey, A.; Kuleshov, M.V.; Clarke, D.J.B.; Evangelista, J.E.; Jenkins, S.L.; Lachmann, A.; Wojciechowicz, M.L.; Kropiwnicki, E.; Jagodnik, K.M.; et al. Gene Set Knowledge Discovery with Enrichr. Curr. Protoc. 2021, 1, e90. [Google Scholar] [CrossRef]
  29. Pannier, D.; Cordoba, A.; Ryckewaert, T.; Robin, Y.-M.; Penel, N. Hormonal therapies in uterine sarcomas, aggressive angiomyxoma, and desmoid-type fibromatosis. Crit. Rev. Oncol./Hematol. 2019, 143, 62–66. [Google Scholar] [CrossRef]
  30. Maccaroni, E.; Lunerti, V.; Agostinelli, V.; Giampieri, R.; Zepponi, L.; Pagliacci, A.; Berardi, R. New Insights into Hormonal Therapies in Uterine Sarcomas. Cancers 2022, 14, 921. [Google Scholar] [CrossRef]
  31. Ioffe, Y.J.; Li, A.J.; Walsh, C.S.; Karlan, B.Y.; Leuchter, R.; Forscher, C.; Cass, I. Hormone receptor expression in uterine sarcomas: Prognostic and therapeutic roles. Gynecol. Oncol. 2009, 115, 466–471. [Google Scholar] [CrossRef]
  32. Leitao, M.M.; Soslow, R.A.; Nonaka, D.; Olshen, A.B.; Aghajanian, C.; Sabbatini, P.; Dupont, J.; Hensley, M.; Sonoda, Y.; Barakat, R.R.; et al. Tissue microarray immunohistochemical expression of estrogen, progesterone, and androgen receptors in uterine leiomyomata and leiomyosarcoma. Cancer 2004, 101, 1455–1462. [Google Scholar] [CrossRef]
  33. Abeshouse, A.; Adebamowo, C.; Adebamowo, S.N.; Akbani, R.; Akeredolu, T.; Ally, A.; Anderson, M.L.; Anur, P.; Appelbaum, E.L.; Armenia, J.; et al. Comprehensive and Integrated Genomic Characterization of Adult Soft Tissue Sarcomas. Cell 2017, 171, 950–965.e28. [Google Scholar] [CrossRef] [Green Version]
  34. Koivisto-Korander, R.; Butzow, R.; Koivisto, A.-M.; Leminen, A. Immunohistochemical studies on uterine carcinosarcoma, leiomyosarcoma, and endometrial stromal sarcoma: Expression and prognostic importance of ten different markers. Tumor Biol. 2011, 32, 451–459. [Google Scholar] [CrossRef]
  35. Zang, Y.; Dong, M.; Zhang, K.; Gao, C.; Guo, F.; Wang, Y.; Xue, F. Hormonal therapy in uterine sarcomas. Cancer Med. 2019, 8, 1339–1349. [Google Scholar] [CrossRef] [Green Version]
  36. George, S.; Feng, Y.; Manola, J.; Nucci, M.R.; Butrynski, J.E.; Morgan, J.A.; Ramaiya, N.; Quek, R.; Penson, R.T.; Wagner, A.J.; et al. Phase 2 trial of aromatase inhibition with letrozole in patients with uterine leiomyosarcomas expressing estrogen and/or progesterone receptors. Cancer 2014, 120, 738–743. [Google Scholar] [CrossRef]
  37. Huang, H. Matrix Metalloproteinase-9 (MMP-9) as a Cancer Biomarker and MMP-9 Biosensors: Recent Advances. Sensors 2018, 18, 3249. [Google Scholar] [CrossRef] [Green Version]
  38. Gobin, E.; Bagwell, K.; Wagner, J.; Mysona, D.; Sandirasegarane, S.; Smith, N.; Bai, S.; Sharma, A.; Schleifer, R.; She, J.-X. A pan-cancer perspective of matrix metalloproteases (MMP) gene expression profile and their diagnostic/prognostic potential. BMC Cancer 2019, 19, 581. [Google Scholar] [CrossRef] [Green Version]
  39. Mehner, C.; Hockla, A.; Miller, E.; Ran, S.; Radisky, D.C.; Radisky, E.S. Tumor cell-produced matrix metalloproteinase 9 (MMP-9) drives malignant progression and metastasis of basal-like triple negative breast cancer. Oncotarget 2014, 5, 2736–2749. [Google Scholar] [CrossRef] [Green Version]
  40. Mondal, S.; Adhikari, N.; Banerjee, S.; Amin, S.A.; Jha, T. Matrix metalloproteinase-9 (MMP-9) and its inhibitors in cancer: A minireview. Eur. J. Med. Chem. 2020, 194, 112260. [Google Scholar] [CrossRef]
  41. Pego, E.R.; Fernández, I.; Núñez, M.J. Molecular basis of the effect of MMP-9 on the prostate bone metastasis: A review. Urol. Oncol. Semin. Orig. Investig. 2018, 36, 272–282. [Google Scholar] [CrossRef]
  42. Zeng, Y.; Gao, M.; Lin, D.; Du, G.; Cai, Y. Prognostic and Immunological Roles of MMP-9 in Pan-Cancer. BioMed. Res. Int. 2022, 2022, 2592962. [Google Scholar] [CrossRef]
  43. Pan, Y.; Wang, X.; Zhang, Y.; Qiao, J.; Sasano, H.; McNamara, K.; Zhao, B.; Zhang, D.; Fan, Y.; Liu, L.; et al. Estradiol-Induced MMP-9 Expression via PELP1-Mediated Membrane-Initiated Signaling in ERα-Positive Breast Cancer Cells. Horm. Cancer 2020, 11, 87–96. [Google Scholar] [CrossRef]
  44. Liao, G.-B.; Li, X.-Z.; Zeng, S.; Liu, C.; Yang, S.-M.; Yang, L.; Hu, C.-J.; Bai, J.-Y. Regulation of the master regulator FOXM1 in cancer. Cell Commun. Signal. 2018, 16, 57. [Google Scholar] [CrossRef] [Green Version]
  45. Li, L.; Wu, D.; Yu, Q.; Li, L.; Wu, P. Prognostic value of FOXM1 in solid tumors: A systematic review and meta-analysis. Oncotarget 2017, 8, 32298–32308. [Google Scholar] [CrossRef] [Green Version]
  46. Yu, C.; Chen, L.; Yie, L.; Wei, L.; Wen, T.; Liu, Y.; Chen, H. Targeting FoxM1 inhibits proliferation, invasion and migration of nasopharyngeal carcinoma through the epithelial-to-mesenchymal transition pathway. Oncol. Rep. 2015, 33, 2402–2410. [Google Scholar] [CrossRef] [Green Version]
  47. Martinsson-Ahlzén, H.-S.; Liberal, V.; Grünenfelder, B.; Chaves, S.R.; Spruck, C.H.; Reed, S.I. Cyclin-Dependent Kinase-Associated Proteins Cks1 and Cks2 Are Essential during Early Embryogenesis and for Cell Cycle Progression in Somatic Cells. Mol. Cell Biol. 2008, 28, 5698–5709. [Google Scholar] [CrossRef] [Green Version]
  48. Spruck, C.H.; de Miguel, M.P.; Smith, A.P.L.; Ryan, A.; Stein, P.; Schultz, R.M.; Lincoln, A.J.; Donovan, P.J.; Reed, S.I. Requirement of Cks2 for the First Metaphase/Anaphase Transition of Mammalian Meiosis. Science 2003, 300, 647–650. [Google Scholar] [CrossRef]
  49. Huang, N.; Wu, Z.; Hong, H.; Wang, X.; Yang, F.; Li, H. Overexpression of CKS2 is associated with a poor prognosis and promotes cell proliferation and invasion in breast cancer. Mol. Med. Rep. 2019, 19, 4761–4769. [Google Scholar] [CrossRef]
  50. Kang, M.A.; Kim, J.-T.; Kim, J.H.; Kim, S.-Y.; Kim, Y.H.; Yeom, Y.I.; Lee, Y.; Lee, H.G. Upregulation of the cycline kinase subunit CKS2 increases cell proliferation rate in gastric cancer. J. Cancer Res. Clin. Oncol. 2009, 135, 761–769. [Google Scholar] [CrossRef]
  51. Yu, M.; Zhong, M.; Qiao, Z. Expression and clinical significance of cyclin kinase subunit 2 in colorectal cancer. Oncol. Lett. 2013, 6, 777–780. [Google Scholar] [CrossRef] [Green Version]
  52. Zhang, J.; Song, Q.; Liu, J.; Lu, L.; Xu, Y.; Zheng, W. Cyclin-Dependent Kinase Regulatory Subunit 2 Indicated Poor Prognosis and Facilitated Aggressive Phenotype of Hepatocellular Carcinoma. Dis. Markers 2019, 2019, 8964015. [Google Scholar] [CrossRef] [Green Version]
  53. Deng, Y.; Han, Q.; Mei, S.; Li, H.; Yang, F.; Wang, J.; Ge, S.; Jing, X.; Xu, H.; Zhang, T. Cyclin-dependent kinase subunit 2 overexpression promotes tumor progression and predicts poor prognosis in uterine leiomyosarcoma. Oncol. Lett. 2019, 18, 2845–2852. [Google Scholar] [CrossRef] [Green Version]
  54. Aguilera, P.; López-Contreras, A.J. ATRX, a guardian of chromatin. Trends Genet. 2023, 39, 505–519. [Google Scholar] [CrossRef]
  55. Juhász, S.; Elbakry, A.; Mathes, A.; Löbrich, M. ATRX Promotes DNA Repair Synthesis and Sister Chromatid Exchange during Homologous Recombination. Mol. Cell 2018, 71, 11–24.e7. [Google Scholar] [CrossRef] [Green Version]
  56. Lovejoy, C.A.; Takai, K.; Huh, M.S.; Picketts, D.J.; de Lange, T. ATRX affects the repair of telomeric DSBs by promoting cohesion and a DAXX-dependent activity. PLOS Biol. 2020, 18, e3000594. [Google Scholar] [CrossRef] [Green Version]
  57. Voon, H.P.J.; Hughes, J.R.; Rode, C.; De La Rosa-Velázquez, I.A.; Jenuwein, T.; Feil, R.; Higgs, D.; Gibbons, R.J. ATRX Plays a Key Role in Maintaining Silencing at Interstitial Heterochromatic Loci and Imprinted Genes. Cell Rep. 2015, 11, 405–418. [Google Scholar] [CrossRef] [Green Version]
  58. Ren, X.; Tu, C.; Tang, Z.; Ma, R.; Li, Z. Alternative lengthening of telomeres phenotype and loss of ATRX expression in sarcomas (Review). Oncol. Lett. 2018, 15, 7489–7496. [Google Scholar] [CrossRef] [Green Version]
  59. De Vitis, M.; Berardinelli, F.; Sgura, A. Telomere Length Maintenance in Cancer: At the Crossroad between Telomerase and Alternative Lengthening of Telomeres (ALT). Int. J. Mol. Sci. 2018, 19, 606. [Google Scholar] [CrossRef] [Green Version]
  60. Li, F.; Deng, Z.; Zhang, L.; Wu, C.; Jin, Y.; Hwang, I.; Vladimirova, O.; Xu, L.; Yang, L.; Lu, B.; et al. ATRX loss induces telomere dysfunction and necessitates induction of alternative lengthening of telomeres during human cell immortalization. EMBO J. 2019, 38, e96659. [Google Scholar] [CrossRef]
  61. Choi, J.; Manzano, A.; Dong, W.; Bellone, S.; Bonazzoli, E.; Zammataro, L.; Yao, X.; Deshpande, A.; Zaidi, S.; Guglielmi, A.; et al. Integrated mutational landscape analysis of uterine leiomyosarcomas. Proc. Natl. Acad. Sci. USA 2021, 118, 2025182118. [Google Scholar] [CrossRef]
  62. Tsuyoshi, H.; Yoshida, Y. Molecular biomarkers for uterine leiomyosarcoma and endometrial stromal sarcoma. Cancer Sci. 2018, 109, 1743–1752. [Google Scholar] [CrossRef]
  63. Xie, H.; Guo, L.; Wang, Z.; Peng, S.; Ma, Q.; Yang, Z.; Shang, Z.; Niu, Y. Assessing the Potential Prognostic and Immunological Role of TK1 in Prostate Cancer. Front. Genet. 2022, 13, 778850. [Google Scholar] [CrossRef]
  64. Fanelli, G.N.; Scarpitta, R.; Cinacchi, P.; Fuochi, B.; Szumera-Ciećkiewicz, A.; De Ieso, K.; Ferrari, P.; Fontana, A.; Miccoli, M.; Naccarato, A.G.; et al. Immunohistochemistry for Thymidine Kinase-1 (TK1): A Potential Tool for the Prognostic Stratification of Breast Cancer Patients. J. Clin. Med. 2021, 10, 5416. [Google Scholar] [CrossRef]
  65. Bitter, E.E.; Townsend, M.H.; Erickson, R.; Allen, C.; O’neill, K.L. Thymidine kinase 1 through the ages: A comprehensive review. Cell Biosci. 2020, 10, 138. [Google Scholar] [CrossRef]
  66. Xu, Y.; Shi, Q.-L.; Ma, H.; Zhou, H.; Lu, Z.; Yu, B.; Zhou, X.; Eriksson, S.; He, E.; Skog, S. High thymidine kinase 1 (TK1) expression is a predictor of poor survival in patients with pT1 of lung adenocarcinoma. Tumor Biol. 2012, 33, 475–483. [Google Scholar] [CrossRef]
  67. Wang, Y.; Cui, D.; Li, D.; Li, D.; Wang, H.; Wu, Y. Clinical Value on Combined Detection of Serum CA724, DKK1, and TK1 in Diagnosis of Gastric Cancer. J. Oncol. 2022, 2022, 6941748. [Google Scholar] [CrossRef]
  68. Malvi, P.; Janostiak, R.; Nagarajan, A.; Cai, G.; Wajapeyee, N. Loss of thymidine kinase 1 inhibits lung cancer growth and metastatic attributes by reducing GDF15 expression. PLOS Genet. 2019, 15, e1008439. [Google Scholar] [CrossRef] [Green Version]
  69. Nisman, B.; Allweis, T.; Kaduri, L.; Maly, B.; Gronowitz, S.; Hamburger, T.; Peretz, T. Serum thymidine kinase 1 activity in breast cancer. Cancer Biomarkers 2010, 7, 65–72. [Google Scholar] [CrossRef]
  70. Wei, Y.-T.; Luo, Y.-Z.; Feng, Z.-Q.; Huang, Q.-X.; Mo, A.-S.; Mo, S.-X. TK1 overexpression is associated with the poor outcomes of lung cancer patients: A systematic review and meta-analysis. Biomarkers Med. 2018, 12, 403–413. [Google Scholar] [CrossRef]
  71. Wang, Y.; Jiang, X.; Dong, S.; Shen, J.; Yu, H.; Zhou, J.; Li, J.; Ma, H.; He, E.; Skog, S. Serum TK1 is a more reliable marker than CEA and AFP for cancer screening in a study of 56,286 people. Cancer Biomarkers 2016, 16, 529–536. [Google Scholar] [CrossRef] [Green Version]
  72. Burdelski, C.; Strauss, C.; Tsourlakis, M.C.; Kluth, M.; Hube-Magg, C.; Melling, N.; Lebok, P.; Minner, S.; Koop, C.; Graefen, M.; et al. Overexpression of thymidylate synthase (TYMS) is associated with aggressive tumor features and early PSA recurrence in prostate cancer. Oncotarget 2015, 6, 8377–8387. [Google Scholar] [CrossRef] [PubMed] [Green Version]
  73. Rahman, L.; Voeller, D.; Rahman, M.; Lipkowitz, S.; Allegra, C.; Barrett, J.C.; Kaye, F.J.; Zajac-Kaye, M. Thymidylate synthase as an oncogene: A novel role for an essential DNA synthesis enzyme. Cancer Cell 2004, 5, 341–351. [Google Scholar] [CrossRef] [Green Version]
  74. Fu, Z.; Jiao, Y.; Li, Y.; Ji, B.; Jia, B.; Liu, B. TYMS presents a novel biomarker for diagnosis and prognosis in patients with pancreatic cancer. Medicine 2019, 98, e18487. [Google Scholar] [CrossRef] [PubMed]
  75. Zhang, S.; Yan, L.; Cui, C.; Wang, Z.; Wu, J.; Zhao, M.; Dong, B.; Guan, X.; Tian, X.; Hao, C. Identification of TYMS as a promoting factor of retroperitoneal liposarcoma progression: Bioinformatics analysis and biological evidence. Oncol. Rep. 2020, 44, 565–576. [Google Scholar] [CrossRef]
  76. Mannherz, W.; Agarwal, S. Thymidine nucleotide metabolism controls human telomere length. Nat. Genet. 2023, 55, 568–580. [Google Scholar] [CrossRef]
  77. Vizcaíno, C.; Mansilla, S.; Portugal, J. Sp1 transcription factor: A long-standing target in cancer chemotherapy. Pharmacol. Ther. 2015, 152, 111–124. [Google Scholar] [CrossRef] [Green Version]
  78. Dauer, P.; Gupta, V.K.; McGinn, O.; Nomura, A.; Sharma, N.S.; Arora, N.; Giri, B.; Dudeja, V.; Saluja, A.K.; Banerjee, S. Inhibition of Sp1 prevents ER homeostasis and causes cell death by lysosomal membrane permeabilization in pancreatic cancer. Sci. Rep. 2017, 7, 1564. [Google Scholar] [CrossRef] [Green Version]
  79. Beishline, K.; Azizkhan-Clifford, J. Sp1 and the ‘hallmarks of cancer’. FEBS J. 2015, 282, 224–258. [Google Scholar] [CrossRef]
  80. Ning, R.; Meng, S.; Wang, L.; Jia, Y.; Tang, F.; Sun, H.; Zhang, Z.; Zhang, C.; Fan, X.; Xiao, B.; et al. 6 Circulating miRNAs can be used as Non-invasive Biomarkers for the Detection of Cervical Lesions. J. Cancer 2021, 12, 5106–5113. [Google Scholar] [CrossRef]
  81. Li, M.; Xiao, Y.; Liu, M.; Ning, Q.; Xiang, Z.; Zheng, X.; Tang, S.; Mo, Z. MiR-26a-5p regulates proliferation, apoptosis, migration and invasion via inhibiting hydroxysteroid dehydrogenase like-2 in cervical cancer cell. BMC Cancer 2022, 22, 876. [Google Scholar] [CrossRef]
  82. Friedman, C.F.; Hensley, M.L. Options for Adjuvant Therapy for Uterine Leiomyosarcoma. Curr. Treat. Options Oncol. 2018, 19, 7. [Google Scholar] [CrossRef]
  83. Takehara, K.; Yamashita, N.; Watanabe, R.; Teramoto, N.; Tsuda, H.; Motohashi, T.; Harano, K.; Nakanishi, T.; Tokunaga, H.; Susumu, N.; et al. Clinical status and prognostic factors in Japanese patients with uterine leiomyosarcoma. Gynecol. Oncol. 2020, 157, 115–120. [Google Scholar] [CrossRef]
  84. Look, K.Y.; Sandler, A.; Blessing, J.A.; Lucci, J.A.; Rose, P.G. Phase II trial of gemcitabine as second-line chemotherapy of uterine leiomyosarcoma: A Gynecologic Oncology Group (GOG) Study. Gynecol. Oncol. 2004, 92, 644–647. [Google Scholar] [CrossRef] [PubMed]
  85. Song, Y.; Du, Y.; Qin, C.; Liang, H.; Yang, W.; Lin, J.; Ding, M.; Han, J.; Xu, T. Gemcitabine-Resistant Biomarkers in Bladder Cancer are Associated with Tumor-Immune Microenvironment. Front. Cell Dev. Biol. 2022, 9, 809620. [Google Scholar] [CrossRef] [PubMed]
Figure 1. (A) Overlapping DEGs between uLMS and normal myometrium from GSE764, GSE36610, GSE64763, and GSE68312 datasets. (B) DEGs between uLMS and uterine leiomyomas from GSE764 and GSE64763 datasets. (C) Volcano plot with DEGs between uLMS and UCS from GSE32507 dataset.
Jpm 13 00985 g001
Figure 2. (A) Intersected DEGs between uLMS and normal myometrium and uLMS and uterine leiomyomas. (B) Overlapping DEGs between all three cohorts. NM—normal myometrium; ULM—uterine leiomyomas; UCS—uterine carcinosarcoma.
Jpm 13 00985 g002
Figure 3. (A) PPI network constructed in STRING with overlapping DEGs between uLMS and ULM. (B) PPI network constructed by Cytoscape. (C) A significant module of the network (in yellow) provided by the MCODE plug-in. (D) Cytohubba MCC module ranked the hub genes from the following network (the color correlates with the rank: red rectangles present the highest rank, followed by orange and yellow).
Jpm 13 00985 g003
Figure 4. (A) GO BP annotation of hub genes. (B) GO CC annotation of hub genes. (C) GO MF annotation of hub genes. Color matching the adjusted p-value is presented on the right side of each category.
Jpm 13 00985 g004
Figure 5. Gene co-expression network. Identified hub genes are presented in the inner circle; the outer circle is constructed of co-expressed genes. Interaction type and enriched functions of genes are presented with the corresponding colors below.
Jpm 13 00985 g005
Figure 6. Expression of the upregulated hub genes in normal and tumor tissue.
Jpm 13 00985 g006
Figure 7. Expression of the downregulated hub genes in normal and tumor tissue.
Jpm 13 00985 g007
Figure 8. Extraction of uterine leiomyosarcoma samples from TCGA-SARC using USCS Xena. The samples were extracted from the TCGA-SARC study as follows: column A presents the number of samples; column B presents the expression of the gene of interest; gender: FEMALE (column C); histological type: Leiomyosarcoma (column D); tumor tissue site: Gynecological–Uterus (column F). Columns E, G, and H present Overall survival (OS), Disease-free interval (DFI), and Disease-specific survival (DSS), respectively. OS, DFI, and DSS were correlated with the expression of the genes of interest.
Jpm 13 00985 g008
Figure 9. Overall survival of uLMS patients form TCGA-SARC compared to hub genes expression with p-values. *—presents a significant difference according to the p-value.
Jpm 13 00985 g009
Figure 10. DFI of uLMS patients form TCGA-SARC compared to the expression of TYMS and TK1. *—presents a significant difference according to the p-value.
Jpm 13 00985 g010
Figure 11. miRNA-target gene network. Yellow hexagons represent hub genes; green hexagons present miRNAs with a degree cutoff value of at least 1.0.
Jpm 13 00985 g011
Figure 12. TF-hub genes network. Yellow circles represent hub genes; blue circles present corresponding TFs.
Jpm 13 00985 g012
Figure 13. The only significant drug-gene interaction network based on NetworkAnalyst—twenty potential drugs (blue squares) reacting with TYMS (red circle).
Jpm 13 00985 g013
Table 1. Platforms, total samples, and the number of tissue-specific samples from GSE datasets used for analysis.
GSE SeriesPlatformNo. of SamplesuLMSNormal MyometriumULMUCS
GSE764GPL8026947/
GSE36610GPL7363221210//
GSE64763GPL57179252925/
GSE68312GPL64809333
GSE32507GPL6480468//14
uLMS—uterine leiomyosarcoma; ULM—uterine leiomyoma; UCS—uterine carcinosarcoma.
Table 2. GO and KEGG pathway enrichment of DEGs between uLMS and normal myometrium with a number of genes enriched in selected terms and a p-value of significance.
CategoryTermCountp-Value
GOTERM_BP_DIRECTGO:0043627~response to estrogen53.53 × 10−5
GOTERM_BP_DIRECTGO:0043066~negative regulation of the apoptotic process97.88 × 10−5
GOTERM_BP_DIRECTGO:0007568~aging61.75 × 10−4
GOTERM_BP_DIRECTGO:0003151~outflow tract morphogenesis42.91 × 10−4
GOTERM_BP_DIRECTGO:0045944~positive regulation of transcription from RNA polymerase II promoter123.09 × 10−4
GOTERM_CC_DIRECTGO:0005887~integral component of plasma membrane151.29 × 10−5
GOTERM_CC_DIRECTGO:0005886~plasma membrane281.16 × 10−4
GOTERM_CC_DIRECTGO:0009897~external side of plasma membrane82.41 × 10−4
GOTERM_CC_DIRECTGO:0005576~extracellular region162.77 × 10−4
GOTERM_CC_DIRECTGO:0070062~extracellular exosome151.39 × 10−3
GOTERM_MF_DIRECTGO:0003682~chromatin binding83.57 × 10−4
GOTERM_MF_DIRECTGO:0042802~identical protein binding148.97 × 10−4
GOTERM_MF_DIRECTGO:0005539~glycosaminoglycan binding32.49 × 10−3
GOTERM_MF_DIRECTGO:0005319~lipid transporter activity33.31 × 10−3
GOTERM_MF_DIRECTGO:0005515~protein binding465.18 × 10−3
KEGG_PATHWAYhsa05202:Transcriptional misregulation in cancer84.08 × 10−5
KEGG_PATHWAYhsa05200:Pathways in cancer101.01 × 10−2
KEGG_PATHWAYhsa05215:Prostate cancer41.23 × 10−2
KEGG_PATHWAYhsa05205:Proteoglycans in cancer51.86 × 10−2
KEGG_PATHWAYhsa00240:Pyrimidine metabolism33.38 × 10−2
Table 3. GO and KEGG pathway enrichment of DEGs between uLMS and ULM with a number of genes enriched in selected terms and a p-value of significance.
CategoryTermCountp-Value
GOTERM_BP_DIRECTGO:0008284~positive regulation of cell proliferation262 × 10−4
GOTERM_BP_DIRECTGO:0010628~positive regulation of gene expression216 × 10−6
GOTERM_BP_DIRECTGO:0007568~aging124 × 10−7
GOTERM_BP_DIRECTGO:0045944~positive regulation of transcription from RNA polymerase II promoter281 × 10−10
GOTERM_BP_DIRECTGO:0007179~transforming growth factor beta receptor signaling pathway91 × 10−10
GOTERM_CC_DIRECTGO:0005615~extracellular space401.98 × 10−7
GOTERM_CC_DIRECTGO:0005576~extracellular region381.55 × 10−10
GOTERM_CC_DIRECTGO:0005737~cytoplasm722.06 × 10−10
GOTERM_CC_DIRECTGO:0031093~platelet alpha granule lumen71.31 × 10−11
GOTERM_CC_DIRECTGO:0042383~sarcolemma81.53 × 10−11
GOTERM_MF_DIRECTGO:0005515~protein binding1341.19 × 10−10
GOTERM_MF_DIRECTGO:0005158~insulin receptor binding53.76 × 10−10
GOTERM_MF_DIRECTGO:0005178~integrin binding95.80 × 10−10
GOTERM_MF_DIRECTGO:0005509~calcium ion binding196.29 × 10−10
GOTERM_MF_DIRECTGO:0005114~type II transforming growth factor beta receptor binding46.70 × 10−10
KEGG_PATHWAYhsa05205:Proteoglycans in cancer155.27 × 10−8
KEGG_PATHWAYhsa05200:Pathways in cancer231.60 × 10−10
KEGG_PATHWAYhsa05202:Transcriptional misregulation in cancer141.62 × 10−10
KEGG_PATHWAYhsa05206:MicroRNAs in cancer156.25 × 10−10
KEGG_PATHWAYhsa05218:Melanoma73.86 × 10−12
Table 4. GO and KEGG pathway enrichment of DEGs between uLMS and UCS with a number of genes enriched in selected terms and a p-value of significance.
CategoryTermCountp-Value
GOTERM_BP_DIRECTGO:0097190~apoptotic signaling pathway91.51 × 10−4
GOTERM_BP_DIRECTGO:0043086~negative regulation of catalytic activity109.65 × 10−4
GOTERM_BP_DIRECTGO:0045214~sarcomere organization61.09 × 10−3
GOTERM_BP_DIRECTGO:0001933~negative regulation of protein phosphorylation81.48 × 10−3
GOTERM_BP_DIRECTGO:0051893~regulation of focal adhesion assembly51.50 × 10−3
GOTERM_CC_DIRECTGO:0005925~focal adhesion301.24 × 10−8
GOTERM_CC_DIRECTGO:0005829~cytosol1502.57 × 10−11
GOTERM_CC_DIRECTGO:0070062~extracellular exosome725.57 × 10−10
GOTERM_CC_DIRECTGO:0005938~cell cortex131.52 × 10−11
GOTERM_CC_DIRECTGO:0016020~membrane1062.67 × 10−11
GOTERM_MF_DIRECTGO:0005515~protein binding3271.28 × 10−5
GOTERM_MF_DIRECTGO:0003779~actin binding193.84 × 10−11
GOTERM_MF_DIRECTGO:0002020~protease binding106.18 × 10−11
GOTERM_MF_DIRECTGO:0019901~protein kinase binding231.00 × 10−3
GOTERM_MF_DIRECTGO:0070513~death domain binding34.00 × 10−3
KEGG_PATHWAYhsa04510:Focal adhesion194.01 × 10−7
KEGG_PATHWAYhsa04810:Regulation of actin cytoskeleton155.22 × 10−4
KEGG_PATHWAYhsa04270:Vascular smooth muscle contraction117.31 × 10−4
KEGG_PATHWAYhsa05135:Yersinia infection103.22 × 10−3
KEGG_PATHWAYhsa05418:Fluid shear stress and atherosclerosis103.55 × 10−3
Table 5. GO and KEGG pathway enrichment of the upregulated and downregulated overlapped DEGs between uLMS and normal myometrium and uLMS and ULM with a number of genes enriched in selected terms and a p-value of significance.
UPREGULATEDCategoryTermCountp-Value
GOTERM_BP_DIRECTGO:0051726~regulation of cell cycle35.02 × 10−3
GOTERM_BP_DIRECTGO:0044772~mitotic cell cycle phase transition29.88 × 10−3
GOTERM_BP_DIRECTGO:0071897~DNA biosynthetic process21.36 × 10−2
GOTERM_CC_DIRECTGO:0000307~cyclin-dependent protein kinase holoenzyme complex21.66 × 10−2
GOTERM_MF_DIRECTGO:0019901~protein kinase binding31.87 × 10−2
KEGG_PATHWAYhsa00240:Pyrimidine metabolism24.17 × 10−2
KEGG_PATHWAYhsa05200:Pathways in cancer35.27 × 10−2
KEGG_PATHWAYhsa01232:Nucleotide metabolism26.06 × 10−2
DOWNREGULATEDGOTERM_BP_DIRECTGO:0007568~aging57.45 × 10−5
GOTERM_BP_DIRECTGO:0045944~positive regulation of transcription from RNA polymerase II promoter92.9 × 10−4
GOTERM_BP_DIRECTGO:0043066~negative regulation of the apoptotic process69.56 × 10−4
GOTERM_CC_DIRECTGO:0005886~plasma membrane191.49 × 10−4
GOTERM_CC_DIRECTGO:0005887~integral component of plasma membrane91.03 × 10−3
GOTERM_CC_DIRECTGO:0005576~extracellular region103.14 × 10−3
GOTERM_MF_DIRECTGO:0005539~glycosaminoglycan binding38.25 × 10−4
GOTERM_MF_DIRECTGO:0003682~chromatin binding56.81 × 10−3
GOTERM_MF_DIRECTGO:0001228~transcriptional activator activity, RNA polymerase II transcription regulatory region sequence-specific binding57.28 × 10−3
KEGG_PATHWAYhsa05202:Transcriptional misregulation in cancer78.54 × 10−6
KEGG_PATHWAYhsa05200:Pathways in cancer72.18 × 10−3
KEGG_PATHWAYhsa04068:FoxO signaling pathway34.75 × 10−2
Table 6. Hub genes ranked by MCC method from Cytohubba plug-in, with the full gene names, regulation (downregulated/upregulated), and MCC score.
Gene SymbolGene NameRegulationScore
ESR1estrogen receptor 1downregulated60
FOXM1forkhead box M1upregulated55
MMP9matrix metallopeptidase 9upregulated55
IGF1insulin-like growth factor 1downregulated52
CTGFconnective tissue growth factordownregulated51
TK1thymidine kinase 1upregulated50
TYMSthymidylate synthetaseupregulated50
CKS2cyclin-dependent kinases regulatory subunit 2upregulated48
CCNE1cyclin E1upregulated30
TGFBR2transforming growth factor, beta receptor IIdownregulated26
Table 7. Candidate miRNAs targeting hub genes with the number of overlapped genes, adjusted p-values.
TermOverlapAdjusted p-ValueGenes
hsa-miR-26b-5p7/18720.0012CCNE1; CKS2; IGF1; TK1; FOXM1; TYMS; CTGF
hsa-miR-18b-5p3/1160.0029IGF1; ESR1; CTGF
hsa-miR-302a-5p3/1260.0029CKS2; IGF1; MMP9
hsa-miR-145-5p3/2380.015ESR1; CTGF; TGFBR2
hsa-miR-18a-5p3/2620.017ESR1; CTGF; TGFBR2
Table 8. List of the most significant TFs, number of overlapped genes, ranked by p- and q-values, and list of overlapped genes.
Key TFDescriptionNo. of Overlapped Genesp-Valueq-ValueList of Overlapped Genes
SP1Sp1 transcription factor76.57 × 10−101.45 × 10⁻⁸TGFBR2, FOXM1, TYMS, CTGF, MMP9, TK1, ESR1
FLI1Friend leukemia virus integration 132.16 × 10−72.28 × 10−6TGFBR2, FOXM1, CTGF
HDAC2Histone deacetylase 233.11 × 10−72.28 × 10−6CCNE1, TGFBR2, IGF1
EP300E1A binding protein p30032.93 × 10−61.36 × 10⁻⁵IGF1, CCNE1, MMP9
WT1Wilms tumor 133.09 × 10−61.36 × 10−5IGF1, CCNE1, CTGF
NCOR1Nuclear receptor corepressor 125.3 × 10−61.94 × 10−5IGF1, ESR1
STAT5BSignal transducer and activator of transcription 5B27.07 × 10−62.22 × 10⁻⁵IGF1, ESR1
ETS1V-ets erythroblastosis virus E26 oncogene homolog 1 (avian)38.3 × 10−62.28 × 10−5TGFBR2, CTGF, MMP9
TFDP1Transcription factor Dp-121.14 × 10−52.77 × 10−5CCNE1, TYMS
Disclaimer/Publisher’s Note: The statements, opinions and data contained in all publications are solely those of the individual author(s) and contributor(s) and not of MDPI and/or the editor(s). MDPI and/or the editor(s) disclaim responsibility for any injury to people or property resulting from any ideas, methods, instructions or products referred to in the content.

