
Association of Inflammatory and Metabolic Biomarkers with Mitral Annular Calcification in Type 2 Diabetes Patients
 , ,
, ,  , ,
, ,  , and
, and
Abstract
:1. Introduction
2. Materials and Methods
2.1. Patient Enrolment, Inclusion, and Exclusion Criteria
2.2. Clinical Investigations and Data Collection
- HOMA-IR = (fasting glycemia in mg/dL × insulinemia in μU/mL)/405;
- HOMA C-peptide = (fasting glycemia in mg/dL/18 × C-peptide in ng/mL × 3.003)/22.5;
- Index C-peptide = 20/[(C-peptide in ng/mL × 3003) × (fasting glycemia (mg/dL)/18)].
- The FLI formula takes into consideration the body mass index (BMI = body weight in kg/height in m2), waist circumference, triglycerides, and gamma-glutamyl transferase (GGT). Scores upwards of sixty are indicative of fatty liver. The exact formula is FLI = (e0.953*loge (triglycerides) + 0.139*BMI + 0.718*loge (GGT) + 0.053*waist circumference − 15.745)/(1 + e0.953*loge (triglycerides) + 0.139*BMI + 0.718*loge (GGT) + 0.053*waist circumference − 15.745) × 100 [36].
- The HSI score is calculated using the formula HSI = 8 × ALT/AST + BMI (+ 2 if type 2 diabetes yes, + 2 if female). A result of 36 or higher suggests the presence of NAFLD, so clinicians can use HSI to decide if an ultrasound investigation is needed [37].
- The NAFLD Liver Fat Score is assessed based on the presence of metabolic syndrome, type 2 diabetes, fasting serum insulin, fasting serum AST, and the AST/ALT ratio. A score higher than −0.64 suggests the presence of the disease. The exact formula is NAFLD-LFS = −2.89 + 1.18 × Metabolic Syndrome (Yes: 1, No: 0) + 0.45 × Type 2 Diabetes (Yes: 2, No: 0) + 0.15 × Insulin in µU/L + 0.04 × AST in U/L − 0.94 × AST/ALT [38].
2.3. Statistical Analysis
3. Results
3.1. General Clinical Patient Information
- Left ventricular ejection fraction (LVEF) = 67.14 ± 9.35%;
- Interventricular septal thickness (IVS) = 11.40 ± 1.7 mm;
- E/A = 1.09 ± 0.46 and E/e’ = 6.54 ± 1.84;
- Early diastolic filling time (EDT) = 192.88 ± 42.76 ms;
- Isovolumic relaxation time (IVRT) = 104.23 ± 18.74 ms;
- Left atrial volume indexed (LAVi) = 43.79 ± 11.84 mL/m2.
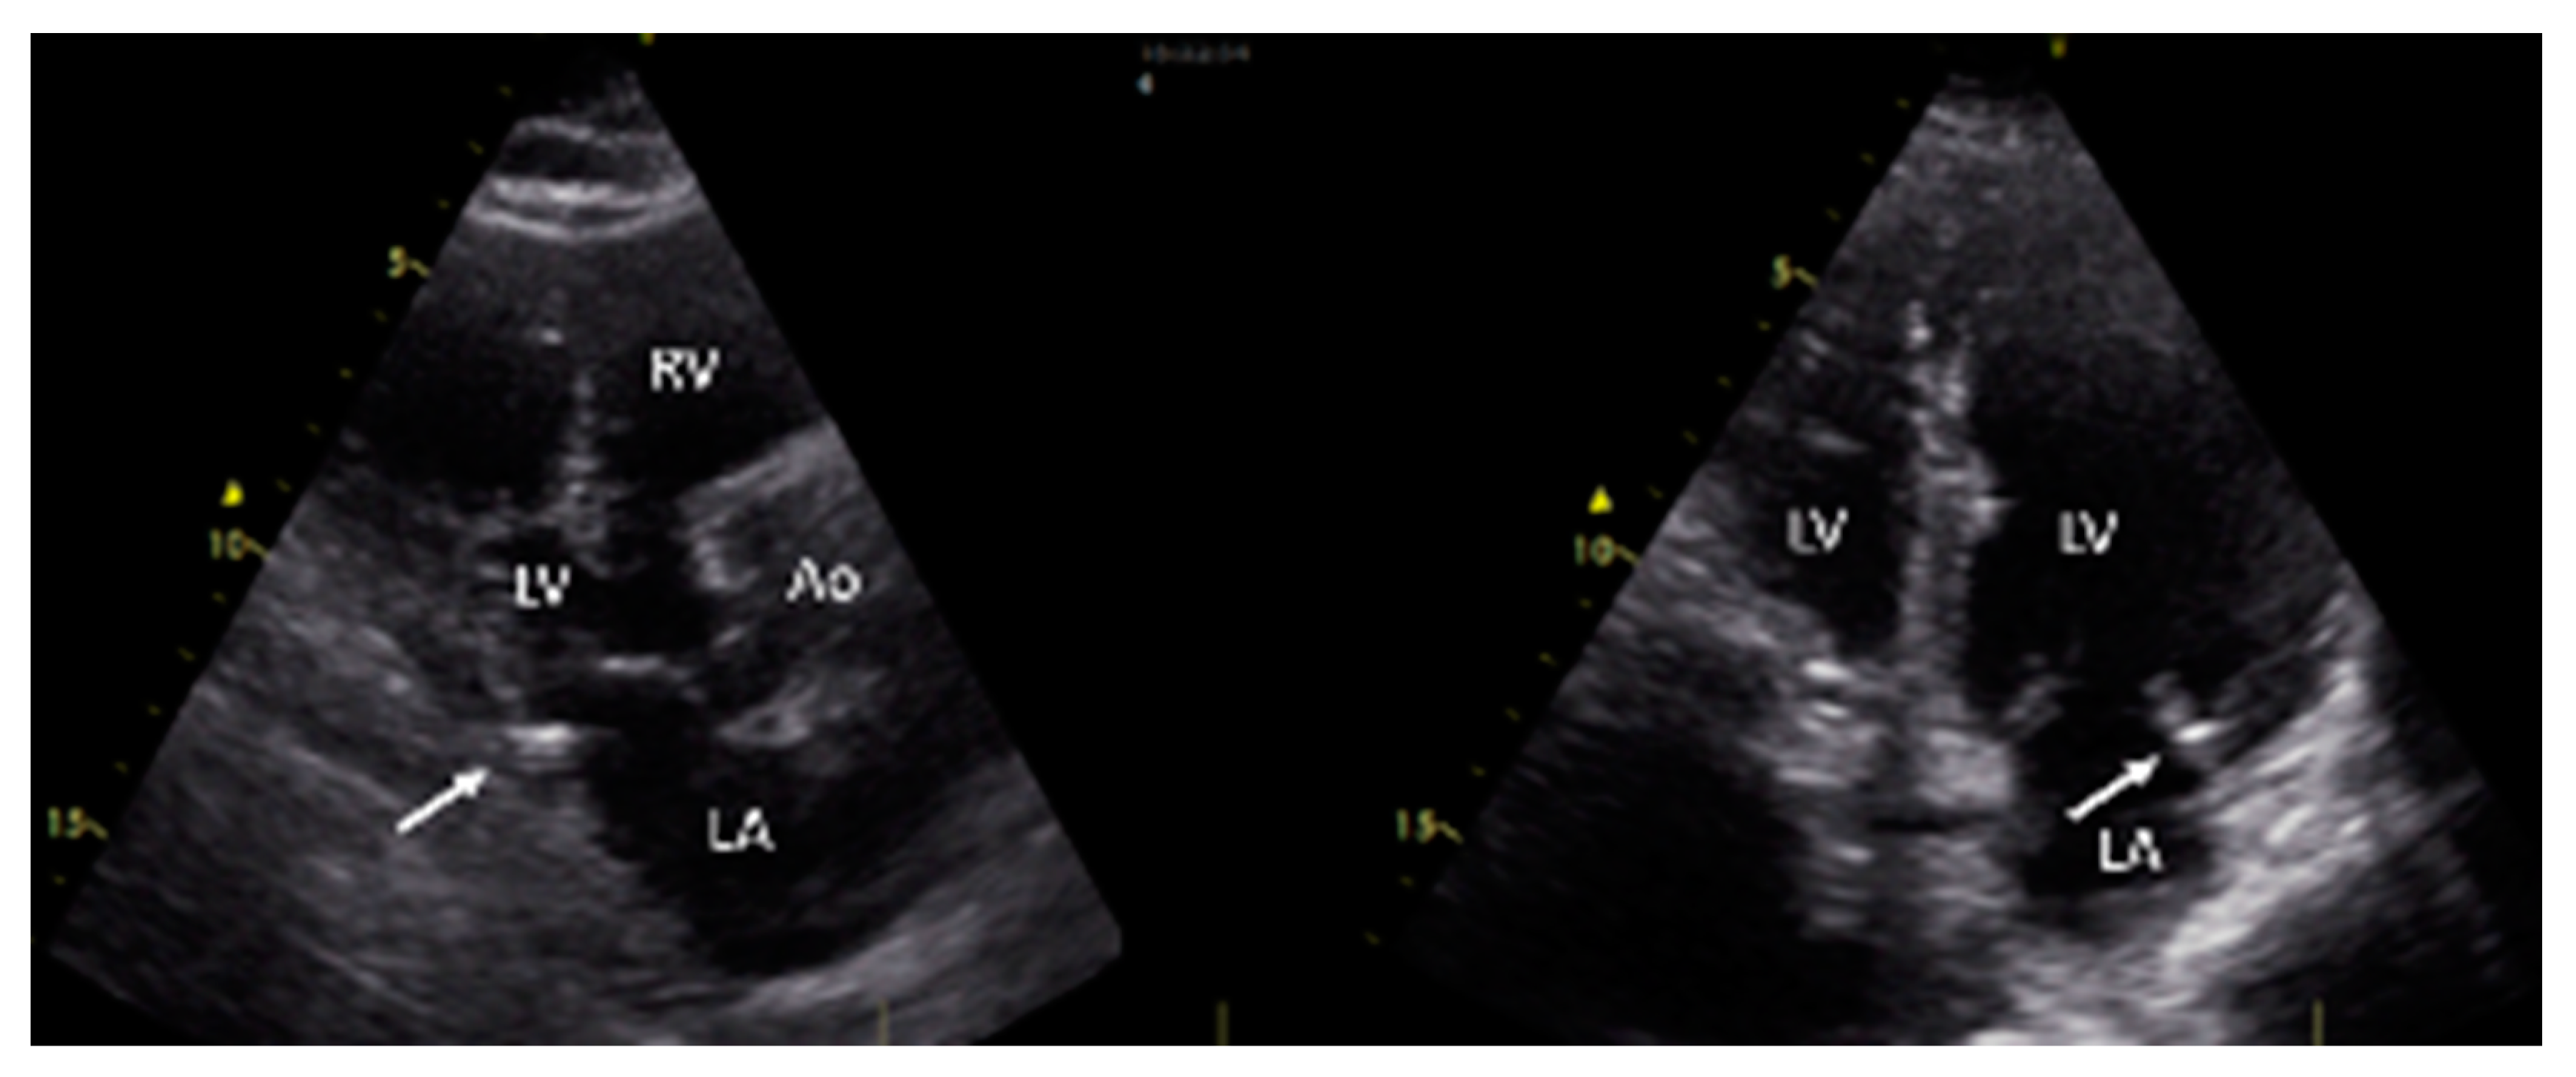
3.2. Evidence of MAC and Clinical Characteristics Based on MAC Status
3.3. Associations between Inflammation, Insulin Resistance, and Hepatic Steatosis Markers
4. Discussion
Limitations
5. Conclusions
Author Contributions
Funding
Institutional Review Board Statement
Informed Consent Statement
Data Availability Statement
Acknowledgments
Conflicts of Interest
References
- Massera, D.; Kizer, J.; Dweck, M. Mechanisms of mitral annular calcification. Trends Cardiovasc. Med. 2020, 30, 289–295. [Google Scholar] [CrossRef] [PubMed]
- Tsutsui, R.S.; Banerjee, K.; Thomas, J.D.; Kapadia, S.; Popovic, Z. Abstract 17614: Predictors of Mitral Annular Calcification Progression. Circulation 2017, 136, A17614. [Google Scholar] [CrossRef]
- Qasim, A.; Rafeek, H.; Rasania, S.; Churchill, T.; Yang, W.; Ferrari, V.; Jha, S.; Master, S.; Mulvey, C.; Terembula, K.; et al. Cardiovascular risk factors and mitral annular calcification in type 2 diabetes. Atherosclerosis 2013, 226, 419–424. [Google Scholar] [CrossRef] [PubMed]
- Boon, A.; Cheriex, E.; Lodder, J.; Kessels, F. Cardiac valve calcification: Characteristics of patients with calcification of the mitral annulus or aortic valve. Heart 1997, 78, 472–474. [Google Scholar] [CrossRef]
- Fox, C.; Vasan, R.; Parise, H.; Levy, D.; O’Donnell, C.; D’Agostino, R.; Benjamin, E. Mitral Annular Calcification Predicts Cardiovascular Morbidity and Mortality. Circulation 2003, 107, 1492–1496. [Google Scholar] [CrossRef] [PubMed]
- Rossi, A.; Targher, G.; Zoppini, G.; Cicoira, M.; Bonapace, S.; Negri, C.; Stoico, V.; Faggiano, P.; Vassanelli, C.; Bonora, E. Aortic and Mitral Annular Calcifications Are Predictive of All-Cause and Cardiovascular Mortality in Patients with Type 2 Diabetes. Diabetes Care 2012, 35, 1781–1786. [Google Scholar] [CrossRef] [PubMed]
- O’Neal, W.; Efird, J.; Nazarian, S.; Alonso, A.; Heckbert, S.; Soliman, E. Mitral annular calcification and incident atrial fibrillation in the Multi-Ethnic Study of Atherosclerosis. Europace 2014, 17, 358–363. [Google Scholar] [CrossRef]
- Kohsaka, S.; Jin, Z.; Rundek, T.; Boden-Albala, B.; Homma, S.; Sacco, R.; Di Tullio, M. Impact of Mitral Annular Calcification on Cardiovascular Events in a Multiethnic Community. JACC Cardiovasc. Imaging 2008, 1, 617–623. [Google Scholar] [CrossRef]
- Abramowitz, Y.; Jilaihawi, H.; Chakravarty, T.; Mack, M.; Makkar, R. Mitral Annulus Calcification. J. Am. Coll. Cardiol. 2015, 66, 1934–1941. [Google Scholar] [CrossRef]
- Eleid, M.; Foley, T.; Said, S.; Pislaru, S.; Rihal, C. Severe Mitral Annular Calcification. JACC Cardiovasc. Imaging 2016, 9, 1318–1337. [Google Scholar] [CrossRef]
- Higgins, J.; Mayo, J.; Skarsgard, P. Cardiac Computed Tomography Facilitates Operative Planning in Patients with Mitral Calcification. Ann. Thorac. Surg. 2013, 95, e9–e11. [Google Scholar] [CrossRef] [PubMed]
- Galiero, R.; Caturano, A.; Vetrano, E.; Cesaro, A.; Rinaldi, L.; Salvatore, T.; Marfella, R.; Sardu, C.; Moscarella, E.; Gragnano, F.; et al. Pathophysiological mechanisms and clinical evidence of relationship between Nonalcoholic fatty liver disease (NAFLD) and cardiovascular disease. Rev. Cardiovasc. Med. 2021, 22, 755. [Google Scholar] [CrossRef] [PubMed]
- Targher, G.; Bertolini, L.; Padovani, R.; Poli, F.; Scala, L.; Tessari, R.; Zenari, L.; Falezza, G. Increased prevalence of cardiovascular disease in Type 2 diabetic patients with non-alcoholic fatty liver disease. Diabet. Med. 2006, 23, 403–409. [Google Scholar] [CrossRef] [PubMed]
- Mantovani, A.; Byrne, C.; Bonora, E.; Targher, G. Nonalcoholic Fatty Liver Disease and Risk of Incident Type 2 Diabetes: A Meta-analysis. Diabetes Care 2018, 41, 372–382. [Google Scholar] [CrossRef] [PubMed]
- Faggiano, P.; Dasseni, N.; Gaibazzi, N.; Rossi, A.; Henein, M.; Pressman, G. Cardiac calcification as a marker of subclinical atherosclerosis and predictor of cardiovascular events: A review of the evidence. Eur. J. Prev. Cardiol. 2019, 26, 1191–1204. [Google Scholar] [CrossRef]
- Tanase, D.; Gosav, E.; Costea, C.; Ciocoiu, M.; Lacatusu, C.; Maranduca, M.; Ouatu, A.; Floria, M. The Intricate Relationship between Type 2 Diabetes Mellitus (T2DM), Insulin Resistance (IR), and Nonalcoholic Fatty Liver Disease (NAFLD). J. Diabetes Res. 2020, 2020, 3920196. [Google Scholar] [CrossRef]
- Matthews, D.R.; Hosker, J.P.; Rudenski, A.S.; Naylor, B.A.; Treacher, D.F.; Turner, R.C. Homeostasis model assessment: Insulin resistance and beta-cell function from fasting plasma glucose and insulin concentrations in man. Diabetologia 1985, 28, 412–419. [Google Scholar] [CrossRef]
- Bassuk, S.; Rifai, N.; Ridker, P. High-sensitivity C-reactive protein. Curr. Probl. Cardiol. 2004, 29, 439–493. [Google Scholar] [CrossRef]
- Paffen, E.; Demaat, M. C-reactive protein in atherosclerosis: A causal factor? Cardiovasc. Res. 2006, 71, 30–39. [Google Scholar] [CrossRef]
- Shrivastava, A.; Singh, H.; Raizada, A.; Singh, S. C-reactive protein, inflammation, and coronary heart disease. Egypt. Heart J. 2015, 67, 89–97. [Google Scholar] [CrossRef] [Green Version]
- Ridker, P. A Test in Context. J. Am. Coll. Cardiol. 2016, 67, 712–723. [Google Scholar] [CrossRef] [PubMed]
- Vettor, R.; Pagan, C.; Rossato, M.; Federspil, G. Cardiac and vascular effects of adipocytokines in normal and obese individuals: The concept cardiometabolic risk. In Nutritional and Metabolic Bases of Cardiovascular Disease; Mancini, M., Ed.; Wiley-Blackwell: Chichester, UK, 2011. [Google Scholar]
- Urschel, K.; Cicha, I. TNF-α in the cardiovascular system: From physiology to therapy. Int. J. Interferon Cytokine Mediat. Res. 2015, 7, 9–25. [Google Scholar]
- Chalasani, N.; Younossi, Z.; Lavine, J.; Charlton, M.; Cusi, K.; Rinella, M.; Harrison, S.; Brunt, E.; Sanyal, A. The diagnosis and management of nonalcoholic fatty liver disease: Practice guidance from the American Association for the Study of Liver Diseases. Hepatology 2017, 67, 328–357. [Google Scholar] [CrossRef] [PubMed]
- EASL–EASD–EASO Clinical Practice Guidelines for the management of non-alcoholic fatty liver disease. J. Hepatol. 2016, 64, 1388–1402. [CrossRef]
- Younossi, Z.; Golabi, P.; de Avila, L.; Paik, J.; Srishord, M.; Fukui, N.; Qiu, Y.; Burns, L.; Afendy, A.; Nader, F. The global epidemiology of NAFLD and NASH in patients with type 2 diabetes: A systematic review and meta-analysis. J. Hepatol. 2019, 71, 793–801. [Google Scholar] [CrossRef]
- Ismaiel, A.; Dumitraşcu, D. Cardiovascular Risk in Fatty Liver Disease: The Liver-Heart Axis—Literature Review. Front. Med. 2019, 6, 202. [Google Scholar] [CrossRef]
- Mantovani, A.; Beatrice, G.; Stupia, R.; Dalbeni, A. Prevalence and incidence of intra- and extrahepatic complications of NAFLD in patients with type 2 diabetes mellitus. Hepatoma Res. 2020, 6, 78. [Google Scholar] [CrossRef]
- Hassouneh, R.; Siddiqui, M.; Bhati, C. Risk of cardio-nephro-metabolic disease from NAFLD to MAFLD: Fact or fiction? Metab. Target Organ Damage 2021, 1, 4. [Google Scholar] [CrossRef]
- Cai, J.; Zhang, X.; Ji, Y.; Zhang, P.; She, Z.; Li, H. Nonalcoholic Fatty Liver Disease Pandemic Fuels the Upsurge in Cardiovascular Diseases. Circ. Res. 2020, 126, 679–704. [Google Scholar] [CrossRef]
- Mantovani, A.; Pernigo, M.; Bergamini, C.; Bonapace, S.; Lipari, P.; Valbusa, F.; Bertolini, L.; Zenari, L.; Pichiri, I.; Dauriz, M.; et al. Heart valve calcification in patients with type 2 diabetes and nonalcoholic fatty liver disease. Metabolism 2015, 64, 879–887. [Google Scholar] [CrossRef]
- Bonapace, S.; Valbusa, F.; Bertolini, L.; Pichiri, I.; Mantovani, A.; Rossi, A.; Zenari, L.; Barbieri, E.; Targher, G. Nonalcoholic Fatty Liver Disease Is Associated with Aortic Valve Sclerosis in Patients with Type 2 Diabetes Mellitus. PLoS ONE 2014, 9, e88371. [Google Scholar] [CrossRef] [PubMed]
- Cleveland, E.; Bandy, A.; VanWagner, L. Diagnostic challenges of nonalcoholic fatty liver disease/nonalcoholic steatohepatitis. Clin. Liver Dis. 2018, 11, 98–104. [Google Scholar] [CrossRef] [PubMed]
- Malek, M.; Khamseh, M.; Chehrehgosha, H.; Nobarani, S.; Alaei-Shahmiri, F. Triglyceride glucose-waist to height ratio: A novel and effective marker for identifying hepatic steatosis in individuals with type 2 diabetes mellitus. Endocrine 2021, 74, 538–545. [Google Scholar] [CrossRef] [PubMed]
- Wallace, T.; Levy, J.; Matthews, D. Use and Abuse of HOMA Modeling. Diabetes Care 2004, 27, 1487–1495. [Google Scholar] [CrossRef]
- Bedogni, G.; Bellentani, S.; Miglioli, L.; Masutti, F.; Passalacqua, M.; Castiglione, A.; Tiribelli, C. The Fatty Liver Index: A simple and accurate predictor of hepatic steatosis in the general population. BMC Gastroenterol. 2006, 6, 33. [Google Scholar] [CrossRef]
- Lee, J.; Kim, D.; Kim, H.; Lee, C.; Yang, J.; Kim, W.; Kim, Y.; Yoon, J.; Cho, S.; Sung, M.; et al. Hepatic steatosis index: A simple screening tool reflecting nonalcoholic fatty liver disease. Dig. Liver Dis. 2010, 42, 503–508. [Google Scholar] [CrossRef]
- Dyson, J.; Anstee, Q.; McPherson, S. Non-alcoholic fatty liver disease: A practical approach to diagnosis and staging. Frontline Gastroenterol. 2013, 5, 211–218. [Google Scholar] [CrossRef]
- Williams, A.; Hoofnagle, J. Ratio of Serum Aspartate to Alanine Aminotransferase in Chronic Hepatitis Relationship to Cirrhosis. Gastroenterology 1988, 95, 734–739. [Google Scholar] [CrossRef]
- Simental-Mendía, L.; Rodríguez-Morán, M.; Guerrero-Romero, F. The Product of Fasting Glucose and Triglycerides as Surrogate for Identifying Insulin Resistance in Apparently Healthy Subjects. Metab. Syndr. Relat. Disord. 2008, 6, 299–304. [Google Scholar] [CrossRef]
- Er, L.; Wu, S.; Chou, H.; Hsu, L.; Teng, M.; Sun, Y.; Ko, Y. Triglyceride Glucose-Body Mass Index Is a Simple and Clinically Useful Surrogate Marker for Insulin Resistance in Nondiabetic Individuals. PLoS ONE 2016, 11, e0149731. [Google Scholar]
- Zheng, S.; Shi, S.; Ren, X.; Han, T.; Li, Y.; Chen, Y.; Liu, W.; Hou, P.; Hu, Y. Triglyceride glucose-waist circumference, a novel and effective predictor of diabetes in first-degree relatives of type 2 diabetes patients: Cross-sectional and prospective cohort study. J. Transl. Med. 2016, 14, 260. [Google Scholar] [CrossRef] [PubMed]
- Lang, R.; Badano, L.; Mor-Avi, V.; Afilalo, J.; Armstrong, A.; Ernande, L.; Flachskampf, F.A.; Foster, E.; Goldstein, S.A.; Kuznetsova, T.; et al. Recommendations for Cardiac Chamber Quantification by Echocardiography in Adults: An Update from the American Society of Echocardiography and the European Association of Cardiovascular Imaging. J. Am. Soc. Echocardiogr. 2015, 28, 1–39.e14. [Google Scholar] [CrossRef] [PubMed] [Green Version]
- Nagueh, S.F.; Smiseth, O.A.; Appleton, C.P.; Byrd, B.F.; Dokainish, H.; Edvardsen, T.; Flachskampf, F.A.; Gillebert, T.C.; Klein, A.L.; Lancellotti, P.; et al. Recommendations for the Evaluation of Left Ventricular Diastolic Function by Echocardiography: An Update from the American Society of Echocardiography and the European Association of Cardiovascular Imaging. J. Am. Soc. Echocardiogr. 2016, 29, 277–314. [Google Scholar] [CrossRef] [PubMed]
- Lip, G.; Nieuwlaat, R.; Pisters, R.; Lane, D.; Crijns, H. Refining Clinical Risk Stratification for Predicting Stroke and Thromboembolism in Atrial Fibrillation Using a Novel Risk Factor-Based Approach. Chest 2010, 137, 263–272. [Google Scholar] [CrossRef]
- Faden, G.; Faganello, G.; De Feo, S.; Berlinghieri, N.; Tarantini, L.; Di Lenarda, A.; Faggiano, P.; Cioffi, G. The increasing detection of asymptomatic left ventricular dysfunction in patients with type 2 diabetes mellitus without overt cardiac disease: Data from the SHORTWAVE study. Diabetes Res. Clin. Pract. 2013, 101, 309–316. [Google Scholar] [CrossRef]
- Thanassoulis, G.; Massaro, J.; Cury, R.; Manders, E.; Benjamin, E.; Vasan, R.; Cupple, L.; Hoffmann, U.; O’Donnell, C.; Kathiresan, S. Associations of Long-Term and Early Adult Atherosclerosis Risk Factors with Aortic and Mitral Valve Calcium. J. Am. Coll. Cardiol. 2010, 55, 2491–2498. [Google Scholar] [CrossRef]
- Argan, O.; Avci, E.; Safak, O.; Yildirim, T. Epicardial Adipose Tissue Predicts Severe Mitral Annular Calcification in Patients Aged ≥60 Years. Med. Sci. Monit. 2020, 26, e921553. [Google Scholar] [CrossRef]
- Adler, Y.; Fink, N.; Spector, D.; Wiser, I.; Sagie, A. Mitral annulus calcification—A window to diffuse atherosclerosis of the vascular system. Atherosclerosis 2001, 155, 1–8. [Google Scholar] [CrossRef]
- Atar, S. Mitral annular calcification: A marker of severe coronary artery disease in patients under 65 years old. Heart 2003, 89, 161–164. [Google Scholar] [CrossRef]
- Carpentier, A.; Pellerin, M.; Fuzellier, J.; Relland, J. Extensive calcification of the mitral valve anulus: Pathology and surgical management. J. Thorac. Cardiovasc. Surg. 1996, 111, 718–730. [Google Scholar] [CrossRef]
- Korn, D.; DeSanctis, R.; Sell, S. Massive Calcification of the Mitral Annulus. N. Engl. J. Med. 1962, 267, 900–909. [Google Scholar] [CrossRef] [PubMed]
- Nestico, P.; Depace, N.; Morganroth, J.; Kotler, M.; Ross, J. Mitral annular calcification: Clinical, pathophysiology, and echocardiographic review. Am. Heart J. 1984, 107, 989–996. [Google Scholar] [CrossRef]
- Silva, A.; Viegas, C.; Guilherme, P.; Tavares, N.; Dias, C.; Rato, F.; Santos, N.; Faísca, M.; de Almeida, E.; Neves, P.; et al. Gla-Rich Protein, Magnesium and Phosphate Associate with Mitral and Aortic Valves Calcification in Diabetic Patients with Moderate CKD. Diagnostics 2022, 12, 496. [Google Scholar] [CrossRef] [PubMed]
- Zadhoush, F.; Pourfarzam, M.; Sadeghi, M. The difference in correlation between insulin resistance index and chronic inflammation in type 2 diabetes with and without metabolic syndrome. Adv. Biomed. Res. 2016, 5, 153. [Google Scholar] [CrossRef] [PubMed]
- Yan, Y.; Li, S.; Liu, Y.; Bazzano, L.; He, J.; Mi, J.; Chen, W. Temporal relationship between inflammation and insulin resistance and their joint effect on hyperglycemia: The Bogalusa Heart Study. Cardiovasc. Diabetol. 2019, 18, 109. [Google Scholar] [CrossRef] [PubMed]
- Kurtoğlu, E.; Korkmaz, H.; Aktürk, E.; Yılmaz, M.; Altaş, Y.; Uçkan, A. Association of Mitral Annulus Calcification with High-Sensitivity C-Reactive Protein, Which Is a Marker of Inflammation. Mediat. Inflamm. 2012, 2012, 606207. [Google Scholar] [CrossRef]
- Wang, C.; Cai, Z.; Deng, X.; Li, H.; Zhao, Z.; Guo, C.; Zhang, P.; Li, L.; Gu, T.; Yang, L.; et al. Association of Hepatic Steatosis Index and Fatty Liver Index with Carotid Atherosclerosis in Type 2 Diabetes. Int. J. Med. Sci. 2021, 18, 3280–3289. [Google Scholar] [CrossRef]
- Kanjanauthai, S.; Nasir, K.; Katz, R.; Rivera, J.; Takasu, J.; Blumenthal, R.; Eng, J.; Budoff, M. Relationships of mitral annular calcification to cardiovascular risk factors: The Multi-Ethnic Study of Atherosclerosis (MESA). Atherosclerosis 2010, 213, 558–562. [Google Scholar] [CrossRef]
- Aksoy, F.; Guler, S.; Kahraman, F.; Kuyumcu, M.; Bagcı, A.; Bas, H.; Uysal, D.; Varol, E. The Relationship Between Mitral Annular Calcification, Metabolic Syndrome and Thromboembolic Risk. Braz. J. Cardiovasc. Surg. 2019, 34, 535–541. [Google Scholar] [CrossRef]
- Hu, W.; Lin, C. Role of CHA2DS2-VASc score in predicting new-onset atrial fibrillation in patients with type 2 diabetes mellitus with and without hyperosmolar hyperglycaemic state: Real-world data from a nationwide cohort. BMJ Open 2018, 8, e020065. [Google Scholar] [CrossRef]
- Elmariah, S.; Budoff, M.; Delaney, J.; Hamirani, Y.; Eng, J.; Fuster, V.; Kronmal, R.; Halperin, J.; O’Brien, K. Risk factors associated with the incidence and progression of mitral annulus calcification: The multi-ethnic study of atherosclerosis. Am. Heart J. 2013, 166, 904–912. [Google Scholar] [CrossRef] [PubMed]
- Broeders, W.; Bekkering, S.; El Messaoudi, S.; Joosten, L.; van Royen, N.; Riksen, N. Innate immune cells in the pathophysiology of calcific aortic valve disease: Lessons to be learned from atherosclerotic cardiovascular disease? Basic Res. Cardiol. 2022, 117, 28. [Google Scholar] [CrossRef] [PubMed]
- Kraler, S.; Blaser, M.; Aikawa, E.; Camici, G.; Lüscher, T. Calcific aortic valve disease: From molecular and cellular mechanisms to medical therapy. Eur. Heart J. 2021, 43, 683–697. [Google Scholar] [CrossRef]
- Bartoli-Leonard, F.; Zimmer, J.; Aikawa, E. Innate and adaptive immunity: The understudied driving force of heart valve disease. Cardiovasc. Res. 2021, 117, 2506–2524. [Google Scholar] [CrossRef] [PubMed]
- Varol, E.; Aksoy, F.; Ozaydin, M.; Erdogan, D.; Dogan, A. Association between neutrophil–lymphocyte ratio and mitral annular calcification. Blood Coagul. Fibrinolysis 2014, 25, 557–560. [Google Scholar] [CrossRef]
- Büber, İ.; Adalı, M.; Kaya, D.; Kılıç, İ.; Yılmaz, S.; Dursunoğlu, D. The Relationship Between Mitral Annular Calcification and Controlling Nutritional Status Score. Braz. J. Cardiovasc. Surg. 2022. ahead of print. [Google Scholar] [CrossRef]
- Yayla, Ç.; Akboga, M.K.; Canpolat, U.; Gayretli Yayla, K.; Kuyumcu, M.S.; Bayraktar, F.; Suleymanoglu, M.; Aydogdu, S. The association of the platelet-to-lymphocyte ratio with mitral annular calcification. Scand. Cardiovasc. J. 2015, 49, 351–356. [Google Scholar]
- Erken Pamukcu, H.; Aker, M. Association between monocyte to HDL cholesterol ratio and mitral annulus calcification. J. Surg. Med. 2019, 3, 44–48. [Google Scholar] [CrossRef]
- Grigorescu, E.-D.; Lăcătușu, C.-M.; Crețu, I.; Floria, M.; Onofriescu, A.; Ceasovschih, A.; Mihai, B.-M.; Șorodoc, L. Self-Reported Satisfaction to Treatment, Quality of Life and General Health of Type 2 Diabetes Patients with Inadequate Glycemic Control from North-Eastern Romania. Int. J. Environ. Res. Public Health 2021, 18, 3249. [Google Scholar] [CrossRef]


| Studied Variable | Overall (N = 138) | With MAC (N = 60) | Without MAC (N = 78) | p-Value |
|---|---|---|---|---|
| General characteristics | ||||
| Age (years) | 57.86 ± 8.82 | 59.23 ± 7.37 | 56.79 ± 9.69 | 0.09 |
| Sex (male %) | 49.30 | 45 | 52.56 | 0.378 |
| BMI (kg/m2) | 32.65 ± 5.50 | 33.28 ± 5.26 | 32.16 ± 5.67 | 0.23 |
| Waist circumference (cm) | 109.13 ± 10.74 | 109.68 ± 10.20 | 108.96 ± 11.22 | 0.70 |
| Diabetes-related | ||||
| Diabetes duration * (years) | 5 (8) | 4.5 (7) | 6 (8) | 0.36 |
| Neuropathy (%) | 44.2 | 46.7 | 42.3 | 0.609 |
| HbA1c * (%) | 7.8 (1.11) | 7.8 (1.36) | 7.8 (1) | 0.55 |
| Fasting glycemia * (mg/dL) | 162 (46) | 170.50 (40) | 160 (52) | 0.22 |
| Insulin * (µIU/mL) | 11.2 (9.39) | 12.5 (10.1) | 10.40 (8.49) | 0.146 |
| C-peptide * (ng/mL) | 3.26 (2.22) | 3.38 (2.06) | 2.81 (1.46) | 0.08 |
| HOMA-IR | 5.74 ± 3.87 | 6.05 ± 3.65 | 5.50 ± 4.04 | 0.41 |
| HOMA C-peptide | 4.02 ± 2.10 | 4.48 ± 2.29 | 3.67 ± 1.89 | 0.028 ** |
| Index C-peptide * | 0.24 (0.19) | 0.20 (0.16) | 0.27 (0.21) | 0.032 ** |
| Lipid profile | ||||
| Total cholesterol (mg/dL) | 195.33 ± 46.11 | 197.93 ± 51.05 | 193.33 ± 42.16 | 0.563 |
| LDL-cholesterol (mg/dL) | 103.12 ± 38.96 | 105.29 ± 42.46 | 101.46 ± 36.23 | 0.577 |
| HDL-cholesterol (mg/dL) | 56.79 ± 15.27 | 58.28 ± 16.49 | 55.65 ± 14.26 | 0.319 |
| Triglycerides (mg/dL) | 202.57 ± 90.46 | 190.15 ± 89.20 | 212.12 ± 90.84 | 0.158 |
| TyGi | 9.64 ± 0.52 | 9.58 ± 0.49 | 9.68 ± 0.54 | 0.298 |
| TyGi-BMI | 314.75 ± 57.23 | 305.94 (60) | 306.98 (68) | 0.414 |
| TyGi-WC | 1052.87 ± 118.52 | 1050.63 ± 109.69 | 1054.60 ± 125.55 | 0.846 |
| Hepatic status | ||||
| ALT * (U/L) | 29 (18) | 30 (27) | 29 (17) | 0.667 |
| AST * (U/L) | 22 (17) | 22 (16) | 23 (18) | 0.995 |
| GGT * (U/L) | 34 (33) | 41.5 (35) | 32 (33) | 0.122 |
| FLI * | 87.71 (22) | 89.19 (20) | 88.39 (24) | 0.609 |
| HSI | 42.11 ± 6.29 | 42.70 ± 6.32 | 41.65 ± 6.27 | 0.337 |
| NAFLD-LFS | 1.51 ± 1.71 | 1.64 ± 1.51 | 1.41 ± 1.85 | 0.43 |
| BARD | 2.67 ± 1.05 | 2.60 ± 0.94 | 2.73 ± 1.13 | 0.573 |
| Kidney function | ||||
| eGFR (mL/min/1.73 m2) | 82 ± 16.37 | 78.57 ± 15.12 | 86.58 ± 19.31 | 0.009 ** |
| ACR (mg/g) | 27.14 ± 48.64 | 22.15 ± 36.49 | 31.13 ± 56.54± | 0.765 |
| Uric acid (mg/dL) | 5.48 ± 1.43 | 5.54 ± 1.44 | 5.43 ± 1.43 | 0.66 |
| Inflammation markers | ||||
| hsCRP * (mg/L) | 5.35 (9.18) | 5.11 (8.61) | 5.39 (9.11) | 0.31 |
| IL-6 (pg/mL) | 3.52 ± 4.66 | 2.83 ± 1.27 | 3.49 ± 3.08 | 0.09 |
| TNF-α (pg/mL) | 8.73 ± 7.66 | 9.28 ± 6.18 | 7.41 ± 3.30 | 0.037 ** |
| Comorbidities | ||||
| Dyslipidemia (%) | 71.7 | 78.3 | 66.7 | 0.131 |
| Hypertension (%) | 67.4 | 76.7 | 60.3 | 0.041 ** |
| Steatohepatitis (%) | 75.46 | 85 | 70.5 | 0.046 ** |
| Cardiac status | ||||
| Diastolic dysfunction (%) | 60.14 | 63.3 | 54.2 | 0.385 |
| LV ejection fraction | 67.14 ± 9.35 | 66.37 ± 8.86 | 67.73 ± 9.72 | 0.398 |
| FS (%) | 38.16 ± 7.89 | 37.30 ± 7.31 | 38.85 ± 8.30 | 0.26 |
| E/A * | 0.93 (0.68) | 0.84 (0.59) | 1.07 (0.71) | 0.072 |
| E/e’ | 6.54 | 6.28 ± 1.74 | 6.75 ± 1.90 | 0.13 |
| EDT * | 190 (58) | 192.5 (55) | 190 (59) | 0.216 |
| IVRT * | 104 (25) | 100 (25) | 105 (25) | 0.617 |
| IVS * | 11 (2) | 12 (3) | 12 (2) | 0.758 |
| LVPW * | 11 (2) | 11 (2) | 11 (2) | 0.732 |
| LAVi * | 42 (18) | 42 (19) | 40.5 (17) | 0.193 |
| CHA2DS2-VASc * | 3 (1) | 3 (1) | 2 (1) | 0.360 |
| NT-proBNP * (pg/mL) | 63 (77.1) | 49.23 (83.46) | 64 (72.57) | 0.961 |
| Variables | AUC | Standard Error | p-Value | 95% CI |
|---|---|---|---|---|
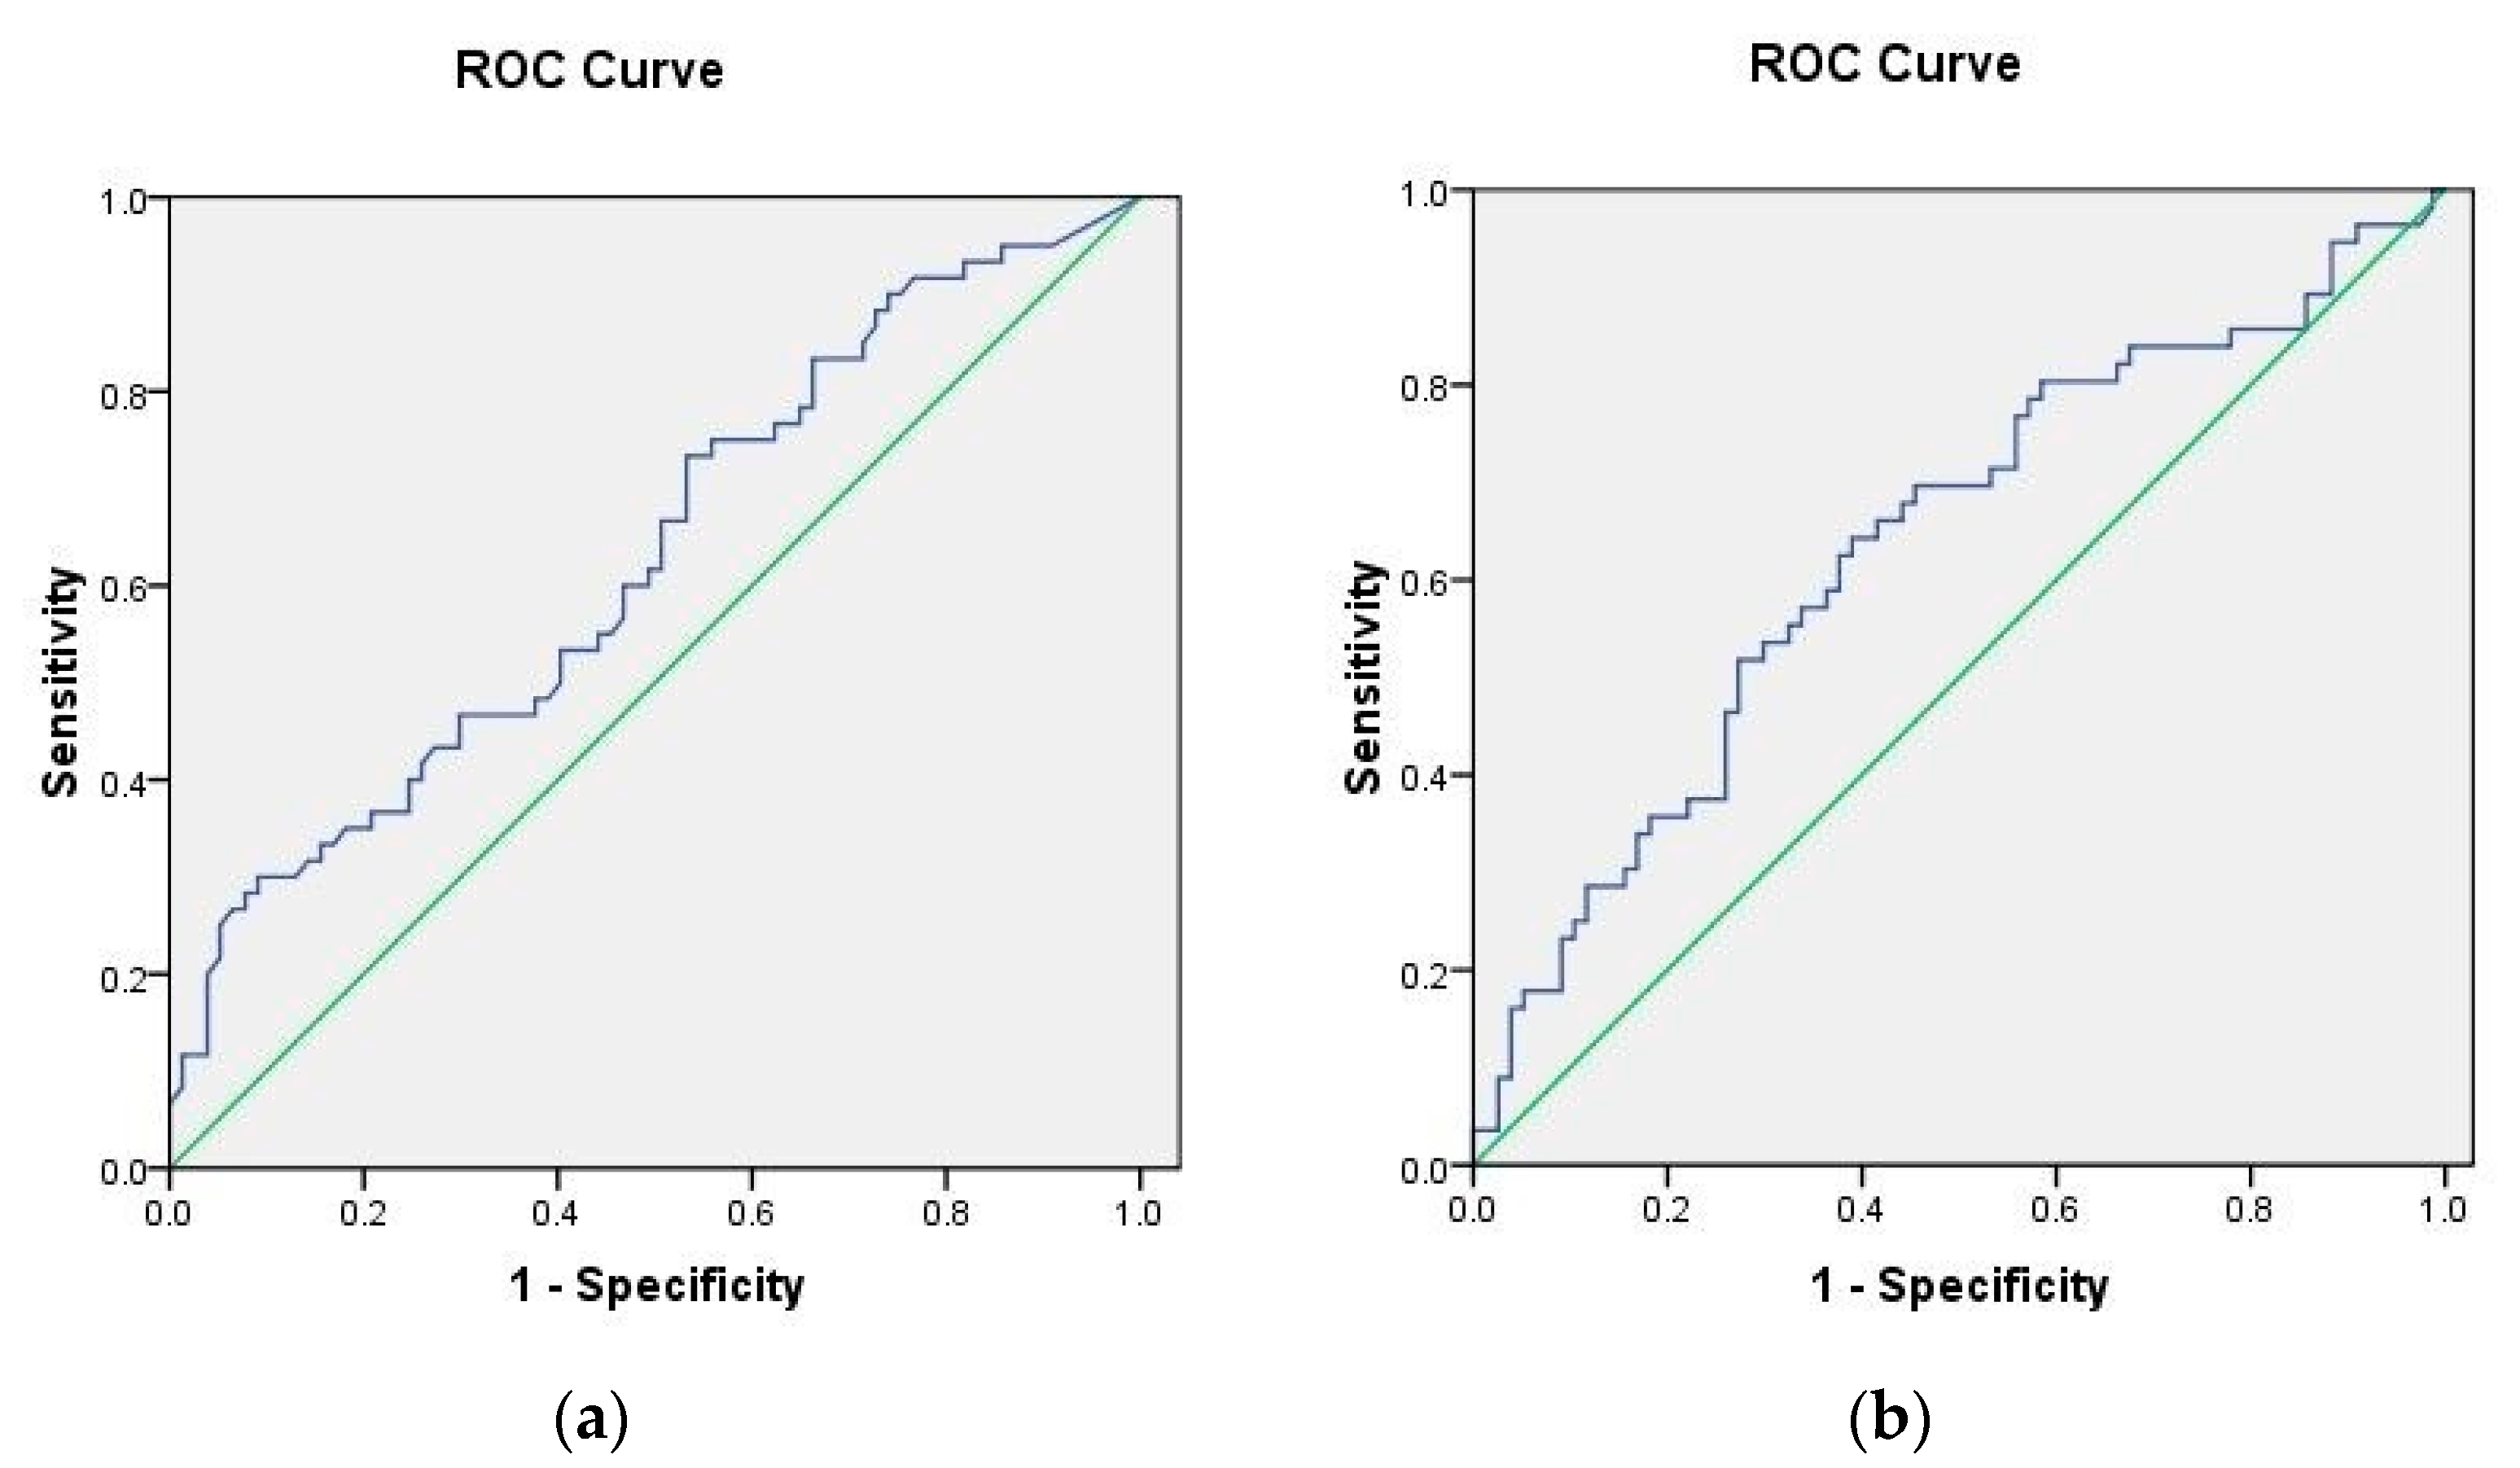
| hsCRP (mg/L) | 0.706 | 0.045 | 0.000 | 0.619–0.794 |
| IL-6 (pg/mL) | 0.626 | 0.048 | 0.011 | 0.530–0.721 |
| TNF-α (pg/mL) | 0.513 | 0.050 | 0.789 | 0.415–0.612 |
| FLI | 0.763 | 0.040 | 0.000 | 0.683–0.842 |
| HSI | 0.704 | 0.045 | 0.000 | 0.617–0.792 |
| NAFLD-LFS | 0.900 | 0.026 | 0.000 | 0.849–0.952 |
| MAC Status | FLI | NAFLD-LFS | HSI | BARD | TNF-α | IL-6 | hsCRP | HOMA-IR | HOMA C Peptide | Index C-Peptide | TyG Index | TyGi BMI | TyGi WC | |
|---|---|---|---|---|---|---|---|---|---|---|---|---|---|---|
| FLI | No | 1.000 | 0.578 ** | 0.660 ** | 0.214 | −0.059 | 0.239 * | 0.268 * | 0.569 ** | 0.482 ** | −0.480 ** | 0.387 ** | 0.833 ** | 0.837 ** |
| Yes | 1.000 | 0.507 ** | 0.541 ** | 0.172 | −0.029 | 0.144 | 0.326 * | 0.369 ** | 0.353 ** | −0.348 ** | 0.286 * | 0.825 ** | 0.842 ** | |
| NAFLD-LFS | No | 0.578 ** | 1.000 | 0.351 ** | 0.133 | 0.003 | 0.289 * | 0.347 ** | 0.768 ** | 0.526 ** | −0.248 * | 0.135 | 0.498 ** | 0.434 ** |
| Yes | 0.507 ** | 1.000 | 0.360 ** | 0.078 | 0.040 | 0.086 | 0.265 * | 0.769 ** | 0.543 ** | −0.568 ** | 0.189 | 0.335 ** | 0.397 ** | |
| HSI | No | 0.660 ** | 0.351 ** | 1.000 | 0.493 ** | 0.033 | 0.267 * | 0.361 ** | 0.445 ** | 0.305 ** | −0.305 ** | 0.132 | 0.778 ** | 0.635 ** |
| Yes | 0.541 ** | 0.360 ** | 1.000 | 0.444 ** | 0.144 | 0.128 | 0.236 | 0.266 * | 0.215 | −0.217 | −0.199 | 0.744 ** | 0.552 ** | |
| BARD | No | 0.214 | 0.133 | 0.493 ** | 1.000 | −0.006 | 0.180 | 0.188 | 0.102 | 0.041 | −0.040 | −0.015 | 0.239 * | 0.123 |
| Yes | 0.172 | 0.078 | 0.444 ** | 1.000 | 0.303 * | 0.175 | 0.140 | 0.058 | 0.028 | −0.036 | −0.126 | 0.208 | 0.129 | |
| TNF-α | No | −0.059 | 0.003 | 0.033 | −0.006 | 1.000 | 0.297 ** | −0.001 | −0.010 | 0.128 | −0.127 | 0.042 | −0.001 | −0.029 |
| Yes | −0.029 | 0.040 | 0.144 | 0.303 * | 1.000 | 0.359 ** | 0.002 | −0.032 | 0.176 | −0.182 | −0.068 | 0.037 | 0.009 | |
| IL-6 | No | 0.239 * | 0.289 * | 0.267 * | 0.180 | 0.297 ** | 1.000 | 0.495 ** | 0.188 | 0.099 | −0.100 | −0.037 | 0.280 * | 0.228 * |
| Yes | 0.144 | 0.086 | 0.128 | 0.175 | 0.359 ** | 1.000 | 0.119 | 0.159 | 0.198 | −0.199 | 0.042 | 0.182 | 0.164 | |
| hsCRP | No | 0.268 * | 0.347 ** | 0.361 ** | 0.188 | −0.001 | 0.495 ** | 1.000 | 0.317 ** | 0.196 | −0.201 | −0.051 | 0.293 * | 0.266 * |
| Yes | 0.326 * | 0.265 * | 0.236 | 0.140 | 0.002 | 0.119 | 1.000 | 0.354 ** | 0.313 * | −0.316 * | 0.346 ** | 0.346 ** | 0.305 * |
| Parameters | Coefficient r | p-Value |
|---|---|---|
| HOMA-IR | 0.331 | <0.001 |
| HOMA C-peptide | 0.256 | 0.003 |
| Index C-peptide | −0.259 | 0.002 |
| TyGi-BMI | 0.318 | <0.001 |
| TyGi-WC | 0.280 | 0.001 |
| Parameters | FLI | NAFLD-LFS | HSI |
|---|---|---|---|
| TNF-α | r = −0.037, p = NS | r = 0.04, p = NS | r = 0.198, p = 0.02 |
| IL-6 | r = 0.198, p = 0.02 | r = −0.254, p = 0.003 | r = 0.067, p = NS |
| hsCRP | r = 0.288, p = 0.001 | r = 0.323, p < 0.001 | r = 0.301, p < 0.001 |
| HOMA-IR | r = 0.482, p < 0.001 | r = 0.777, p < 0.001 | r = 0.371, p < 0.001 |
| HOMA C-peptide | r = 0.419, p < 0.001 | r = 0.583, p < 0.001 | r = 0.264, p = 0.002 |
| Index C-peptide | r = −0.418, p < 0.001 | r = −0.582, p < 0.001 | r = −0.267, p = 0.002 |
| TyGi-BMI | r = 0.826, p < 0.001 | r = 0.476, p < 0.001 | r = 0.773, p < 0.001 |
| TyGi-WC | r = 0.837, p < 0.001 | r = 0.421, p < 0.001 | r = 0.548, p < 0.001 |
| Variables | Coefficient (B) | SE | Exp (B) Odds Ratio | 95% CI | p-Value |
|---|---|---|---|---|---|
| TNF-alpha (pg/mL) | 0.118 | 0.053 | 1.125 | 1.014–1.248 | 0.026 * |
| IL-6 (pg/mL) | −0.132 | 0.091 | 0.876 | 0.733–1.04 | 0.145 |
| hsCRP (mg/L) | −0.14 | 0.019 | 0.986 | 0.950–1.02 | 0.453 |
| HOMA-IR | 0.037 | 0.044 | 1.037 | 0.957–1.132 | 0.409 |
| HOMA-C Peptide | 0.188 | 0.085 | 1.207 | 1.021–1.427 | 0.028 * |
| Index C–peptide | −0.766 | 0.689 | 0.465 | 0.120–1.792 | 0.266 |
| NTproBNP (pg/mL) | 0.001 | 0.002 | 1.001 | 0.997–1.005 | 0.609 |
| CHA2DS2VASc | 0.104 | 0.183 | 1.110 | 0.776–1.589 | 0.568 |
| Age (years) | 0.032 | 0.02 | 1.033 | 0.993–1.074 | 0.109 |
| HbA1c (%) | 0.147 | 0.173 | 1.158 | 0.826–1.624 | 0.395 |
| Hypertension | 0.773 | 0.383 | 2.167 | 1.023–4.591 | 0.04 * |
| Hepatic steatosis | 0.863 | 0.439 | 2.370 | 1.003–5.598 | 0.04 * |
| Dyslipidemia | 0.592 | 0.395 | 1.808 | 0.834–3.919 | 0.134 |
Publisher’s Note: MDPI stays neutral with regard to jurisdictional claims in published maps and institutional affiliations. |
© 2022 by the authors. Licensee MDPI, Basel, Switzerland. This article is an open access article distributed under the terms and conditions of the Creative Commons Attribution (CC BY) license (https://creativecommons.org/licenses/by/4.0/).
Share and Cite
Grigorescu, E.-D.; Lăcătușu, C.-M.; Floria, M.; Cazac, G.-D.; Onofriescu, A.; Ceasovschih, A.; Crețu, I.; Mihai, B.-M.; Șorodoc, L. Association of Inflammatory and Metabolic Biomarkers with Mitral Annular Calcification in Type 2 Diabetes Patients. J. Pers. Med. 2022, 12, 1484. https://doi.org/10.3390/jpm12091484
Grigorescu E-D, Lăcătușu C-M, Floria M, Cazac G-D, Onofriescu A, Ceasovschih A, Crețu I, Mihai B-M, Șorodoc L. Association of Inflammatory and Metabolic Biomarkers with Mitral Annular Calcification in Type 2 Diabetes Patients. Journal of Personalized Medicine. 2022; 12(9):1484. https://doi.org/10.3390/jpm12091484
Chicago/Turabian StyleGrigorescu, Elena-Daniela, Cristina-Mihaela Lăcătușu, Mariana Floria, Georgiana-Diana Cazac, Alina Onofriescu, Alexandr Ceasovschih, Ioana Crețu, Bogdan-Mircea Mihai, and Laurențiu Șorodoc. 2022. "Association of Inflammatory and Metabolic Biomarkers with Mitral Annular Calcification in Type 2 Diabetes Patients" Journal of Personalized Medicine 12, no. 9: 1484. https://doi.org/10.3390/jpm12091484