
Predictors for Returning to Paid Work after Transient Ischemic Attack and Minor Ischemic Stroke

 , , , ,
Abstract
:1. Introduction
2. Materials and Methods
2.1. Study Population & Materials
2.2. Data Analysis Section
2.2.1. Outcome Measures
2.2.2. Statistics
3. Results
4. Discussion
5. Conclusions
Supplementary Materials
Author Contributions
Funding
Institutional Review Board Statement
Informed Consent Statement
Data Availability Statement
Acknowledgments
Conflicts of Interest
References
- Niemi, M.L.; Laaksonen, R.; Kotila, M.; Waltimo, O. Quality of Life 4 Years after Stroke. Stroke 1988, 19, 1101–1107. [Google Scholar] [CrossRef] [PubMed] [Green Version]
- Saeki, S.; Toyonaga, T. Determinants of Early Return to Work after First Stroke in Japan. J. Rehabil. Med. 2010, 42, 254–258. [Google Scholar] [CrossRef] [PubMed] [Green Version]
- Aarnio, K.; Rodríguez-Pardo, J.; Siegerink, B.; Hardt, J.; Broman, J.; Tulkki, L.; Haapaniemi, E.; Kaste, M.; Tatlisumak, T.; Putaala, J. Return to Work after Ischemic Stroke in Young Adults a Registry-Based Follow-up Study. Neurology 2018, 91, e1909–e1917. [Google Scholar] [CrossRef] [PubMed] [Green Version]
- Sen, A.; Bisquera, A.; Wang, Y.; McKevitt, C.J.; Rudd, A.G.; Wolfe, C.D.; Bhalla, A. Factors, Trends, and Long-Term Outcomes for Stroke Patients Returning to Work: The South London Stroke Register. Int. J. Stroke 2019, 14, 696–705. [Google Scholar] [CrossRef]
- Brown, D.L.; Boden-Albala, B.; Langa, K.M.; Lisabeth, L.D.; Fair, M.; Smith, M.A.; Sacco, R.L.; Morgenstern, L.B. Projected Costs of Ischemic Stroke in the United States. Neurology 2006, 67, 1390–1395. [Google Scholar] [CrossRef]
- Daniel, K.; Wolfe, C.D.A.; Busch, M.A.; Mckevitt, C. What Are the Social Consequences of Stroke for Working-Aged Adults? A Systematic Review. Stroke 2009, 40, 431–440. [Google Scholar] [CrossRef]
- Annoni, J.M.; Colombo, F. Troubles Cognitifs et Comportementaux Après Lésion Cérébrale: Impact Sur La Reprise Professionnelle. Rev. Med. Suisse 2011, 7, 944–947. [Google Scholar]
- Langhammer, B.; Sunnerhagen, K.S.; Sällström, S.; Becker, F.; Stanghelle, J.K. Return to Work after Specialized Rehabilitation—An Explorative Longitudinal Study in a Cohort of Severely Disabled Persons with Stroke in Seven Countries: The Sunnaas International Network Stroke Study. Brain Behav. 2018, 8, e01055. [Google Scholar] [CrossRef]
- Palstam, A.; Westerlind, E.; Persson, H.C.; Sunnerhagen, K.S. Work-Related Predictors for Return to Work after Stroke. Acta Neurol. Scand. 2019, 139, 382–388. [Google Scholar] [CrossRef]
- Han, J.; Lee, H.I.; Shin, Y.-I.; Son, J.H.; Kim, S.-Y.; Kim, D.Y.; Sohn, M.K.; Lee, J.; Lee, S.-G.; Oh, G.-J.; et al. Factors Influencing Return to Work after Stroke: The Korean Stroke Cohort for Functioning and Rehabilitation (KOSCO) Study. BMJ Open 2019, 9, e028673. [Google Scholar] [CrossRef] [Green Version]
- Xu, T.; Zhang, J.T.; Yang, M.; Zhang, H.; Liu, W.Q.; Kong, Y.; Xu, T.; Zhang, Y.H. Dyslipidemia and Outcome in Patients with Acute Ischemic Stroke. Biomed. Environ. Sci. 2014, 27, 106–110. [Google Scholar] [CrossRef]
- Sim, J.; Hwang, S.; Song, C. Hyperlipidemia as a Predictor of Physical Functioning for Stroke. Phys. Ther. Rehabil. Sci. 2018, 7, 88–93. [Google Scholar] [CrossRef] [Green Version]
- Tanaka, H.; Toyonaga, T.; Hashimoto, H. Functional and Occupational Characteristics Associated with Very Early Return to Work after Stroke in Japan. Arch. Phys. Med. Rehabil. 2011, 92, 743–748. [Google Scholar] [CrossRef]
- Catalina-Romero, C.; Ruilope, L.M.; Sánchez-Chaparro, M.A.; Valdivielso, P.; Cabrera-Sierra, M.; Fernández-Labandera, C.; Ruiz-Moraga, M.; Gonzalez-Quintela, A.; Calvo-Bonacho, E. Factors Influencing Return-to-Work after Cerebrovascular Disease: The Importance of Previous Cardiovascular Risk. Eur. J. Prev. Cardiol. 2015, 22, 1220–1227. [Google Scholar] [CrossRef]
- Gorelick, P.B. Epidemiology of Transient Ischemic Attack and Ischemic Stroke in Patients with Underlying Cardiovascular Disease. Clin. Cardiol. 2004, 27, 4–11. [Google Scholar] [CrossRef] [Green Version]
- Radman, N.; Staub, F.; Aboulafia-Brakha, T.; Berney, A.; Bogousslavsky, J.; Annoni, J.M. Poststroke Fatigue Following Minor Infarcts A Prospective Study. Neurology 2012, 79, 1422–1427. [Google Scholar] [CrossRef]
- Maaijwee, N.A.M.M.; Rutten-Jacobs, L.C.A.; Arntz, R.M.; Schaapsmeerders, P.; Schoonderwaldt, H.C.; van Dijk, E.J.; de Leeuw, F.-E. Long-Term Increased Risk of Unemployment after Young Stroke: A Long-Term Follow-up Study. Neurology 2014, 83, 1132–1138. [Google Scholar] [CrossRef]
- Carlsson, G.E.; Möller, A.; Blomstrand, C. Consequences of Mild Stroke in Persons Less than 75 Years: A 1-Year Follow-Up. Cerebrovasc. Dis. 2003, 16, 383–388. [Google Scholar] [CrossRef]
- Adams, H.; Bendixen, B.; Kappelle, L.; Biller, J.; Love, B.; Gordon, D.; Marsh, E. Classification of Subtype of Acute Ischemic Stroke. Stroke 1993, 24, 35–41. [Google Scholar] [CrossRef] [Green Version]
- Gravetter, F.J.; Wallnau, L.B. Essentials of Statistics for the Behavioral Sciences, 8th ed.; Cengage Learning: Boston, MA, USA, 2013; ISBN 9781133956570. [Google Scholar]
- Mair, P.; Wilcox, R. Robust Statistical Methods in R Using the WRS2 Package. Behav. Res. Methods 2020, 52, 464–488. [Google Scholar] [CrossRef]
- Tingley, D.; Yamamoto, T.; Hirose, K.; Keele, L.; Imai, K. Mediation: R Package for Causal Mediation Analysis. J. Stat. Softw. 2014, 59, 1–38. [Google Scholar] [CrossRef] [Green Version]
- Karnath, H.-O.; Sperber, C.; Wiesen, D.; de Haan, B. Lesion-Behavior Mapping in Cognitive Neuroscience: A Practical Guide to Univariate and Multivariate Approaches. In Spatial Learning and Attention Guidance; Pollmann, S., Ed.; Humana Press: New York, NY, YSA, 2019; pp. 1–37. [Google Scholar]
- Bates, E.; Wilson, S.M.; Saygin, A.P.; Dick, F.; Sereno, M.I.; Knight, R.T.; Dronker, N.F. Voxel-Based Lesion-Symptom Mapping. Nat. Neurosci. 2003, 6, 448–450. [Google Scholar] [CrossRef]
- De Haan, B.; Clas, P.; Juenger, H.; Wilke, M.; Karnath, H.O. Fast Semi-Automated Lesion Demarcation in Stroke. NeuroImage Clin. 2015, 9, 69–74. [Google Scholar] [CrossRef]
- Rorden, C.; Bonilha, L.; Fridriksson, J.; Bender, B.; Karnath, H.O. Age-Specific CT and MRI Templates for Spatial Normalization. Neuroimage 2012, 61, 957–965. [Google Scholar] [CrossRef] [Green Version]
- Tibæk, M.; Kammersgaard, L.P.; Johnsen, S.P.; Dehlendorff, C.; Forchhammer, H.B. Long-Term Return to Work After Acquired Brain Injury in Young Danish Adults: A Nation-Wide Registry-Based Cohort Study. Front. Neurol. 2019, 9, 1180. [Google Scholar] [CrossRef] [Green Version]
- Bergheanu, S.C.; Bodde, M.C.; Jukema, J.W. Pathophysiology and Treatment of Atherosclerosis: Current View and Future Perspective on Lipoprotein Modification Treatment. Neth. Hearth J. 2017, 25, 231–242. [Google Scholar] [CrossRef] [Green Version]
- Sacco, R.L.; Diener, H.C.; Yusuf, S.; Cotton, D.; Ôunpuu, S.; Lawton, W.A.; Palesch, Y.; Martin, R.H.; Albers, G.W.; Bath, P.; et al. Aspirin and Extended-Release Dipyridamole versus Clopidogrel for Recurrent Stroke. N. Engl. J. Med. 2008, 359, 1238–1251. [Google Scholar] [CrossRef]
- Horenstein, R.B.; Smith, D.E.; Mosca, L. Cholesterol Predicts Stroke Mortality in the Women’s Pooling Project. Stroke 2002, 33, 1863–1868. [Google Scholar] [CrossRef] [Green Version]
- Zeljkovic, A.; Vekic, J.; Spasojevic-Kalimanovska, V.; Jelic-Ivanovic, Z.; Bogavac-Stanojevic, N.; Gulan, B.; Spasic, S. LDL and HDL Subclasses in Acute Ischemic Stroke: Prediction of Risk and Short-Term Mortality. Atherosclerosis 2010, 210, 548–554. [Google Scholar] [CrossRef]
- Austin, P.C.; Steyerberg, E.W. The Number of Subjects per Variable Required in Linear Regression Analyses. J. Clin. Epidemiol. 2015, 68, 627–636. [Google Scholar] [CrossRef] [Green Version]
- Amarenco, P.; Bogousslavsky, J.; Callahan, A.; Goldstein, L.B.; Hennerici, M.; Rudolph, A.E.; Sillesen, H.; Simunovic, L.; Szarek, M.; Welch, K.M.A.; et al. High-Dose Atorvastatin after Stroke or Transient Ischemic Attack. N. Engl. J. Med. 2006, 355, 549–559. [Google Scholar] [CrossRef] [PubMed]
- Lakhan, S.E.; Bagchi, S.; Hofer, M. Statins and Clinical Outcome of Acute Ischemic Stroke: A Systematic Review. Int. Arch. Med. 2010, 3, 22. [Google Scholar] [CrossRef] [PubMed] [Green Version]
- Moonis, M.; Kumar, R.; Henninger, N.; Kane, K.; Fisher, M. Pre and Post-Stroke Use of Statins Improves Stroke Outcome. Indian, J. Community Med. 2014, 39, 214–217. [Google Scholar] [CrossRef] [PubMed]
- Gladstone, D.J.; Black, S.E.; Hakim, A.M. Comments, Opinions, and Reviews Toward Wisdom from Failure Lessons From Neuroprotective Stroke Trials and New Therapeutic Directions. Stroke 2002, 33, 2123–2136. [Google Scholar] [CrossRef] [PubMed]


| Overall | NoRTpW | RTpW | Statistics | |
|---|---|---|---|---|
| Demographics | ||||
| Gender | p = 0.55, φ = 0.06 | |||
| Male | 62 | 25 | 37 | |
| Female | 26 | 13 | 13 | |
| Age | 54.00/10.50 | 53.00/9 | 54.00/14 | p = 0.64, r = 0.05 |
| Cardiovascular risk factors and comorbidities | ||||
| Hyperlipidemia | p = 0.01, φ = 0.29 | |||
| No | 24 | 5 | 19 | |
| Yes | 58 | 32 | 26 | |
| LDL Cholesterol | 3.56 ± 0.99 | 3.60 ± 0.97 | 3.53 ± 1.02 | p = 0.76, g = 0.07 |
| TSH | 2.07/1.67 | 2.06/1.31 | 2.14/1.75 | p = 0.93, r = 0.01 |
| Cerebrovascular event | ||||
| NIHSS onset | 0.57 ± 0.71 | 1.10 ± 1.00 | 0.32 ± 0.48 | B: p = 0.04 |
| NIHSS 3m | 0.00 ± 0.00 | 0.21 ± 0.42 | 0.00 ± 0.00 | W: p = 0.00 |
| I: p = 0.16 | ||||
| MoCA onset | 26.67 ± 1.58 | 26.43 ± 1.53 | 26.84 ± 1.70 | B: p = 0.37 |
| MoCA 3m | 26.26 ± 1.21 | 26.05 ± 1.29 | 26.44 ± 1.28 | W: p = 0.16 |
| I: p = 0.62 | ||||
| HAD onset | 10.06 ± 3.03 | 10.32 ± 3.54 | 9.89 ± 2.71 | B: p = 0.01 |
| HAD 3m | 10.65 ± 3.94 | 14.27 ± 4.18 | 7.52 ± 2.86 | W: p = 0.14 |
| I: p = 0.00 | ||||
| FIS Cognitive onset | 26.36 ± 13.22 | 29.75 ± 15.97 | 24.17 ± 11.63 | B: p = 0.00 |
| FIS Cognitive 3m | 42.43 ± 19.04 | 65.24 ± 15.93 | 24.89 ± 12.64 | W: p = 0.00 |
| I: p = 0.00 | ||||
| FIS Physical onset | 30.74 ± 13.25 | 35.25 ± 17.84 | 28.02 ± 10.05 | B: p = 0.00 |
| FIS Physical 3m | 46.86 ± 15.09 | 60.53 ± 8.24 | 31.36 ± 13.40 | W: p = 0.01 |
| I: p = 0.03 | ||||
| FIS Psychosocial onset | 27.41 ± 9.99 | 31.06 ± 11.64 | 25.05 ± 9.76 | B: p = 0.00 |
| FIS Psychosocial 3m | 40.28 ± 16.73 | 58.03 ± 9.66 | 23.07 ± 12.33 | W: p = 0.00 |
| I: p = 0.00 | ||||
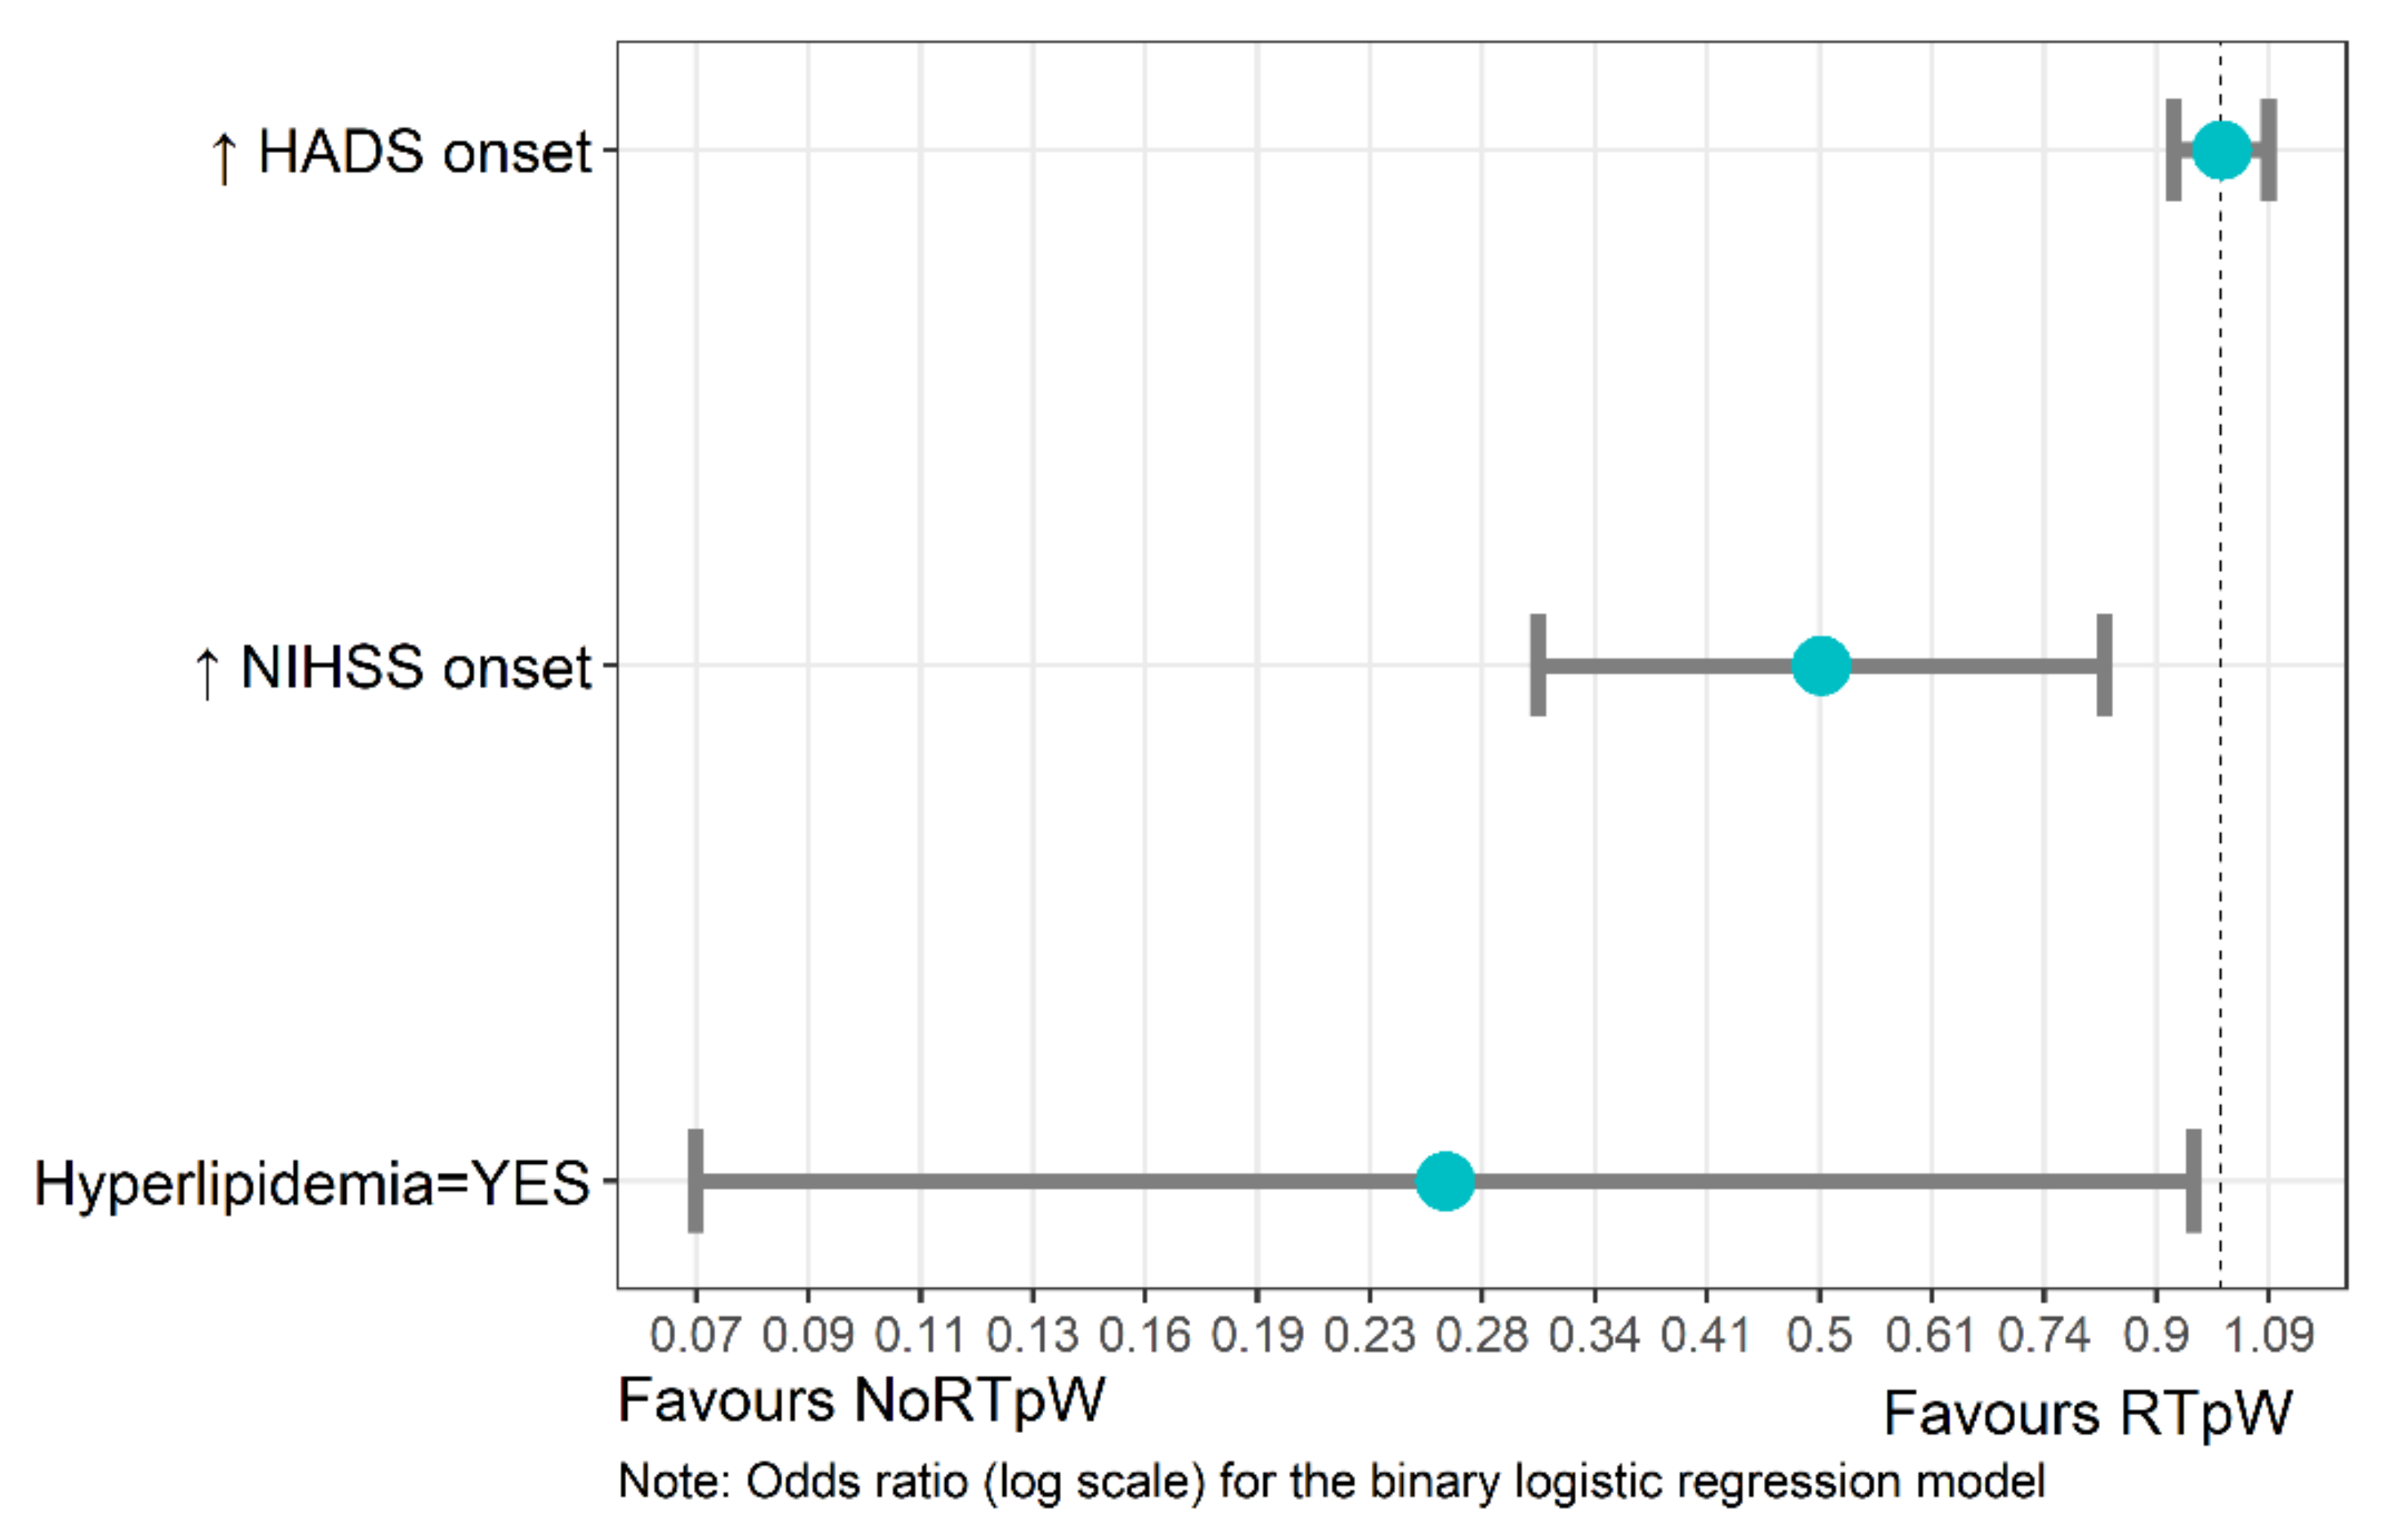
| B | SE | Z Value | p-Value | Odds Ratios [95% CI] | |
|---|---|---|---|---|---|
| Constant | 1.83 | 0.83 | 2.19 | 0.03 * | 6.22 [1.21–31.97] |
| Hyperlipidemia (YES) | −1.33 | 0.66 | −2.03 | 0.04 * | 0.27 [0.07–0.95] |
| NIHSS onset | −0.69 | 0.25 | −2.76 | 0.01 ** | 0.50 [0.31–0.82] |
| HAD onset | −0.00 | 0.04 | 0.03 | 0.97 | 1.0 [0.92–1.09] |
| Estimate | SE | Z Value | p-Value | 95% CI | ||
|---|---|---|---|---|---|---|
| Lower | Upper | |||||
| Constant | −0.46 | 0.45 | −1.02 | 0.31 | −1.43 | 0.46 |
| Hyperlipidemia (YES) | 0.74 | 0.35 | 2.09 | 0.04 * | 0.02 | 1.48 |
| NIHSS onset | 0.22 | 0.12 | 1.83 | 0.07 | −0.02 | 0.48 |
| HAD onset | 0.04 | 0.02 | 1.95 | 0.05 | 0.00 | 0.08 |
Publisher’s Note: MDPI stays neutral with regard to jurisdictional claims in published maps and institutional affiliations. |
© 2022 by the authors. Licensee MDPI, Basel, Switzerland. This article is an open access article distributed under the terms and conditions of the Creative Commons Attribution (CC BY) license (https://creativecommons.org/licenses/by/4.0/).
Share and Cite
Wicht, C.A.; Chavan, C.F.; Annoni, J.-M.; Balmer, P.; Aellen, J.; Humm, A.M.; Crettaz von Roten, F.; Spierer, L.; Medlin, F. Predictors for Returning to Paid Work after Transient Ischemic Attack and Minor Ischemic Stroke. J. Pers. Med. 2022, 12, 1109. https://doi.org/10.3390/jpm12071109
Wicht CA, Chavan CF, Annoni J-M, Balmer P, Aellen J, Humm AM, Crettaz von Roten F, Spierer L, Medlin F. Predictors for Returning to Paid Work after Transient Ischemic Attack and Minor Ischemic Stroke. Journal of Personalized Medicine. 2022; 12(7):1109. https://doi.org/10.3390/jpm12071109
Chicago/Turabian StyleWicht, Corentin A., Camille F. Chavan, Jean-Marie Annoni, Philippe Balmer, Jérôme Aellen, Andrea M. Humm, Fabienne Crettaz von Roten, Lucas Spierer, and Friedrich Medlin. 2022. "Predictors for Returning to Paid Work after Transient Ischemic Attack and Minor Ischemic Stroke" Journal of Personalized Medicine 12, no. 7: 1109. https://doi.org/10.3390/jpm12071109