
Increased Orbital Muscle Fraction Diagnosed by Semi-Automatic Volumetry: A Risk Factor for Severe Visual Impairment with Excellent Response to Surgical Decompression in Graves’ Orbitopathy

 , ,
, ,
Abstract
:1. Introduction
2. Patients and Methods
2.1. Study Design and Patient Population
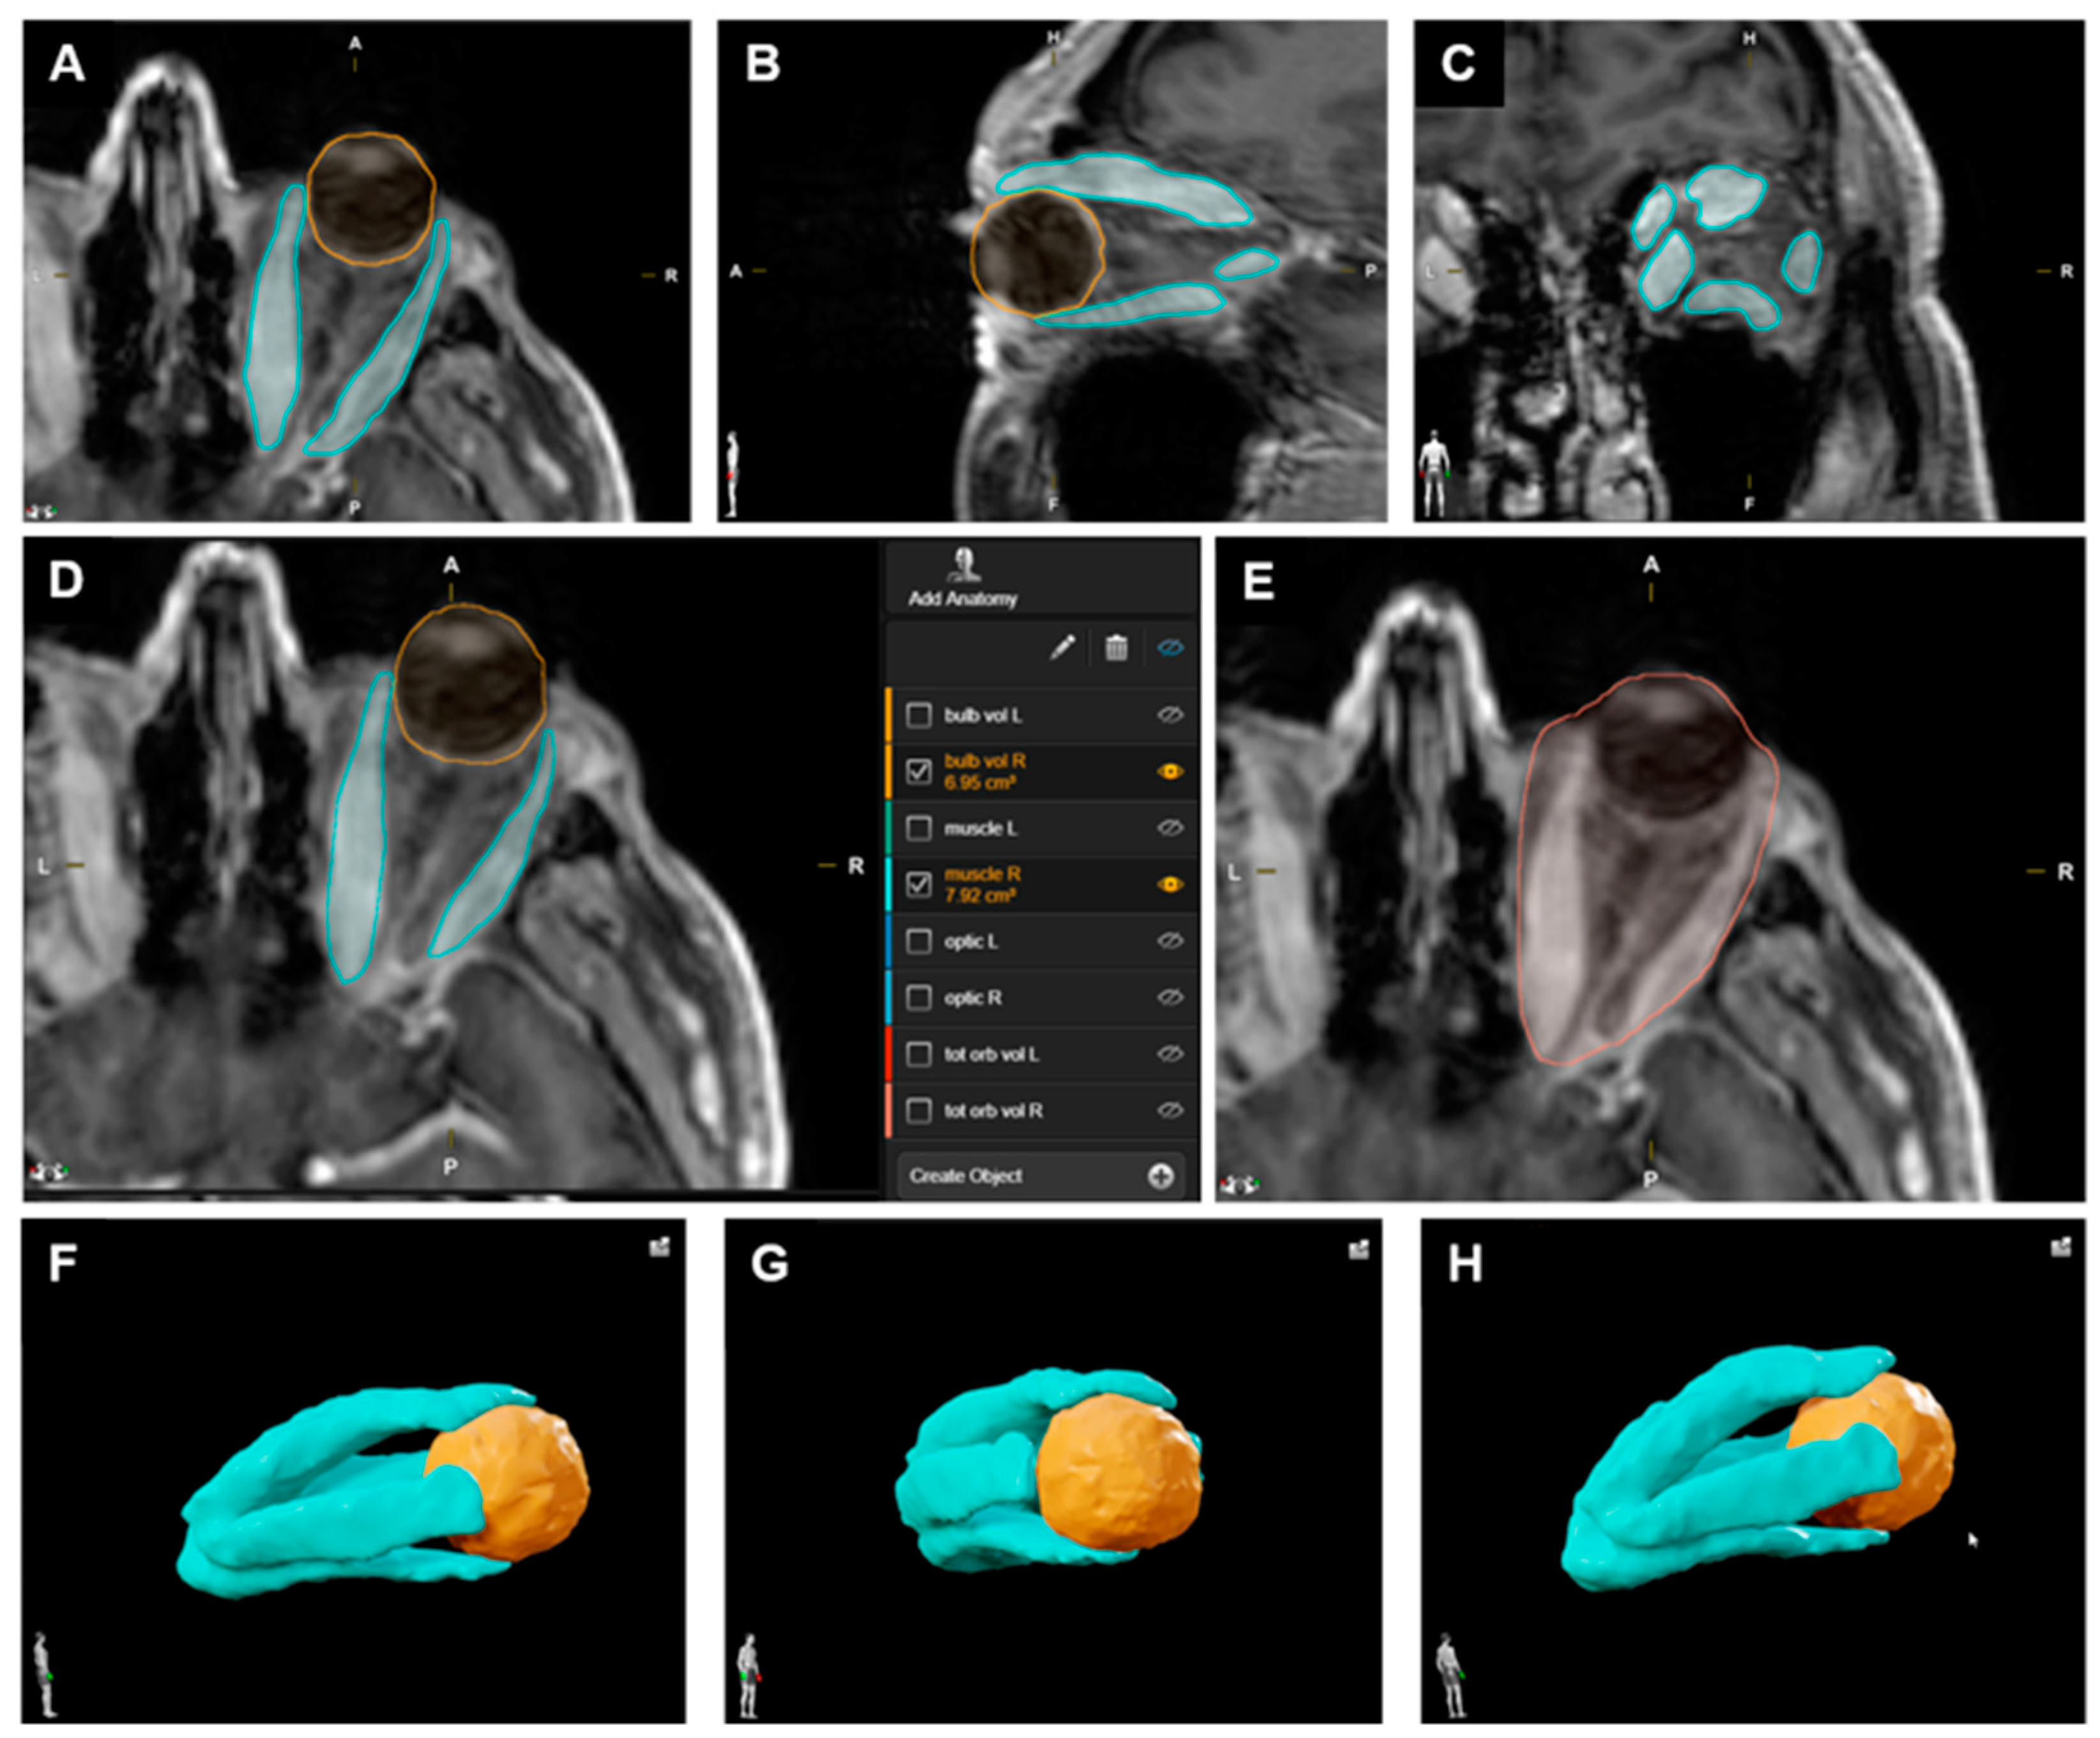
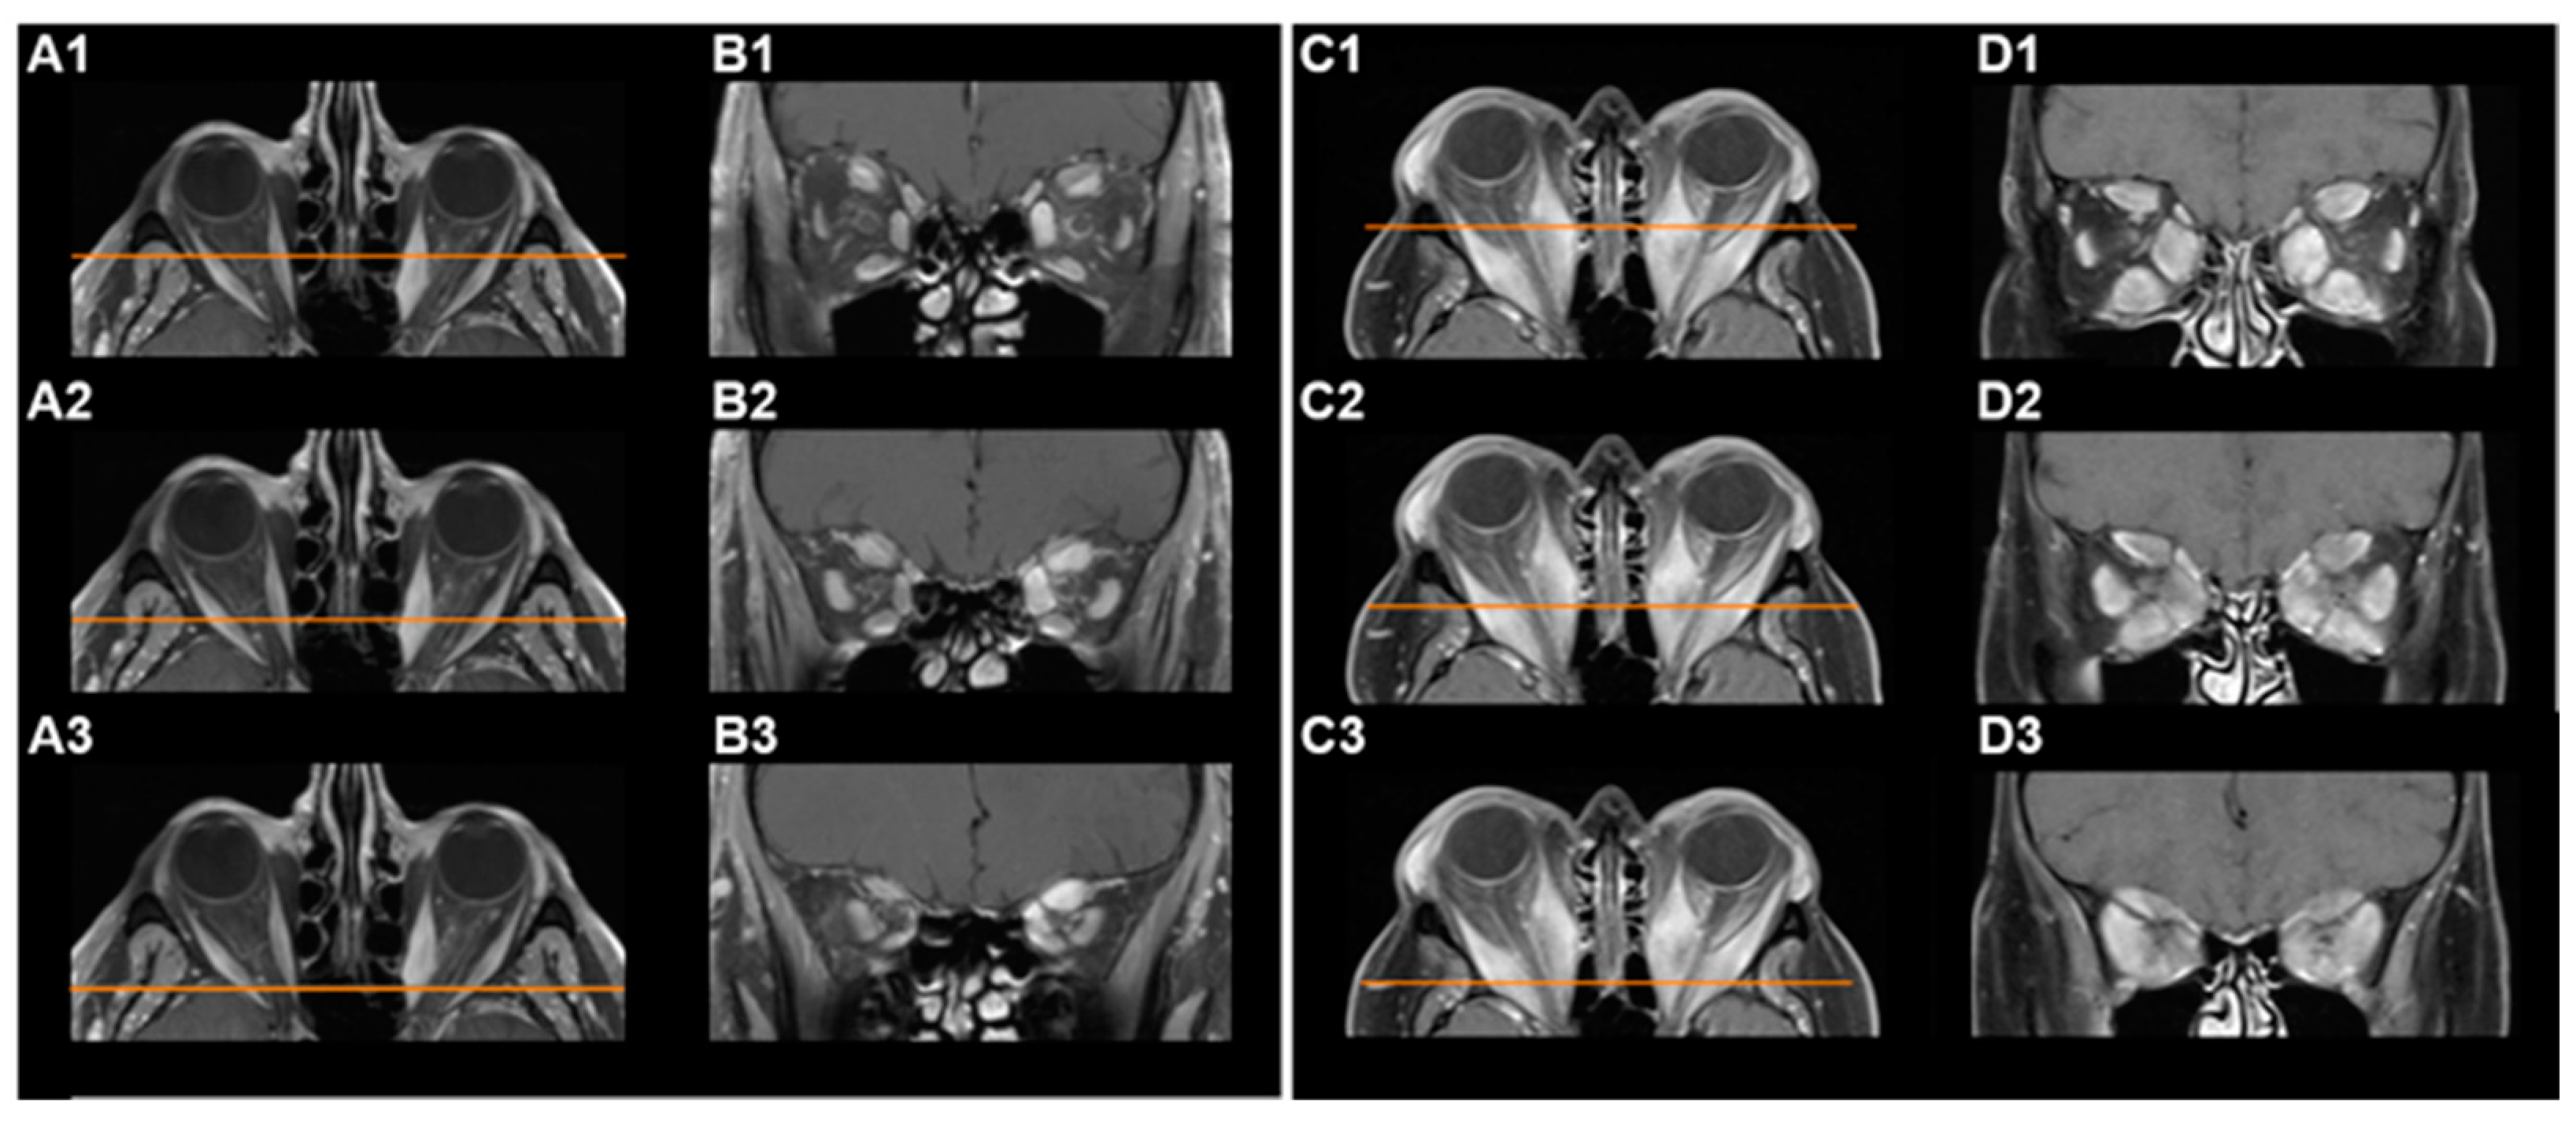
2.2. Volumetric Analysis
2.3. Ophthalmological Outcome
2.4. Statistical Analysis
3. Results
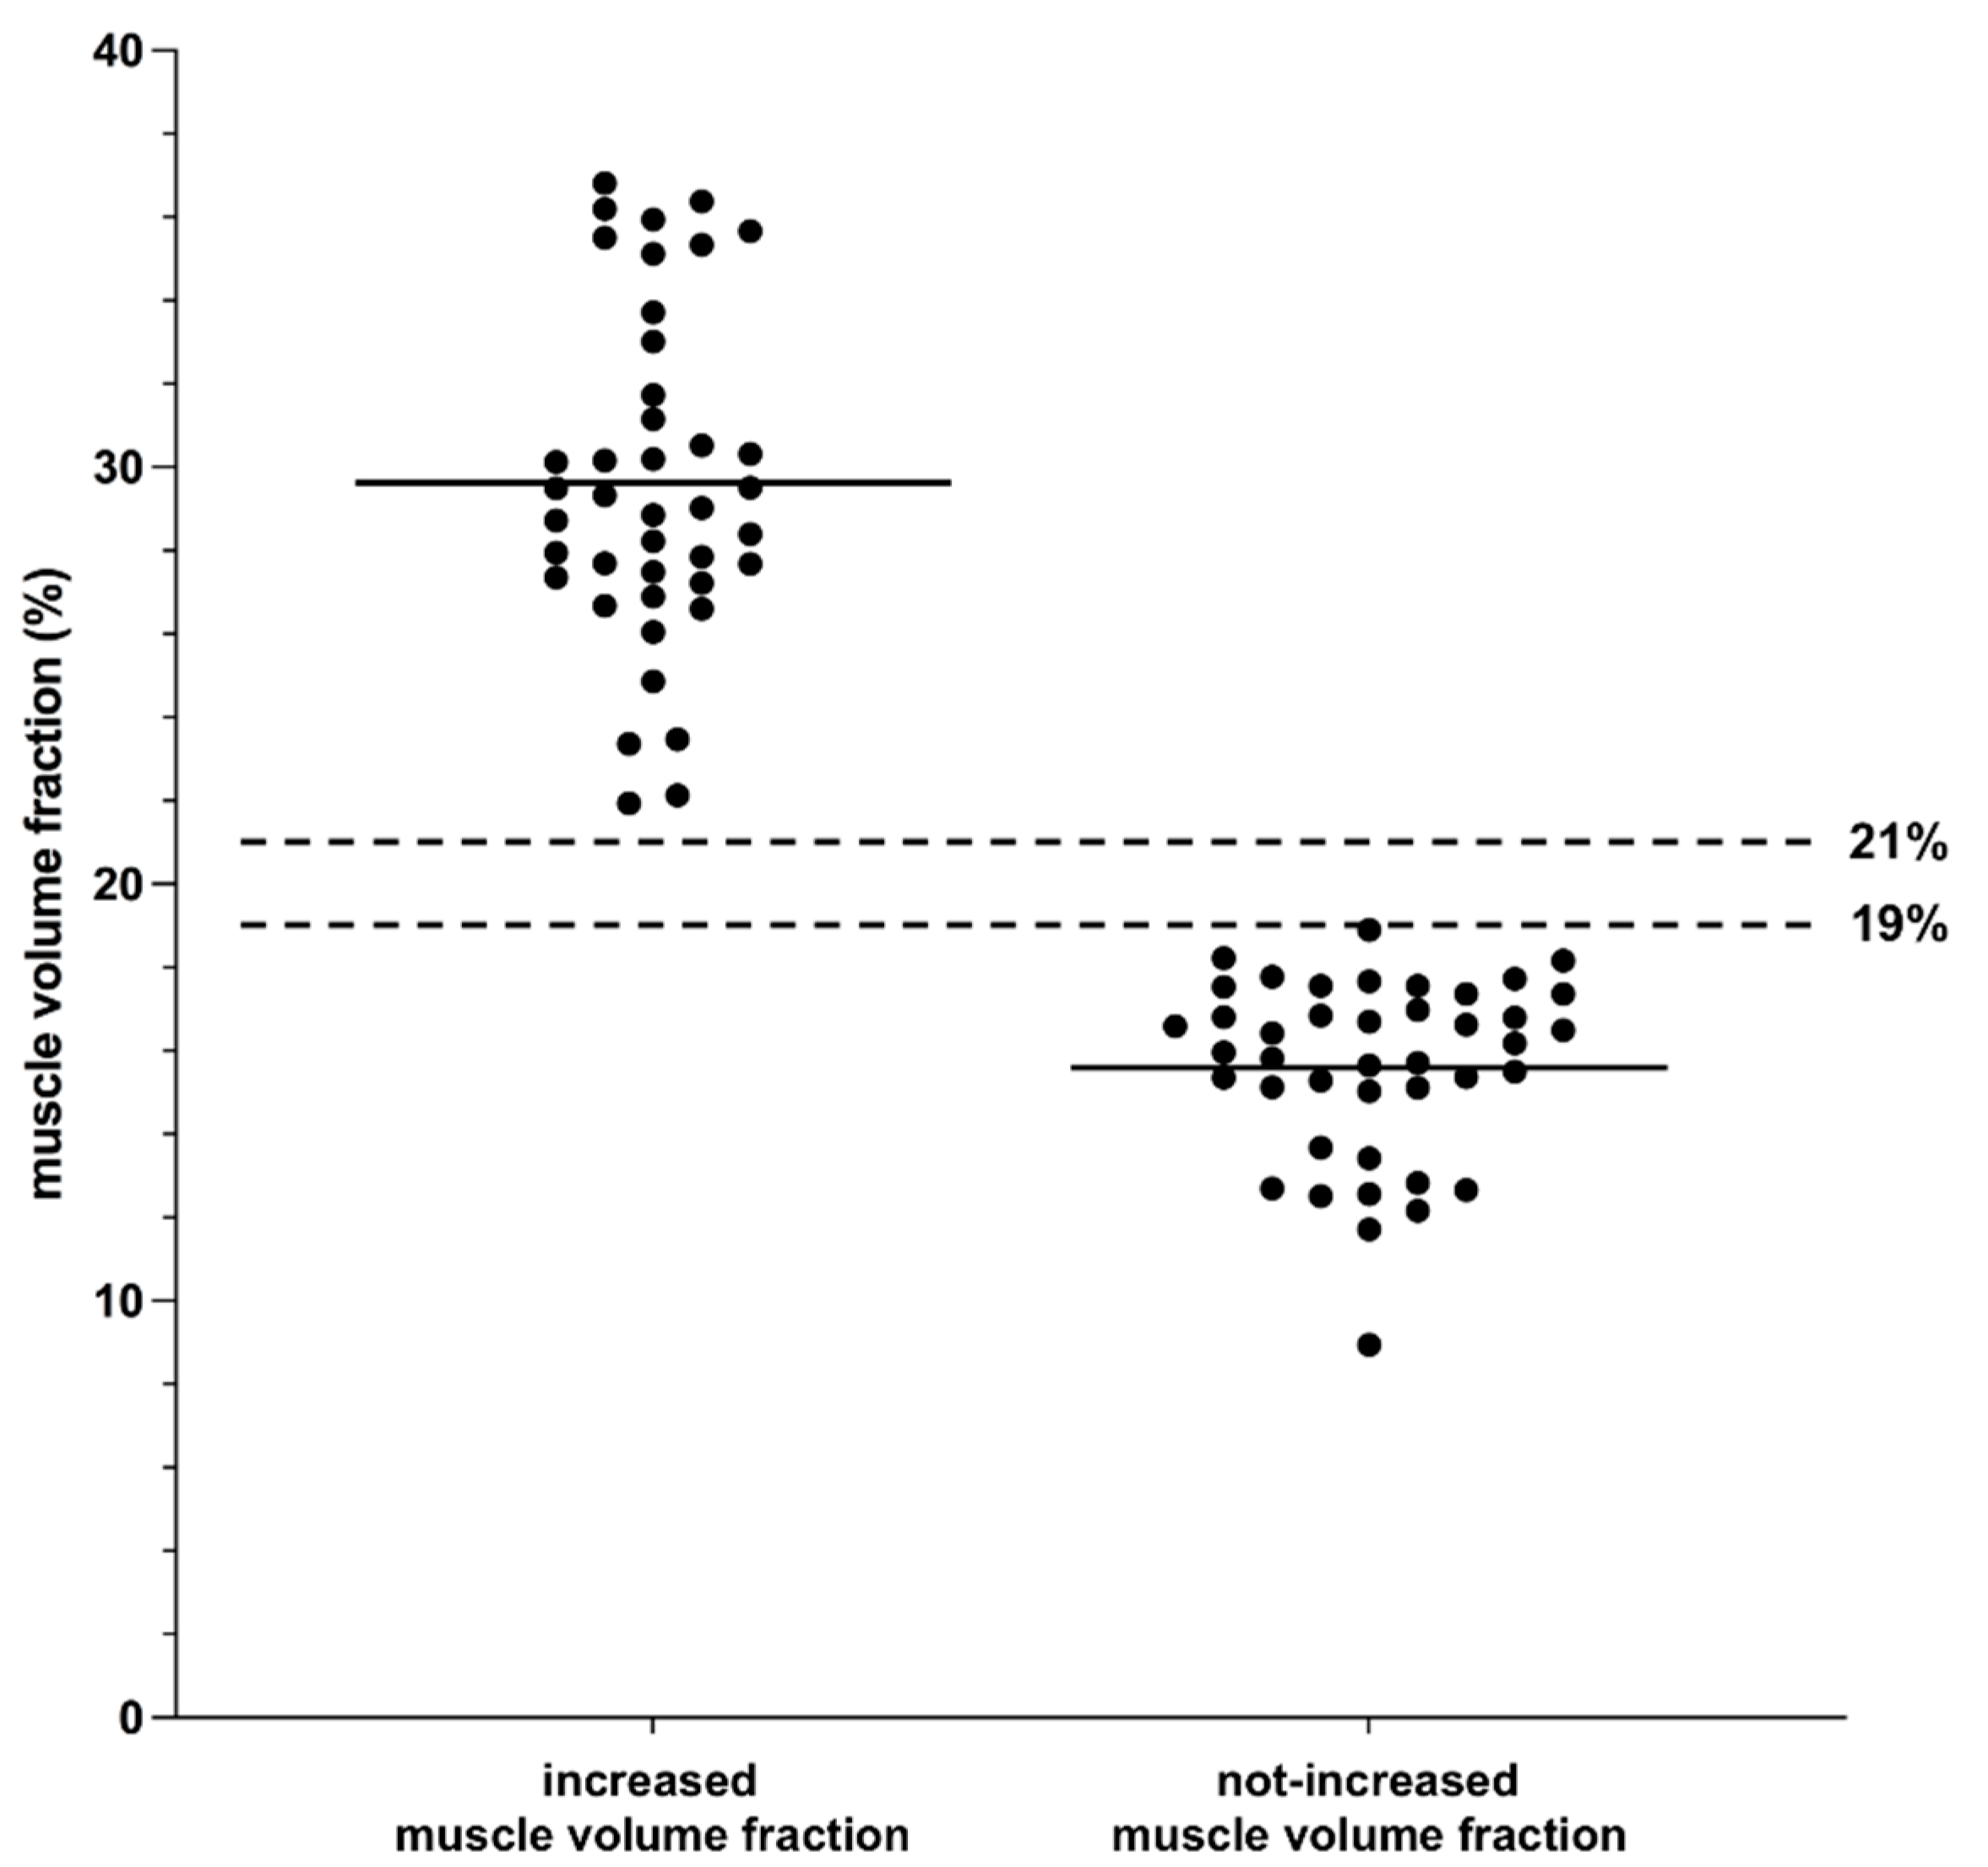
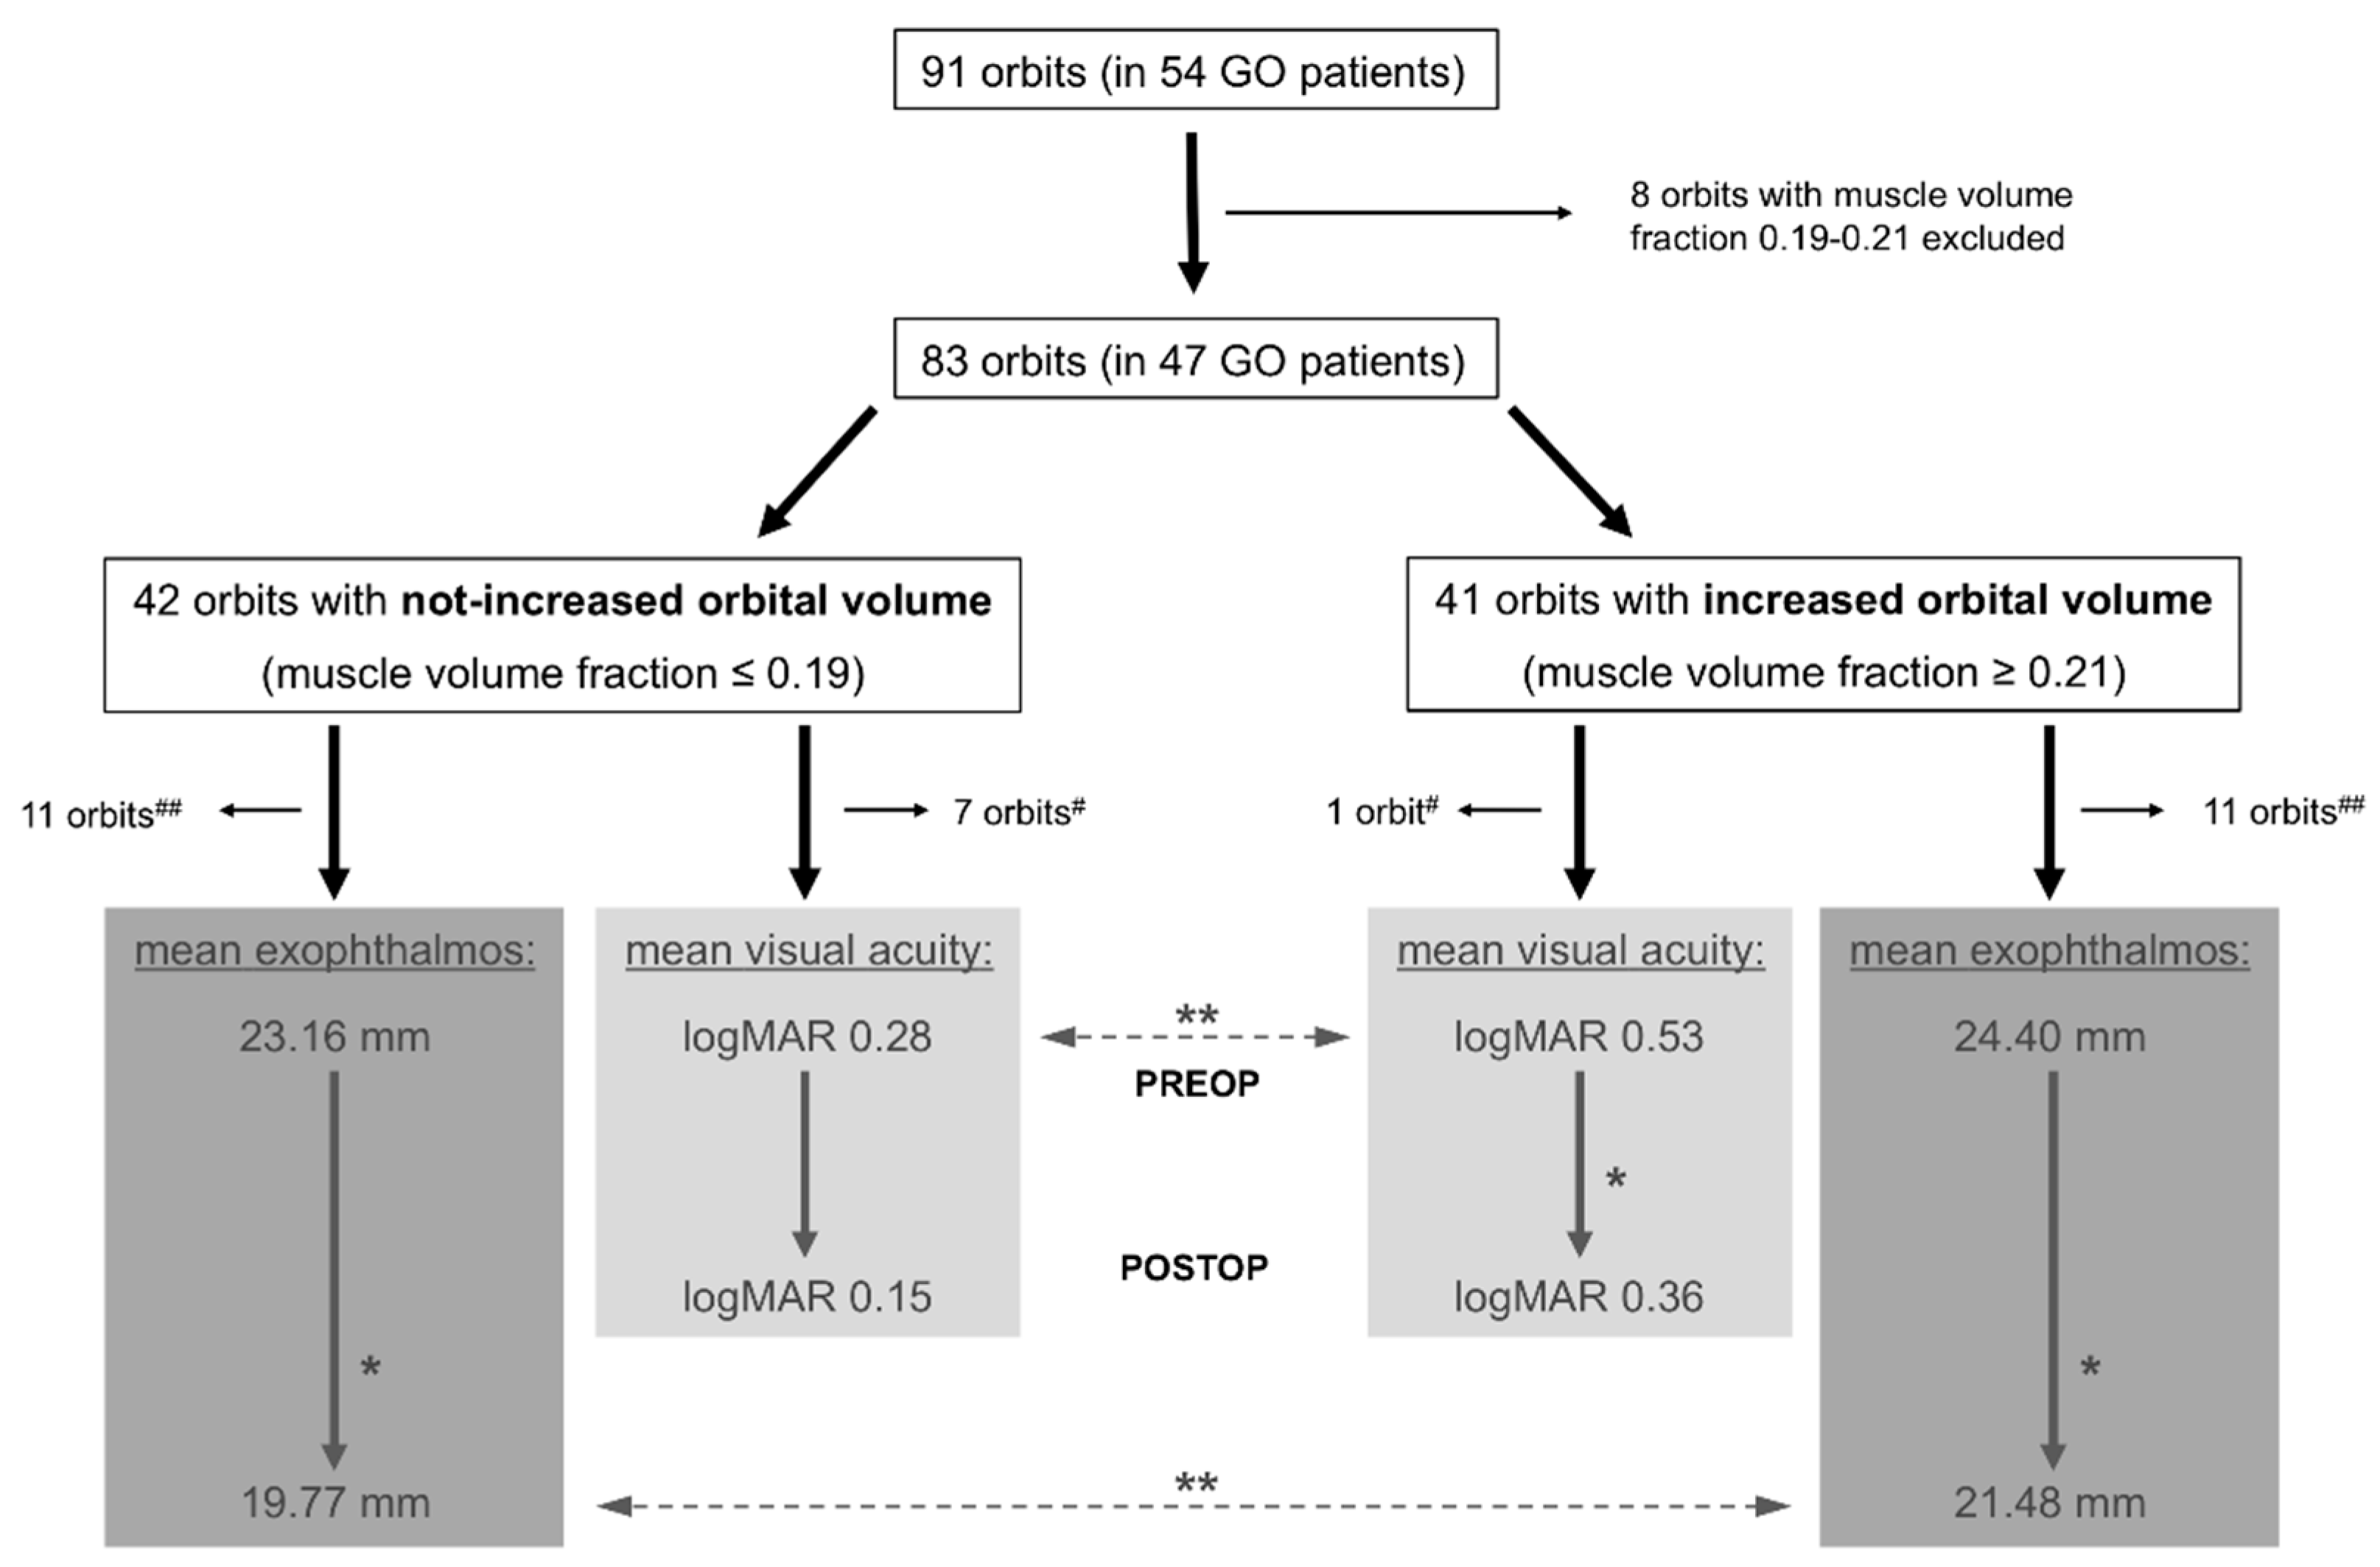
3.1. Volumetry
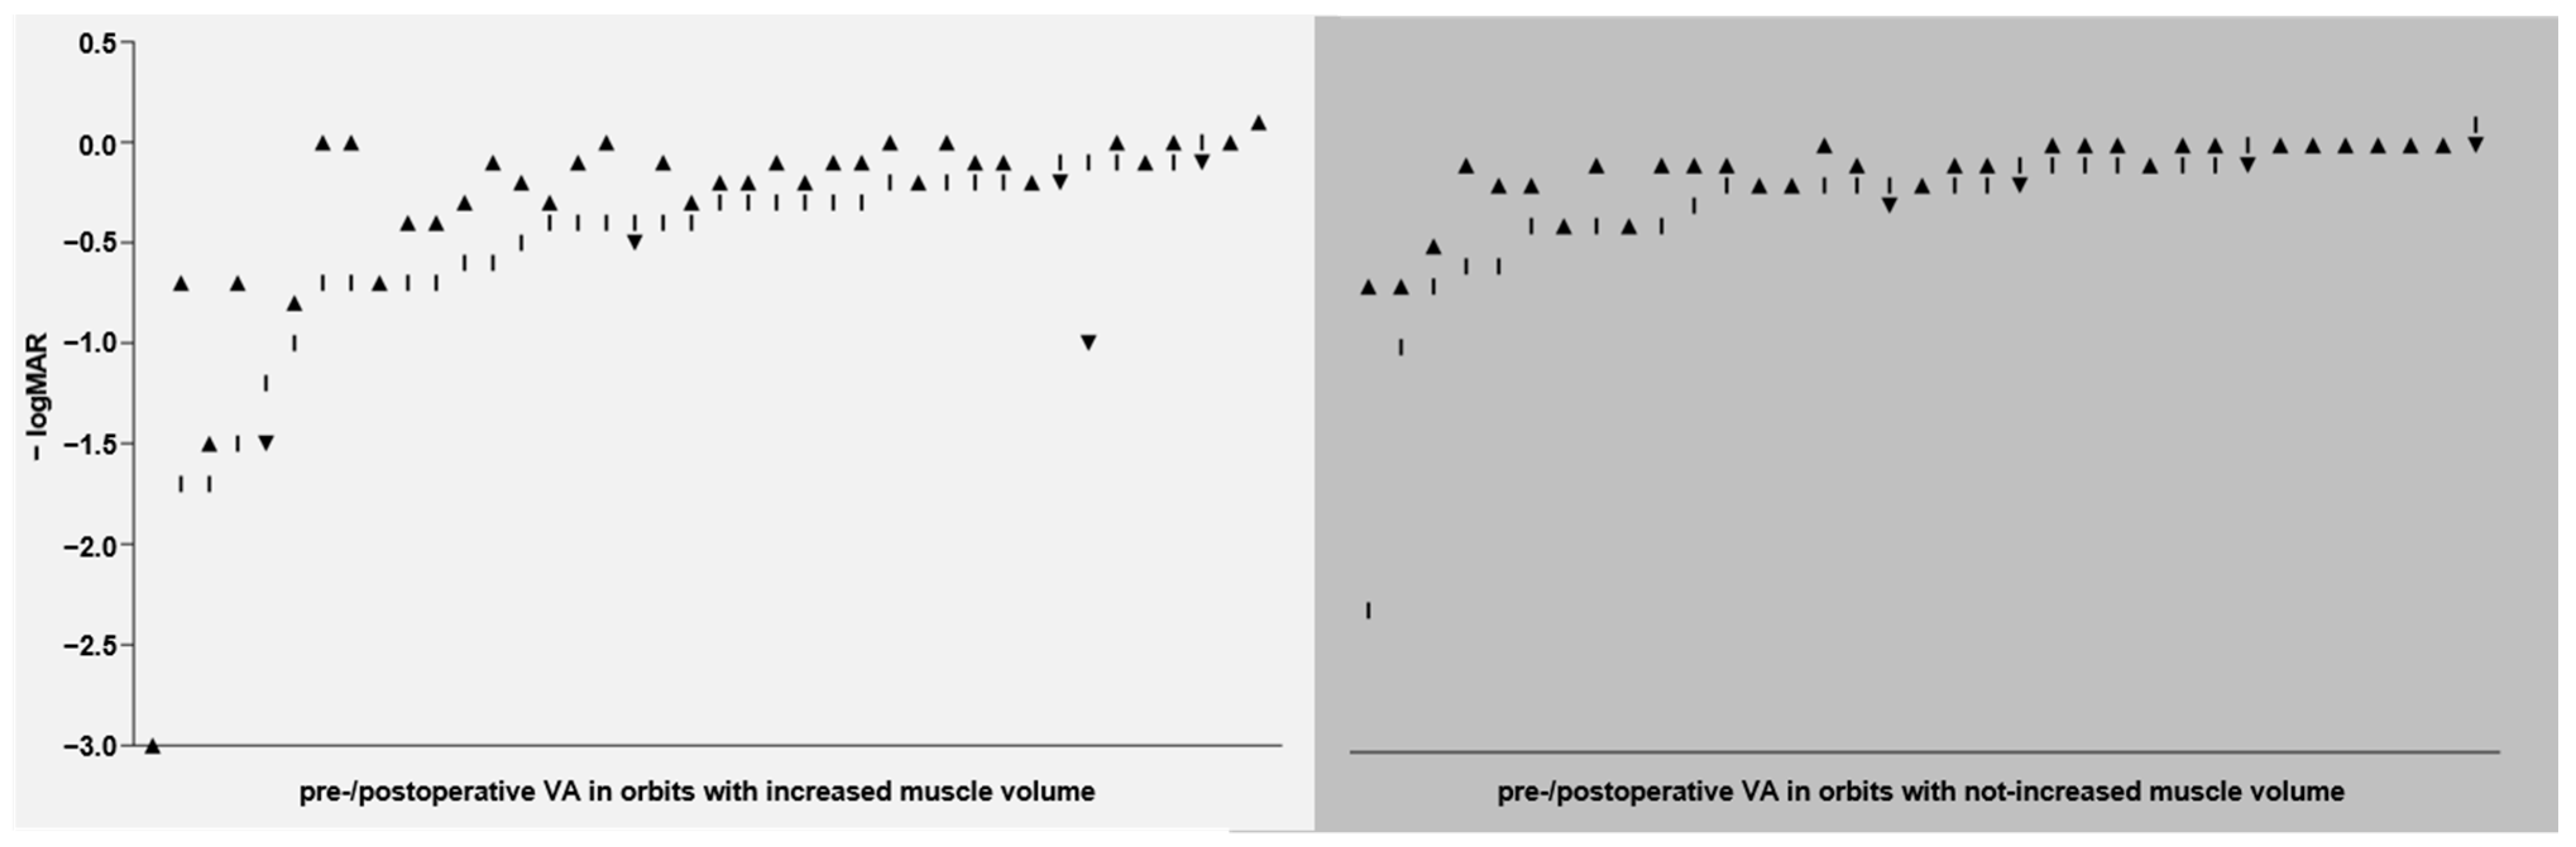
3.2. Outcome—Visual Acuity
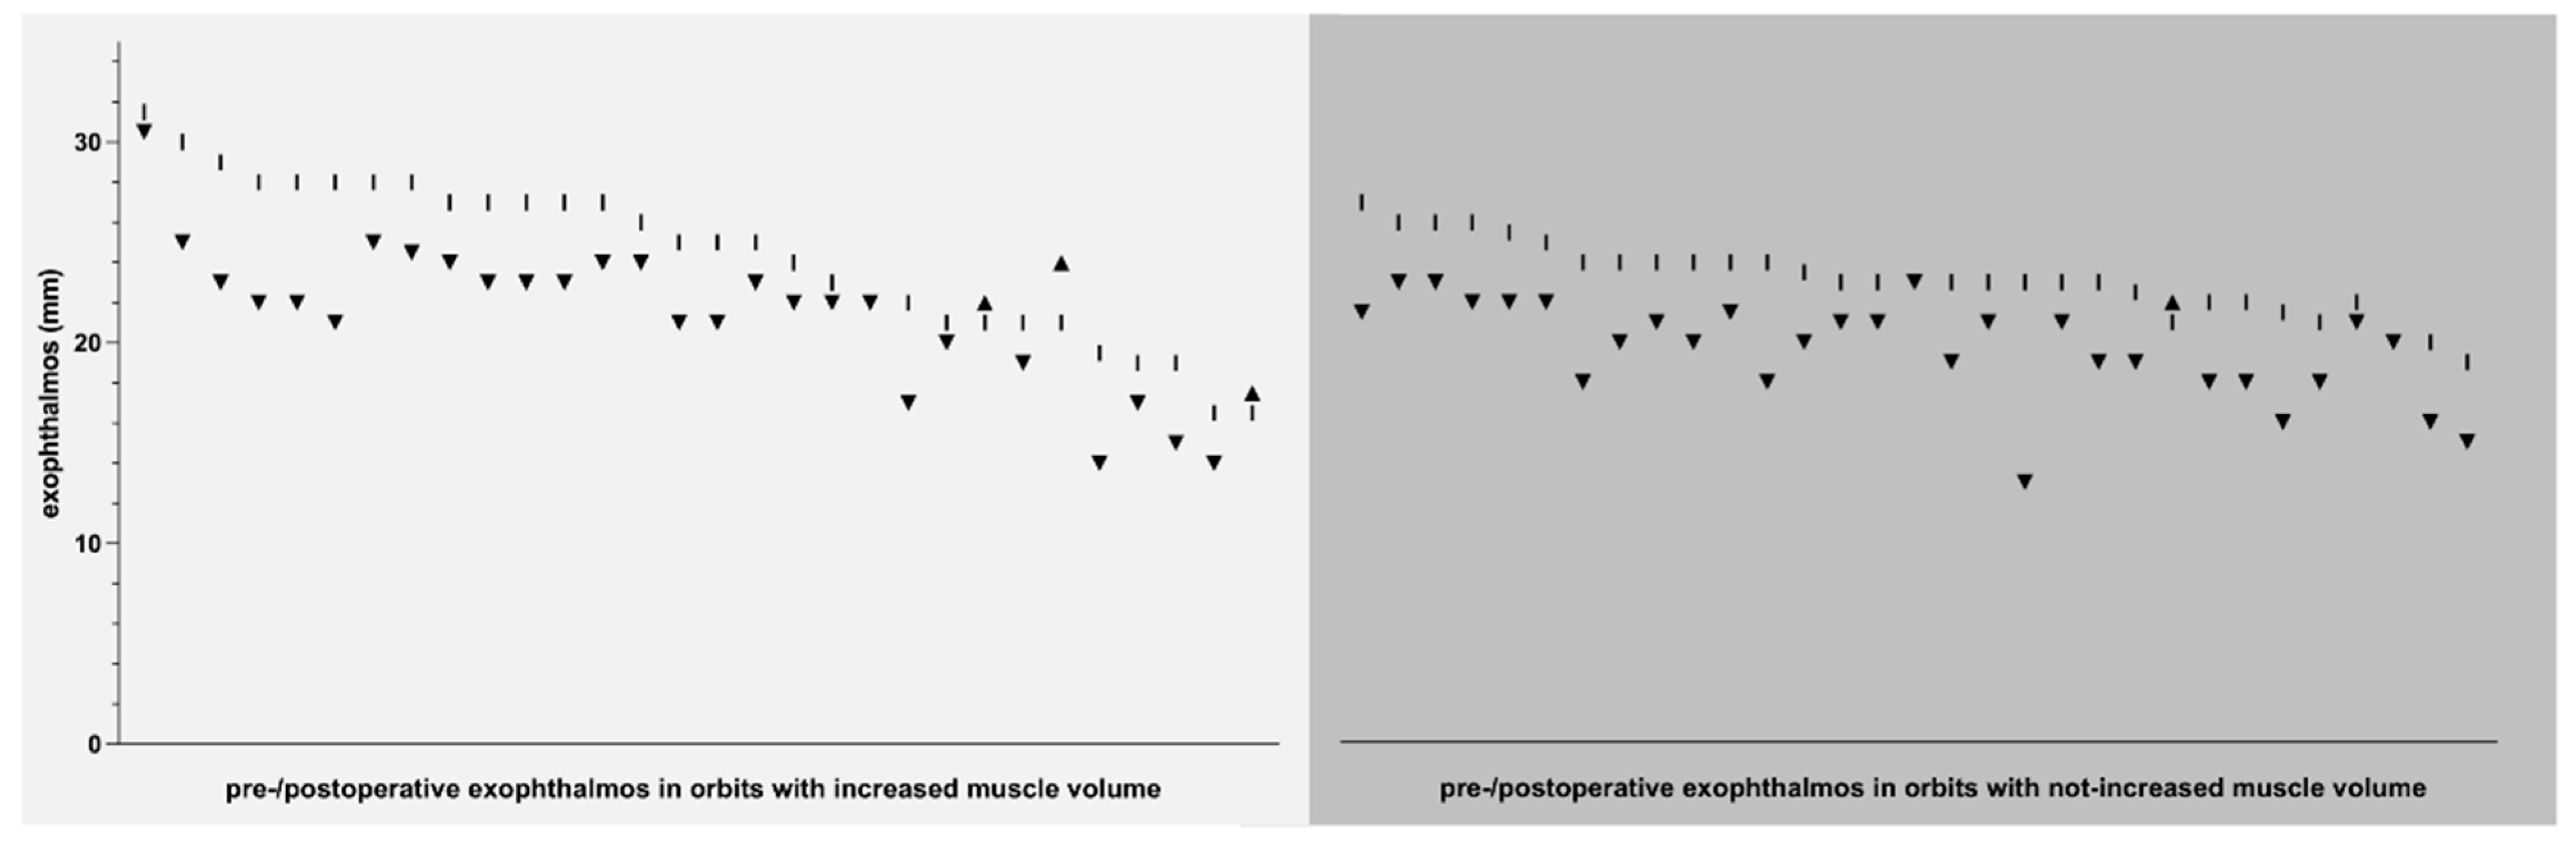
3.3. Outcome—Exophthalmos
3.4. Other Outcome Parameters
4. Discussion
5. Conclusions
Author Contributions
Funding
Institutional Review Board Statement
Informed Consent Statement
Data Availability Statement
Acknowledgments
Conflicts of Interest
References
- McKeag, D.; Lane, C.; Lazarus, J.H.; Baldeschi, L.; Boboridis, K.; Dickinson, A.J.; Hullo, A.I.; Kahaly, G.; Krassas, G.; Marcocci, C.; et al. Clinical Features of Dysthyroid Optic Neuropathy: A European Group on Graves’ Orbitopathy (EUGOGO) Survey. Br. J. Ophthalmol. 2007, 91, 455–458. [Google Scholar] [CrossRef] [PubMed] [Green Version]
- Bahn, R.S. Graves’ Ophthalmopathy. N. Engl. J. Med. 2010, 362, 726–738. [Google Scholar] [CrossRef] [Green Version]
- Bartalena, L.; Kahaly, G.J.; Baldeschi, L.; Dayan, C.M.; Eckstein, A.; Marcocci, C.; Marinò, M.; Vaidya, B.; Wiersinga, W.M.; EUGOGO. The 2021 European Group on Graves’ Orbitopathy (EUGOGO) Clinical Practice Guidelines for the Medical Management of Graves’ Orbitopathy. Eur. J. Endocrinol. 2021, 185, G43–G67. [Google Scholar] [CrossRef]
- Bartalena, L.; Baldeschi, L.; Dickinson, A.; Eckstein, A.; Kendall-Taylor, P.; Marcocci, C.; Mourits, M.; Perros, P.; Boboridis, K.; Boschi, A.; et al. Consensus Statement of the European Group on Graves’ Orbitopathy (EUGOGO) on Management of GO. Eur. J. Endocrinol. 2008, 158, 273–285. [Google Scholar] [CrossRef]
- Chan, L.-L.; Tan, H.-E.; Fook-Chong, S.; Teo, T.-H.; Lim, L.-H.; Seah, L.-L. Graves Ophthalmopathy: The Bony Orbit in Optic Neuropathy, Its Apical Angular Capacity, and Impact on Prediction of Risk. Am. J. Neuroradiol. 2009, 30, 597–602. [Google Scholar] [CrossRef] [Green Version]
- Gonçalves, A.C.P.; Silva, L.N.; Gebrim, E.M.M.S.; Monteiro, M.L.R. Quantification of Orbital Apex Crowding for Screening of Dysthyroid Optic Neuropathy Using Multidetector CT. Am. J. Neuroradiol. 2012, 33, 1602–1607. [Google Scholar] [CrossRef] [Green Version]
- Wiersinga, W.M.; Regensburg, N.I.; Mourits, M.P. Differential Involvement of Orbital Fat and Extraocular Muscles in Graves’ Ophthalmopathy. Eur. Thyroid. J. 2013, 2, 14–21. [Google Scholar] [CrossRef] [PubMed] [Green Version]
- Keene, K.R.; van Vught, L.; van de Velde, N.M.; Ciggaar, I.A.; Notting, I.C.; Genders, S.W.; Verschuuren, J.J.G.M.; Tannemaat, M.R.; Kan, H.E.; Beenakker, J.-W.M. The Feasibility of Quantitative MRI of Extra-Ocular Muscles in Myasthenia Gravis and Graves’ Orbitopathy. NMR Biomed. 2021, 34, e4407. [Google Scholar] [CrossRef]
- Nagy, E.V.; Toth, J.; Kaldi, I.; Damjanovich, J.; Mezosi, E.; Lenkey, A.; Toth, L.; Szabo, J.; Karanyi, Z.; Leovey, A. Graves’ Ophthalmopathy: Eye Muscle Involvement in Patients with Diplopia. Eur. J. Endocrinol. 2000, 142, 591–597. [Google Scholar] [CrossRef] [Green Version]
- Potgieser, P.W.; Wiersinga, W.M.; Regensburg, N.I.; Mourits, M.P. Some Studies on the Natural History of Graves’ Orbitopathy: Increase in Orbital Fat Is a Rather Late Phenomenon. Eur. J. Endocrinol. 2015, 173, 149–153. [Google Scholar] [CrossRef] [PubMed] [Green Version]
- Regensburg, N.I.; Wiersinga, W.M.; Berendschot, T.T.J.M.; Potgieser, P.; Mourits, M.P. Do Subtypes of Graves’ Orbitopathy Exist? Ophthalmology 2011, 118, 191–196. [Google Scholar] [CrossRef]
- Al-Bakri, M.; Rasmussen, A.K.; Thomsen, C.; Toft, P.B. Orbital Volumetry in Graves’ Orbitopathy: Muscle and Fat Involvement in Relation to Dysthyroid Optic Neuropathy. ISRN Ophthalmol. 2014, 2014, 435276. [Google Scholar] [CrossRef] [PubMed]
- Anderson, R.L.; Tweeten, J.P.; Patrinely, J.R.; Garland, P.E.; Thiese, S.M. Dysthyroid Optic Neuropathy without Extraocular Muscle Involvement. Ophthalmic Surg. 1989, 20, 568–574. [Google Scholar] [CrossRef]
- Zou, M.; Wu, D.; Zhu, H.; Huang, X.; Zhao, X.; Zhao, J.; Fu, W.; Li, R.; Li, B.; Wan, P.; et al. Multiparametric Quantitative MRI for the Evaluation of Dysthyroid Optic Neuropathy. Eur. Radiol. 2021, 32, 1931–1938. [Google Scholar] [CrossRef]
- Dayan, C.M.; Dayan, M.R. Dysthyroid Optic Neuropathy: A Clinical Diagnosis or a Definable Entity? Br. J. Ophthalmol. 2007, 91, 409–410. [Google Scholar] [CrossRef] [Green Version]
- Kuechlin, S.; Steiert, C.; Naseri, Y.; Joachimsen, L.; Gruber, M.; Reich, M.; Boehringer, D.; Metzger, M.; Beck, J.; Scheiwe, C.; et al. Pterional Orbit Decompression in Grave Disease with Dysthyroid Optic Neuropathy. World Neurosurg. 2021, 149, e1007–e1016. [Google Scholar] [CrossRef]
- Smith, T.J.; Hegedüs, L. Graves’ Disease. N. Engl. J. Med. 2016, 375, 1552–1565. [Google Scholar] [CrossRef] [Green Version]
- Willaert, R.; Degrieck, B.; Orhan, K.; Deferm, J.; Politis, C.; Shaheen, E.; Jacobs, R. Semi-Automatic Magnetic Resonance Imaging Based Orbital Fat Volumetry: Reliability and Correlation with Computed Tomography. Int. J. Oral Maxillofac. Surg. 2021, 50, 416–422. [Google Scholar] [CrossRef]
- Regensburg, N.I.; Kok, P.H.B.; Zonneveld, F.W.; Baldeschi, L.; Saeed, P.; Wiersinga, W.M.; Mourits, M.P. A New and Validated CT-Based Method for the Calculation of Orbital Soft Tissue Volumes. Investig. Ophthalmol. Vis. Sci. 2008, 49, 1758–1762. [Google Scholar] [CrossRef] [Green Version]
- Bijlsma, W.R.; Mourits, M.P. Radiologic Measurement of Extraocular Muscle Volumes in Patients with Graves’ Orbitopathy: A Review and Guideline. Orbit 2006, 25, 83–91. [Google Scholar] [CrossRef]
- Sentucq, C.; Schlund, M.; Bouet, B.; Garms, M.; Ferri, J.; Jacques, T.; Nicot, R. Overview of Tools for the Measurement of the Orbital Volume and Their Applications to Orbital Surgery. J. Plast. Reconstr. Aesthet Surg. 2021, 74, 581–591. [Google Scholar] [CrossRef]
- Bontzos, G.; Mazonakis, M.; Papadaki, E.; Maris, T.G.; Blazaki, S.; Drakonaki, E.E.; Detorakis, E.T. Ex Vivo Orbital Volumetry Using Stereology and CT Imaging: A Comparison with Manual Planimetry. Eur. Radiol. 2019, 29, 1365–1374. [Google Scholar] [CrossRef]
- Regensburg, N.I.; Wiersinga, W.M.; van Velthoven, M.E.J.; Berendschot, T.T.J.M.; Zonneveld, F.W.; Baldeschi, L.; Saeed, P.; Mourits, M.P. Age and Gender-Specific Reference Values of Orbital Fat and Muscle Volumes in Caucasians. Br. J. Ophthalmol. 2011, 95, 1660–1663. [Google Scholar] [CrossRef] [Green Version]
- Leong, S.C.; Karkos, P.D.; Macewen, C.J.; White, P.S. A Systematic Review of Outcomes Following Surgical Decompression for Dysthyroid Orbitopathy. Laryngoscope 2009, 119, 1106–1115. [Google Scholar] [CrossRef]
- European Group on Graves’ Orbitopathy (EUGOGO); Mourits, M.P.; Bijl, H.; Altea, M.A.; Baldeschi, L.; Boboridis, K.; Currò, N.; Dickinson, A.J.; Eckstein, A.; Freidel, M.; et al. Outcome of Orbital Decompression for Disfiguring Proptosis in Patients with Graves’ Orbitopathy Using Various Surgical Procedures. Br. J. Ophthalmol. 2009, 93, 1518–1523. [Google Scholar] [CrossRef]
- Barrett, L.; Glatt, H.J.; Burde, R.M.; Gado, M.H. Optic Nerve Dysfunction in Thyroid Eye Disease: CT. Radiology 1988, 167, 503–507. [Google Scholar] [CrossRef]
- Giaconi, J.A.; Kazim, M.; Rho, T.; Pfaff, C. CT Scan Evidence of Dysthyroid Optic Neuropathy. Ophthalmic Plast. Reconstr. Surg. 2002, 18, 177–182. [Google Scholar] [CrossRef]
- Hallin, E.S.; Feldon, S.E. Graves’ Ophthalmopathy: I. Simple CT Estimates of Extraocular Muscle Volume. Br. J. Ophthalmol. 1988, 72, 674–677. [Google Scholar] [CrossRef] [Green Version]
- Nugent, R.A.; Belkin, R.I.; Neigel, J.M.; Rootman, J.; Robertson, W.D.; Spinelli, J.; Graeb, D.A. Graves Orbitopathy: Correlation of CT and Clinical Findings. Radiology 1990, 177, 675–682. [Google Scholar] [CrossRef]
- Weis, E.; Heran, M.K.S.; Jhamb, A.; Chan, A.K.; Chiu, J.P.; Hurley, M.C.; Rootman, J. Quantitative Computed Tomographic Predictors of Compressive Optic Neuropathy in Patients with Thyroid Orbitopathy: A Volumetric Analysis. Ophthalmology 2012, 119, 2174–2178. [Google Scholar] [CrossRef]
- Stan, M.N.; Bahn, R.S. Risk Factors for Development or Deterioration of Graves’ Ophthalmopathy. Thyroid 2010, 20, 777–783. [Google Scholar] [CrossRef] [PubMed]
- Baujat, B.; Krastinova, D.; Bach, C.A.; Coquille, F.; Chabolle, F. Orbital Morphology in Exophthalmos and Exorbitism. Plast. Reconstr. Surg. 2006, 117, 542–550; discussion 551–552. [Google Scholar] [CrossRef]
- Wiersinga, W.M.; Smit, T.; van der Gaag, R.; Mourits, M.; Koornneef, L. Clinical Presentation of Graves’ Ophthalmopathy. Ophthalmic Res. 1989, 21, 73–82. [Google Scholar] [CrossRef]
- Nanda, T.; Dunbar, K.E.; Campbell, A.A.; Bathras, R.M.; Kazim, M. Greater Proptosis Is Not Associated With Improved Compressive Optic Neuropathy in Thyroid Eye Disease. Ophthalmic Plast. Reconstr. Surg. 2018, 34, S72–S74. [Google Scholar] [CrossRef] [PubMed]
- Wang, Y.; Li, Y.Y.; Yang, N.; Ma, R.; Xiao, L.H. Therapeutic outcomes and influence factors of maximal orbital decompression in the treatment of severe dysthyroid optic neuropathy. Zhonghua Yan Ke Za Zhi 2017, 53, 416–423. [Google Scholar] [CrossRef]
- Wu, C.Y.; Stacey, A.W.; Kahana, A. Simultaneous Versus Staged Balanced Decompression for Thyroid-Related Compressive Optic Neuropathy. Ophthalmic Plast. Reconstr. Surg. 2016, 32, 462–467. [Google Scholar] [CrossRef]
- Kim, K.W.; Byun, J.S.; Lee, J.K. Surgical Effects of Various Orbital Decompression Methods in Thyroid-Associated Orbitopathy: Computed Tomography-Based Comparative Analysis. J. Craniomaxillofac. Surg. 2014, 42, 1286–1291. [Google Scholar] [CrossRef] [PubMed]
- Pereira, T.d.S.; Leite, C.d.A.; Kuniyoshi, C.H.; Gebrim, E.M.M.S.; Monteiro, M.L.R.; Pieroni Gonçalves, A.C. A Randomized Comparative Study of Inferomedial vs. Balanced Orbital Decompression. Analysis of Changes in Orbital Volume, Eyelid Parameters, and Eyeball Position. Eye 2021, 36, 547–554. [Google Scholar] [CrossRef]
- Yo, K.; Nishimura, K.; Takahashi, Y.; Yokota, H.; Hatayama, N.; Hoshino, T.; Naito, M.; Ogawa, T.; Fujimoto, Y. Comparison of the Decompressive Effect of Different Surgical Procedures for Dysthyroid Optic Neuropathy Using 3D Printed Models. Graefes Arch. Clin. Exp. Ophthalmol. 2022. online ahead of print. [Google Scholar] [CrossRef]


| Not-Increased Muscle Volume | Increased Muscle Volume | ||
|---|---|---|---|
| number of orbits | n = 42 | n = 41 | |
| mean muscle volume (in relation to total orbital volume) | 15.60% (SD 2.16, SEM 0.33, CI 14.93–16.28) | 29.63% (SD 4.00, SEM 0.62, CI 28.36–30.89) | |
| mean age (years) | 55.33 (SD 11.08) | 58.90 (SD 10.46) | |
| gender | female | 29 (69.05%) | 23 (56.10%) |
| male | 13 (30.95%) | 18 (43.90%) | |
| side | left | 22 (52.38%) | 20 (48.78%) |
| right | 20 (47.62%) | 21 (51.22%) | |
| indication for surgery | DON | 30 (71.43%) | 33 (80.49%) |
| cosmetic/functional | 12 (28.57%) | 8 (19.51%) | |
| EUGOGO classification | moderate-to-severe | 12 (28.57%) | 8 (19.51%) |
| sight-threatening | 30 (71.43%) | 33 (80.49%) | |
| CAS | active | 35 (83.33%) | 38 (92.68%) |
| inactive | 7 (16.67%) | 3 (7.32%) | |
| diplopia | preoperatively | 28 (66.67%) | 29 (70.73%) |
| postoperatively | 26 (61.90%) (new after surgery: 2) | 19 (46.34%) (new after surgery: 0) | |
| Not-Increased Muscle Volume | Increased Muscle Volume | Inter-Group Comparison: Change in VA (p-Value) | ||
|---|---|---|---|---|
| total group (DON + cosm/func) | no. of orbits | n = 35 | n = 40 | |
| mean VA pre | 0.28 logMAR {0.53 decimal} (SD 0.42, CI 0.14–0.43) | 0.53 logMAR {0.30 decimal} (SD 0.59, CI 0.34–0.72) | 2.5 lines (p = 0.0058) | |
| mean VA post | 0.15 logMAR {0.72 decimal} (SD 0.19, CI 0.08–0.21) | 0.36 logMAR {0.44 decimal} (SD 0.57, CI 0.18–0.54) | 2.1 lines (p = 0.0585) | |
| change in VA post vs. pre (p-value) | 1.3 lines (p = 0.0761) | 1.7 lines (p = 0.0138) | ||
| DON group | no. of orbits | n = 28 | n = 32 | |
| mean VA pre | 0.34 logMAR {0.46 decimal} (SD 0.45, CI 0.17–0.52) | 0.63 logMAR {0.24 decimal} (SD 0.62, CI 0.41–0.85) | 2.9 lines (p = 0.0035) | |
| mean VA post | 0.18 logMAR {0.66 decimal} (SD 0.20, CI 0.10–0.25) | 0.43 logMAR {0.38 decimal} (SD 0.62, CI 0.21–0.65) | 2.5 lines (p = 0.0578) | |
| change in VA post vs. pre (p-value) | 1.6 lines (p = 0.0447) | 2.0 lines (p = 0.0142) | ||
| cosm/func group | no. of orbits | n = 7 | n = 8 | |
| mean VA pre | 0.04 logMAR {0.92 decimal} (SD 0.10, CI −0.05–0.13) | 0.11 logMAR {0.78 decimal} (SD 0.08, CI 0.04–0.18) | 0.7 lines (p = 0.1834) | |
| mean VA post | 0.04 logMAR {0.92 decimal} (SD 0.08, CI −0.03–0.12) | 0.08 logMAR {0.84 decimal} (SD 0.07, CI 0.02–0.13) | 0.4 lines (p = 0.3930) | |
| change in VA post vs. pre (p-value) | 0.0 lines (p > 0.9999) | 0.3 lines (p = 0.5097) | ||
| Not-Increased Muscle Volume | Increased Muscle Volume | Inter-Group Comparison: Change in Exoph (p-Value) | ||
|---|---|---|---|---|
| total group (DON + cosm/func) | no. of orbits | n = 31 | n = 30 | |
| mean exoph pre (in mm) | 23.16 (SD 1.88, CI 22.47–23.85) | 24.40 (SD 4.04, CI 22.89–25.91) | 1.24 mm (p = 0.1140) | |
| mean exoph post (in mm) | 19.77 (SD 2.46, CI 18.87–20.67) | 21.48 (SD 3.59, CI 20.14–22.82) | 1.71 mm (p = 0.0072) | |
| change in exoph post vs. pre (p-value) | 3.39 mm (p < 0.0001) | 2.92 mm (p = 0.0082) | ||
| DON group | no. of orbits | n = 24 | n = 24 | |
| mean exoph pre (in mm) | 23.38 (SD 1.81, CI 22.61–24.14) | 24.17 (SD 4.39, CI 22.31–26.02) | 0.79 mm (p = 0.4564) | |
| mean exoph post (in mm) | 19.83 (SD 2.64, CI 18.72–20.95) | 21.04 (SD 3.86, CI 19.41–22.67) | 1.21 mm (p = 0.1166) | |
| change in exoph post vs. pre (p-value) | 3.55 mm (p < 0.0001) | 3.13 mm (p = 0.0309) | ||
| cosm/func group | no. of orbits | n = 7 | n = 6 | |
| mean exoph pre (in mm) | 22.43 (SD 2.07, CI 20.51–24.34) | 25.33 (SD 2.16, CI 23.07–27.60) | 2.90 mm (p = 0.0408) | |
| mean exoph post (in mm) | 19.57 (SD 1.81, CI 17.90–21.25) | 23.25 (SD 1.08, CI 22.11–24.39) | 3.68 mm (p = 0.0058) | |
| change in exoph post vs. pre (p-value) | 2.86 mm (p = 0.0262) | 2.08 mm (p = 0.0909) | ||
Publisher’s Note: MDPI stays neutral with regard to jurisdictional claims in published maps and institutional affiliations. |
© 2022 by the authors. Licensee MDPI, Basel, Switzerland. This article is an open access article distributed under the terms and conditions of the Creative Commons Attribution (CC BY) license (https://creativecommons.org/licenses/by/4.0/).
Share and Cite
Steiert, C.; Kuechlin, S.; Masalha, W.; Beck, J.; Lagrèze, W.A.; Grauvogel, J. Increased Orbital Muscle Fraction Diagnosed by Semi-Automatic Volumetry: A Risk Factor for Severe Visual Impairment with Excellent Response to Surgical Decompression in Graves’ Orbitopathy. J. Pers. Med. 2022, 12, 937. https://doi.org/10.3390/jpm12060937
Steiert C, Kuechlin S, Masalha W, Beck J, Lagrèze WA, Grauvogel J. Increased Orbital Muscle Fraction Diagnosed by Semi-Automatic Volumetry: A Risk Factor for Severe Visual Impairment with Excellent Response to Surgical Decompression in Graves’ Orbitopathy. Journal of Personalized Medicine. 2022; 12(6):937. https://doi.org/10.3390/jpm12060937
Chicago/Turabian StyleSteiert, Christine, Sebastian Kuechlin, Waseem Masalha, Juergen Beck, Wolf Alexander Lagrèze, and Juergen Grauvogel. 2022. "Increased Orbital Muscle Fraction Diagnosed by Semi-Automatic Volumetry: A Risk Factor for Severe Visual Impairment with Excellent Response to Surgical Decompression in Graves’ Orbitopathy" Journal of Personalized Medicine 12, no. 6: 937. https://doi.org/10.3390/jpm12060937