
Electrocardiogram Risk Score and Prevalence of Subclinical Atherosclerosis: A Cross-Sectional Study


Abstract
:
1. Introduction
2. Materials and Methods
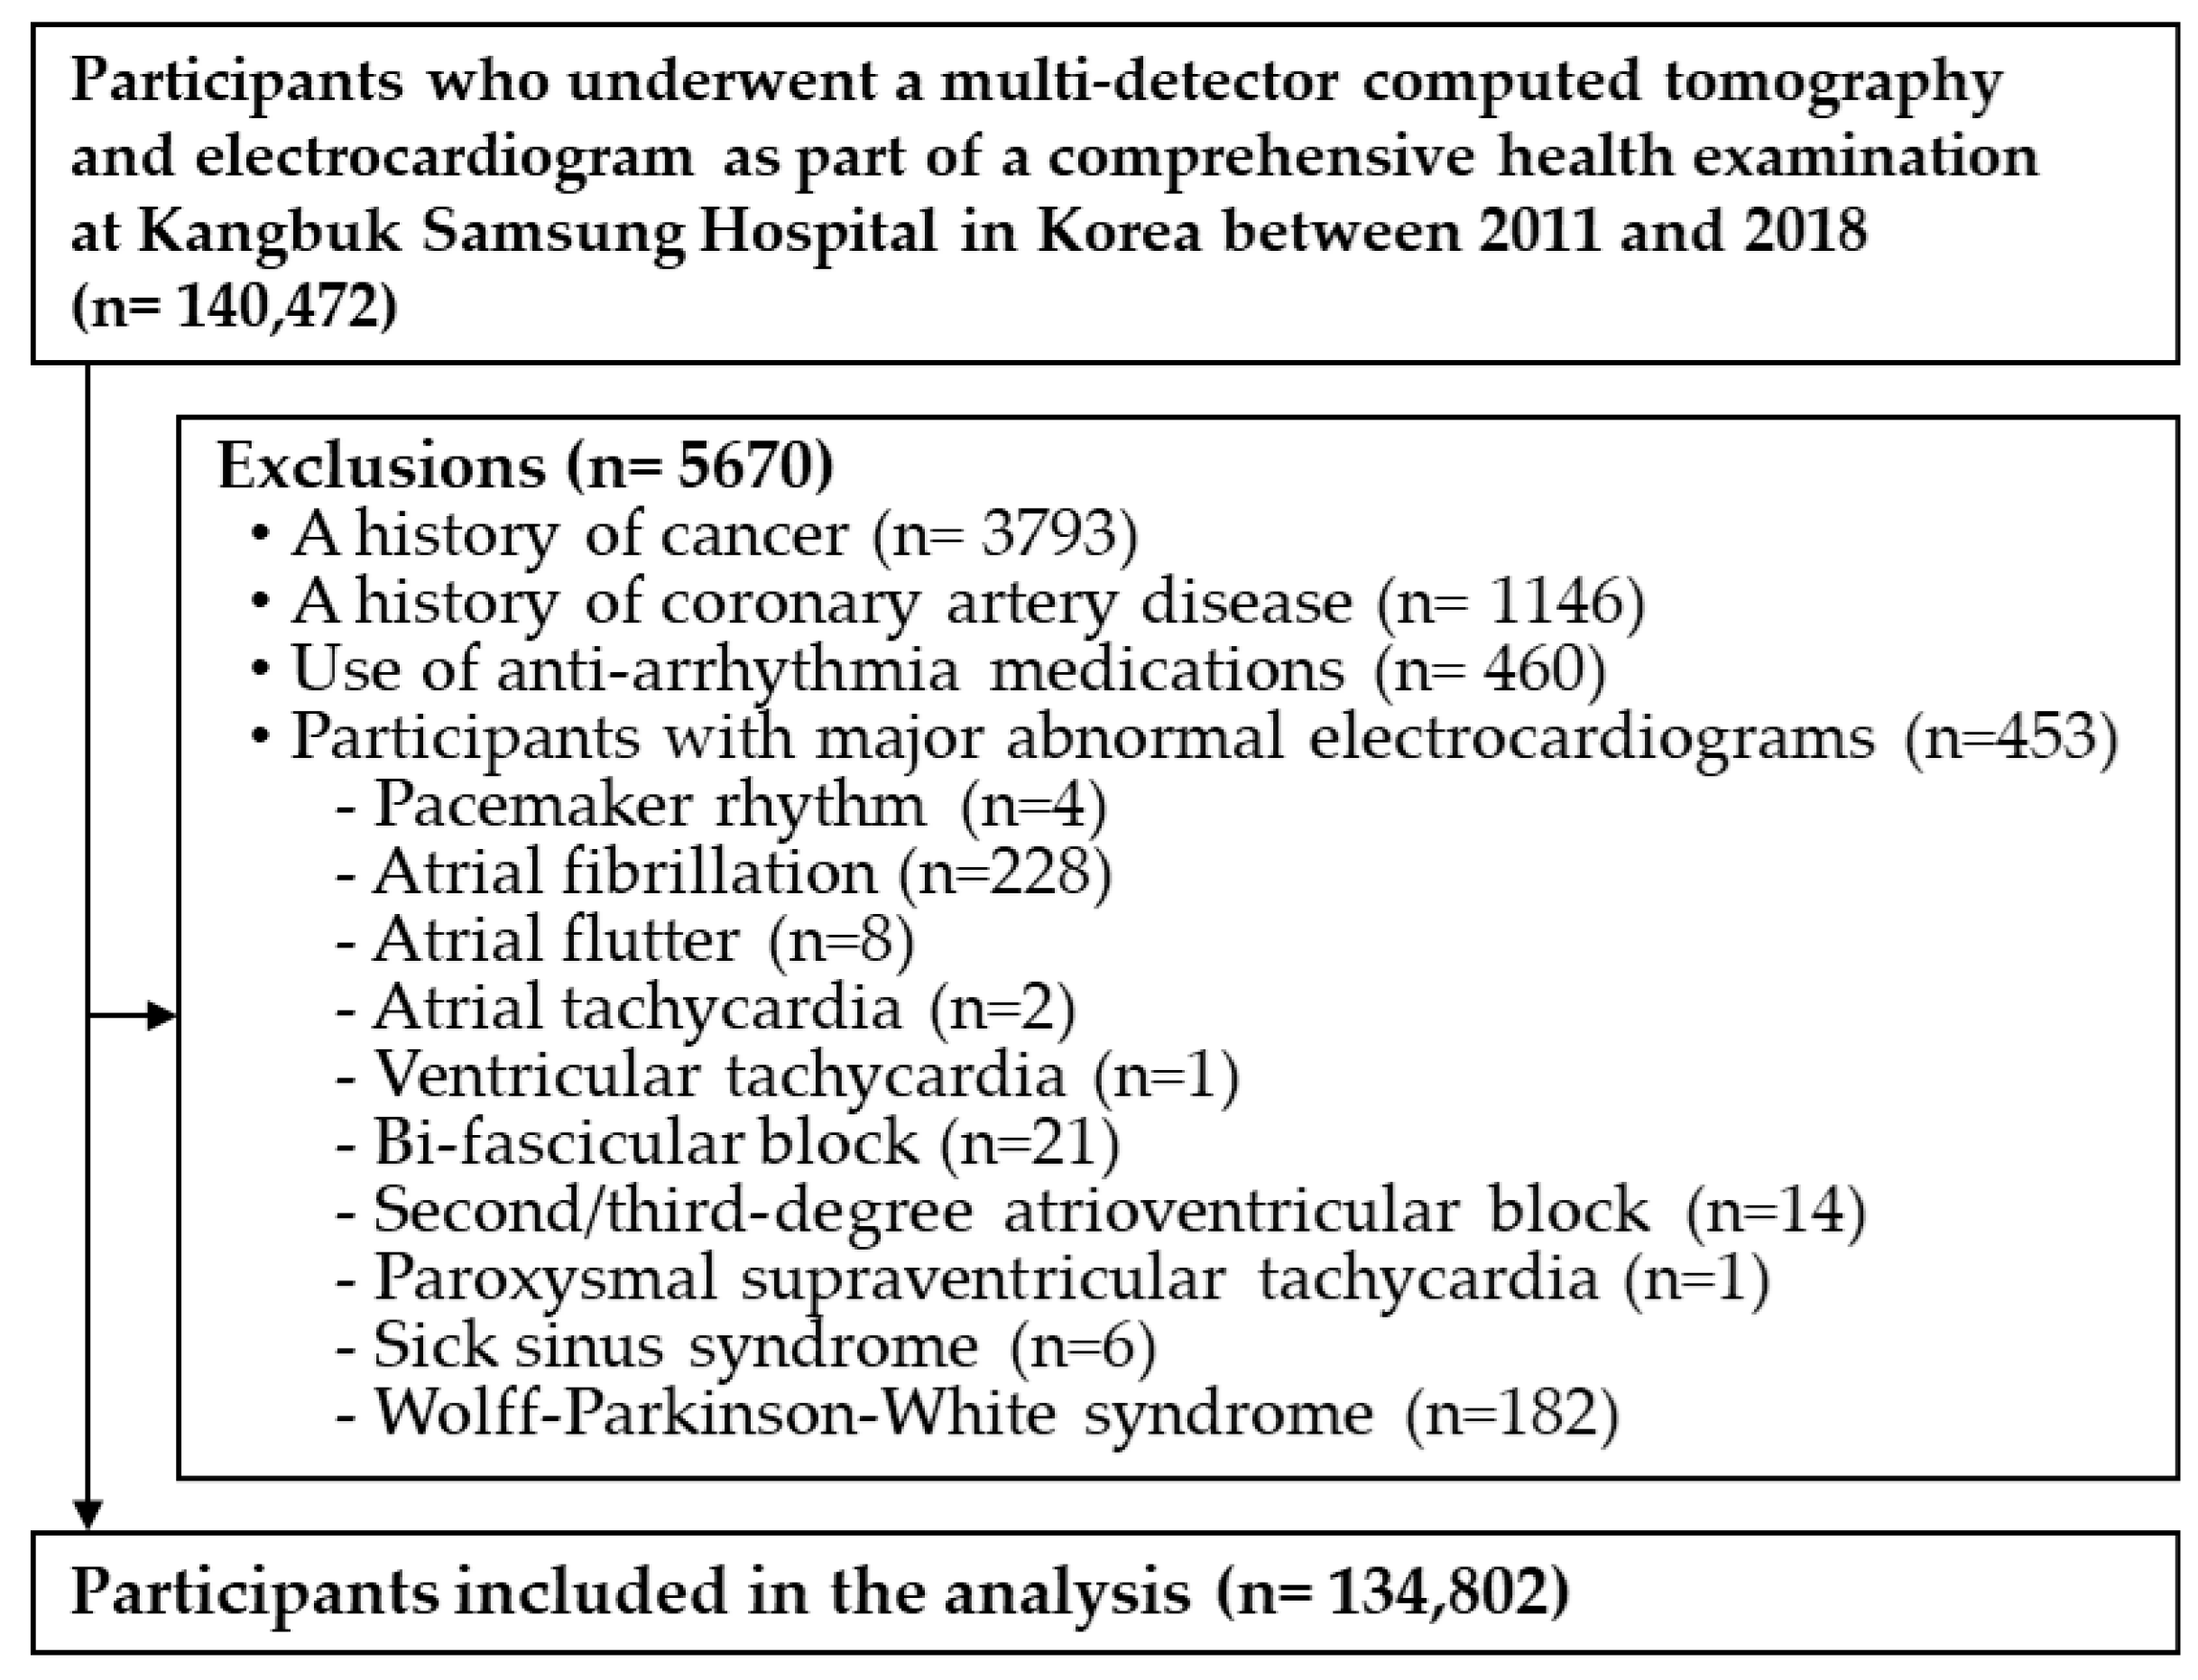
2.1. Study Population
2.2. Measurement
2.3. Measurement of Electrocardiogram
2.4. Measurement of CAC by Multidetector CT
2.5. Statistical Analyses
3. Results
4. Discussion
Author Contributions
Funding
Institutional Review Board Statement
Informed Consent Statement
Data Availability Statement
Acknowledgments
Conflicts of Interest
References
- Bansilal, S.; Castellano, J.M.; Fuster, V. Global burden of CVD: Focus on secondary prevention of cardiovascular disease. Int. J. Cardiol. 2015, 201 (Suppl. 1), S1–S7. [Google Scholar] [CrossRef] [Green Version]
- Bairey Merz, C.N.; Alberts, M.J.; Balady, G.J.; Ballantyne, C.M.; Berra, K.; Black, H.R.; Blumenthal, R.S.; Davidson, M.H.; Fazio, S.B.; Ferdinand, K.C.; et al. ACCF/AHA/ACP 2009 competence and training statement: A curriculum on prevention of cardiovascular disease: A report of the American College of Cardiology Foundation/American Heart Association/American College of Physicians Task Force on Competence and Training (Writing Committee to Develop a Competence and Training Statement on Prevention of Cardiovascular Disease): Developed in collaboration with the American Academy of Neurology; American Association of Cardiovascular and Pulmonary Rehabilitation; American College of Preventive Medicine; American College of Sports Medicine; American Diabetes Association; American Society of Hypertension; Association of Black Cardiologists; Centers for Disease Control and Prevention; National Heart, Lung, and Blood Institute; National Lipid Association; and Preventive Cardiovascular Nurses Association. J. Am. Coll. Cardiol. 2009, 54, 1336–1363. [Google Scholar]
- Fifth Joint Task Force of the European Society of Cardiology; European Association of Echocardiography; European Association of Percutaneous Cardiovascular Interventions; European Heart Rhythm Association; Heart Failure Association; European Association for Cardiovascular Prevention & Rehabilitation; European Atherosclerosis Society; International Society of Behavioural Medicine; European Stroke Organisation; European Society of Hypertension; et al. European Guidelines on cardiovascular disease prevention in clinical practice (version 2012): The Fifth Joint Task Force of the European Society of Cardiology and Other Societies on Cardiovascular Disease Prevention in Clinical Practice (constituted by representatives of nine societies and by invited experts). Eur. J. Prev. Cardiol. 2012, 19, 585–667. [Google Scholar]
- Andersson, C.; Vasan, R.S. Epidemiology of cardiovascular disease in young individuals. Nat. Rev. Cardiol. 2018, 15, 230–240. [Google Scholar] [CrossRef]
- Degano, I.R.; Salomaa, V.; Veronesi, G.; Ferrieres, J.; Kirchberger, I.; Laks, T.; Havulinna, A.S.; Ruidavets, J.B.; Ferrario, M.M.; Meisinger, C.; et al. Twenty-five-year trends in myocardial infarction attack and mortality rates, and case-fatality, in six European populations. Heart 2015, 101, 1413–1421. [Google Scholar] [CrossRef]
- Ungerleider, H.E. The prognostic implications of the electrocardiogram. Am. J. Cardiol. 1960, 6, 35–44. [Google Scholar] [CrossRef]
- Rautaharju, P.M.; Kooperberg, C.; Larson, J.C.; LaCroix, A. Electrocardiographic abnormalities that predict coronary heart disease events and mortality in postmenopausal women: The Women’s Health Initiative. Circulation 2006, 113, 473–480. [Google Scholar] [CrossRef]
- Ammar, K.A.; Kors, J.A.; Yawn, B.P.; Rodeheffer, R.J. Defining unrecognized myocardial infarction: A call for standardized electrocardiographic diagnostic criteria. Am. Heart J. 2004, 148, 277–284. [Google Scholar] [CrossRef]
- Aro, A.L.; Reinier, K.; Rusinaru, C.; Uy-Evanado, A.; Darouian, N.; Phan, D.; Mack, W.J.; Jui, J.; Soliman, E.Z.; Tereshchenko, L.G.; et al. Electrical risk score beyond the left ventricular ejection fraction: Prediction of sudden cardiac death in the Oregon Sudden Unexpected Death Study and the Atherosclerosis Risk in Communities Study. Eur. Heart J. 2017, 38, 3017–3025. [Google Scholar] [CrossRef] [Green Version]
- Kors, J.A.; de Bruyne, M.C.; Hoes, A.W.; van Herpen, G.; Hofman, A.; van Bemmel, J.H.; Grobbee, D.E. T axis as an indicator of risk of cardiac events in elderly people. Lancet 1998, 352, 601–605. [Google Scholar] [CrossRef]
- Rose, G. Predicting coronary heart disease from minor symptoms and electrocardiographic findings. Br. J. Prev. Soc. Med. 1971, 25, 94–96. [Google Scholar] [CrossRef] [PubMed] [Green Version]
- Scherer, M.L.; Aspelund, T.; Sigurdsson, S.; Detrano, R.; Garcia, M.; Mitchell, G.F.; Launer, L.J.; Thorgeirsson, G.; Gudnason, V.; Harris, T.B. Abnormal T-wave axis is associated with coronary artery calcification in older adults. Scand. Cardiovasc. J. 2009, 43, 240–248. [Google Scholar] [CrossRef] [Green Version]
- Corrado, D.; Pelliccia, A.; Bjornstad, H.H.; Vanhees, L.; Biffi, A.; Borjesson, M.; Panhuyzen-Goedkoop, N.; Deligiannis, A.; Solberg, E.; Dugmore, D.; et al. Cardiovascular pre-participation screening of young competitive athletes for prevention of sudden death: Proposal for a common European protocol. Consensus Statement of the Study Group of Sport Cardiology of the Working Group of Cardiac Rehabilitation and Exercise Physiology and the Working Group of Myocardial and Pericardial Diseases of the European Society of Cardiology. Eur. Heart J. 2005, 26, 516–524. [Google Scholar]
- Maron, B.J.; Friedman, R.A.; Kligfield, P.; Levine, B.D.; Viskin, S.; Chaitman, B.R.; Okin, P.M.; Saul, J.P.; Salberg, L.; Van Hare, G.F.; et al. Assessment of the 12-lead ECG as a screening test for detection of cardiovascular disease in healthy general populations of young people (12–25 Years of Age): A scientific statement from the American Heart Association and the American College of Cardiology. Circulation 2014, 130, 1303–1334. [Google Scholar] [CrossRef] [Green Version]
- Miedema, M.D.; Dardari, Z.A.; Nasir, K.; Blankstein, R.; Knickelbine, T.; Oberembt, S.; Shaw, L.; Rumberger, J.; Michos, E.D.; Rozanski, A.; et al. Association of Coronary Artery Calcium with Long-term, Cause-Specific Mortality Among Young Adults. JAMA Netw. Open 2019, 2, e197440. [Google Scholar] [CrossRef]
- Grundy, S.M.; Stone, N.J.; Bailey, A.L.; Beam, C.; Birtcher, K.K.; Blumenthal, R.S.; Braun, L.T.; de Ferranti, S.; Faiella-Tommasino, J.; Forman, D.E.; et al. 2018 AHA/ACC/AACVPR/AAPA/ABC/ACPM/ADA/AGS/APhA/ASPC/NLA/PCNA Guideline on the Management of Blood Cholesterol: Executive Summary: A Report of the American College of Cardiology/American Heart Association Task Force on Clinical Practice Guidelines. J. Am. Coll. Cardiol. 2019, 73, 3168–3209. [Google Scholar] [CrossRef]
- Ward, S.; Lloyd Jones, M.; Pandor, A.; Holmes, M.; Ara, R.; Ryan, A.; Yeo, W.; Payne, N. A systematic review and economic evaluation of statins for the prevention of coronary events. Health Technol. Assess. 2007, 11, 1–160, iii–iv. [Google Scholar] [CrossRef] [Green Version]
- Lloyd-Jones, D.M.; Walsh, J.A.; Prineas, R.J.; Ning, H.; Liu, K.; Daviglus, M.L.; Shea, S.; Detrano, R.C.; Tandri, H.; Greenland, P. Association of electrocardiographic abnormalities with coronary artery calcium and carotid artery intima-media thickness in individuals without clinical coronary heart disease (from the Multi-Ethnic Study of Atherosclerosis [MESA]). Am. J. Cardiol. 2009, 104, 1086–1091. [Google Scholar] [CrossRef] [Green Version]
- Taylor, A.J.; Rodriguez, A.E.; Lee, J.C.; Mathew, S.B.; Cassimatis, D.; Gates, D.; Bindeman, J.; Feuerstein, I.M.; Do, S.W.; O’Malley, P.G. The relationship between subclinical atherosclerosis and electrocardiographic abnormalities as biomarkers of cardiovascular risk. Biomarkers 2008, 13, 496–504. [Google Scholar] [CrossRef]
- Chang, Y.; Kim, B.K.; Yun, K.E.; Cho, J.; Zhang, Y.; Rampal, S.; Zhao, D.; Jung, H.S.; Choi, Y.; Ahn, J.; et al. Metabolically-healthy obesity and coronary artery calcification. J. Am. Coll. Cardiol. 2014, 63, 2679–2686. [Google Scholar] [CrossRef] [Green Version]
- Chalasani, N.; Younossi, Z.; Lavine, J.E.; Diehl, A.M.; Brunt, E.M.; Cusi, K.; Charlton, M.; Sanyal, A.J. The diagnosis and management of non-alcoholic fatty liver disease: Practice Guideline by the American Association for the Study of Liver Diseases, American College of Gastroenterology, and the American Gastroenterological Association. Hepatology 2012, 55, 2005–2023. [Google Scholar] [CrossRef] [PubMed]
- Levey, A.S.; Stevens, L.A.; Schmid, C.H.; Zhang, Y.L.; Castro, A.F., 3rd; Feldman, H.I.; Kusek, J.W.; Eggers, P.; Van Lente, F.; Greene, T.; et al. A new equation to estimate glomerular filtration rate. Ann. Intern. Med. 2009, 150, 604–612. [Google Scholar] [CrossRef]
- Prineas, R.J.; Crow, R.S.; Zhang, Z.-M. The Minnesota Code Manual of Electrocardiographic Findings; Springer Science & Business Media: Boston, MA, USA, 2009. [Google Scholar]
- Holkeri, A.; Eranti, A.; Haukilahti, M.A.E.; Kerola, T.; Kentta, T.V.; Tikkanen, J.T.; Anttonen, O.; Noponen, K.; Seppanen, T.; Rissanen, H.; et al. Predicting sudden cardiac death in a general population using an electrocardiographic risk score. Heart 2020, 106, 427–433. [Google Scholar] [CrossRef] [Green Version]
- Kang, J.; Chang, Y.; Kim, S.; Sung, K.C.; Shin, H.; Ryu, S. Increased burden of coronary artery calcium from elevated blood pressure in low-risk young adults. Atherosclerosis 2019, 282, 188–195. [Google Scholar] [CrossRef]
- Agatston, A.S.; Janowitz, W.R.; Hildner, F.J.; Zusmer, N.R.; Viamonte, M., Jr.; Detrano, R. Quantification of coronary artery calcium using ultrafast computed tomography. J. Am. Coll. Cardiol. 1990, 15, 827–832. [Google Scholar] [CrossRef] [Green Version]
- Reilly, M.P.; Wolfe, M.L.; Localio, A.R.; Rader, D.J. Coronary artery calcification and cardiovascular risk factors: Impact of the analytic approach. Atherosclerosis 2004, 173, 69–78. [Google Scholar] [CrossRef] [PubMed]
- Tan, S.Y.; Sungar, G.W.; Myers, J.; Sandri, M.; Froelicher, V. A simplified clinical electrocardiogram score for the prediction of cardiovascular mortality. Clin. Cardiol. 2009, 32, 82–86. [Google Scholar] [CrossRef] [PubMed]
- Mohlenkamp, S.; Schmermund, A.; Lehmann, N.; Roggenbuck, U.; Dragano, N.; Stang, A.; Moebus, S.; Beck, E.M.; Schluter, C.; Sack, S.; et al. Subclinical coronary atherosclerosis and resting ECG abnormalities in an unselected general population. Atherosclerosis 2008, 196, 786–794. [Google Scholar] [CrossRef]
- Pencina, M.J.; Pencina, K.M.; Lloyd-Jones, D.; Catapano, A.L.; Thanassoulis, G.; Sniderman, A.D. The Expected 30-Year Benefits of Early Versus Delayed Primary Prevention of Cardiovascular Disease by Lipid Lowering. Circulation 2020, 142, 827–837. [Google Scholar] [CrossRef] [PubMed]
- Hanna, E.B.; Glancy, D.L. ST-segment depression and T-wave inversion: Classification, differential diagnosis, and caveats. Cleve Clin. J. Med. 2011, 78, 404–414. [Google Scholar] [CrossRef]
- Festa, A.; D’Agostino Jr, R.; Rautaharju, P.; O’Leary, D.H.; Rewers, M.; Mykkänen, L.; Haffner, S.M. Is QT interval a marker of subclinical atherosclerosis in nondiabetic subjects? The Insulin Resistance Atherosclerosis Study (IRAS). Stroke 1999, 30, 1566–1571. [Google Scholar] [CrossRef] [Green Version]
- Robbins, J.; Nelson, J.C.; Rautaharju, P.M.; Gottdiener, J.S. The association between the length of the QT interval and mortality in the Cardiovascular Health Study. Am. J. Med. 2003, 115, 689–694. [Google Scholar] [CrossRef] [PubMed]
- Allison, M.A.; Manson, J.E.; Aragaki, A.; Eaton, C.B.; Hsai, J.; Phillips, L.; Kuller, L.; Trevisan, M. Resting heart rate and coronary artery calcium in postmenopausal women. J. Womens Health 2011, 20, 661–669. [Google Scholar] [CrossRef] [PubMed] [Green Version]
- Perret-Guillaume, C.; Joly, L.; Benetos, A. Heart rate as a risk factor for cardiovascular disease. Prog. Cardiovasc. Dis. 2009, 52, 6–10. [Google Scholar] [CrossRef] [PubMed]
- Zhang, H.; Hu, L.; Wei, X. Prognostic value of left ventricular hypertrophy in hypertensive patients: A meta-analysis of electrocardiographic studies. J. Clin. Hypertens. 2020, 22, 254–260. [Google Scholar] [CrossRef] [Green Version]
- Mehta, S.K.; Rame, J.E.; Khera, A.; Murphy, S.A.; Canham, R.M.; Peshock, R.M.; de Lemos, J.A.; Drazner, M.H. Left ventricular hypertrophy, subclinical atherosclerosis, and inflammation. Hypertension 2007, 49, 1385–1391. [Google Scholar] [CrossRef] [PubMed] [Green Version]
- Schinkel, A.F.; Elhendy, A.; van Domburg, R.T.; Biagini, E.; Rizzello, V.; Veltman, C.E.; Ten Kate, G.L.; Sijbrands, E.J.; Akkerhuis, K.M.; Geleijnse, M.L.; et al. Prognostic significance of QRS duration in patients with suspected coronary artery disease referred for noninvasive evaluation of myocardial ischemia. Am. J. Cardiol. 2009, 104, 1490–1493. [Google Scholar] [CrossRef]
- Istolahti, T.; Lyytikäinen, L.P.; Huhtala, H.; Nieminen, T.; Kähönen, M.; Lehtimäki, T.; Eskola, M.; Anttila, I.; Jula, A.; Rissanen, H.; et al. The prognostic significance of T-wave inversion according to ECG lead group during long-term follow-up in the general population. Ann. Noninvasive Electrocardiol. 2021, 26, e12799. [Google Scholar] [CrossRef] [PubMed]
- Vähätalo, J.; Holmström, L.; Pakanen, L.; Kaikkonen, K.; Perkiömäki, J.; Huikuri, H.; Junttila, J. Coronary Artery Disease as the Cause of Sudden Cardiac Death Among Victims <50 Years of Age. Am. J. Cardiol. 2021, 147, 33–38. [Google Scholar] [CrossRef] [PubMed]
- De Bacquer, D.; De Backer, G.; Kornitzer, M.; Blackburn, H. Prognostic value of ECG findings for total, cardiovascular disease, and coronary heart disease death in men and women. Heart 1998, 80, 570–577. [Google Scholar] [CrossRef] [Green Version]


| Characteristics | ECG Risk Score | p-Value | |||
|---|---|---|---|---|---|
| 0 (N = 86,702) | 1 (N = 40,935) | 2 (N = 6027) | ≥3 (N = 1138) | ||
| Age (years) | 41.3 (41.2–41.3) | 41.5 (41.4–41.6) | 43.5 (43.4–43.8) | 44.2 (43.7–44.7) | <0.001 |
| Male (%) | 68.8 (68.5–69.2) | 86.9 (86.6–87.2) | 86.3 (85.4–87.1) | 90.4 (88.7–92.0) | <0.001 |
| Current smoker (%) | 23.0 (22.7–23.2) | 22.6 (22.3–23.0) | 21.5 (20.5–22.5) | 21.8 (19.6–23.9) | <0.001 |
| Excess alcohol intake (%) 2 | 16.7 (16.4–17.0) | 17.3 (16.9–17.7) | 18.9 (17.9–19.8) | 21.2 (19.0–23.5) | <0.001 |
| Regular Exercise (%) 3 | 13.8 (13.6–14.0) | 13.9 (13.6–14.3) | 13.1 (12.2–13.9) | 10.3 (8.6–12.1) | <0.001 |
| Highest education level (%) 4 | 83.2 (82.9–83.4) | 81.6 (81.3–82.0) | 80.0 (79.0–81.0) | 79.3 (77.0–81.6) | <0.001 |
| BMI (kg/m2) 5 | 24.3 (24.3–24.3) | 24.5 (24.5–24.5) | 24.7 (24.6–24.8) | 25.3 (25.2–25.5) | <0.001 |
| History of HTN (%) 6 | 10.7 (10.5–10.9) | 13.7 (13.4–14.1) | 19.8 (18.9–20.7) | 24.0 (21.7–26.2) | <0.001 |
| Diabetes (%) 7 | 1.3 (1.2–1.4) | 1.5 (1.4–1.6) | 2.6 (2.2–2.9) | 2.9 (2.1–3.7) | <0.001 |
| Family history of heart disease (%) | 6.5 (6.4–6.7) | 6.5 (6.3–6.8) | 5.9 (5.3–6.5) | 6.0 (4.6–7.4) | <0.001 |
| Total cholesterol (mg/dL) | 199.2 (198.9–199.4) | 199.0 (198.7–199.4) | 199.9 (199.0–200.8) | 201.2 (199.0–203.4) | <0.001 |
| LDL-C (mg/dL) | 128.9 (128.7–129.1) | 128.7 (128.4–129.0) | 128.5 (127.7–129.3) | 128.9 (127.7–130.7) | <0.001 |
| HDL-C (mg/dL) | 63.7 (63.5–63.9) | 63.8 (63.5–64.1) | 65.4 (62.6–64.1) | 64.3 (62.6–66.0) | <0.001 |
| eGFR < 60 mL/min/1.73 m2 (%) | 19.6 (19.3–19.9) | 19.1 (18.7–19.6) | 18.8 (17.7–19.8) | 20.7 (18.4–23.1) | 0.120 |
| hsCRP (mg/dL) | 1.07 (1.05–1.10) | 1.26 (1.22–1.29) | 1.81 (1.71–1.90) | 2.40 (2.17–2.62) | <0.001 |
| CAC score | 10.2 (9.6–10.8) | 11.6 (10.8–12.5) | 23.2 (21.1–25.4) | 33.9 (29.0–38.8) | <0.001 |
| ECG Parameters | N (%) 1 | ECG Parameters Individually | ECG Parameters in the Same Model | ||
|---|---|---|---|---|---|
| PRs (95% CI) | p Value | PRs (95% CI) | p Value | ||
| Heart rate (HR) > 80 bpm | 7224 (5.4) | 1.18 (1.10–1.27) | <0.001 | 1.14 (1.06–1.23) | <0.001 |
| PR interval > 220 ms | 1689 (1.3) | 0.93 (0.81–1.06) | 0.775 | 0.93 (0.81–1.07) | 0.783 |
| QRS > 110 ms | 37,558 (27.9) | 1.08 (1.04–1.12) | <0.001 | 1.07 (1.03–1.11) | <0.001 |
| Left ventricular hypertrophy (LVH) | 3256 (2.4) | 1.35 (1.22–1.49) | <0.001 | 1.30 (1.18–1.44) | <0.001 |
| T wave inversion | 462 (0.3) | 2.11 (1.70–2.61) | <0.001 | 1.90 (1.52–2.36) | <0.001 |
| Prolonged QTc | 7977 (5.9) | 1.22 (1.14–1.30) | <0.001 | 1.14 (1.07–1.22) | <0.001 |
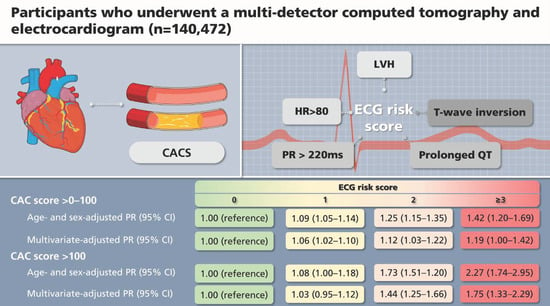
| CAC Score | ECG Risk Score | p Value | |||
|---|---|---|---|---|---|
| 0 | 1 | 2 | ≥3 | ||
| CAC score = 0 | 1.00 (base) | 1.00 (base) | 1.00 (base) | 1.00 (base) | |
| CAC score > 0–100 | |||||
| Prevalent cases (%) | 8461 (9.8) | 4901(12.0) | 910 (15.1) | 197 (17.3) | |
| Age- and sex-adjusted PR 1 (95% CI) | 1.00 (reference) | 1.09 (1.05–1.14) | 1.25 (1.15–1.35) | 1.42 (1.20–1.69) | <0.001 |
| Multivariate-adjusted PR 1 (95% CI) | 1.00 (reference) | 1.06 (1.02–1.10) | 1.12 (1.03–1.22) | 1.19 (1.00–1.42) | <0.001 |
| CAC score > 100 | |||||
| Prevalent cases (%) | 1850 (2.1) | 1098 (2.7) | 339 (5.6) | 85 (7.5) | |
| Age- and sex-adjusted PR 1 (95% CI) | 1.00 (reference) | 1.08 (1.00–1.18) | 1.73 (1.51–1.20) | 2.27 (1.74–2.95) | <0.001 |
| Multivariate-adjusted PR 1 (95% CI) | 1.00 (reference) | 1.03 (0.95–1.12) | 1.44 (1.25–1.66) | 1.75 (1.33–2.29) | <0.001 |
| CAC Score | ECG Risk Score | p- Value | |||
|---|---|---|---|---|---|
| 0 | 1 | 2 | ≥3 | ||
| Age- and sex-adjusted CAC score ratio (95% CI) | 1.0 (reference) | 1.03 (1.02–1.04) | 1.22 (1.20–1.34) | 1.21 (1.18–1.25) | <0.001 |
| Multivariate-adjusted CAC score ratio (95% CI) | 1.0 (reference) | 1.01 (1.00–1.03) | 1.13 (1.10–1.16) | 1.23 (1.16–1.31) | <0.001 |
Publisher’s Note: MDPI stays neutral with regard to jurisdictional claims in published maps and institutional affiliations. |
© 2022 by the authors. Licensee MDPI, Basel, Switzerland. This article is an open access article distributed under the terms and conditions of the Creative Commons Attribution (CC BY) license (https://creativecommons.org/licenses/by/4.0/).
Share and Cite
Kang, M.; Chang, Y.; Kang, J.; Kim, Y.; Ryu, S. Electrocardiogram Risk Score and Prevalence of Subclinical Atherosclerosis: A Cross-Sectional Study. J. Pers. Med. 2022, 12, 463. https://doi.org/10.3390/jpm12030463
Kang M, Chang Y, Kang J, Kim Y, Ryu S. Electrocardiogram Risk Score and Prevalence of Subclinical Atherosclerosis: A Cross-Sectional Study. Journal of Personalized Medicine. 2022; 12(3):463. https://doi.org/10.3390/jpm12030463
Chicago/Turabian StyleKang, Minji, Yoosoo Chang, Jeonggyu Kang, Yejin Kim, and Seungho Ryu. 2022. "Electrocardiogram Risk Score and Prevalence of Subclinical Atherosclerosis: A Cross-Sectional Study" Journal of Personalized Medicine 12, no. 3: 463. https://doi.org/10.3390/jpm12030463