Article

The Dissimilar Impact in Atrial Substrate Modificationof Left and Right Pulmonary Veins Isolation after Catheter Ablation of Paroxysmal Atrial Fibrillation

by
Aikaterini Vraka
1,
Vicente Bertomeu-González
2,
Lorenzo Fácila
3,
José Moreno-Arribas
2,
Raúl Alcaraz
4 and
José J. Rieta
1,*
1
BioMIT.org, Electronic Engineering Department, Universitat Politecnica de Valencia, 46022 Valencia, Spain
2
Cardiology Department, Saint John’s University Hospital, 03550 Alicante, Spain
3
Cardiology Department, General University Hospital Consortium of Valencia, 46014 Valencia, Spain
4
Research Group in Electronic, Biomedical and Telecommunication Engineering, University of Castilla-La Mancha, 16071 Cuenca, Spain
*
Author to whom correspondence should be addressed.
J. Pers. Med. 2022, 12(3), 462; https://doi.org/10.3390/jpm12030462
Submission received: 4 February 2022 / Revised: 4 March 2022 / Accepted: 7 March 2022 / Published: 14 March 2022

Abstract

:
Since the discovery of pulmonary veins (PVs) as foci of atrial fibrillation (AF), the commonest cardiac arrhythmia, investigation revolves around PVs catheter ablation (CA) results. Notwithstanding, CA process itself is rather neglected. We aim to decompose crucial CA steps: coronary sinus (CS) catheterization and the impact of left and right PVs isolation (LPVI, RPVI), separately. We recruited 40 paroxysmal AF patients undergoing first-time CA and obtained five-minute lead II and bipolar CS recordings during sinus rhythm (SR) before CA (B), after LPVI (L) and after RPVI (R). Among others, duration, amplitude and atrial-rate variability (ARV) were calculated for P-waves and CS local activation waves (LAWs). LAWs features were compared among CS channels for reliability analysis. P-waves and LAWs features were compared after each ablation step (B, L, R). CS channels: amplitude and area were different between distal/medial ( p 0.0014 ) and distal/mid-proximal channels ( p 0.0025 ). Medial and distal showed the most and least coherent values, respectively. Correlation was higher in proximal (≥93%) than distal (≤91%) areas. P-waves: duration was significantly shortened after LPVI (after L: p = 0.0012 ,   13.30 % ). LAWs: insignificant variations. ARV modification was more prominent in LAWs (L: >+73.12%, p 0.0480 , R: <−33.94%, p 0.0642 ). Medial/mid-proximal channels are recommended during SR. CS LAWs are not significantly affected by CA but they describe more precisely CA-induced ARV modifications. LPVI provokes the highest impact in paroxysmal AF CA, significantly modifying P-wave duration.

Graphical Abstract

1. Introduction

Atrial fibrillation (AF) is the prevailing cardiac arrhythmia in the western world. Prolonged lifespan and the connection with a plenty of other comorbidities contribute to the ever-growing AF incidence. Health and economic burden caused by AF alert the need for thorough investigation on its pathophysiology [1]. AF springs principally from pulmonary veins (PVs) [2] and propagates through cardiac structures [3]. The main mechanism assisting the AF propagation is structural remodeling and fibrosis is especially contributing to the alteration of the cardiac anatomy, causing conduction heterogeneity, hence favoring the AF perpetuation [1,4]. Although conduction heterogeneity is more prominent during AF, the anatomical substrate can still be present for both atria even when patients are in sinus rhythm (SR) [5,6,7]. As PVs are the main AF foci, their electrical isolation, called catheter ablation (CA), is the star AF treatment [1,8]. Despite the high CA success rates for paroxysmal AF patients, persistent AF cases often require the CA of additional cardiac structures that trigger or propagate the AF activity, known as non-PV triggers [1,3,4,9,10,11,12].
Many techniques exist to localize non-PV triggers, with complex fractionated atrial electrograms (CFAEs) during AF [4,13,14] or low voltage electrograms (EGMs) during SR [4,15,16] being two of the most established ones. A combination of both techniques along with highly proportioned EGM fractionation has recently indicated sites showing fibrosis, with a high correlation between these areas in AF and SR [6]. Nevertheless, the effect of CA on additional non-PV triggers remains quite controversial. Evidence shows that additional ablation of these sites offers little or no improved results with respect to single PVs ablation [17,18,19]. It remains unclear, however, whether failure of additional CA applications to provide significant improvement in termination of AF stems from the incapacity of CA on sites other than PVs to terminate AF or from a vague and unclear definition of areas in need of ablation due to highly complex EGMs, thus highlighting the need for more reliable algorithms able to properly evaluate the atrial substrate [6,14].
So far, CA outcome on paroxysmal AF patients is primarily assessed from the analysis of the characteristics of P-waves, which represent the activation of the atria or heart-rate (HR) variability (HRV) analysis, which assesses the ventricular response, controlled by the autonomous nervous system (ANS). P-wave duration (PWD) is the most popular P-wave feature, reflecting the overall time that the wavefront needs to be propagated throughout the atria. Existence of prolonged or short PWD is considered an indicator of AF recurrence in paroxysmal or persistent AF patients, caused by conduction heterogeneity and scarring or shortening of the atrial refractory period, respectively [20,21,22,23,24,25]. PWD shortening is connected with the elimination of the conduction heterogeneity, hence being a favorable CA marker, while it is the second P-wave part, corresponding to left atrial depolarization, that is mainly modified after CA, possibly due to vicinity with PVs, the main object of CA [26,27,28,29]. PWD analysis goes beyond CA procedures, with application in studies predicting the AF occurrence or the risk for higher AF burden after pacemaker implantation [25,30,31].
Apart from PWD, P-wave dispersion, amplitude, area or P-wave to R-peak interval are popular features utilized to predict AF recurrence [26,27,32,33]. P-wave analysis has been additionally applied to frequency domain in order to discern among healthy and AF subjects [34]. HRV is a marker of fine tuning of ANS, which consists of sympathetic and parasympathetic systems and controls sinus rhythm. Evidence shows that people with low HRV are susceptible to AF [35,36,37]. Energy delivered by radiofrequency (RF) CA (RFCA) can disturb the balance between sympathetic and parasympathetic systems, by stimulating the former and leading to temporary withdrawal of the latter, hence causing HRV attenuation, which in turn has been associated with AF recurrence [38,39,40].
The number of studies and techniques aiming to analyze the CA effect on the atrial substrate is endless. At the same time, critical CA steps and their impact on the atrial substrate alteration is a rather neglected analysis field. Firstly, the aforementioned studies observing P-wave and HRV alterations only employ recordings acquired before and after CA. This postulates the theory of a uniform impact of left (LPVI) and right PVs isolation (RPVI). It should be considered, though, the possibility of each PV side playing a different role in atrial substrate alteration and hence, in AF activity, a conjecture that can be easily verified by employing signals recorded in between the ablation of LPVI and RPVI, which are already available in the recordings of any electrophysiology laboratory during stepwise CA procedures.
Coronary sinus’ (CS) strategical position between left (LA) and right atrium (RA) allows the detection of non-PV triggers and PV reconnection gaps throughout the atria during CA procedures via CS catheterization [41,42,43,44,45,46,47,48,49]. Despite its extensive use as a CA reference, whether CS analysis could provide reliable information with respect to the AF substrate modification or which channels of CS catheter are the most appropriate for the analysis are two vital issues that remain unexplored. During CS cannulation, the most proximal pair of electrodes (9–10) is placed close to RA and the most distal pair (1–2) close to LA [44,47]. Notwithstanding, CS catheterization may be rather challenging due to variable CS anatomy and shape, aggrravated by myocardial contraction or the existence of CS dilation, factors that can lead to unstable recordings, especially from the distal tip of the catheter [50,51,52,53]. Additionally, anatomical alterations of the, adjacent to CS extremes, mitral annulus across the cardiac cycle in SR may affect furthermore the stability of recordings acquired from distal and proximal electrodes of the CS catheter [54,55]. Considering the aforementioned factors, information recorded across the CS catheter electrodes could vary significantly and the choice of the appropriate channel recruited for the analysis should be made with extreme caution.
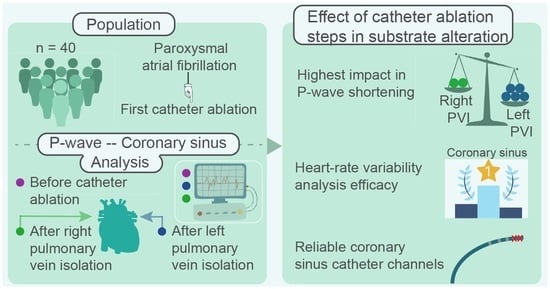
The present work aims to elucidate the aforeposed issues regarding the CA procedure, in order to arise the understanding on the mechanisms of important CA steps and their interaction with the CA result. In the first place, the ability of CS channels to describe with the highest precision possible the AF dynamics during SR is assessed and the most and least recommended CS channels are defined. Afterwards, the relevance of CS in substrate modification evaluation due to CA is investigated via analysis of features traditionally applied to ECG recordings and cross-referenced by P-waves and HRV analysis of the ECGs. Finally, the evolution of P-waves and CS LAWs after isolation of either sides of PVs is tracked in order to define the PV side that has the highest impact in atrial substrate modification due to CA.
The manuscript is organized as follows. Section 2 briefly describes the database recruited for the analysis, as well as the preprocessing and analysis steps. Section 3 presents the results, which are further interpreted in Section 4. Main findings are stated in Section 5.

2. Materials and Methods

2.1. Database

Initial database consisted of 61 paroxysmal AF patients without any previous CA sessions. Twenty-one patients were discarded due to extremely low amplitude or presence of noise and artifacts in the extreme channels of the CS recordings, probably due to dynamical change of mitral annulus anatomy during SR and vigorous myocardial contraction causing the movement of the CS cathether. The final database consisted of the remaining 40 patients.
Recordings from a standard 12-lead electrocardiogram (ECG) and a decapolar CS catheter with sampling frequency at 1 kHz were acquired by a Labsystem™ PRO EP recording system (Boston Scientific, Marlborough, MA, USA). Five-minute continuous segments before RFCA initiation (step B), after LPVI (step L) and after RPVI, which coincides with the end of the RFCA procedure ( step R), were chosen. The evolution of each ablation step is illustrated in Figure 1a. Step B corresponds to 0 % of the procedure, step L corresponds to 100 % of LPVI, 0 % of RPVI and 50 % of the total ablation procedure, while step R corresponds to 100 % of the overall procedure. The effect of ablation of each PV side is shown in Figure 1b. A statistically significant difference in features between steps B and L indicates that LPVI is critical in atrial substrate modification, while a difference between steps L and R or between B and R but without the difference between steps B and L being statistically significant, proves a significant effect of RPVI. Surface analysis was limited to lead II, as P-waves are more prominent in this lead [56].
For the study of the reliability of CS channels in preserving the AF dynamics, final database consisted of a total of 58 step B or R recordings from the 40 patients of the database. CS catheter consisted of the following channels of bipolar signals: distal (D), mid-distal (MD), medial (M), mid-proximal (MP) and proximal (P), with D channel being the closest to LA and P channel to the RA. Firstly, a multichannel comparison allowed us to define the channels that can record the AF dynamics to the most reliable degree. Selection of the analysis channel for the CS study was then performed among the most robust channels, with unique favorable criteria the high signal amplitude and low baseline fluctuation. Specific attention was paid so that the same channel would be employed for all CA steps for the same patient.
Regarding the CA procedure, all patients underwent circumferential RFCA of PVs, guided by 3-D electroanatomical mapping during SR. RFCA was initiated by performing a crown surrounding left PVs (step L), followed by a crown surround right PVs (step R). Non-inducibility of AF was confirmed by pacing in all patients and was the endpoint of the procedure.

2.2. Preprocessing

For ECG recordings, powerline interference and high frequency muscle noise were removed by a wavelet-based denoising method [57] followed by a bidirectional low-pass filter with cut-off requency at 70 Hz [58]. Baseline wander was also removed [58].
EGM denoising and mean removal were the first preprocessing steps for CS recordings analysis [59]. Although presence of ventricular activity is not dominant in atrial bipolar signals, far-field activity in line with the R-peak of the ECG recordings has been observed in some cases. Removal of ventricular activity was performed with an adaptive cancellation method [60].
Next, ectopic beats correction was performed. Ectopic beats are premature atrial or ventricular contractions that affect the HRV. In our analysis, ectopic beats in ECGs, if present, did not exceed 4% of total beats. Their correction included the detection and cancellation of the premature complexes and their replacement by a new beat via linear interpolation [61]. Among various ectopic replacement methods, linear interpolation was chosen due to its better performance for time-domain HRV features [62].
Finally, detection and delineation of atrial activations was carried out. P-waves were firstly detected by an adaptive search window prior to the R-peak [63] and then delineated [64]. Local activation waves (LAWs) of CS were detected with an algorithm based on an alternative Botteron’s technique [65]. Delineation was performed by firstly smoothing the LAW with a five-point moving average filter [66]. Delineation of both ECG and intracardiac recordings was visually inspected and corrected, if needed, by an expert.

2.3. Main Analysis

Once preprocessed, the duration, amplitude, root mean square (RMS) value, area, number of deflections and inflections (NODI) and slope rate were calculated for P-waves and LAWs, as shown in Figure 2. Final values of these features were calculated by signal-averaging. A brief description of these characteristics is provided as follows. Further details are described elsewhere [66].
  • Duration: Distance between the onset and offset of each activation.
  • Amplitude: Amplitude of positive and negative maximum of each activation were considered as positive (PosAmp) and negative amplitude (NegAmp), respectively. Peak-to-peak amplitude (PPAmp) was the distance between positive and negative maximum points. As P-waves are positive in lead II, only maximum amplitude was calculated for ECG analysis.
  • RMS: Let X n be a time-series, so that X n = { x 1 ,   x 2 , , x n } . RMS value is the quadratic mean of the function that defines the time-series. In our case, this function is defined by either the P-wave or LAW waveform.
  • Area: Area is calculated as the integration of the signal over the time interval. Trapezoidal method allows this integration, by splitting each signal into smaller and easier to calculate trapezoids. Final area is defined by the cumulative sum of these trapezoids. As LAWs contain both positive (PosAr) and negative (NegAr) parts, this method was separately applied to each one of them.
  • NODI: Deflections and inflections were calculated from the points that cross two auxiliary baselines, at ± 25 % of the signal amplitude. This metric was only calculated for LAWs, as P-waves do not show multiple major deflections and inflections.
  • Slope rate: The rhythm of increasing or decreasing slope was calculated at sample points equal to i % of the activation duration, with i = 5 ,   10 ,   20 . Slope rate at the maximum point was also computed. The equation calculating these slope rates was the following:
    S i = A m p ( t i ) A m p ( t o n s e t ) t i t o n s e t ,
    where A m p ( t i ) is the amplitude at the i % of the activation duration, A m p ( t o n s e t ) is the amplitude at the onset of the activation, t i is the sample point at the i % of the activation duration and t o n s e t is the sample point corresponding to the onset of the activation.
Afterwards, features calculated across each recording were analyzed: morphology variability (MV), dispersion and time-domain HRV features.
  • MV: A reference signal was firstly created by the 20 most similar activations of the channel under analysis and then correlated with each and every activation, using an adaptive signed correlation index (ASCI) with 12 % tolerance [67]. MV was then defined as the percentage of signals that correlated <95% with the reference signal.
  • Dispersion: Traditionally, for the calculation of dispersion, more than one ECG lead is employed and the difference between maximum and minimum activation duration across channels is computed. Alternatively, in our case, lead II was just extracted and P-wave dispersion analysis was performed in this channel because atrial activity presents the highest amplitude. Dispersion was then defined as the difference between the 25th and 75th percentiles of the atrial activations duration of each recording. This way, the effect of signal delineation accuracy is minimized and an extremely long or short activation caused by various factors will not affect significantly the results [68]. Dispersion of EGM recordings was calculated in the same way.
  • Time-domain HRV features: HRV analysis is normally performed on R-R intervals, thus describing ventricular response. As in the present work we are focused on atrial analysis, we modified the techniques by substituting R-R peaks by P-wave to P-wave for ECG and LAW to LAW for EGM recordings. As these features describe the atrial response, thus neglecting the effect of the atrioventricular node and other cardiac structures, they will be referred in the remainder of this document as atrial rate variability (ARV) features. Standard deviation of normal-to-normal beat interval (SDNN), variance of normal to normal beat interval (VARNN) and RMS of successive interbeat differences (RMSSD) were calculated for each recording.

Heart Rate Adjustment

Time-domain features of P-wave analysis are affected by variable HR [69]. More specifically, as HR increases, intervals between fiducial points of ECGs shorten. Therefore, HR adjustment is proposed in order to moderate this effect. For this purpose, additionally to the original analysis, a simple HR-adjustment factor is performed. As sampling frequency is 1 kHz, a 60 beat-per-minute recording would show one activation every 1000 sample points. However, as HR is diverse and often deviant from these values, the adjustment factor for the i th activation was set as
a d j ( i ) = 1000 I B I i ,
where I B I i is the interbeat interval between the i th and the ( i 1 ) th activations. Duration and area were normalized by this factor, while slope rates were inversely scaled by it. HR-adjusted values will be shown as HRA ( y ) , where y = d u r a t i o n ,   a r e a or S i .

2.4. Statistical Analysis

Normality and homoscedasticity were tested with Saphiro-Wilk and Levene tests, respectively [70,71]. According to the results, non-parametric tests were employed for the comparison between populations.
Reliability analysis of the CS channels with respect to AF dynamics was performed on Duration, Amplitude, RMS, Area and NODI. In the first place, a multichannel comparison via a Kruskal-Wallis (KW) test was employed [72]. Comparison in pairs of two channels was performed with a Mann-Whitney U-test (MWU) [73] with Bonferroni correction. Median values were also calculated at each channel and any significant differences between each one and the remaining channels was explored by as well using a MWU with Bonferroni correction. Afterwards, a reference signal for each channel was calculated as described from MV analysis in Section 2.3. Then, the correlation between the morphology of each channel’s reference signal in pairs of two was calculated for each recording, using an ASCI with 12 % tolerance.
For P-waves, LAWs and ARV analysis, comparison between ablation steps is performed with KW and post-hoc tests to define which step is crucial are performed with MWU with Bonferroni correction and median and interquartile range calculations. Analysis is performed for P-waves and CS LAWs separately. Percentage of variation (POV) of features was specified for each recording and between two ablation steps as
P O V ( r i ) = ( V 2 V 1 1 ) × 100 [ % ] ,
where r i is the recording of the i th patient, V 2 is the value of each feature at the posterior step and V 1 is the value of the same feature at the prior step. How POV was modified between ablation steps B-L and L-R for both P-waves and LAWs was tested with MWU. Finally, HR was measured at each ablation step and compared among all steps with KW.

3. Results

3.1. Analysis of CS Features between Channels

Table 1 shows the results of the multichannel comparison as well as the comparison in pairs of channels, for the selected features. Amplitude and Area show different values among the CS catheter channels. Paired analysis showed that differences are mostly located between D and M or D and MP channels. A trend has also been observed between values of MD and M channels. Due to Bonferroni correction, α is 0.005 , as 10 paired comparisons have been performed. Comparison between D-MD, MD-P and M-MP channels are not illustrated, as they did not show any statistically significant differences ( p > 0.03   ,   0.38 and 0.35 , respectively).
Figure 3 shows the median values obtained for each analyzed feature from the CS. As can be seen, the distal channel showed the longest LAWs Duration and lowest LAWs Amplitude and Area values for most of the features. Medial channel contained the shortest LAWs Duration and highest LAWs Amplitude values. Area was higher in mid-proximal channel, followed by medial channel. Mid-proximal channel showed overall similar behavior as medial channel, with rather high Amplitude and short LAWs Duration values.
The analysis of channels that varied significantly with respect to the others at each feature is shown in Table 2. Statistical comparison allows the detection of the channels that show the most and least deviant values and can corroborate the results shown in Figure 3.
None of the channels showed a statistically different LAWs Duration comparing to the remaining ones. Nevertheless, a trend was observed for distal and medial channels. Distal and medial channels showed additionally statistically different values with respect to the remaining channels regarding LAWs Amplitude and Area features. Mid-proximal channel also showed statistically significant difference than the other channels for positive Amplitude and a trend for the remaining Amplitude and Area features. Combining the aforementioned observations with the median values of the LAWs features for each CS channel presented in Figure 3, we can conclude that Ampitude and Area are statistically smaller in distal channel and higher in medial channel of the catheter, while duration tends to be longer in distal and shorter in medial channels. Mid-proximal channel shows a trend for high Amplitude and Area values as well.
Finally, how LAWs morphology of each channel correlated with the morphology of LAWs at each of the remaining channels can be appreciated from Figure 4. Channels of proximal area (MP, P) show higher correlations between their LAWs morphology compared to correlations from distal area (D, MD). Additionally, medial channel showed stronger correlation with proximal (93–95%) than distal area (86–91%). Although all adjacent channels showed relatively strong correlations, the highest values were observed in proximal area.

3.2. Analysis of Features from P-Waves and LAWs

The HR measurements did not reveal any statistical difference between HR at different ablation steps. However, a decrease in HR was observed in step L, as shown in Table 3.
Table 4 shows the median and interquartile range for the calculated features in P-waves at each ablation step. Multiple comparison among ablation steps is then shown in the fifth column (KW) and comparison of each feature between ablation steps in pairs of two using Bonferroni correction can be observed in the last three columns (MWU). Duration varied statistically among channels. When analysis in pairs was conducted, this variation was detected between steps B-L and B-R. As L-R comparison did not show any significant variation, the B-R significance is probably due to the B-L significance. Hence, step L is considered the critical step for the reduction in Duration, which falls from 120 ms in the beginning of the procedure to 104 ms, almost the final value observed after the end of CA of PVs.
In the same context, amplitude showed a downward trend after step L. Despite the key role of step L in the modification of Duration, when HR adjustment was performed, this step did not show any effect in HRA ( D u r a t i o n ) and neither did step R. However, modification of HRA ( D u r a t i o n ) showed a trend when values in the beginning and the end of the procedure were measured (B-R comparison), possibly due to a cumulative effect of CA in AF substrate which can be better appreciated quantitatively when isolation is totally performed. Although Area modification was not originally found to be statistically significant at each of the ablation steps, HR adjustment revealed for it a trend in B-L comparison, falling from 26.10 mV × ms to 19.40 mV × ms . Finally, it can also be observed that measurements after step L showed, in a non-significant level, lower Amplitude and Area values and higher ARV, MV values and Slope rate values than steps B and R.
Regarding LAWs, comparison of each feature among all channels revealed a significant variation of RMSSD. Apart from this observation, none of the features varied statistically at any of the ablation steps. However, some trends have been observed. The respective results are shown in Table 5. LAWs showed a trend for shortening between steps B-R, as shown by both Duration and HRA ( D u r a t i o n ) results. MV showed a trend for amplification after step L (B-L comparison) which was almost statistically significant. All ARV features employed in this study showed an increasing trend after step L (B-L comparison) and a decreasing trend after step R (L-R comparison). Note that threshold for MWU is α = 0.0167 due to Bonferroni correction.
POV of all features between each two ablation steps are illustrated in Table 6 for both P-waves and LAWs. Comparison of POV that corresponds to successive step transitions B-L and L-R can also be seen in the last two columns. In general, POV in P-waves seem to be more prominent than respective POV values in LAWs, especially in the B-L comparison. Duration in P-waves got reduced by 13.30 % after step L, while in LAWs by 5.49 % . Step R did not additionally modify at average the P-waves at all ( 0.00 % POV in L-R comparison). For LAWs, step R did reduce LAW Duration by an additional 1.93 % . Comparison between B-L and L-R alterations in P-wave Duration presented a significant difference ( p < 0.0001 ), which was not observed in LAWs, indicating a different effect of LPVI and RPVI in P-wave but not in CS LAWs Duration alteration.
HR-adjustment did not have a different effect in B-L comparison of P-waves with respect to the same comparison for non-normalized Duration variation ( 13.73 % vs. 13.30 % , respectively). However, HR-adjustment revealed a slightly higher, albeit not statistically significant, effect of step R in HRA ( D u r a t i o n ) , showing an incrementation of + 1.60 % . For LAWs, HRA ( D u r a t i o n ) slightly mitigated the effect of step L ( 3.89 % for HR-adjustment) and potentiated the effect of step R ( 4.46 % ). These results were not statistically significant either. Amplitude and HRA ( P o s A r ) values showed the same kind of variations for P-waves and LAWs, with comparison between B-L and L-R transitions showing a trend for P-waves and low statistical power for LAWs.
For the remaining features, MV showed a rather strong magnification after step L by + 144.90 % in LAWs, whereas the corresponding step in P-waves showed only a + 15.00 % of MV magnification. After step R, MV dropped by 5.93 % in LAWs and by 6.11 % in P-waves. Due to very intense variations in MV of LAWs, POV evolution between transitions from B-L and L-R varied significantly ( p = 0.0176 ). As already observed in Table 4 and Table 5, ARV features showed a notable incrementation after step L in both P-waves and LAWs. This is even more prominent in POV analysis, where ARV got increased by up to + 225.90 % in LAWs and up to + 64.86 % in P-waves (in VARNN in both cases). However, ARV after the end of the procedure (step R) got decreased by up to 55.91 % in LAWs and 42.64 % in P-waves (in VARNN in both cases). These very high variations in LAWs analysis led the B-L and L-R comparison to be statistically significant for all ARV features. As P-waves POV analysis also showed considerable variations but to a lesser extent, only POV in RMSSD varied statistically between B-L and L-R. Figure 5 then shows the POV box and whisker plots for the features that showed any kind of significant alteration or a trend, so that alterations in POV can be better illustrated. From y —axis can be additionally observed that POV in LAWs shows more scattered values that span along a wider range than P-waves analysis. This is noticeable at most of the boxplot pairs of Figure 5, but can be especially seen in the subplot of MV, where POV in P-waves is in the range of 0 to 1200 % while in LAWs in the range of 0 to 12,000%.

4. Discussion

This multi-approach study had three main objectives. First of all, to define the CS channels that can record with the highest precision and robustness the AF dynamics during SR. The analysis revealed the existence of variability among CS channels especially in Duration and Amplitude features. Differences were mostly found betweeen distal and medial and between distal and mid-proximal, with a trend between mid-distal and medial channels. A combined interpretation of the analysis of medians and the one-vs-all analysis indicates that distal channel showed the longest Duration, whilst the shortest Duration has been recorded by the medial channel. Regarding Amplitude and Area values, these were smaller in distal channel and larger in medial and mid-proximal channels. Proximal area showed the strongest morphological correlations between its channels. On the contrary, correlations in distal area or between distal and proximal channels were weaker. Hence, being the least susceptible channels to exogenous factors during SR, medial and mid-proximal channels are recommended while distal and mid-distal channels are not suggested.
Various studies corroborate these conclusions. CS EGM fractionation analysis was related with AF recurrence during SR in proximal and medial but not in distal channel in a recent study [47]. Fractionation of proximal CS EGMs indicated AF patients in another study employing recordings during AF [74]. Another work found that AF cycle length analysis in distal channel failed to predict AF termination after CA. In the same study, only mid-proximal channel predicted freedom from AF recurrence [75].
The second objective of the present study was to investigate if CS recordings can describe adequately the substrate modification due to CA, as observed by P-wave analysis. Parallel P-waves and LAWs analysis has been conducted for this purpose. The former represent the entire atria while the latter provide very specific yet crucial information on CS function. Variations were observed to a higher degree in most of the features in P-waves than LAWs. MV and ARV features were modified to an exceptionally higher extent in LAWs than P-waves. As CS recordings are closer to the tissue under ablation than surface ECG recordings, variability caused by RF energy deliverance may be illustrated with higher precision by LAWs [38,39]. Variation was more consistent in P-waves than LAWs, while the latter showed higher Dispersion in values across all features.
The last but not least purpose of this work was the evaluation of additional recordings acquired during CA in order to understand the role that the ablation of each PV side plays to the modification of the studied features and, as a consequence, to the atrial substrate alteration. A significant P-wave shortening was observed after CA of both PV sides, in line with a plethora of previous studies mainly attributed to fibrotic areas causing conduction delays [20,21,22,23]. Interestingly enough, this reduction was observed right after LPVI, with RPVI not showing any additional effect to this feature. Duration before CA was 120 ms, dropping down to 104 ms after LPVI and showing a minor increase after RPVI, to 106.5 ms. P-wave Amplitude also tended to show a lower value after LPVI which was slightly increased after RPVI, but remained overall smaller than the pre-ablative measurements.
HRV attenuation after CA is considered an indicator of CA success [38,39,40]. In line with previous studies, ARV in the present study showed a non-significant reduction after the end of the procedure. Nevertheless, recordings obtained after LPVI showed a trend for amplification of ARV values by up to + 64.86 % . Previous works studying the effect of RF energy in rabbits and students in lying position found that RF exposure can cause HRV incrementation and HR attenuation [76,77]. These findings explain the aforementioned results of the present study. Additionally, HR was indeed found to decrease after LPVI in the present work. Finally, HR-adjustment preserved the variation that was observed in Duration after LPVI, although losing statistical power. It also incremented the different effect that RPVI had on Duration, showing a slight non-statistical increase of + 1.60 % after RPVI. The reason for this slight incrementation is the HR acceleration after the end of CA procedure with respect to recordings after LPVI, where RF energy deliverance was still going on. Higher HR leads to generally narrower P-waves, the size of which is retrieved after HR-adjustment. An additional factor that may have a minor effect on this incrementation is a possible deviation of 1–2 ms in P-wave delineation precision, which due to its size (<+2.00% of duration values range) is considered acceptable.
Amplitude in P-waves showed a trend for reduction after LPVI. Although final Amplitude was non-statistically reduced with respect to the beginning of the procedure, as in previous studies [27], RPVI slightly but non-significantly increased Amplitude values. Contrastly, Slope rate was non-significantly increased after LPVI but decreased after RPVI in most of the studied time instances. It is highly possible that RF exposure also has had an effect on Amplitude and Slope rate features, explaining these variations.
Regarding LAWs, variations of most features show weaker statistical power and lower POV at each ablation step with respect to P-waves analysis. As mentioned afore, MV and ARV varied more prominently in LAWs than P-waves. MV showed a high incrementation in the order of + 144.9 % after LPVI and a decrease of 5.93 % after RPVI. The reasons for these dramatic changes are not clear. Exposure to RF energy, not only affecting ARV but also MV may be an explanation. Recently a study found MV in lead V1 P-waves of paroxysmal AF undergoing CA of PVs to decrease after the procedure, as a sign of a successful ablation [78]. Apart from the fact that these results come from P-waves analysis, which in our case show a slight attenuation overall, MV in the present analysis was extracted by a template of the 20 most similar activations and not by considering all activations of one recording. ARV was also increased after LPVI in LAWs and to a higher extent than P-waves (up to + 225.9 % ), possibly due to proximity to the tissue under ablation as explained previously.
To our knowledge, this is the first complete comparative study to perform simultaneous P-waves and LAWs analysis on recordings obtained not only before and after but also during CA of PVs. Recently, a relevant study calculated the organization of ECG recordings before, during and after CA of PVs and did not find any step to affect significantly the organization indices under calculation [79]. As many differences exist with respect to our study, a comparison would not be straightforward. In the first place, individuals studied were persistent AF patients while the present study employed exclusively paroxysmal AF patients. As persistent AF shows more complicated atrial substrate and often presents AF drivers outside of PVs, efficiency of CA of PVs is notably lower with respect to success rates in paroxysmal AF patients [19,80]. Secondly, the procedure consisted of CA of PVs, CA of CFAEs and linear CA of LA. Recordings during the procedure were the recordings after CA of PVs and before CA of CFAEs and linear CA of LA. Hence, the intermediate stage of their analyis would be the final stage of ours and no information is provided about the contribution of left or right PVs. Finally, features employed are different from the features employed in the present study.
The key aspects of CA of PVs for paroxysmal AF patients investigated in the present study improve significantly the understanding of the AF mechanisms during SR and contribute to the knowledge on how these mechanisms respond to each step of CA. Moreover, the CA procedure itself is reconsidered and the most reliable means to analyze CS EGMs are explored. Overall, a more detailed perspective of the CA procedure and the effect of RF exposure to atrial tissue is obtained.

5. Conclusions

LPVI is the critical part of CA of PVs for paroxysmal AF patients, altering significantly the P-wave duration. RF exposure tends to cause temporary ARV incrementation, which is reversed right after the end of the CA procedure. The effect of CA of PVs on CS is less straightforward and takes place to a lesser extent. Thus, other atrial structures may be more indicative of the ablation outcome and should be assessed as alternative references.
It should be noted, however, that ARV modifications regarding RF energy are more prominently observed in CS LAWs, possibly due to the vicinity with the tissue under RF exposure. Hence, the employment of CS recordings may be beneficial for the study of ARV alterations during and after CA of PVs.
Finally, studies interested in employing CS analysis are encouraged to extract and investigate medial or mid-proximal channels, as they were found to be the most robust, showing the highest coherence between LAWs morphologies. Distal and mid-distal channels, on the other hand, should be avoided as they were prone to variable morphology and less clear activations.

Author Contributions

Conceptualization, A.V., R.A. and J.J.R.; methodology, A.V., R.A. and J.J.R.; software, A.V.; validation, A.V., V.B.-G., L.F., J.M.-A., R.A. and J.J.R.; resources, V.B.-G., L.F., J.M.-A. and J.J.R.; data curation, A.V., V.B.-G., L.F. and J.M.-A.; original draft preparation, A.V.; review and editing, A.V., V.B.-G., L.F., J.M.-A., R.A. and J.J.R. All authors have read and agreed to the published version of the manuscript.

Funding

This research has received partial financial support from public grants DPI2017-83952-C3, PID2021-00X128525-IV0, PID2021-123804OB-I00 and TED2021-129996B-I00 of the Spanish Government 10.13039/501100011033 jointly with the European Regional Development Fund (EU), SBPLY/17/180501/000411 from Junta de Comunidades de Castilla-La Mancha and AICO/2021/286 from Generalitat Valenciana.

Institutional Review Board Statement

The study was conducted according to the guidelines of the Declaration of Helsinki, complied with Law 14/2007, 3rd of July, on Biomedical Research and other Spanish regulations and was approved by the Ethical Review Board of Saint John’s University Hospital (San Juan de Alicante, Alicante, Spain) with protocol code 21/046.

Informed Consent Statement

Written informed consent was granted from all the subjects participating in the present research. All acquired data were anonymized before processing.

Data Availability Statement

The data supporting reported results and presented in this study are available on request from the corresponding author.

Conflicts of Interest

The authors have no association with commercial entities that could be viewed as having an interest in the general area of the submitted manuscript. The funders had no role in the design of the study; in the collection, analyses, or interpretation of data; in the writing of the manuscript, or in the decision to publish the results.

References

  1. Hindricks, G.; Potpara, T.; Dagres, N.; Arbelo, E.; Bax, J.J.; Blomstro, C.; Boriani, G.; Castella, M.; Dan, G.A.; Dilaveris, P.E.; et al. 2020 ESC Guidelines for the diagnosis and management of atrial fibrillation developed in collaboration with the European Association of Cardio-Thoracic Surgery (EACTS). Eur. Heart J. 2020, 42, 374–498. [Google Scholar] [CrossRef]
  2. Haissaguerre, M.; Jaïs, P.; Shah, D.C.; Takahashi, A.; Hocini, M.; Quiniou, G.; Garrigue, S.; Le Mouroux, A.; Le Métayer, P.; Clémenty, J. Spontaneous initiation of atrial fibrillation by ectopic beats originating in the pulmonary veins. N. Engl. J. Med. 1998, 339, 659–666. [Google Scholar] [CrossRef] [PubMed] [Green Version]
  3. Ioannidis, P.; Zografos, T.; Christoforatou, E.; Kouvelas, K.; Tsoumeleas, A.; Vassilopoulos, C. The Electrophysiology of Atrial Fibrillation: From Basic Mechanisms to Catheter Ablation. Cardiol. Res. Pract. 2021, 2021, 4109269. [Google Scholar] [CrossRef]
  4. Lau, D.H.; Linz, D.; Schotten, U.; Mahajan, R.; Sanders, P.; Kalman, J.M. Pathophysiology of Paroxysmal and Persistent Atrial Fibrillation: Rotors, Foci and Fibrosis. Heart Lung Circ. 2017, 26, 887–893. [Google Scholar] [CrossRef] [PubMed]
  5. Mouws, E.M.J.P.; Lanters, E.A.H.; Teuwen, C.P.; van der Does, L.J.M.E.; Kik, C.; Knops, P.; Bekkers, J.A.; Bogers, A.J.J.C.; de Groot, N.M.S. Epicardial Breakthrough Waves During Sinus Rhythm: Depiction of the Arrhythmogenic Substrate? Circ. Arrhythmia Electrophysiol. 2017, 10, e005145. [Google Scholar] [CrossRef] [PubMed]
  6. Jadidi, A.; Nothstein, M.; Chen, J.; Lehrmann, H.; Dössel, O.; Allgeier, J.; Trenk, D.; Neumann, F.J.; Loewe, A.; Müller-Edenborn, B.; et al. Specific Electrogram Characteristics Identify the Extra-Pulmonary Vein Arrhythmogenic Sources of Persistent Atrial Fibrillation—Characterization of the Arrhythmogenic Electrogram Patterns During Atrial Fibrillation and Sinus Rhythm. Sci. Rep. 2020, 10, 9147. [Google Scholar] [CrossRef] [PubMed]
  7. Kharbanda, R.K.; Knops, P.; van der Does, L.; Kik, C.; Taverne, Y.; Roos-Serote, M.C.; Heida, A.; Oei, F.; Bogers, A.; de Groot, N. Simultaneous Endo-Epicardial Mapping of the Human Right Atrium: Unraveling Atrial Excitation. J. Am. Heart Assoc. 2020, 9, e017069. [Google Scholar] [CrossRef]
  8. Shah, D.; Haïssaguerre, M.; Jaïs, P. Catheter Ablation of Pulmonary Vein Foci for Atrial Fibrillation. Thorac. Cardiovasc. Surg. 1999, 47, 352–356. [Google Scholar] [CrossRef] [PubMed]
  9. Oral, H.; Knight, B.P.; Tada, H. Pulmonary vein isolation for paroxysmal and persistent atrial fibrillation. Circulation 2002, 11, 83. [Google Scholar] [CrossRef]
  10. Della Rocca, D.G.; Tarantino, N.; Trivedi, C.; Mohanty, S.; Anannab, A.; Salwan, A.S.; Gianni, C.; Bassiouny, M.; Al-Ahmad, A.; Romero, J.; et al. Non-pulmonary vein triggers in nonparoxysmal atrial fibrillation: Implications of pathophysiology for catheter ablation. J. Cardiovasc. Electrophysiol. 2020, 31, 2154–2167. [Google Scholar] [CrossRef]
  11. Lin, W.S.; Tai, C.T.; Hsieh, M.H. Catheter ablation of paroxysmal atrial fibrillation initiated by non-pulmonary vein ectopy. Circulation 2003, 12, 53. [Google Scholar] [CrossRef]
  12. Sánchez-Quintana, D.; López-Mínguez, J.R.; Pizarro, G.; Murillo, M.; Cabrera, J.A. Triggers and anatomical substrates in the genesis and perpetuation of atrial fibrillation. Curr. Cardiol. Rev. 2012, 8, 310–326. [Google Scholar] [CrossRef] [Green Version]
  13. Nademanee, K.; McKenzie, J.; Kosar, E.; Schwab, M.; Sunsaneewitayakul, B.; Vasavakul, T.; Khunnawat, C.; Ngarmukos, T. A new approach for catheter ablation of atrial fibrillation: Mapping of the electrophysiologic substrate. J. Am. Coll. Cardiol. 2004, 43, 2044–2053. [Google Scholar] [CrossRef] [Green Version]
  14. Vraka, A.; Hornero, F.; Bertomeu-González, V.; Osca, J.; Alcaraz, R.; Rieta, J.J. Short-Time Estimation of Fractionation in Atrial Fibrillation with Coarse-Grained Correlation Dimension for Mapping the Atrial Substrate. Entropy 2020, 22, 232. [Google Scholar] [CrossRef] [Green Version]
  15. Chang, S.L.; Tai, C.T.; Lin, Y.J.; Wongcharoen, W.; Lo, L.W.; Tuan, T.C.; Udyavar, A.R.; Chang, S.H.; Tsao, H.M.; Hsieh, M.H.; et al. Biatrial substrate properties in patients with atrial fibrillation. J. Cardiovasc. Electrophysiol. 2007, 18, 1134–1139. [Google Scholar] [CrossRef] [PubMed]
  16. Garg, L.; Pothineni, N.V.K.; Daw, J.M.; Hyman, M.C.; Arkles, J.; Tschabrunn, C.M.; Santangeli, P.; Marchlinski, F.E. Impact of Left Atrial Bipolar Electrogram Voltage on First Pass Pulmonary Vein Isolation During Radiofrequency Catheter Ablation. Front. Physiol. 2020, 11, 594654. [Google Scholar] [CrossRef] [PubMed]
  17. Verma, A.; Jiang, C.y.; Betts, T.R.; Chen, J.; Deisenhofer, I.; Mantovan, R.; Macle, L.; Morillo, C.A.; Haverkamp, W.; Weerasooriya, R.; et al. Approaches to catheter ablation for persistent atrial fibrillation. N. Engl. J. Med. 2015, 372, 1812–1822. [Google Scholar] [CrossRef] [PubMed]
  18. Cheng, W.H.; Lo, L.W.; Lin, Y.J.; Chang, S.L.; Hu, Y.F.; Hung, Y.; Chung, F.P.; Liao, J.N.; Tuan, T.C.; Chao, T.F.; et al. Ten-year ablation outcomes of patients with paroxysmal atrial fibrillation undergoing pulmonary vein isolation. Heart Rhythm 2019, 16, 1327–1333. [Google Scholar] [CrossRef]
  19. Inamura, Y.; Nitta, J.; Inaba, O.; Sato, A.; Takamiya, T.; Murata, K.; Ikenouchi, T.; Kono, T.; Matsumura, Y.; Takahashi, Y.; et al. Presence of non-pulmonary vein foci in patients with atrial fibrillation undergoing standard ablation of pulmonary vein isolation: Clinical characteristics and long-term ablation outcome. Int. J. Cardiol. Heart Vasc. 2021, 32, 100717. [Google Scholar] [CrossRef] [PubMed]
  20. Simpson, R.J.; Foster, J.R.; Gettes, L.S. Atrial excitability and conduction in patients with interatrial conduction defects. Am. J. Cardiol. 1982, 50, 1331–1337. [Google Scholar] [CrossRef]
  21. Blanche, C.; Tran, N.; Rigamonti, F.; Burri, H.; Zimmermann, M. Value of P-wave signal averaging to predict atrial fibrillation recurrences after pulmonary vein isolation. EP Eur. 2013, 15, 198–204. [Google Scholar] [CrossRef]
  22. Chen, Q.; Mohanty, S.; Trivedi, C.; Gianni, C.; Della Rocca, D.G.; Canpolat, U.; Burkhardt, J.D.; Sanchez, J.E.; Hranitzky, P.; Gallinghouse, G.J.; et al. Association between prolonged P wave duration and left atrial scarring in patients with paroxysmal atrial fibrillation. J. Cardiovasc. Electrophysiol. 2019, 30, 1811–1818. [Google Scholar] [CrossRef] [PubMed]
  23. Pranata, R.; Yonas, E.; Vania, R. Prolonged P-wave duration in sinus rhythm pre-ablation is associated with atrial fibrillation recurrence after pulmonary vein isolation—A systematic review and meta-analysis. Ann. Noninvasive Electrocardiol. 2019, 24, e12653. [Google Scholar] [CrossRef] [PubMed] [Green Version]
  24. Auricchio, A.; Özkartal, T.; Salghetti, F.; Neumann, L.; Pezzuto, S.; Gharaviri, A.; Demarchi, A.; Caputo, M.L.; Regoli, F.; De Asmundis, C.; et al. Short P-Wave Duration is a Marker of Higher Rate of Atrial Fibrillation Recurrences after Pulmonary Vein Isolation: New Insights into the Pathophysiological Mechanisms Through Computer Simulations. J. Am. Heart Assoc. 2021, 10, e018572. [Google Scholar] [CrossRef] [PubMed]
  25. Miao, Y.; Xu, M.; Yang, L.; Zhang, C.; Liu, H.; Shao, X. Investigating the association between P wave duration and atrial fibrillation recurrence after radiofrequency ablation in early persistent atrial fibrillation patients. Int. J. Cardiol. 2021, 351, 48–54. [Google Scholar] [CrossRef] [PubMed]
  26. Van Beeumen, K.; Houben, R.; Tavernier, R.; Ketels, S.; Duytschaever, M. Changes in P-wave area and P-wave duration after circumferential pulmonary vein isolation. EP Eur. 2010, 12, 798–804. [Google Scholar] [CrossRef] [PubMed]
  27. Maan, A.; Mansour, M.; Ruskin, J.N.; Heist, E.K. Impact of catheter ablation on P-wave parameters on 12-lead electrocardiogram in patients with atrial fibrillation. J. Electrocardiol. 2014, 47, 725–733. [Google Scholar] [CrossRef]
  28. Hu, X.; Jiang, J.; Ma, Y.; Tang, A. Novel P Wave Indices to Predict Atrial Fibrillation Recurrence After Radiofrequency Ablation for Paroxysmal Atrial Fibrillation. Med. Sci. Monit. 2016, 22, 2616–2623. [Google Scholar] [CrossRef] [PubMed] [Green Version]
  29. Vraka, A.; Bertomeu-González, V.; Hornero, F.; Quesada, A.; Alcaraz, R.; Rieta, J.J. Splitting the P-Wave: Improved Evaluation of Left Atrial Substrate Modification after Pulmonary Vein Isolation of Paroxysmal Atrial Fibrillation. Sensors 2022, 22, 290. [Google Scholar] [CrossRef] [PubMed]
  30. Alcaraz, R.; Martínez, A.; Rieta, J.J. The P Wave Time-Frequency Variability Reflects Atrial Conduction Defects before Paroxysmal Atrial Fibrillation. Ann. Noninvasive Electrocardiol. 2015, 20, 433–445. [Google Scholar] [CrossRef]
  31. Murase, Y.; Imai, H.; Ogawa, Y.; Kano, N.; Mamiya, K.; Ikeda, T.; Okabe, K.; Arai, K.; Yamazoe, S.; Torii, J.; et al. Usefulness of P-wave duration in patients with sick sinus syndrome as a predictor of atrial fibrillation. J. Arrhythmia 2021, 37, 1220–1226. [Google Scholar] [CrossRef] [PubMed]
  32. Wu, J.T.; Dong, J.Z.; Sang, C.H.; Tang, R.B.; Ma, C.S. Prolonged PR interval and risk of recurrence of atrial fibrillation after catheter ablation. Int. Heart J. 2014, 55, 126–130. [Google Scholar] [CrossRef] [Green Version]
  33. Salah, A.; Zhou, S.; Liu, Q.; Yan, H. P wave indices to predict atrial fibrillation recurrences post pulmonary vein isolation. Arq. Bras. Cardiol. 2013, 101, 519–527. [Google Scholar] [CrossRef] [PubMed]
  34. Alcaraz, R.; Martínez, A.; Rieta, J.J. Role of the P-wave high frequency energy and duration as noninvasive cardiovascular predictors of paroxysmal atrial fibrillation. Comput. Methods Programs Biomed. 2015, 119, 110–119. [Google Scholar] [CrossRef]
  35. Task Force of the European Society of Cardiology the North American Society of Pacing Electrophysiologys. Heart rate variability. Standards of measurement, physiological interpretation, and clinical use. Eur. Heart J. 1996, 17, 354–381. [Google Scholar] [CrossRef] [Green Version]
  36. Perkiömäki, J.; Ukkola, O.; Kiviniemi, A.; Tulppo, M.; Ylitalo, A.; Kesäniemi, Y.A.; Huikuri, H. Heart rate variability findings as a predictor of atrial fibrillation in middle-aged population. J. Cardiovasc. Electrophysiol. 2014, 25, 719–724. [Google Scholar] [CrossRef] [PubMed]
  37. Habibi, M.; Chahal, H.; Greenland, P.; Guallar, E.; Lima, J.A.C.; Soliman, E.Z.; Alonso, A.; Heckbert, S.R.; Nazarian, S. Resting Heart Rate, Short-Term Heart Rate Variability and Incident Atrial Fibrillation (from the Multi-Ethnic Study of Atherosclerosis (MESA)). Am. J. Cardiol. 2019, 124, 1684–1689. [Google Scholar] [CrossRef] [PubMed]
  38. Hsieh, M.H.; Chiou, C.W.; Wen, Z.C.; Wu, C.H.; Tai, C.T.; Tsai, C.F.; Ding, Y.A.; Chang, M.S.; Chen, S.A. Alterations of heart rate variability after radiofrequency catheter ablation of focal atrial fibrillation originating from pulmonary veins. Circulation 1999, 100, 2237–2243. [Google Scholar] [CrossRef]
  39. Chen, P.S.; Chen, L.S.; Fishbein, M.C.; Lin, S.F.; Nattel, S. Role of the autonomic nervous system in atrial fibrillation: Pathophysiology and therapy. Circ. Res. 2014, 114, 1500–1515. [Google Scholar] [CrossRef] [PubMed] [Green Version]
  40. Zhu, Z.; Wang, W.; Cheng, Y.; Wang, X.; Sun, J. The predictive value of heart rate variability indices tested in early period after radiofrequency catheter ablation for the recurrence of atrial fibrillation. J. Cardiovasc. Electrophysiol. 2020, 31, 1350–1355. [Google Scholar] [CrossRef]
  41. Maille, B.; Das, M.; Hussein, A.; Shaw, M.; Chaturvedi, V.; Williams, E.; Morgan, M.; Ronayne, C.; Snowdon, R.L.; Gupta, D. Reverse electrical and structural remodeling of the left atrium occurs early after pulmonary vein isolation for persistent atrial fibrillation. J. Interv. Card. Electrophysiol. 2020, 58, 9–19. [Google Scholar] [CrossRef] [PubMed]
  42. Daoud, E.G.; Niebauer, M.; Bakr, O.; Jentzer, J.; Man, K.C.; Williamson, B.D.; Hummel, J.D.; Strickberger, S.A.; Morady, F. Placement of electrode catheters into the coronary sinus during electrophysiology procedures using a femoral vein approach. Am. J. Cardiol. 1994, 74, 194–195. [Google Scholar] [CrossRef] [Green Version]
  43. Antz, M.; Otomo, K.; Arruda, M.; Scherlag, B.J.; Pitha, J.; Tondo, C.; Lazzara, R.; Jackman, W.M. Electrical conduction between the right atrium and the left atrium via the musculature of the coronary sinus. Circulation 1998, 98, 1790–1795. [Google Scholar] [CrossRef] [PubMed] [Green Version]
  44. Santangeli, P.; Marchlinski, F.E. Techniques for the provocation, localization, and ablation of non–pulmonary vein triggers for atrial fibrillation. Heart Rhythm 2017, 14, 1087–1096. [Google Scholar] [CrossRef] [PubMed] [Green Version]
  45. Ahmed, N.; Perveen, S.; Mehmood, A.; Rani, G.F.; Molon, G. Coronary Sinus Ablation Is a Key Player Substrate in Recurrence of Persistent Atrial Fibrillation. Cardiology 2019, 143, 107–113. [Google Scholar] [CrossRef]
  46. Razeghian-Jahromi, I.; Natale, A.; Nikoo, M.H. Coronary sinus diverticulum: Importance, function, and treatment. Pacing Clin. Electrophysiol. PACE 2020, 43, 1582–1587. [Google Scholar] [CrossRef]
  47. Boles, U.; Gul, E.E.; Enriquez, A.; Starr, N.; Haseeb, S.; Abdollah, H.; Simpson, C.; Baranchuk, A.; Redfearn, D.; Michael, K.; et al. Coronary sinus electrograms may predict new-onset atrial fibrillation after typical atrial flutter radiofrequency ablation. J. Atr. Fibrillation 2018, 11, 1809. [Google Scholar] [CrossRef] [PubMed]
  48. Morita, H.; Zipes, D.P.; Morita, S.T.; Wu, J. The role of coronary sinus musculature in the induction of atrial fibrillation. Heart Rhythm 2012, 9, 581–589. [Google Scholar] [CrossRef] [PubMed]
  49. Tahara, M.; Kato, R.; Ikeda, Y.; Goto, K.; Asano, S.; Mori, H.; Iwanaga, S.; Muramatsu, T.; Matsumoto, K. Differential Atrial Pacing to Detect Reconnection Gaps After Pulmonary Vein Isolation in Atrial Fibrillation. Int. Heart J. 2020, 61, 503–509. [Google Scholar] [CrossRef]
  50. Mahmud, E.; Raisinghani, A.; Keramati, S.; Auger, W.; Blanchard, D.G.; DeMaria, A.N. Dilation of the coronary sinus on echocardiogram: Prevalence and significance in patients with chronic pulmonary hypertension. JASE 2001, 14, 44–49. [Google Scholar] [CrossRef] [PubMed]
  51. Langenberg, C.J.M.; Pietersen, H.G.; Geskes, G.; Wagenmakers, A.J.M.; Soeters, P.B.; Durieux, M. Coronary Sinus Catheter Placement. Clin. Investig. Cardiol. 2003, 124, 1259–1265. [Google Scholar] [CrossRef]
  52. Saremi, F.; Thonar, B.; Sarlaty, T.; Shmayevich, I.; Malik, S.; Smith, C.W.; Krishnan, S.; Sánchez-Quintana, D.; Narula, N. Posterior interatrial muscular connection between the coronary sinus and left atrium: Anatomic and functional study of the coronary sinus with multidetector CT. Radiology 2011, 260, 671–679. [Google Scholar] [CrossRef] [PubMed]
  53. Vogt, J.; Heintze, J.; Hansky, B.; Güldner, H.; Buschler, H.; Horstkotte, D. Implantation: Tips and tricks–the cardiologist’s view. Eur. Heart J. Suppl. 2004, 6, D47–D52. [Google Scholar] [CrossRef]
  54. Pai, R.G.; Varadarajan, P.; Tanimoto, M. Effect of atrial fibrillation on the dynamics of mitral annular area. J. Heart Valve Dis. 2003, 12, 31–37. [Google Scholar] [PubMed]
  55. El-Maasarany, S.; Ferrett, C.G.; Firth, A.; Sheppard, M.; Henein, M.Y. The coronary sinus conduit function: Anatomical study (relationship to adjacent structures). EP Eur. 2005, 7, 475–481. [Google Scholar] [CrossRef]
  56. Meek, S.; Morris, F. ABC of clinical electrocardiography: Introduction. II—basic terminology. BMJ 2002, 324, 470–473. [Google Scholar] [CrossRef]
  57. García, M.; Martínez-Iniesta, M.; Ródenas, J.; Rieta, J.J.; Alcaraz, R. A novel wavelet-based filtering strategy to remove powerline interference from electrocardiograms with atrial fibrillation. Physiol. Meas. 2018, 39, 115006. [Google Scholar] [CrossRef] [PubMed]
  58. Sörnmo, L.; Laguna, P. Electrocardiogram (ECG) Signal Processing. In Wiley Encyclopedia of Biomedical Engineering; John Wiley and Sons: Hoboken, NJ, USA, 2006; Volume 2, pp. 1298–1313. [Google Scholar] [CrossRef]
  59. Martínez-Iniesta, M.; Ródenas, J.; Rieta, J.J.; Alcaraz, R. The stationary wavelet transform as an efficient reductor of powerline interference for atrial bipolar electrograms in cardiac electrophysiology. Physiol. Meas. 2019, 40, 075003. [Google Scholar] [CrossRef] [PubMed]
  60. Alcaraz, R.; Rieta, J.J. Adaptive singular value cancelation of ventricular activity in single-lead atrial fibrillation electrocardiograms. Physiol. Meas. 2008, 29, 1351–1369. [Google Scholar] [CrossRef] [PubMed]
  61. Martínez, A.; Alcaraz, R.; Rieta, J.J. Detection and removal of ventricular ectopic beats in atrial fibrillation recordings via principal component analysis. In Proceedings of the Annual International Conference of the IEEE Engineering in Medicine and Biology Society, Boston, MA, USA, 30 August–3 September 2011; pp. 4693–4696. [Google Scholar] [CrossRef]
  62. Choi, A.; Shin, H. Quantitative Analysis of the Effect of an Ectopic Beat on the Heart Rate Variability in the Resting Condition. Front. Physiol. 2018, 9, 922. [Google Scholar] [CrossRef]
  63. Martinez, A.; Alcaraz, R.; Rieta, J.J. A new method for automatic delineation of ECG fiducial points based on the Phasor Transform. In Proceedings of the Annual International Conference of the IEEE Engineering in Medicine and Biology Society, Buenos Aires, Argentina, 31 August–4 September 2010; pp. 4586–4589. [Google Scholar] [CrossRef]
  64. González, F.; Alcaraz, R.; Rieta, J.J. Electrocardiographic P-wave delineation based on adaptive slope Gaussian detection. In Proceedings of the 2017 Computing in Cardiology (CinC), Rennes, France, 24–27 September 2017; pp. 1–4. [Google Scholar] [CrossRef]
  65. Osorio, D.; Alcaraz, R.; Rieta, J.J. A fractionation-based local activation wave detector for atrial electrograms of atrial fibrillation. In Proceedings of the 2017 Computing in Cardiology (CinC), Rennes, France, 24–27 September 2017; pp. 1–4. [Google Scholar] [CrossRef]
  66. Vraka, A.; Bertomeu-González, V.; Osca, J.; Ravelli, F.; Alcaraz, R.; Rieta, J.J. Study on How Catheter Ablation Affects Atrial Structures in Patients with Paroxysmal Atrial Fibrillation: The Case of the Coronary Sinus. In Proceedings of the 2020 International Conference on e-Health and Bioengineering (EHB), Iasi, Romania, 29–30 October 2020; pp. 1–4. [Google Scholar] [CrossRef]
  67. Alcaraz, R.; Hornero, F.; Martínez, A.; Rieta, J.J. Short-time regularity assessment of fibrillatory waves from the surface ECG in atrial fibrillation. Physiol. Meas. 2012, 33, 969–984. [Google Scholar] [CrossRef] [PubMed]
  68. Zawadzki, J.; Zawadzki, G.; Radziejewska, J.; Wolff, P.S.; Sławuta, A.; Gajek, J. The P wave dispersion—One pixel, one millisecond. Rev. Cardiovasc. Med. 2021, 22, 1633. [Google Scholar] [CrossRef] [PubMed]
  69. Toman, O.; Hnatkova, K.; Smetana, P.; Huster, K.M.; Šišáková, M.; Barthel, P.; Novotný, T.; Schmidt, G.; Malik, M. Physiologic heart rate dependency of the PQ interval and its sex differences. Sci. Rep. 2020, 10, 2551. [Google Scholar] [CrossRef] [PubMed]
  70. Mandelbrot, B.B. Contributions to Probability and Statistics: Essays in Honor of Harold Hotelling. Siam Rev. 1961, 3, 80. [Google Scholar]
  71. Shapiro, S.S.; Wilk, M.B. An Analysis of Variance Test for Normality (Complete Samples). Biometrika 1965, 52, 591–611. [Google Scholar] [CrossRef]
  72. Kruskal, W.H.; Wallis, W.A. Use of ranks in one-criterion variance analysis. J. Am. Stat. Assoc. 1952, 47, 583–621. [Google Scholar] [CrossRef]
  73. Mann, H.B.; Whitney, D.R. On a Test of Whether one of Two Random Variables is Stochastically Larger than the Other. Ann. Math. Stat. 1947, 18, 50–60. [Google Scholar] [CrossRef]
  74. Oral, H.; Ozaydin, M.; Chugh, A.; Scharf, C.; Tada, H.; Hall, B.; Cheung, P.; Pelosi, F.; Knight, B.P.; Morady, F. Role of the coronary sinus in maintenance of atrial fibrillation. J. Cardiovasc. Electrophysiol. 2003, 14, 1329–1336. [Google Scholar] [CrossRef] [Green Version]
  75. Di Marco, L.Y.; Raine, D.; Bourke, J.P.; Langley, P. Characteristics of atrial fibrillation cycle length predict restoration of sinus rhythm by catheter ablation. Heart Rhythm 2013, 10, 1303–1310. [Google Scholar] [CrossRef]
  76. Misek, J.; Belyaev, I.; Jakusova, V.; Tonhajzerova, I.; Barabas, J.; Jakus, J. Heart rate variability affected by radiofrequency electromagnetic field in adolescent students. Bioelectromagnetics 2018, 39, 277–288. [Google Scholar] [CrossRef] [PubMed]
  77. Misek, J.; Veternik, M.; Tonhajzerova, I.; Jakusova, V.; Janousek, L.; Jakus, J. Radiofrequency Electromagnetic Field Affects Heart Rate Variability in Rabbits. Physiol. Res. 2020, 69, 633–643. [Google Scholar] [CrossRef] [PubMed]
  78. Ortigosa, N.; Ayala, G.; Cano, Ó. Variation of P-wave indices in paroxysmal atrial fibrillation patients before and after catheter ablation. Biomed. Signal Process. Control 2021, 66, 102500. [Google Scholar] [CrossRef]
  79. McCann, A.; Vesin, J.M.; Pruvot, E.; Roten, L.; Sticherling, C.; Luca, A. ECG-Based Indices to Characterize Persistent Atrial Fibrillation Before and During Stepwise Catheter Ablation. Front. Physiol. 2021, 12, 654053. [Google Scholar] [CrossRef] [PubMed]
  80. Knecht, S.; Pradella, M.; Reichlin, T.; Mühl, A.; Bossard, M.; Stieltjes, B.; Conen, D.; Bremerich, J.; Osswald, S.; Kühne, M.; et al. Left atrial anatomy, atrial fibrillation burden, and P-wave duration—Relationships and predictors for single-procedure success after pulmonary vein isolation. EP Eur. 2018, 20, 271–278. [Google Scholar] [CrossRef]
Figure 1. (a) Steps of CA procedure for which recordings were extracted and analyzed. In step B, no ablation has been performed yet (0%). In step L, LPVI has been completed (100%) and hence, we are in the middle of the procedure (50%). Step R corresponds to RPVI and to the end of the procedure. Therefore, each step is completed (100%). (b) Conditions in order for LPVI or RPVI to have a significant effect on the features under analysis. LPVI: left pulmonary vein isolation; RPVI: right pulmonary vein isolation.
Jpm 12 00462 g001
Figure 2. (a): Duration, amplitude, RMS and area (shaded) for a P-wave. (b): Duration, amplitude, RMS, area (shaded) and NODI for a LAW. Upward arrows represent an inflection, while downward arrows a deflection. In the figure, LAW has 3 major inflections and 2 major deflections. RMS: root mean square; NODI: number of deflections and inflections; LAWs: local activation waves.
Jpm 12 00462 g002
Figure 3. Bar graph for the median values of the analyzed features at each one of the CS channels. Note the break in the vertical scale for the feature Duration.
Jpm 12 00462 g003
Figure 4. Correlations, as percentage, between the LAWs morphology in various CS catheter channels. The upper ellipse area contains the strongest and the bottom ellipse area the weakest correlations. Stronger correlations are found in proximal area, while moderate or weaker correlations are observed in distal area or between channels that are spatially far away (distal-proximal area).
Jpm 12 00462 g004
Figure 5. Representation of significant alterations illustrated as boxplots of POV for P-waves features (each top, blue) and LAWs features (each bottom, gray) between the defined ablation steps for selected features. Beware of the different vertical scale in each case for the same feature.
Jpm 12 00462 g005
Table 1. Multichannel comparison (KW) and paired comparison (MWU) for the features defined in CS channels. Statistically significant results are shown with an asterisk (*). In MWU analysis, α = 0.005 . D: distal; MD: mid-distal; M: medial; MP: mid-proximal; P: proximal.
 KWMWU
D-MD-MPD-PMD-MMD-MPM-PMP-P
Duration 0.2136 0.0188 0.0893 0.4355 0.3502 0.8927 0.2232 0.7001
PosAmp < 0.0001   * < 0.0001   * < 0.0001   * 0.0140 0.0053 0.0038   * 0.0355 0.0502
NegAmp    0.0005   * 0.0002   * 0.0016   * 0.4162 0.0087 0.0587 0.0080 0.0428
PPAmp 0.0001   * < 0.0001   * 0.0002   * 0.1476 0.0087 0.0182 0.0112 0.0491
RMS 0.0003   * 0.0001   * 0.0007   * 0.1644 0.0053 0.0409 0.0182 0.0950
PosAr 0.0008   * 0.0003   * 0.0020   * 0.1826 0.0080 0.0491 0.0182 0.0950
NegAr 0.0024   * 0.0014   * 0.0025   * 0.3384 0.0119 0.0347 0.0207 0.0758
Deflections 0.7925 0.6217 0.2458 0.3258 0.9749 0.5681 0.6126 0.7430
Inflections 0.8045 0.6324 0.7477 0.3711 0.9840 0.4349 0.7831 0.2354
Table 2. One-vs.-all analysis of defined features for each one of CS channels. Asterisks (*) indicate statistically significant values. Due to multiple comparison, α has been modified to 0.01 .
FeaturesDistalMid-DistalMedialMid-ProximalProximal
Duration 0.0472 0.8617 0.0837 0.6755 0.7345
PosAmp  < 0.0001   * 0.1688 0.0021   *     0.0061   * 0.8176
NegAmp     0.0038   * 0.4720 0.0019   * 0.0446 0.1317
PPAmp     0.0008   * 0.2669 0.0017   * 0.0204 0.3261
RMS     0.0014   * 0.2762 0.0018   * 0.0394 0.3717
PosAr     0.0022   * 0.3799 0.0027   * 0.0610 0.3555
NegAr 0.0103 0.2427 0.0049   * 0.0526 0.3113
Deflections 0.3181 0.8899 0.8099 0.3745 0.6235
Inflections 0.6108 0.7069 0.7779 0.3422 0.4243
Table 3. Heart-rate at each ablation step and comparison between three steps (KW). As result indicated a non-significant comparison, no MWU has been performed. KW: Kruskal-Wallis; MWU: Mann-Whitney U-test; B: before CA; L: after LPVI; R: after RPVI.
BLR
Median (iqr) 57.2   ( 17.0 ) 55.0   ( 12.0 ) 58.6   ( 13.4 )
KW 0.7713
Table 4. Median (interquartile) values for each feature and results for KW and MWU tests for P-waves. Statistically significant results are shown in (*). Due to Bonferroni correction, threshold for MWU (last three columns) is α = 0.0167 .
MedianKWMWU
Features B L R B-L B-R L-R
Duration [ms] 120.0   ( 12.00 ) 104.0   ( 13.00 ) 106.5   ( 21.00 )     0.003   *     0.001   *     0.009   * 0.558
PosAmp [mV] 0.428   ( 0.303 ) 0.354   ( 0.290 ) 0.374   ( 0.232 ) 0.084 0.055 0.097 0.319
PPAmp [mV] 0.431   ( 0.303 ) 0.356   ( 0.290 ) 0.374   ( 0.232 ) 0.084 0.056 0.097 0.319
RMS [mV] 0.263   ( 0.179 ) 0.214   ( 0.179 ) 0.230   ( 0.232 ) 0.144 0.103 0.150 0.275
PosAr [mV×ms] 24.63   ( 12.94 ) 16.57   ( 14.62 ) 20.39   ( 9.98 ) 0.141 0.103 0.103 0.438
S 5 [mV/ms] 0.005   ( 0.002 ) 0.007   ( 0.004 ) 0.006   ( 0.002 ) 0.162 0.110 0.235 0.211
S 10 [mV/ms] 0.007   ( 0.002 ) 0.008   ( 0.004 ) 0.007   ( 0.003 ) 0.178 0.117 0.420 0.150
S 20 [mV/ms] 0.010   ( 0.005 ) 0.011   ( 0.003 ) 0.009   ( 0.005 ) 0.336 0.384 0.693 0.133
S m a x [mV/ms] 0.010   ( 0.004 ) 0.009   ( 0.004 ) 0.008   ( 0.004 ) 0.823 0.987 0.602 0.602
HRA   ( D u r a t i o n ) 119.5   ( 57.39 ) 106.9   ( 26.04 ) 101.0   ( 36.91 ) 0.159 0.141 0.079 0.740
HRA   ( P o s A r ) 26.10   ( 16.94 ) 19.40   ( 14.16 ) 22.12   ( 14.01 ) 0.144 0.085 0.110 0.716
HRA   ( S 5 ) 0.004   ( 0.004 ) 0.006   ( 0.006 ) 0.006   ( 0.003 ) 0.367 0.261 0.235 0.537
HRA   ( S 10 ) 0.006   ( 0.003 ) 0.007   ( 0.007 ) 0.007   ( 0.004 ) 0.441 0.248 0.402 0.558
HRA   ( S 20 ) 0.010   ( 0.005 ) 0.010   ( 0.008 ) 0.009   ( 0.006 ) 0.801 0.693 0.837 0.517
HRA   ( S m a x ) 0.009   ( 0.007 ) 0.008   ( 0.006 ) 0.008   ( 0.006 ) 0.994 0.962 1.000 0.912
MV 0.605   ( 0.329 ) 0.753   ( 0.335 ) 0.675   ( 0.467 ) 0.476 0.189 0.624 0.646
Dispersion [ms] 12.00   ( 4.000 ) 11.00   ( 7.000 ) 10.00   ( 4.000 ) 0.310 0.208 0.176 0.949
SDNN 94.25   ( 55.32 ) 99.91   ( 71.96 ) 84.28   ( 62.10 ) 0.136 0.133 0.862 0.060
VARNN 8.8 × 10 3 9.9 × 10 3 7.1 × 10 3 0.136 0.133 0.862 0.060
( 1.07 × 10 4 ) ( 1.77 × 10 4 ) ( 1.21 × 10 4 )
RMSSD 95.44   ( 59.68 ) 126.79   ( 95.29 ) 92.51   ( 61.73 ) 0.136 0.052 0.962 0.069
Table 5. Median (interquartile) values for each feature and results for KW and MWU tests for CS LAWs. Statistically significant results are shown in (*). Due to Bonferroni correction, threshold for MWU (last three columns) is α = 0.0167 . As highest peak is often found in negative amplitude in LAWs, slope rate in HRA   ( S m a x ) is negative.
MedianKWMWU
Features B L R B-L B-R L-R
Duration [ms] 100.5   ( 14.00 ) 97.50   ( 18.00 ) 90.00   ( 23.00 ) 0.108 0.241 0.055 0.217
PosAmp [mV] 0.492   ( 0.987 ) 0.509   ( 0.893 ) 0.641   ( 0.775 ) 0.835 0.646 0.887 0.602
NegAmp [mV] 0.831   ( 1.572 ) 0.779   ( 0.772 ) 0.915   ( 0.486 ) 0.892 0.740 0.912 0.646
PPAmp [mV] 1.361   ( 2.624 ) 1.382   ( 1.495 ) 1.570   ( 1.462 ) 0.942 0.740 0.937 0.837
RMS [mV] 0.150   ( 0.345 ) 0.151   ( 0.195 ) 0.181   ( 0.218 ) 0.847 0.740 0.912 0.558
PosAr [mV×ms] 4.407   ( 5.175 ) 3.718   ( 5.160 ) 3.985   ( 4.836 ) 0.896 0.670 0.837 0.788
NegAr [mV×ms] 4.085   ( 5.485 ) 3.818   ( 4.045 ) 3.992   ( 4.655 ) 0.864 0.624 0.937 0.693
Deflections 3.000   ( 1.000 ) 3.000   ( 1.000 ) 3.000   ( 1.000 ) 0.916 0.682 0.889 0.828
Inflections 3.000   ( 1.000 ) 3.000   ( 1.000 ) 2.500   ( 1.000 ) 0.915 0.878 0.810 0.695
S 5 [mV/ms] 3.2 × 10 4 3.9 × 10 4 3.8 × 10 4 0.732 0.624 0.837 0.438
( 2.1 × 10 4 ) ( 3.4 × 10 4 ) ( 5.0 × 10 4 )
S 10 [mV/ms] 4.3 × 10 4 ) 4.4 × 10 4 ) 4.9 × 10 4 0.767 0.764 0.558 0.558
( 6.0 × 10 4 ) ( 5.2 × 10 4 ) ( 4.8 × 10 4
S 20 [mV/ms] 3.8 × 10 4 4.7 × 10 4 5.3 × 10 4 0.932 0.887 0.962 0.669
( 0.003 ) ( 0.001 ) ( 0.001 )
S m a x [mV/ms] 0.018   ( 0.058 ) 0.019   ( 0.027 ) 0.021   ( 0.044 ) 0.996 0.937 0.987 0.987
HRA   ( D u r a t i o n ) 104.8   ( 32.83 ) 102.1   ( 23.50 ) 91.25   ( 33.19 ) 0.159 0.669 0.060 0.200
HRA   ( P o s A r ) 4.446   ( 6.861 ) 3.503   ( 4.345 ) 3.832   ( 4.737 ) 0.882 0.669 0.693 0.937
HRA   ( S 5 ) 3.6 × 10 4 4.1 × 10 4 3.4 × 10 4 0.753 0.558 0.837 0.517
( 1.9 × 10 4 ) ( 3.9 × 10 4 ) ( 4.1 × 10 4 )
HRA   ( S 10 ) 4.4 × 10 4 4.2 × 10 4 4.7 × 10 4 0.771 0.912 0.558 0.537
( 0.001 ) ( 3.6 × 10 4 ) ( 0.001 )
HRA   ( S 20 ) 4.1 × 10 4 3.9 × 10 4 5.1 × 10 4 0.836 0.710 0.812 0.580
( 0.003 ) ( 0.001 ) ( 0.001 )
HRA   ( S m a x ) 0.015   ( 0.049 ) 0.016   ( 0.030 ) 0.019   ( 0.047 ) 0.967 0.887 0.788 0.912
MV 0.028   ( 0.048 ) 0.100   ( 0.103 ) 0.067   ( 0.351 ) 0.056 0.018 0.113 0.692
Dispersion [ms] 2.500   ( 3.000 ) 2.000   ( 4.000 ) 2.000   ( 6.000 ) 0.676 0.461 0.923 0.451
SDNN 74.18   ( 57.56 ) 96.51   ( 94.74 ) 61.75   ( 73.48 ) 0.056 0.048 0.912 0.041
VARNN 5.5 × 10 3 9.4 × 10 3 3.4 × 10 3 0.056 0.048 0.912 0.041
( 7.9 × 10 3 ) ( 2.0 × 10 4 ) ( 1.1 × 10 4 )
RMSSD 98.87   ( 86.99 ) 127.4   ( 119.8 ) 90.40   ( 74.41 )     0.049   * 0.026 0.764 0.064
Table 6. POV for between every two ablation steps for P-waves and LAWs and comparison between POV of successive step transitions B-L and L-R. Statistically significant results are shown in (*). POV: percentage of variation.
B-L [%]L-R [%]B-R [%]MWU (BL-LR)
Features P-Waves LAWs P-Waves LAWs P-Waves LAWs P-Waves LAWs
Duration 13.30 5.49 0.00 1.93 11.01 7.46 <  0.0001 0.6576
PosAmp 16.65 3.58 3.86 0.52 11.25 6.51 0.0556 0.6464
PPAmp 16.04 7.79 3.80 2.15 11.52 5.09 0.0556 0.7397
RMS 18.51 0.82 7.51 19.91 12.39 20.89 0.1032 0.7397
PosAr 25.68 5.23 6.50 1.74 20.72 4.06 0.1032 0.6693
S 5 30.95 22.47 13.75 1.82 12.95 20.24     0.1101 0.6239
S 10 15.75 1.34 11.23 11.74 0.73 13.24 0.1173 0.7637
S 20 12.84 25.89 18.35 12.20 7.87 41.24 0.3843 0.8868
S m a x 5.40 4.37 6.96 7.75 11.99 12.46 0.9874 0.9370
HRA ( D u r a t i o n ) 13.73 3.89 1.60 4.46 14.49 9.84 0.1412 0.6693
HRA ( P o s A r ) 24.54 2.90 6.60 3.86 19.65 19.94 0.0847 0.6693
HRA ( S 5 ) 58.69 14.18 9.34 16.49 43.87 4.65 0.2614 0.5583
HRA ( S 10 ) 13.41 4.10 4.38 11.80 8.45 7.21 0.2482 0.9118
HRA ( S 20 ) 3.35 5.64 6.44 32.58 3.30 25.10 0.6925 0.7160
HRA ( S m a x ) 6.60 4.11 1.21 17.70 7.74 22.53 0.9621 0.8868
MV 15.00 144.9 6.11 5.93 0.42 172.1 0.1892     0.0176   *
Dispersion 22.42 0.00 22.22 80.00 9.55 0.00 0.2084 0.4613
SDNN 28.39 79.80 24.27 33.94 0.28 0.92 0.1249     0.0480   *
VARNN 64.86 225.9 42.64 55.91 0.57 1.93 0.1249     0.0480   *
RMSSD 45.15 73.12 28.30 36.30 0.26 5.43     0.0445   *     0.0257   *
Publisher’s Note: MDPI stays neutral with regard to jurisdictional claims in published maps and institutional affiliations.

