
Prediction of Gastric Gastrointestinal Stromal Tumors before Operation: A Retrospective Analysis of Gastric Subepithelial Tumors

 ,
,
Abstract
:1. Introduction
2. Materials and Methods
2.1. Study Design
2.2. Statistical Analysis
3. Results
4. Discussion
5. Conclusions
Author Contributions
Funding
Institutional Review Board Statement
Informed Consent Statement
Data Availability Statement
Acknowledgments
Conflicts of Interest
References
- Kim, S.Y.; Shim, K.N.; Lee, J.H.; Lim, J.Y.; Kim, T.O.; Choe, A.R.; Tae, C.H.; Jung, H.K.; Moon, C.M.; Kim, S.E.; et al. Comparison of the Diagnostic Ability of Endoscopic Ultrasonography and Abdominopelvic Computed Tomography in the Diagnosis of Gastric Subepithelial Tumors. Clin. Endosc. 2019, 52, 565–573. [Google Scholar] [CrossRef] [PubMed] [Green Version]
- Min, Y.W.; Park, H.N.; Min, B.H.; Choi, D.; Kim, K.M.; Kim, S. Preoperative predictive factors for gastrointestinal stromal tumors: Analysis of 375 surgically resected gastric subepithelial tumors. J. Gastrointest. Surg. 2015, 19, 631–638. [Google Scholar] [CrossRef] [PubMed]
- Akahoshi, K.; Oya, M.; Koga, T.; Shiratsuchi, Y. Current clinical management of gastrointestinal stromal tumor. World J. Gastroenterol. 2018, 24, 2806–2817. [Google Scholar] [CrossRef] [PubMed]
- Miettinen, M.; Sobin, L.H.; Lasota, J. Gastrointestinal stromal tumors of the stomach: A clinicopathologic, immunohistochemical, and molecular genetic study of 1765 cases with long-term follow-up. Am. J. Surg. Pathol. 2005, 29, 52–68. [Google Scholar] [CrossRef] [PubMed]
- Joensuu, H. Risk stratification of patients diagnosed with gastrointestinal stromal tumor. Hum. Pathol. 2008, 39, 1411–1419. [Google Scholar] [CrossRef]
- Cho, J.W. Korean ESDSG: Current Guidelines in the Management of Upper Gastrointestinal Subepithelial Tumors. Clin. Endosc. 2016, 49, 235–240. [Google Scholar] [CrossRef]
- Facciorusso, A.; Sunny, S.P.; Del Prete, V.; Antonino, M.; Muscatiello, N. Comparison between fine-needle biopsy and fine-needle aspiration for EUS-guided sampling of subepithelial lesions: A meta-analysis. Gastrointest Endosc. 2020, 91, 14–22.e12. [Google Scholar] [CrossRef]
- Nishida, T.; Blay, J.Y.; Hirota, S.; Kitagawa, Y.; Kang, Y.K. The standard diagnosis, treatment, and follow-up of gastrointestinal stromal tumors based on guidelines. Gastric Cancer 2016, 19, 3–14. [Google Scholar] [CrossRef]
- Demetri, G.D.; von Mehren, M.; Antonescu, C.R.; DeMatteo, R.P.; Ganjoo, K.N.; Maki, R.G.; Pisters, P.W.T.; Raut, C.P.; Riedel, R.F.; Schuetze, S.; et al. NCCN Task Force Report: Update on the Management of Patients with Gastrointestinal Stromal Tumors. J. Natl. Compr. Cancer Netw. 2010, 8, S-1–S-41. [Google Scholar] [CrossRef] [Green Version]
- Casali, P.G.; Abecassis, N.; Aro, H.T.; Bauer, S.; Biagini, R.; Bielack, S.; Bonvalot, S.; Boukovinas, I.; Bovee, J.; Brodowicz, T.; et al. Gastrointestinal stromal tumours: ESMO-EURACAN Clinical Practice Guidelines for diagnosis, treatment and follow-up. Ann. Oncol. 2018, 29, iv68–iv78. [Google Scholar] [CrossRef]
- Dumonceau, J.M.; Polkowski, M.; Larghi, A.; Vilmann, P.; Giovannini, M.; Frossard, J.L.; Heresbach, D.; Pujol, B.; Fernandez-Esparrach, G.; Vazquez-Sequeiros, E.; et al. Indications, results, and clinical impact of endoscopic ultrasound (EUS)-guided sampling in gastroenterology: European Society of Gastrointestinal Endoscopy (ESGE) Clinical Guideline. Endoscopy 2011, 43, 897–912. [Google Scholar] [CrossRef] [PubMed] [Green Version]
- Polkowski, M.; Gerke, W.; Jarosz, D.; Nasierowska-Guttmejer, A.; Rutkowski, P.; Nowecki, Z.I.; Ruka, W.; Regula, J.; Butruk, E. Diagnostic yield and safety of endoscopic ultrasound-guided trucut [corrected] biopsy in patients with gastric submucosal tumors: A prospective study. Endoscopy 2009, 41, 329–334. [Google Scholar] [CrossRef] [PubMed]
- Fernandez-Esparrach, G.; Sendino, O.; Sole, M.; Pellise, M.; Colomo, L.; Pardo, A.; Martinez-Palli, G.; Arguello, L.; Bordas, J.M.; Llach, J.; et al. Endoscopic ultrasound-guided fine-needle aspiration and trucut biopsy in the diagnosis of gastric stromal tumors: A randomized crossover study. Endoscopy 2010, 42, 292–299. [Google Scholar] [CrossRef]
- Choi, C.W.; Hwang, J.H. Mucosal Incision-Assisted Endoscopic Biopsy as an Alternative to Endoscopic Ultrasound-Guided Fine-Needle Aspiration/Biopsy for Gastric Subepithelial Tumor. Clin. Endosc. 2020, 53, 505–507. [Google Scholar] [CrossRef] [PubMed]
- Polkowski, M.; Bergman, J.J. Endoscopic ultrasonography-guided biopsy for submucosal tumors: Needless needling? Endoscopy 2010, 42, 324–326. [Google Scholar] [CrossRef] [PubMed]
- Bang, J.Y.; Hawes, R.; Varadarajulu, S. A meta-analysis comparing ProCore and standard fine-needle aspiration needles for endoscopic ultrasound-guided tissue acquisition. Endoscopy 2016, 48, 339–349. [Google Scholar] [CrossRef]
- Yang, H.K.; Kim, Y.H.; Lee, Y.J.; Park, J.H.; Kim, J.Y.; Lee, K.H.; Lee, H.S. Leiomyomas in the gastric cardia: CT findings and differentiation from gastrointestinal stromal tumors. Eur. J. Radiol. 2015, 84, 1694–1700. [Google Scholar] [CrossRef]
- Liu, M.; Liu, L.; Jin, E. Gastric sub-epithelial tumors: Identification of gastrointestinal stromal tumors using CT with a practical scoring method. Gastric Cancer 2019, 22, 769–777. [Google Scholar] [CrossRef] [Green Version]
- Akahoshi, K.; Oya, M. Gastrointestinal stromal tumor of the stomach: How to manage? World J. Gastrointest. Endosc. 2010, 2, 271–277. [Google Scholar] [CrossRef]
- Palazzo, L.; Cellier, C.; Cuillerier, E.; Roseau, G.; Barbier, J.P. Endosonographic features predictive of benign and malignant gastrointestinal stromal cell tumours. Gut 2000, 46, 88–92. [Google Scholar] [CrossRef]
- Crino, S.F.; Brandolese, A.; Vieceli, F.; Paiella, S.; Conti Bellocchi, M.C.; Manfrin, E.; Bernardoni, L.; Sina, S.; D’Onofrio, M.; Marchegiani, G.; et al. Endoscopic Ultrasound Features Associated with Malignancy and Aggressiveness of Nonhypovascular Solid Pa.ncreatic Lesions: Results from a Prospective Observational Study. Ultraschall Med. 2021, 42, 167–177. [Google Scholar] [PubMed]
- Karaca, C.; Turner, B.G.; Cizginer, S.; Forcione, D.; Brugge, W. Accuracy of EUS in the evaluation of small gastric subepithelial lesions. Gastrointest. Endosc. 2010, 71, 722–727. [Google Scholar] [CrossRef] [PubMed]
- Ra, J.C.; Lee, E.S.; Lee, J.B.; Kim, J.G.; Kim, B.J.; Park, H.J.; Park, S.B.; Choi, B.I. Diagnostic performance of stomach CT compared with endoscopic ultrasonography in diagnosing gastric subepithelial tumors. Abdom. Radiol. 2017, 42, 442–450. [Google Scholar] [CrossRef] [PubMed]
- Wang, J.; Zhou, X.; Xu, F.; Ao, W.; Hu, H. Value of CT Imaging in the Differentiation of Gastric Leiomyoma From Gastric Stromal Tumor. Can. Assoc. Radiol. J. 2021, 72, 444–451. [Google Scholar] [CrossRef] [Green Version]
- Ji, J.S.; Lu, C.Y.; Mao, W.B.; Wang, Z.F.; Xu, M. Gastric schwannoma: CT findings and clinicopathologic correlation. Abdom Imaging 2015, 40, 1164–1169. [Google Scholar] [CrossRef]
- Gulbas, H.; Erkal, H.S.; Serin, M. The use of recursive partitioning analysis grouping in patients with brain metastases from non-small-cell lung cancer. Jpn. J. Clin. Oncol. 2006, 36, 193–196. [Google Scholar] [CrossRef] [Green Version]
- Park, C.K.; Lee, S.H.; Han, J.H.; Kim, C.Y.; Kim, D.W.; Paek, S.H.; Kim, D.G.; Heo, D.S.; Kim, I.H.; Jung, H.W. Recursive partitioning analysis of prognostic factors in WHO grade III glioma patients treated with radiotherapy or radiotherapy plus chemotherapy. BMC Cancer 2009, 9, 450. [Google Scholar] [CrossRef] [Green Version]
- Chow, E.; Abdolell, M.; Panzarella, T.; Harris, K.; Bezjak, A.; Warde, P.; Tannock, I. Recursive partitioning analysis of prognostic factors for survival in patients with advanced cancer. Int. J. Radiat. Oncol. Biol. Phys. 2009, 73, 1169–1176. [Google Scholar] [CrossRef]
- Laurie, G.C.S.; Rotman, M.; Asbell, S.; Phillpse, T.; Wasserman, T.; Kenna, W.G.M.; Byhardt, R. Recursive partitioning analysis (RPA) of prognostic factors in three Radiation Therapy Oncology Group (RTOG) brain metastases trials. Int. J. Radiat. Oncol. Biol. Phys. 1997, 37, 745–751. [Google Scholar]


| Characteristics | Group 2–5 | Group 5–10 | ||||
|---|---|---|---|---|---|---|
| GIST (n = 223) | Leiomyoma/ Schwannoma (n = 50) | p Value | GIST (n = 103) | Leiomyoma/ Schwannoma (n = 19) | p Value | |
| Basic data | ||||||
| Age (years) | 63 (19) | 50 (21) | <0.0001 | 61 (18) | 52 (20) | 0.025 |
| ≦55 | 66 (29.6) | 33 (66.0) | <0.0001 | 31 (30.1) | 13 (68.4) | 0.001 |
| >55 | 157 (70.4) | 17 (34.0) | 72 (69.9) | 6 (31.6) | ||
| Sex | 0.267 | 0.193 | ||||
| Male | 104 (46.6) | 19 (38.0) | 60 (58.3) | 8 (42.1) | ||
| Female | 119 (53.4) | 31 (62.0) | 43 (41.7) | 11 (57.9) | ||
| Symptoms | ||||||
| Epigastric pain | 67 (30.0) | 15 (30.0) | 1.000 | 26 (25.2) | 8 (12.1) | 0.132 |
| UGI bleeding | 75 (33.6) | 8 (16.0) | 0.014 | 36 (35.0) | 2 (10.5) | 0.035 |
| Body weight loss | 1 (0.4) | 0 | >0.999 | 3 (2.9) | 0 | >0.999 |
| Fullness | 28 (12.6) | 7 (14.0) | 0.783 | 18 (17.5) | 2 (10.5) | 0.736 |
| Dysphagia | 5 (2.2) | 1 (2.0) | >0.999 | 1 (1.0) | 0 | >0.999 |
| Vomiting | 12 (5.4) | 3 (6.0) | 0.742 | 5 (4.9) | 0 | >0.999 |
| Abdominal mass | 3 (1.3) | 0 | >0.999 | 5 (4.9) | 1 (5.3) | >0.999 |
| Obstruction | 1 (0.4) | 0 | >0.999 | 0 | 0 | n/a |
| Incidental finding | 43 (19.3) | 14 (28.0) | 0.170 | 21 (20.4) | 5 (26.3) | 0.551 |
| Laboratory data | ||||||
| Hemoglobin (g/dL) | 12.5 (3.5) | 13.8 (2.3) | <0.0001 | 12.0 (3.4) | 13.6 (1.6) | 0.014 |
| Platelet (103/µL) | 229.5 (96) | 244 (62) | 0.356 | 234.5 (99) | 252 (138) | 0.415 |
| AST (µL) | 21.5 (10) | 20.5 (7) | 0.261 | 20 (10) | 19 (15) | 0.468 |
| ALT (U/L) | 18.0 (12.0) | 19.5 (10.0) | 0.665 | 19.0 (14.0) | 17.5 (15.0) | 0.817 |
| Bilirubin total (mg/dL) | 0.5 (0.3) | 0.5 (0.2) | 0.549 | 0.5 (0.4) | 0.5 (0.3) | 0.839 |
| BUN (mg/dL) | 15.0 (6.1) | 14.5 (6.5) | 0.989 | 13.8 (6.8) | 14.7 (10.9) | 0.448 |
| Creatinine (mg/dL) | 0.8 (0.3) | 0.8 (0.3) | 0.916 | 0.9 (0.4) | 0.8 (0.6) | 0.940 |
| Characteristics | Group 2–5 | Group 5–10 | ||||
|---|---|---|---|---|---|---|
| GIST (n = 223) | Leiomyoma/ Schwannoma (n = 50) | p Value | GIST (n = 103) | Leiomyoma/ Schwannoma (n = 19) | p Value | |
| EGD findings | ||||||
| Tumor location | 0.829 | 0.410 | ||||
| ECJ/cardia/high body | 85 (38.1 | 18 (36.0) | 35 (34.0) | 4 (21.1) | ||
| Middle body | 14 (6.3) | 3 (6.0) | 12 (11.7) | 3 (15.8) | ||
| Lower body/antrum/pylorus | 26 (11.7) | 4 (8.0) | 10 (9.7) | 4 (21.1) | ||
| NA | 98 (43.9) | 25 (50.0) | 46 (44.7) | 8 (42.1) | ||
| Ulcer | 0.553 | 0.287 | ||||
| No | 56 (25.1) | 14 (28.0) | 18 (17.5) | 6 (31.6) | ||
| Yes | 71 (31.8) | 12 (24.0) | 42 (40.8) | 5 (26.3) | ||
| Unknown/not done | 96 (43.0) | 24 (48.0) | 43 (41.7) | 8 (42.1) | ||
| Infiltration | 0.238 | 0.689 | ||||
| No | 124 (55.6) | 22 (44.0) | 55 (53.4) | 10 (52.6) | ||
| Yes | 2 (0.9) | 0 | 2 (1.9) | 1 (5.3) | ||
| NA | 97 (43.5) | 28 (56.0) | 46 (44.7) | 8 (42.1) | ||
| EUS findings | ||||||
| Layer | 0.283 | 0.965 | ||||
| Muscularis propria | 120 (53.8) | 33 (66.0) | 32 (31.1) | 6 (31.6) | ||
| Submucosa | 8 (3.6) | 1 (2.0) | 0 | 0 | ||
| Unknown/not done | 95 (42.6) | 16 (32.0) | 71 (68.9) | 13 (68.4) | ||
| Echogenicity | 0.162 | 0.781 | ||||
| Hyper | 0 | 0 | 1 (1.0) | 0 | ||
| Hypo | 114 (51.1) | 34 (68.0) | 26 (25.2) | 6 (31.6) | ||
| Iso | 2 (0.9) | 0 | 0 | 0 | ||
| Mixed | 2 (0.9) | 0 | 0 | 0 | ||
| NA | 105 (47.1) | 16 (32.0) | 76 (73.8) | 13 (68.4) | ||
| CT findings | ||||||
| Enhancement | 0.003 | 0.029 | ||||
| Heterogeneity | 60 (26.9) | 6 (12.0) | 53 (51.5) | 4 (21.1) | ||
| Homogeneity | 110 (49.3) | 21 (42.0) | 30 (29.1) | 7 (36.8) | ||
| NA | 53 (23.8) | 23 (46.0) | 20 (19.4) | 8 (42.1) | ||
| Calcification | 0.154 | 0.912 | ||||
| No | 146 (65.5) | 32 (64.0) | 70 (68.0) | 12 (63.2) | ||
| Yes | 26 (11.7) | 2 (4.0) | 15 (14.6) | 3 (15.8) | ||
| NA | 51 (22.9) | 16 (32.0) | 18 (17.5) | 4 (21.1) | ||
| Ulcer | 0.298 | 0.718 | ||||
| No | 132 (59.2) | 30 (60.0) | 54 (52.4) | 11 (57.9) | ||
| Yes | 40 (17.9) | 5 (10.0) | 31 (30.1) | 4 (21.1) | ||
| NA | 51 (22.9) | 15 (30.0) | 18 (17.5) | 4 (21.1) | ||
| Necrosis | 0.014 | <0.001 | ||||
| No | 121 (54.3) | 32 (64.0) | 20 (19.4) | 12 (63.2) | ||
| Yes | 48 (21.5) | 2 (4.0) | 61 (59.2) | 3 (15.8) | ||
| NA | 54 (24.2) | 16 (32.0) | 22 (21.4) | 4 (21.1) | ||
| Adjacent organ involvement | 0.300 | 0.096 | ||||
| No | 171 (76.7) | 34 (68.0) | 64 (62.1) | 15 (78.9) | ||
| Yes | 2 (0.9) | 0 | 21 (20.4) | 0 | ||
| NA | 50 (22.4) | 16 (32.0) | 18 (17.5) | 4 (21.1) | ||
| LN enlargement | 0.120 | 0.310 | ||||
| No | 173 (77.6) | 32 964.0) | 74 (71.8) | 12 (63.2) | ||
| Yes | 4 (1.8) | 2 (4.0) | 6 (5.8) | 3 (15.8) | ||
| NA | 46 (20.6) | 16 (32.0) | 23 (22.3) | 4 (21.1) | ||
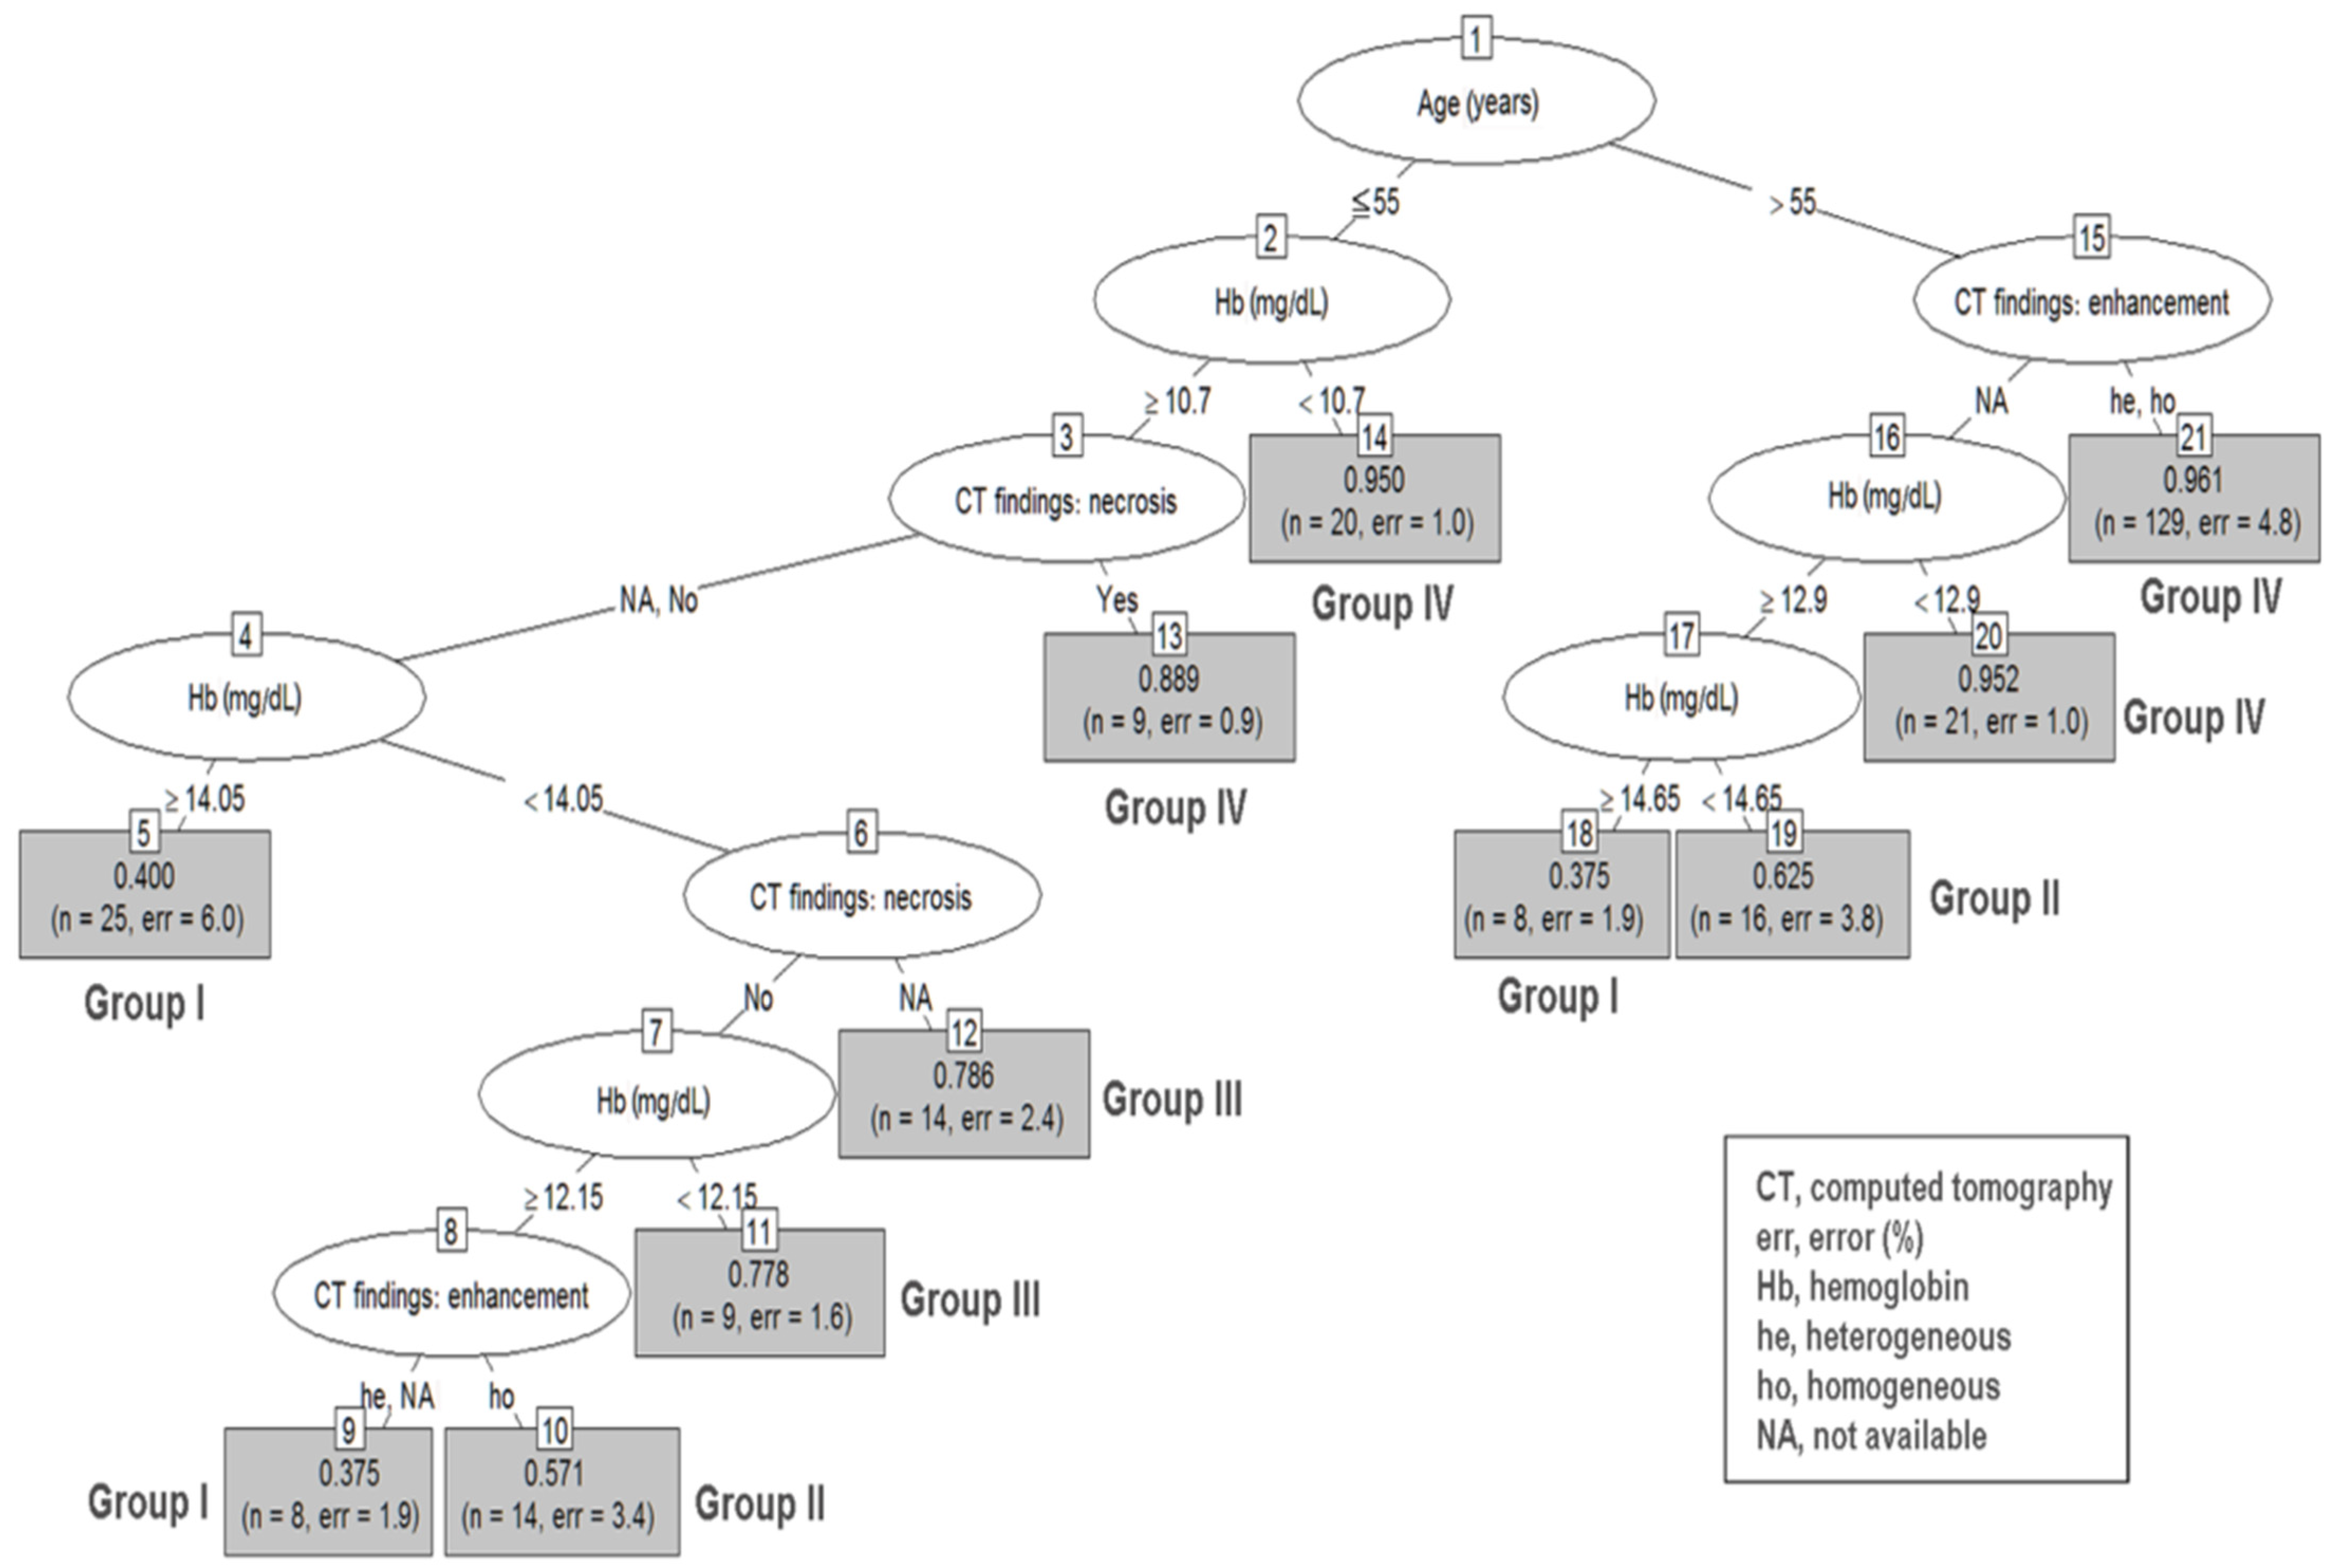
| Nodes | Risk Groups | Number of Patients | Prediction Accuracy | |
|---|---|---|---|---|
| Size 2–5 cm | ||||
| Group I | 5 | age ≦ 55, CT necrosis: no/NA, Hb ≧ 14.05 | 25 | 0.400 |
| 9 | age ≦ 55, no CT necrosis, CT heterogeneity/NA,12.15 ≦ Hb < 14.05 | 8 | 0.375 | |
| 18 | age > 55, no CT enhancement, Hb ≧ 14.65 | 8 | 0.375 | |
| Group II | 10 | age ≦ 55, no CT necrosis, CT homogeneity, 12.15 ≦ Hb < 14.05 | 14 | 0.571 |
| 19 | age > 55, no CT enhancement, 12.9 ≦ Hb < 14.65 | 16 | 0.625 | |
| Group III | 11 | age ≦ 55, no CT necrosis, 10.7 ≦ Hb < 12.15 | 9 | 0.778 |
| 12 | age ≦ 55, CT necrosis: NA, 10.7 ≦ Hb < 14.05 | 14 | 0.786 | |
| Group IV | 13 | age ≦ 55, Hb ≧ 10.7, CT necrosis | 9 | 0.889 |
| 14 | age ≦ 55, Hb < 10.7 | 20 | 0.950 | |
| 20 | age > 55, CT enhancement: NA, Hb < 12.9 | 21 | 0.952 | |
| 21 | age > 55, CT heterogeneity/homogeneity | 129 | 0.961 | |
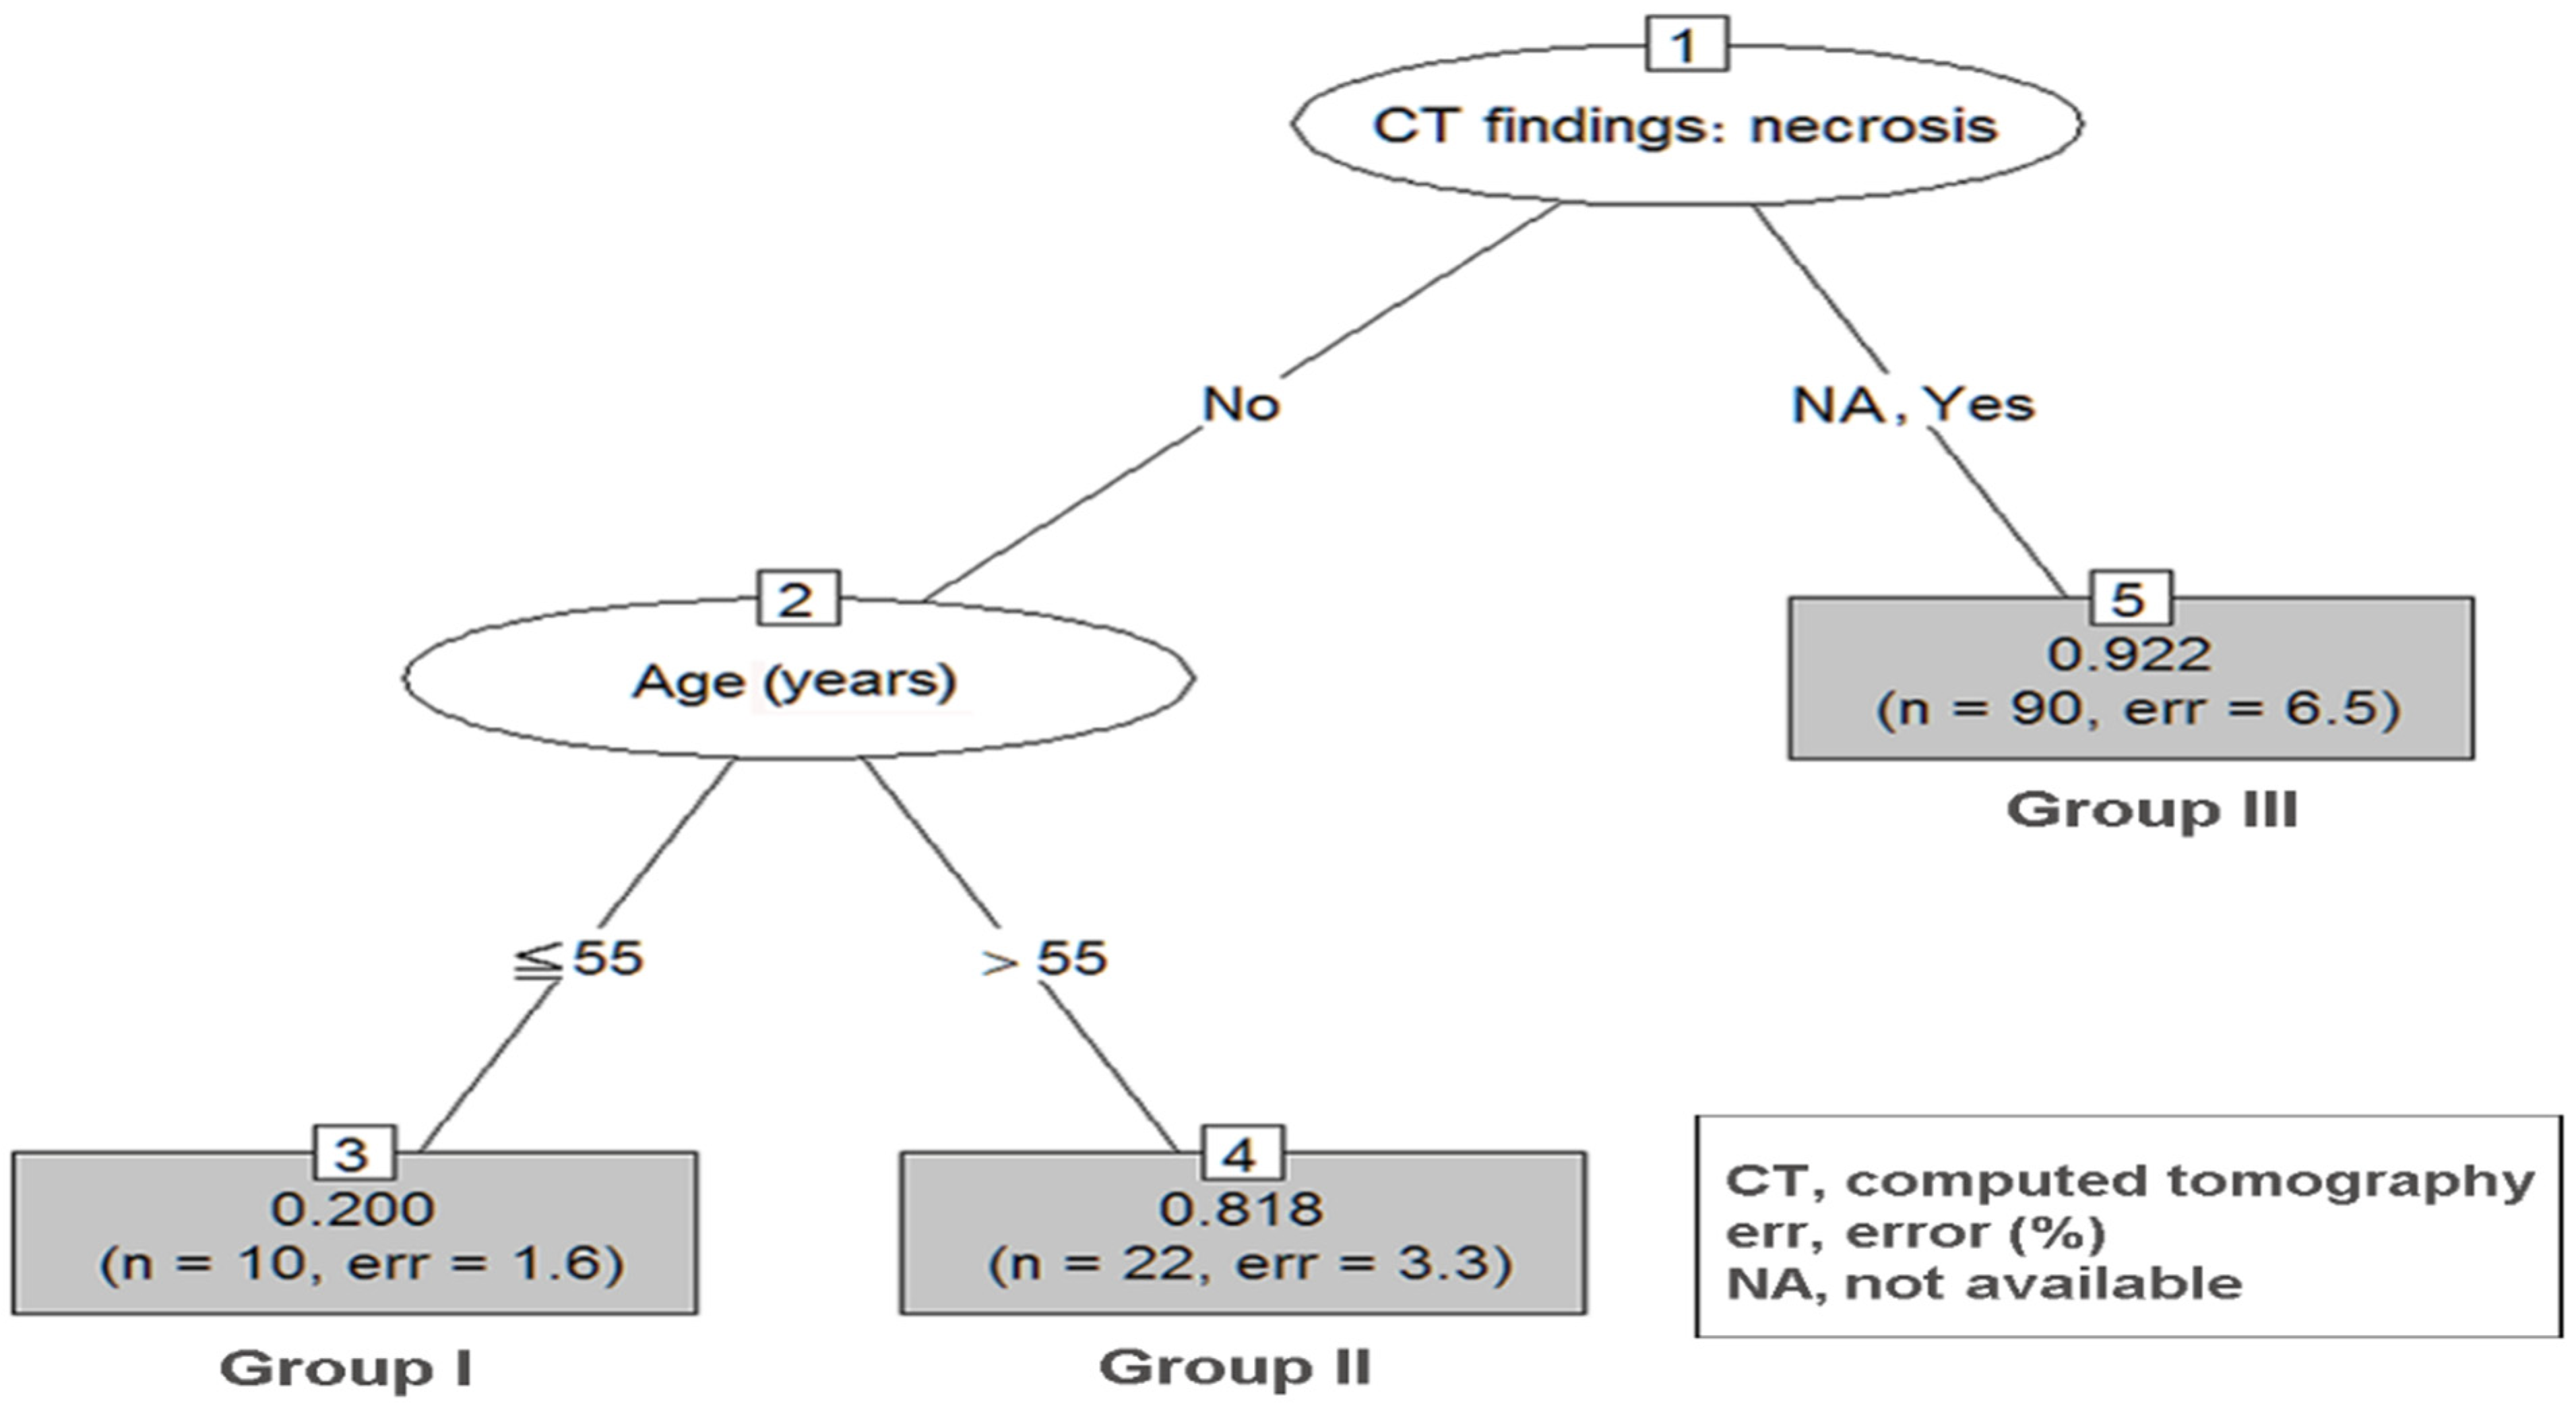
| Size 5–10 cm | ||||
| Group I | 3 | age ≦ 55, no CT necrosis | 10 | 0.200 |
| Group II | 4 | age > 55, no CT necrosis | 22 | 0.818 |
| Group III | 5 | CT necrosis: yes/NA | 90 | 0.922 |
| Risk Classification | GIST | Odds Ratio | 95% CI | p Value | |
|---|---|---|---|---|---|
| Yes | No | ||||
| Size 2–5 cm | |||||
| Group I | 16 (39.0) | 25 (61.0) | 1 | ||
| Group II | 18 (60.0) | 12 (40.0) | 2.34 | 0.90–6.14 | 0.083 |
| Group III | 18 (78.3) | 5 (21.7) | 5.63 | 1.74–18.17 | 0.004 |
| Group IV | 171 (95.5) | 8 (4.5) | 33.40 | 12.96–86.08 | <0.0001 |
| Size 5–10 cm | |||||
| Group I | 2 (20.0) | 8 (80.0) | 1 | ||
| Group II | 18 (81.8) | 12 (18.2) | 18.00 | 2.72–119.23 | 0.003 |
| Group III | 83 (92.2) | 8 (7.8) | 47.43 | 8.40–267.77 | <0.0001 |
Publisher’s Note: MDPI stays neutral with regard to jurisdictional claims in published maps and institutional affiliations. |
© 2022 by the authors. Licensee MDPI, Basel, Switzerland. This article is an open access article distributed under the terms and conditions of the Creative Commons Attribution (CC BY) license (https://creativecommons.org/licenses/by/4.0/).
Share and Cite
Lin, Y.-N.; Chen, M.-Y.; Tsai, C.-Y.; Chou, W.-C.; Hsu, J.-T.; Yeh, C.-N.; Yeh, T.-S.; Liu, K.-H. Prediction of Gastric Gastrointestinal Stromal Tumors before Operation: A Retrospective Analysis of Gastric Subepithelial Tumors. J. Pers. Med. 2022, 12, 297. https://doi.org/10.3390/jpm12020297
Lin Y-N, Chen M-Y, Tsai C-Y, Chou W-C, Hsu J-T, Yeh C-N, Yeh T-S, Liu K-H. Prediction of Gastric Gastrointestinal Stromal Tumors before Operation: A Retrospective Analysis of Gastric Subepithelial Tumors. Journal of Personalized Medicine. 2022; 12(2):297. https://doi.org/10.3390/jpm12020297
Chicago/Turabian StyleLin, Yu-Ning, Ming-Yan Chen, Chun-Yi Tsai, Wen-Chi Chou, Jun-Te Hsu, Chun-Nan Yeh, Ta-Sen Yeh, and Keng-Hao Liu. 2022. "Prediction of Gastric Gastrointestinal Stromal Tumors before Operation: A Retrospective Analysis of Gastric Subepithelial Tumors" Journal of Personalized Medicine 12, no. 2: 297. https://doi.org/10.3390/jpm12020297