
Posturographic Analysis in Patients Affected by Central and Peripheral Visual Impairment
Abstract
:1. Introduction
2. Materials and Methods
2.1. Visual Evaluation
- Best Corrected Visual Acuity (BCVA): assessed through Early Treatment Diabetic Retinopathy Study charts. BCVA was expressed in logMAR values at a distance of 4 m with the optimal refractive correction.
- Reading Acuity (RA): assessed by the Minnesota Reading test (MNRead) charts at 25 cm using +4.00 sph (1×) reading lenses, in addition to the refractive adjustment distance.
- Contrast sensitivity: evaluated through Pelli Robson charts at a distance of 1 m, with +1.00 sph lenses, in addition to the refractive adjustment distance.
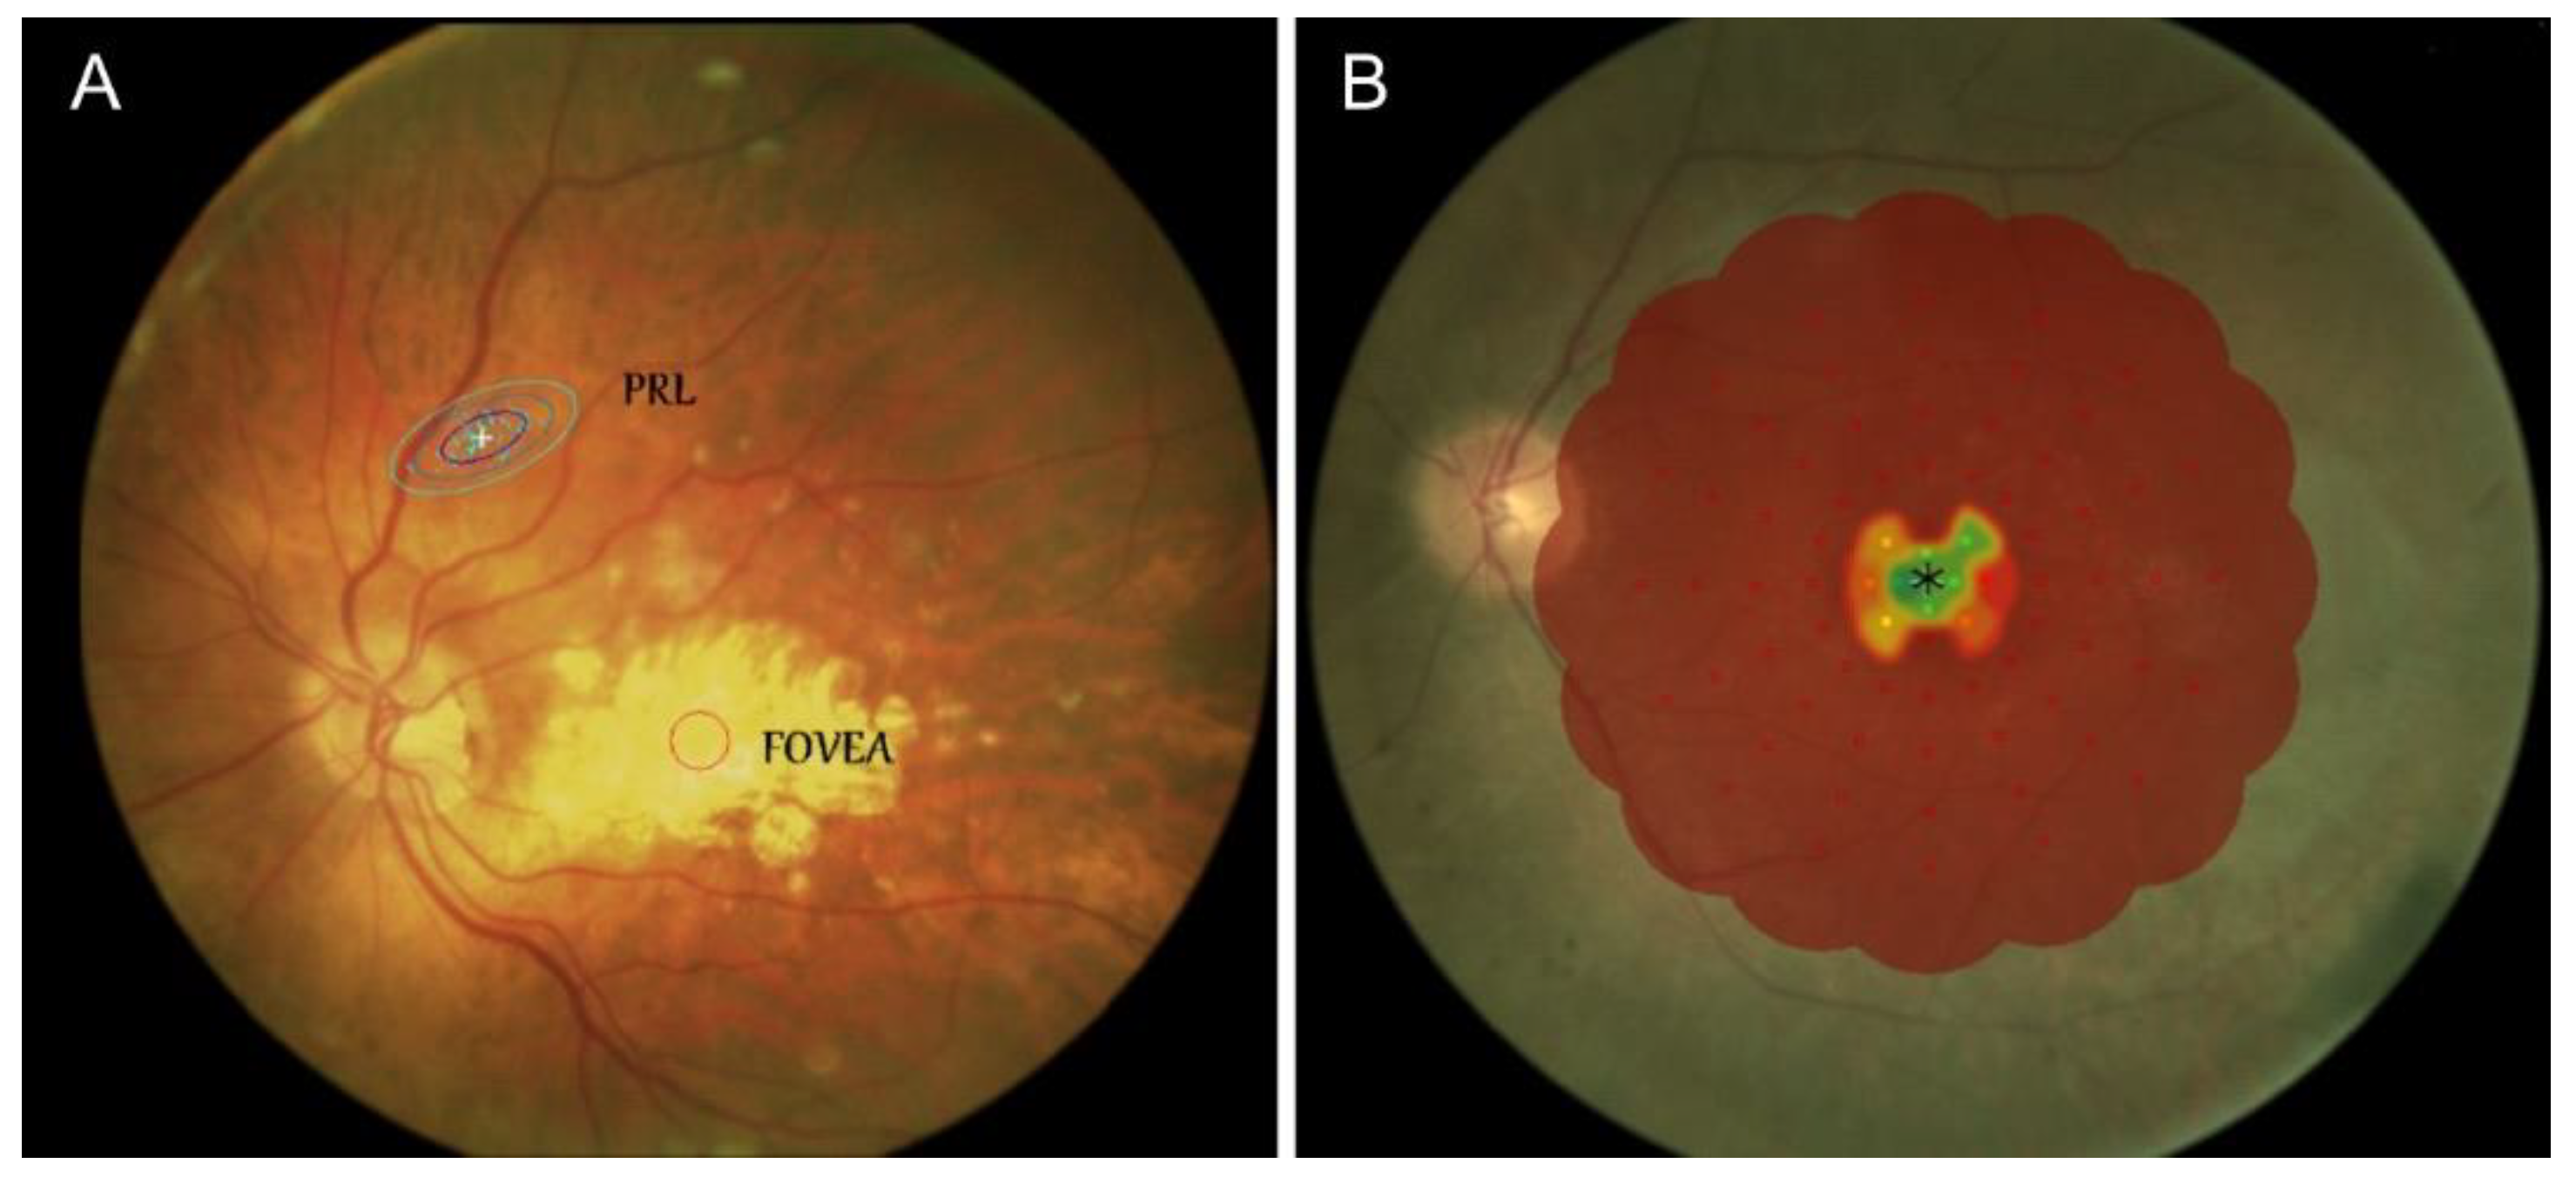
- Fixation stability was assessed using the Nidek Technologies MP-1 microperimeter. Patients focused on a central target for 30 s. The target shown was a white cross with an arm extension of 1°, but it was increased to ≥2° if patients were not able to see it. The fixation stability was classified according to Fujii et al.’s and Sawa et al.’s criteria.
- Retinal threshold sensitivity was assessed with the MP-1 microperimeter (Nidek Technologies, Albignasego, Italy) in manual mode use, using a specific 4–2 threshold strategy and the Goldmann III stimulus. The microperimetric examination was performed using the same number of stimulus spots for the scotoma area and residual area surrounding the PRL (Preferred Retinal Locus). Points were arranged similarly to an automatic pattern of perimetric examination. Overall, this strategy was associated with a lower procedure time and an optimal definition of the near-PRL vision area.
- Peripheral Binocular Visual Field (BVF): evaluated with a Humphrey Field Analyzer II (Carl Zeiss Meditec AG, Jena, Germany) automated static perimeter, based on three threshold stimuli programs that analyzed 100 points—36 points in the peripheral visual field, and 64 in the central part. This examination allowed for an optimal evaluation of the functional visual field. It took into account the most important functional perimetric areas (the paracentral and inferior visual field), and increased the number of points explored in those areas, whose integrity was fundamental to ensure autonomy in the environment.
2.2. Vestibular Evaluation
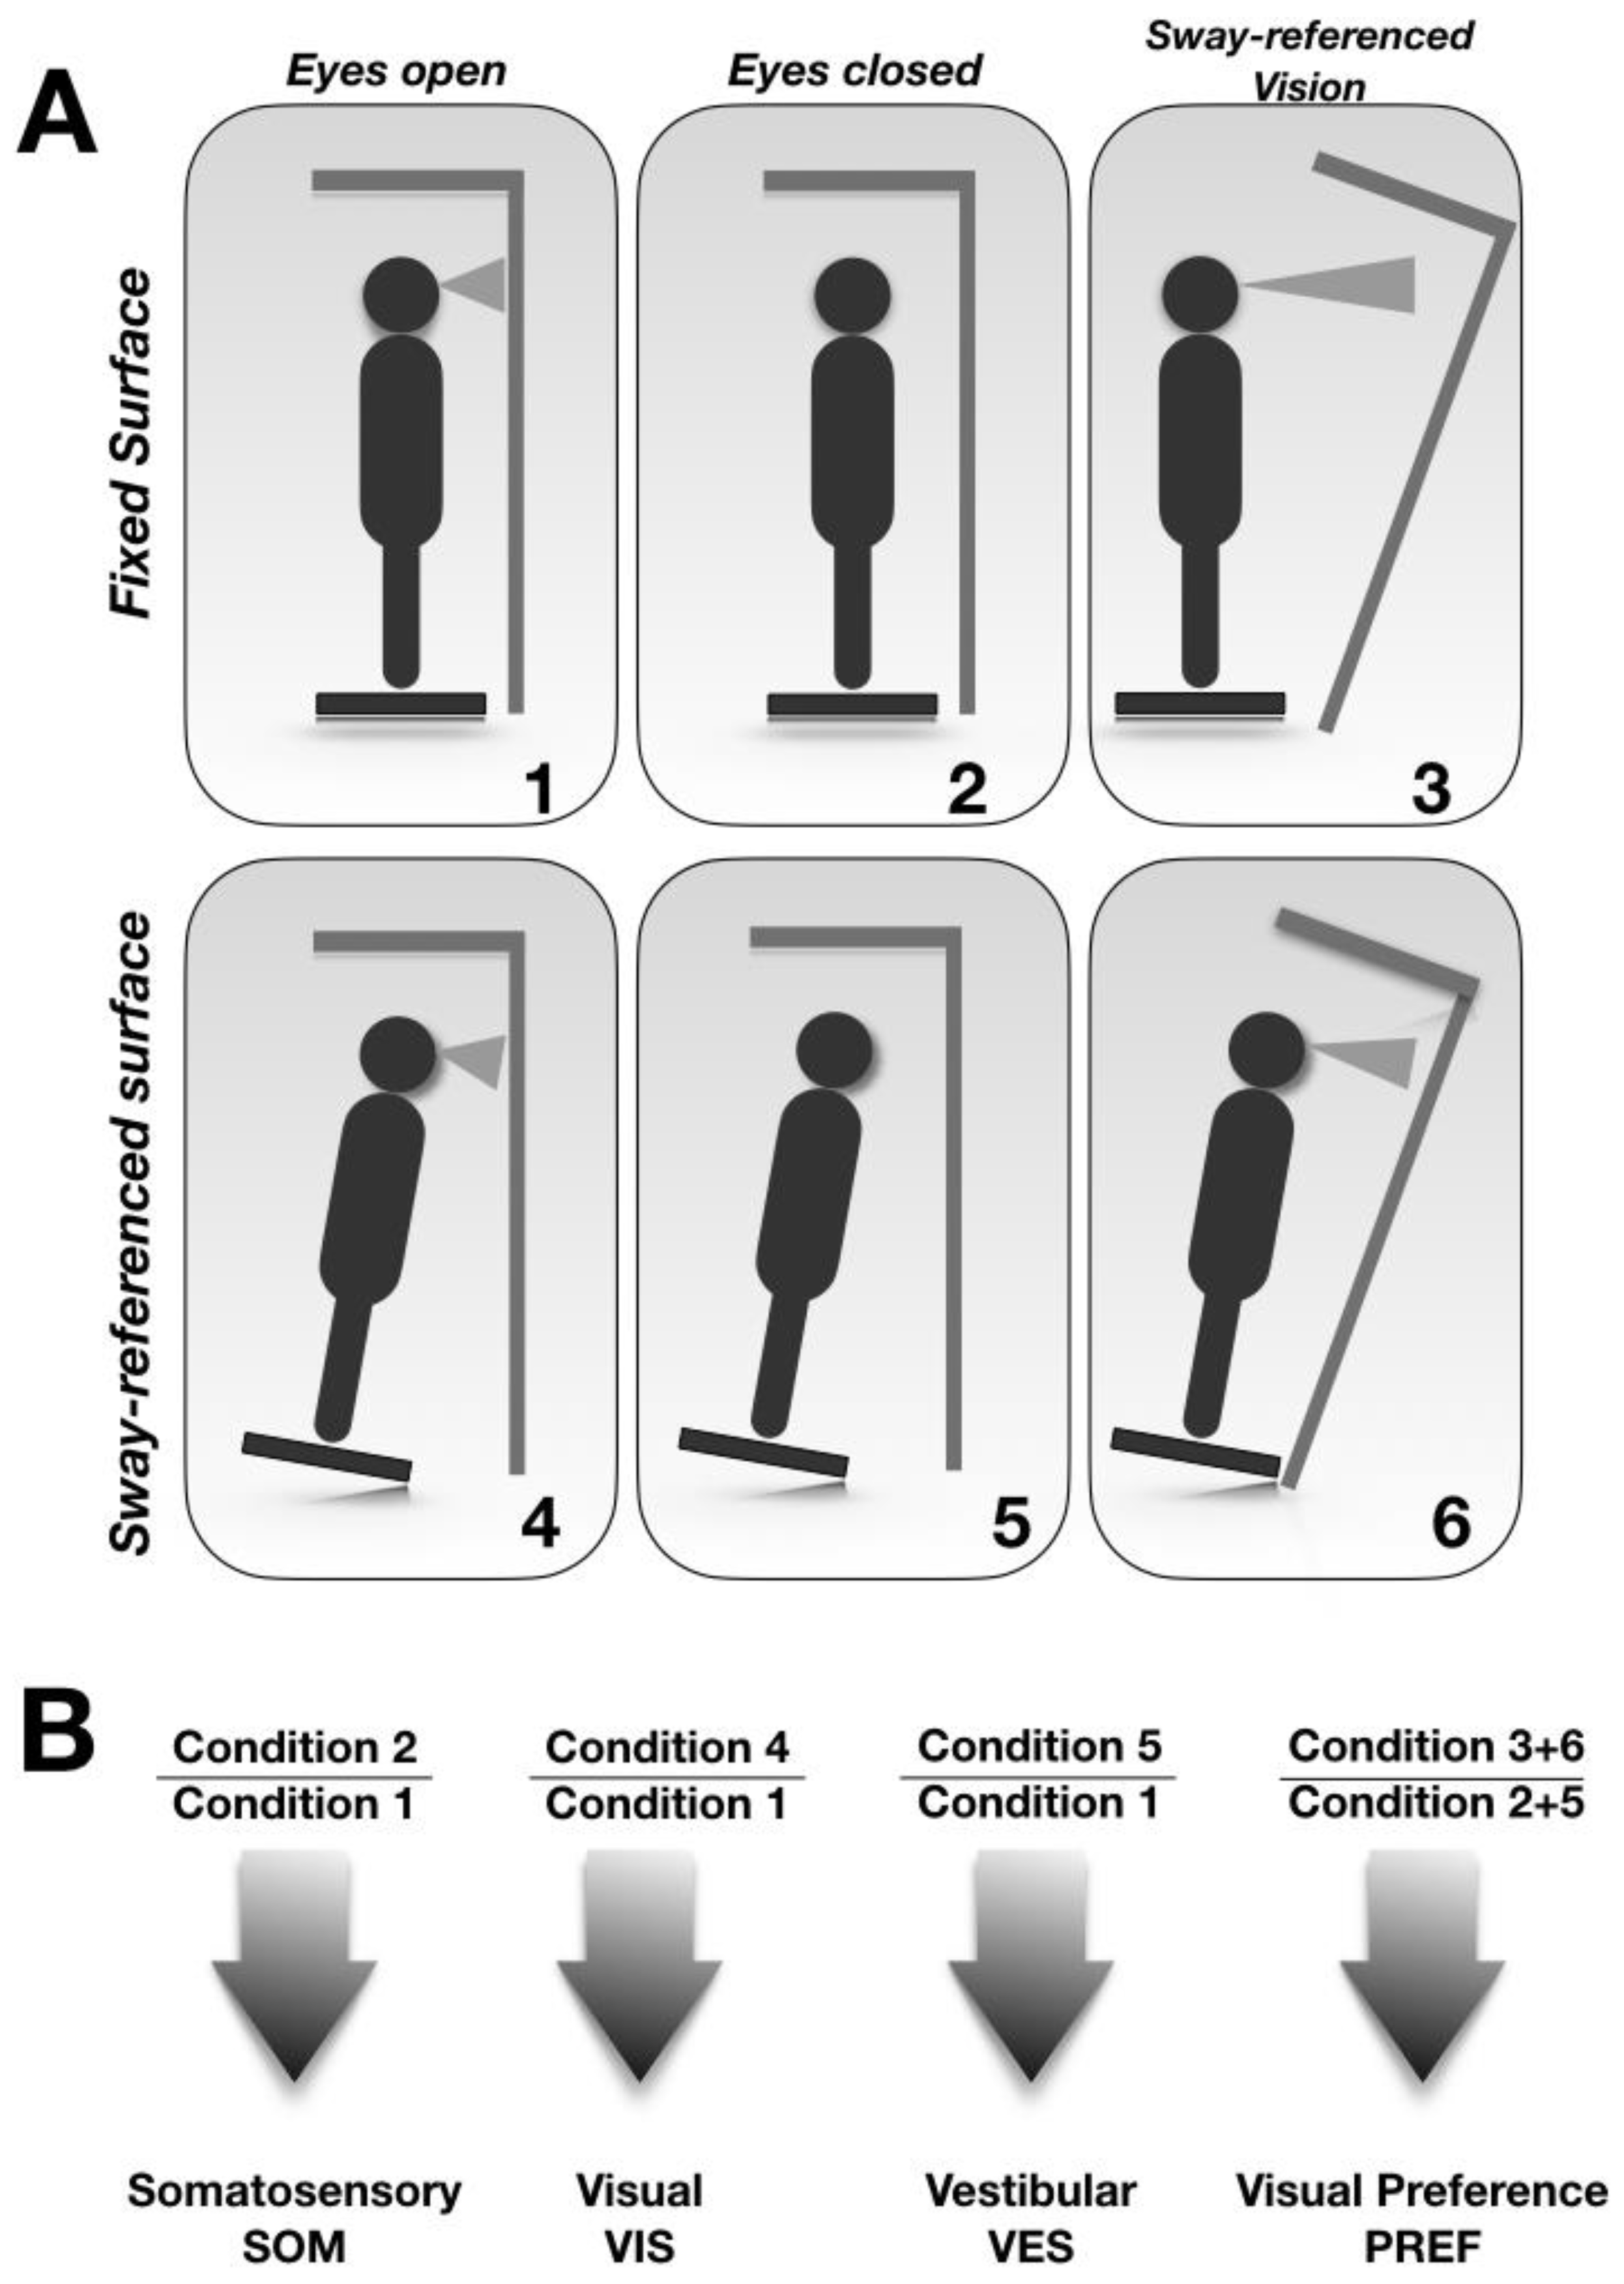
2.3. Postural Evaluation
- (1)
- Weight Symmetry (WS) (the relative distribution of weight on each leg);
- (2)
- Latency (the time between translation onset and the active response of the patient’s leg);
- (3)
- Composite Latency Score (CLS) (the average of the individual scores, considering both legs);
- (4)
- Strength Symmetry (the amplitude scale for the legs and three translations).
3. Results
3.1. Ophthalmologic Analyses
3.2. Vestibular Analyses
4. Discussion
5. Conclusions
Author Contributions
Funding
Institutional Review Board Statement
Informed Consent Statement
Data Availability Statement
Conflicts of Interest
References
- Ivanenko, Y.; Gurfinkel, V. Gurfinkel. Human Postural Control. Front. Neurosci. 2018, 12, 171. [Google Scholar] [CrossRef] [PubMed]
- Della-Justina, H.M.; Gamba, H.R.; Lukasova, K.; Nucci-da-Silva, M.P.; Winkler, A.M.; Amaro, E., Jr. Interaction of brain areas of visual and vestibular simultaneous activity with fMRI. Exp. Brain Res. 2015, 233, 237–252. [Google Scholar] [CrossRef]
- Markowitz, S.N. Principles of modern low vision rehabilitation. Can. J. Ophthalmol. 2006, 41, 289–312. [Google Scholar] [CrossRef] [PubMed]
- Tarita-Nistor, L.; Gonzalez, E.G.; Markowitz, S.N.; Steinbach, M.J. Fixation characteristics of patients with macular degeneration recorded with the mp-1 microperimeter. Retina 2008, 28, 125–133. [Google Scholar]
- Crossland, M.D.; Dunbar, H.M.; Rubin, G.S. Fixation stability measurement using the MP1 microperimeter. Retina 2009, 29, 651–656. [Google Scholar] [CrossRef] [Green Version]
- Glen, F.C.; Crabb, D.P. Living with glaucoma: A qualitative study of functional implications and patients’ coping behaviours. BMC Ophthalmol. 2015, 15, 128. [Google Scholar] [CrossRef] [PubMed] [Green Version]
- Narayan, D.S.; Wood, J.P.; Chidlow, G.; Casson, R.J. A Review of the Mechanisms of Cone Degeneration in Retinitis Pigmentosa. Acta Ophthalmol. 2016, 94, 748–754. [Google Scholar]
- Parreira, R.B.; Collange Grecco, L.A.; Santos Oliveira, C. Postural Control in Blind Individuals: A Systematic Review. Rev. Gait Posture 2017, 57, 161–167. [Google Scholar]
- Hallemans, A.; Ortibus, E.; Meire, F.; Aerts, P. Low Vision Affects Dynamic Stability of Gait. Gait Posture 2010, 32, 547–551. [Google Scholar] [CrossRef] [PubMed]
- Alghadir, A.H.; Alotaibi, A.Z.; Iqbal, Z.A. Postural stability in people with visual impairment. Brain Behav. 2019, 9, e01436. [Google Scholar] [CrossRef] [Green Version]
- Tomomitsu, M.S.; Alonso, A.C.; Morimoto, E.; Bobbio, T.G.; Greve, J.M. Static and dynamic postural control in low-vision and normal-vision adults. Clinics (Sao Paulo) 2013, 68, 517–521. [Google Scholar] [CrossRef]
- Giagazoglou, P.; Amiridis, I.G.; Zafeiridis, A.; Thimara, M.; Kouvelioti, V.; Kellis, E. Static balance control and lower limb strength in blind and sighted women. Eur. J. Appl. Physiol. 2009, 107, 571–579. [Google Scholar] [CrossRef]
- Schmid, M.; Nardone, A.; De Nunzio, A.M.; Schmid, M.; Schieppati, M. Equilibrium during static and dynamic tasks in blind subjects: No evidence of cross-modal plasticity. Brain 2007, 130 Pt 8, 2097–2107. [Google Scholar] [CrossRef]
- Berencsi, A.; Ishihara, M.; Imanaka, K. The functional role of central and peripheral vision in the control of posture. Hum. Mov. Sci. 2005, 24, 689–709. [Google Scholar] [CrossRef]
- Brandt, T.; Dichgans, J.; Koenig, E. Differential Effects of Central Verses Peripheral Vision on Egocentric and Exocentric Motion Perception. Exp. Brain Res. 1973, 16, 476–491. [Google Scholar] [CrossRef]
- Straube, A.; Krafczyk, S.; Paulus, W.; Brandt, T. Dependence of visual stabilization of postural sway on the cortical magnification factor of restricted visual fields. Exp. Brain Res. 1994, 99, 501–506. [Google Scholar] [CrossRef]
- Paulus, W.M.; Straube, A.; Brandt, T. Visual stabilization of posture. Physiological stimulus characteristics and clinical aspects. Brain 1984, 107 Pt 4, 1143–1163. [Google Scholar] [CrossRef]
- Friedrich, M.; Grein, H.J.; Wicher, C.; Schuetze, J.; Mueller, A.; Lauenroth, A.; Hottenrott, K.; Schwesig, S. Influence of pathologic and simulated visual dysfunctions on the postural system. Exp. Brain Res. 2008, 186, 305–314. [Google Scholar] [CrossRef]
- Brandt, T.; Bartenstein, P.; Janek, A.; Dieterich, M. Reciprocal inhibitory visual–vestibular interaction. Visual motion stimulation deactivates the parieto-insular vestibular cortex. Brain 1998, 121, 1749–1758. [Google Scholar] [CrossRef] [Green Version]
- Hazime, F.A.; Allard, P.; Ide, M.R.; Siqueira, C.M.; Amorim, C.F.; Tanaka, C. Postural control under visual and proprioceptive perturbations during double and single limb stance. J. Bodyw. Mov. Ther. 2012, 16, 224–229. [Google Scholar] [CrossRef]
- Horvat, M.; Ray, C.; Ramsey, V.; Miszko, T.; Keeney, R.; Blasch, B. Compensatory analysis and strategies for balance in individuals with visual impairments. J. Vis. Impair. Blind. 2003, 97, 695–703. [Google Scholar] [CrossRef]
- Hsu, W.L.; Scholz, J.P.; Schöner, G.; Jeka, J.J.; Kiemel, T. Control and estimation of posture during quiet stance depends on multijoint coordination. J. Neurophysiol. 2007, 97, 3024–3035. [Google Scholar] [PubMed]


| ID | Age | Gender | Eye Disease | BCVA (LogMAR) Best Eye | BCVA (LogMAR) Worst Eye | PRL Best Eye | PRL Worst Eye |
|---|---|---|---|---|---|---|---|
| P1 | 49 | M | Pathologic myopia | 1.3 | HM | 12° | |
| P2 | 48 | W | Stargardt disease | 0.9 | 1 | 6° | 8° |
| P3 | 82 | W | AMD | 1 | 1 | 16° | 18° |
| P4 | 43 | M | Stargardt disease | 1.3 | 1.3 | 6° | 8° |
| P5 | 71 | W | Pathologic myopia | 0.7 | HM | 6° | |
| P6 | 70 | M | Pathologic myopia | 0.9 | 1 | 6° | 6° |
| P7 | 68 | M | Pathologic myopia | 0.8 | CF | 8° | |
| P8 | 46 | W | Stargardt disease | 1 | 1 | 10° | 12° |
| P9 | 52 | W | Stargardt disease | 0.9 | 1 | 14° | 20° |
| P10 | 58 | M | Pathologic myopia | 0.8 | 1 | 2° | 2° |
| P11 | 38 | M | Pathologic myopia | 1 | PROSTHESIS | 7° | |
| P12 | 75 | M | Pathologic myopia | 0.6 | 0.9 | 4° | 6° |
| P13 | 70 | M | Diabetic retinopathy | 0.8 | NPL | 2° | |
| P14 | 54 | W | Pathologic myopia | 1 | NPL | 4° |
| ID | Age | Gender | Eye Disease | BCVA (LogMAR) Best Eye | BCVA (LogMAR) Worst Eye | BVF % |
|---|---|---|---|---|---|---|
| P1 | 70 | W | Glaucoma | 0.4 | NPL | 3.5 |
| P2 | 75 | M | Glaucoma | 0.3 | NPL | 5.5 |
| P3 | 52 | M | Glaucoma | 1.3 | 1.3 | 11.5 |
| P4 | 38 | W | Retinitis pigmentosa | 0 | 0 | 23.5 |
| P5 | 66 | M | Diabetic retinopathy | 0.7 | 0.7 | 22 |
| P6 | 56 | M | Glaucoma | 0.5 | HM | 8.5 |
| P7 | 69 | M | Optic Atrophy | 0.5 | NPL | 6 |
| P8 | 59 | W | Glaucoma | 0.6 | NPL | 17.5 |
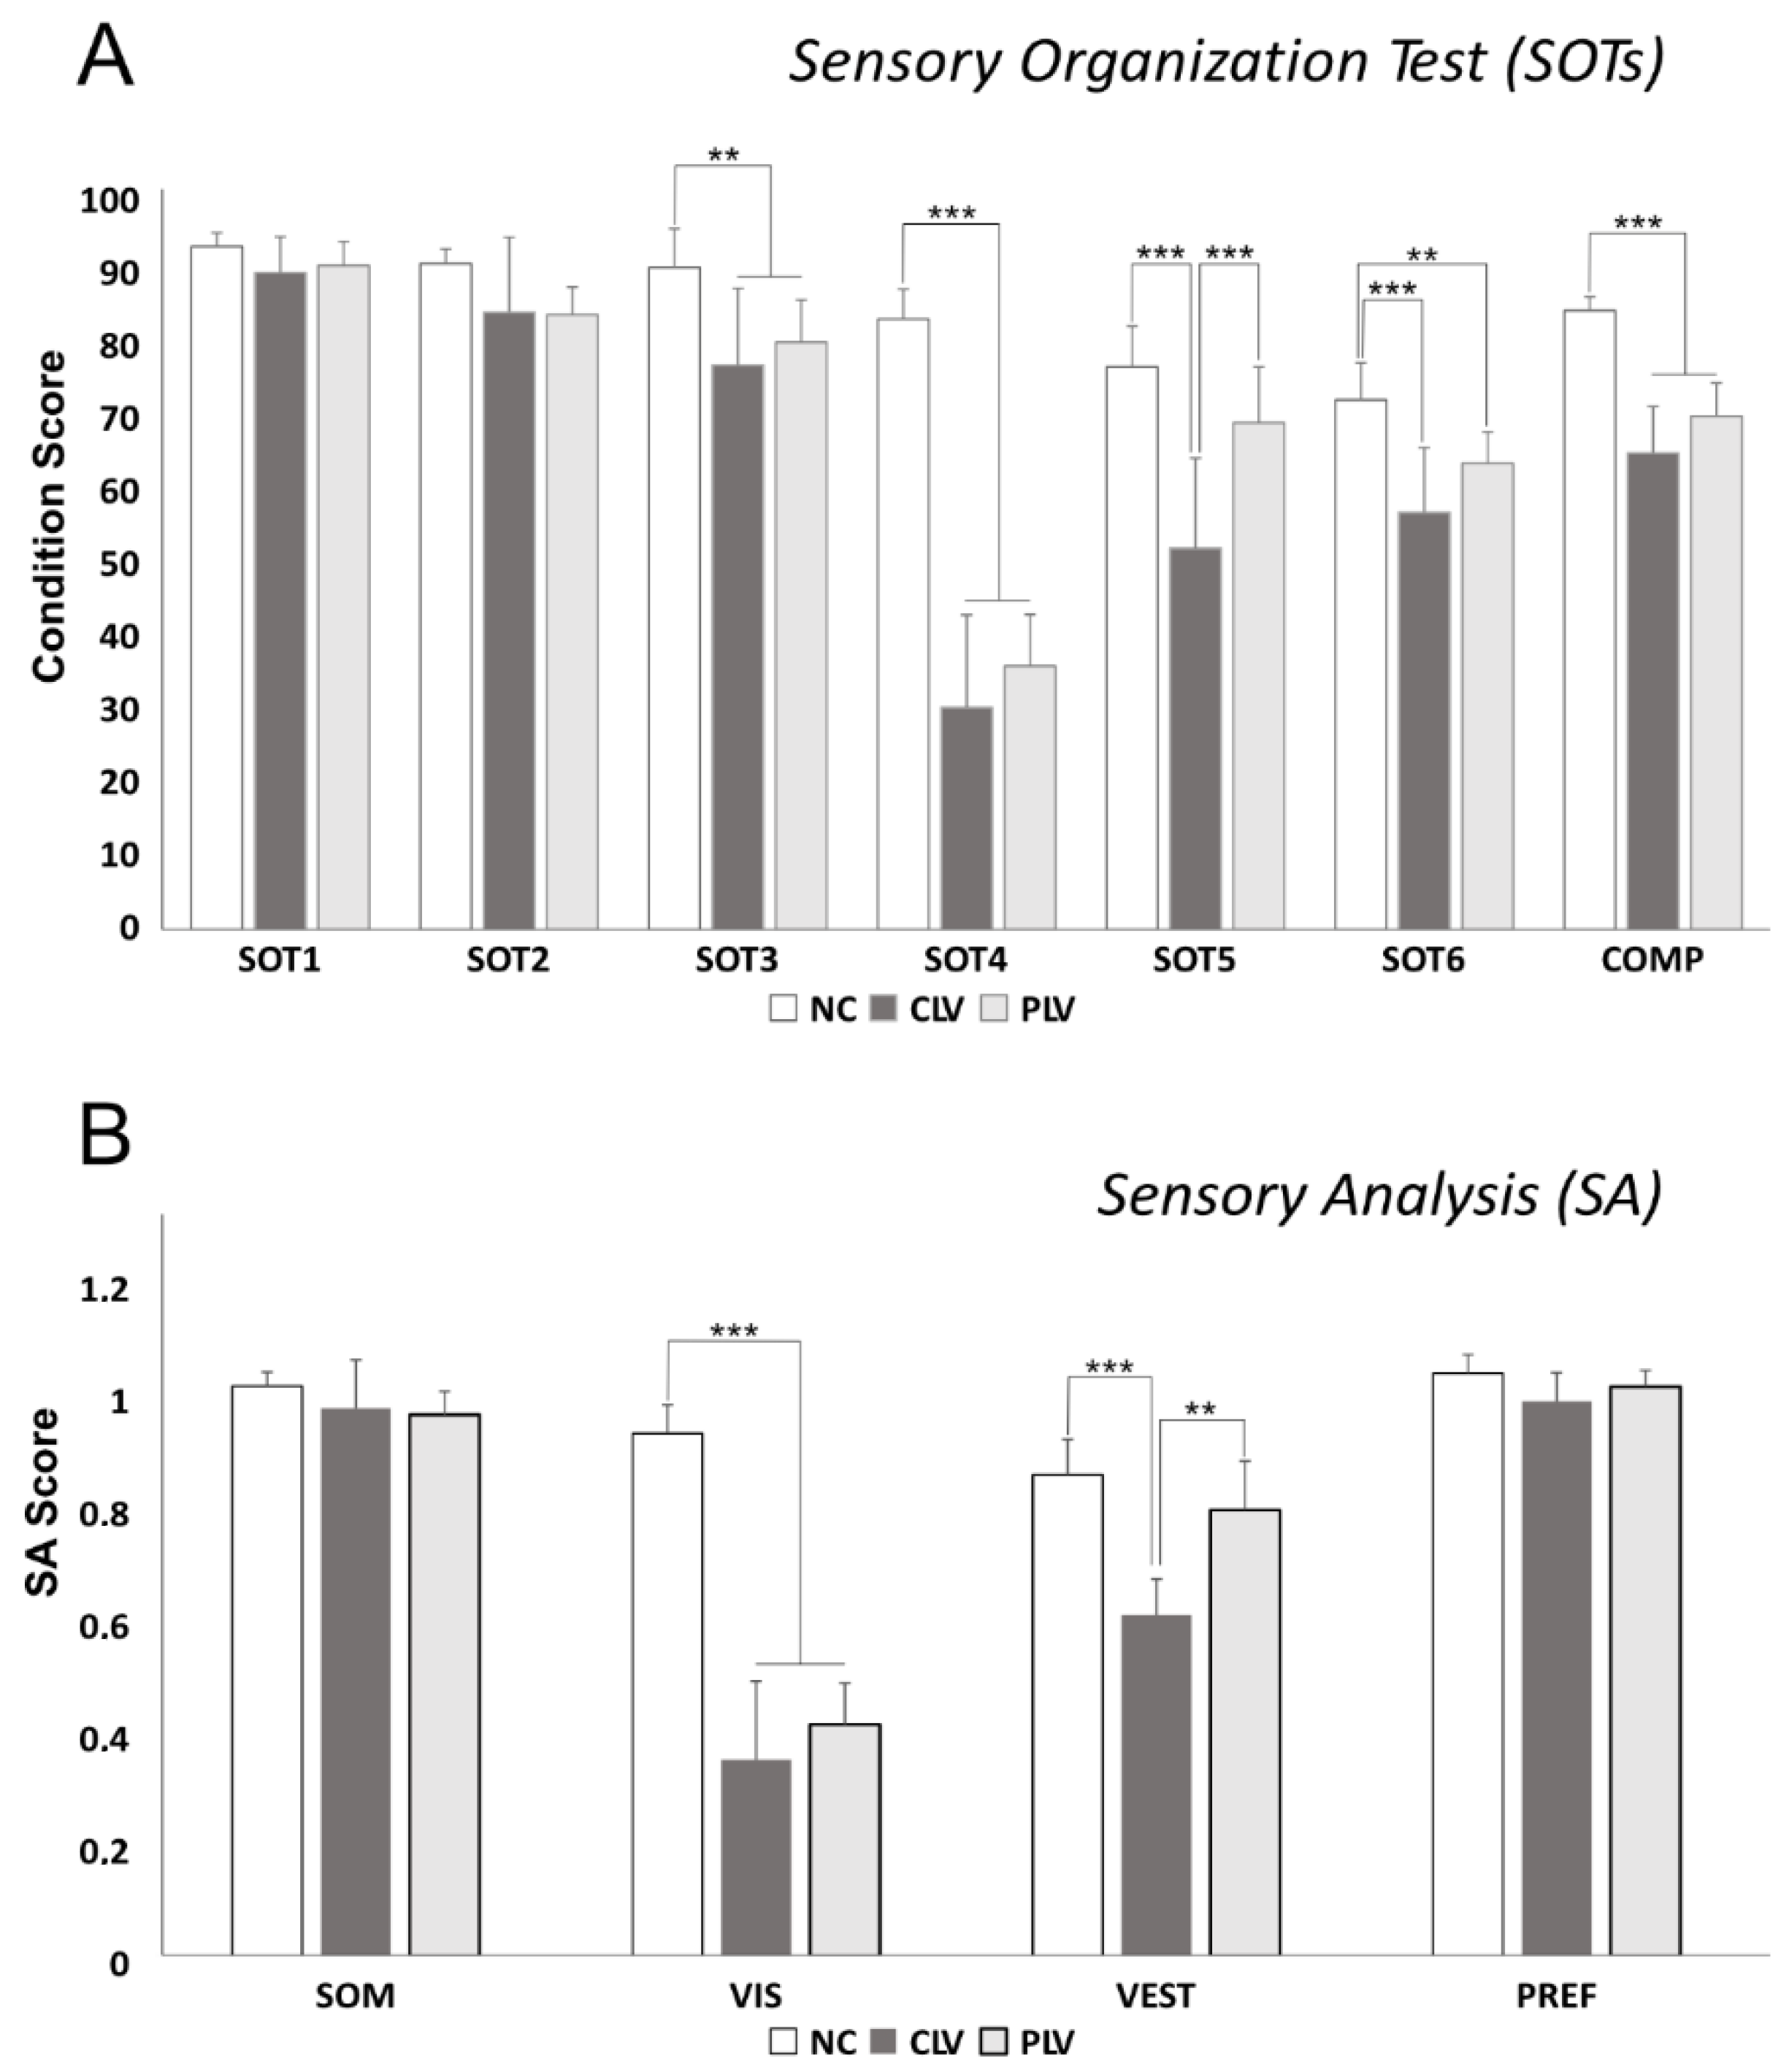
| SOT | CLV | PLV | NC | NC/CLV | NC/PLV | CLV/PLV |
| 1 | 87.835 ± 4.766 | 88.75 ± 3.228 | 91.3 ± 1.828 | No | No | No |
| 2 | 82.514 ± 10.039 | 82.175 ± 3.703 | 89 ± 1.943 | No | No | No |
| 3 | 75.442 ± 10.259 | 78.5 ± 5.65 | 88.5 ± 5.169 | Yes | Yes | No |
| 4 | 29.714 ± 12.338 | 35.237 ± 6.875 | 81.6 ± 3.977 | Yes | Yes | No |
| 5 | 50.971 ± 12.051 | 67.737 ± 7.466 | 75.2 ± 5.452 | Yes | No | Yes |
| 6 | 55.764 ± 8.645 | 62.325 ± 4.194 | 70.8 ± 4.96 | Yes | Yes | No |
| CES | 63.706 ± 6.227 | 68.641 ± 4.414 | 82.73 ± 1.846 | Yes | Yes | No |
| SA | CLV | PLV | NC | NC/CLV | NC/PLV | CLV/PLV |
| SOM | 0.937 ± 0.083 | 0.926 ± 0.040 | 0.975 ± 0.024 | No | No | No |
| VIS | 0.336 ± 0.134 | 0.396 ± 0.071 | 0.894 ± 0.049 | Yes | Yes | No |
| VEST | 0.584 ± 0.061 | 0.763 ± 0.084 | 0.823 ± 0.061 | Yes | No | Yes |
| PREF | 0.949 ± 0.049 | 0.974 ± 0.028 | 0.997 ± 0.032 | Yes | No | No |
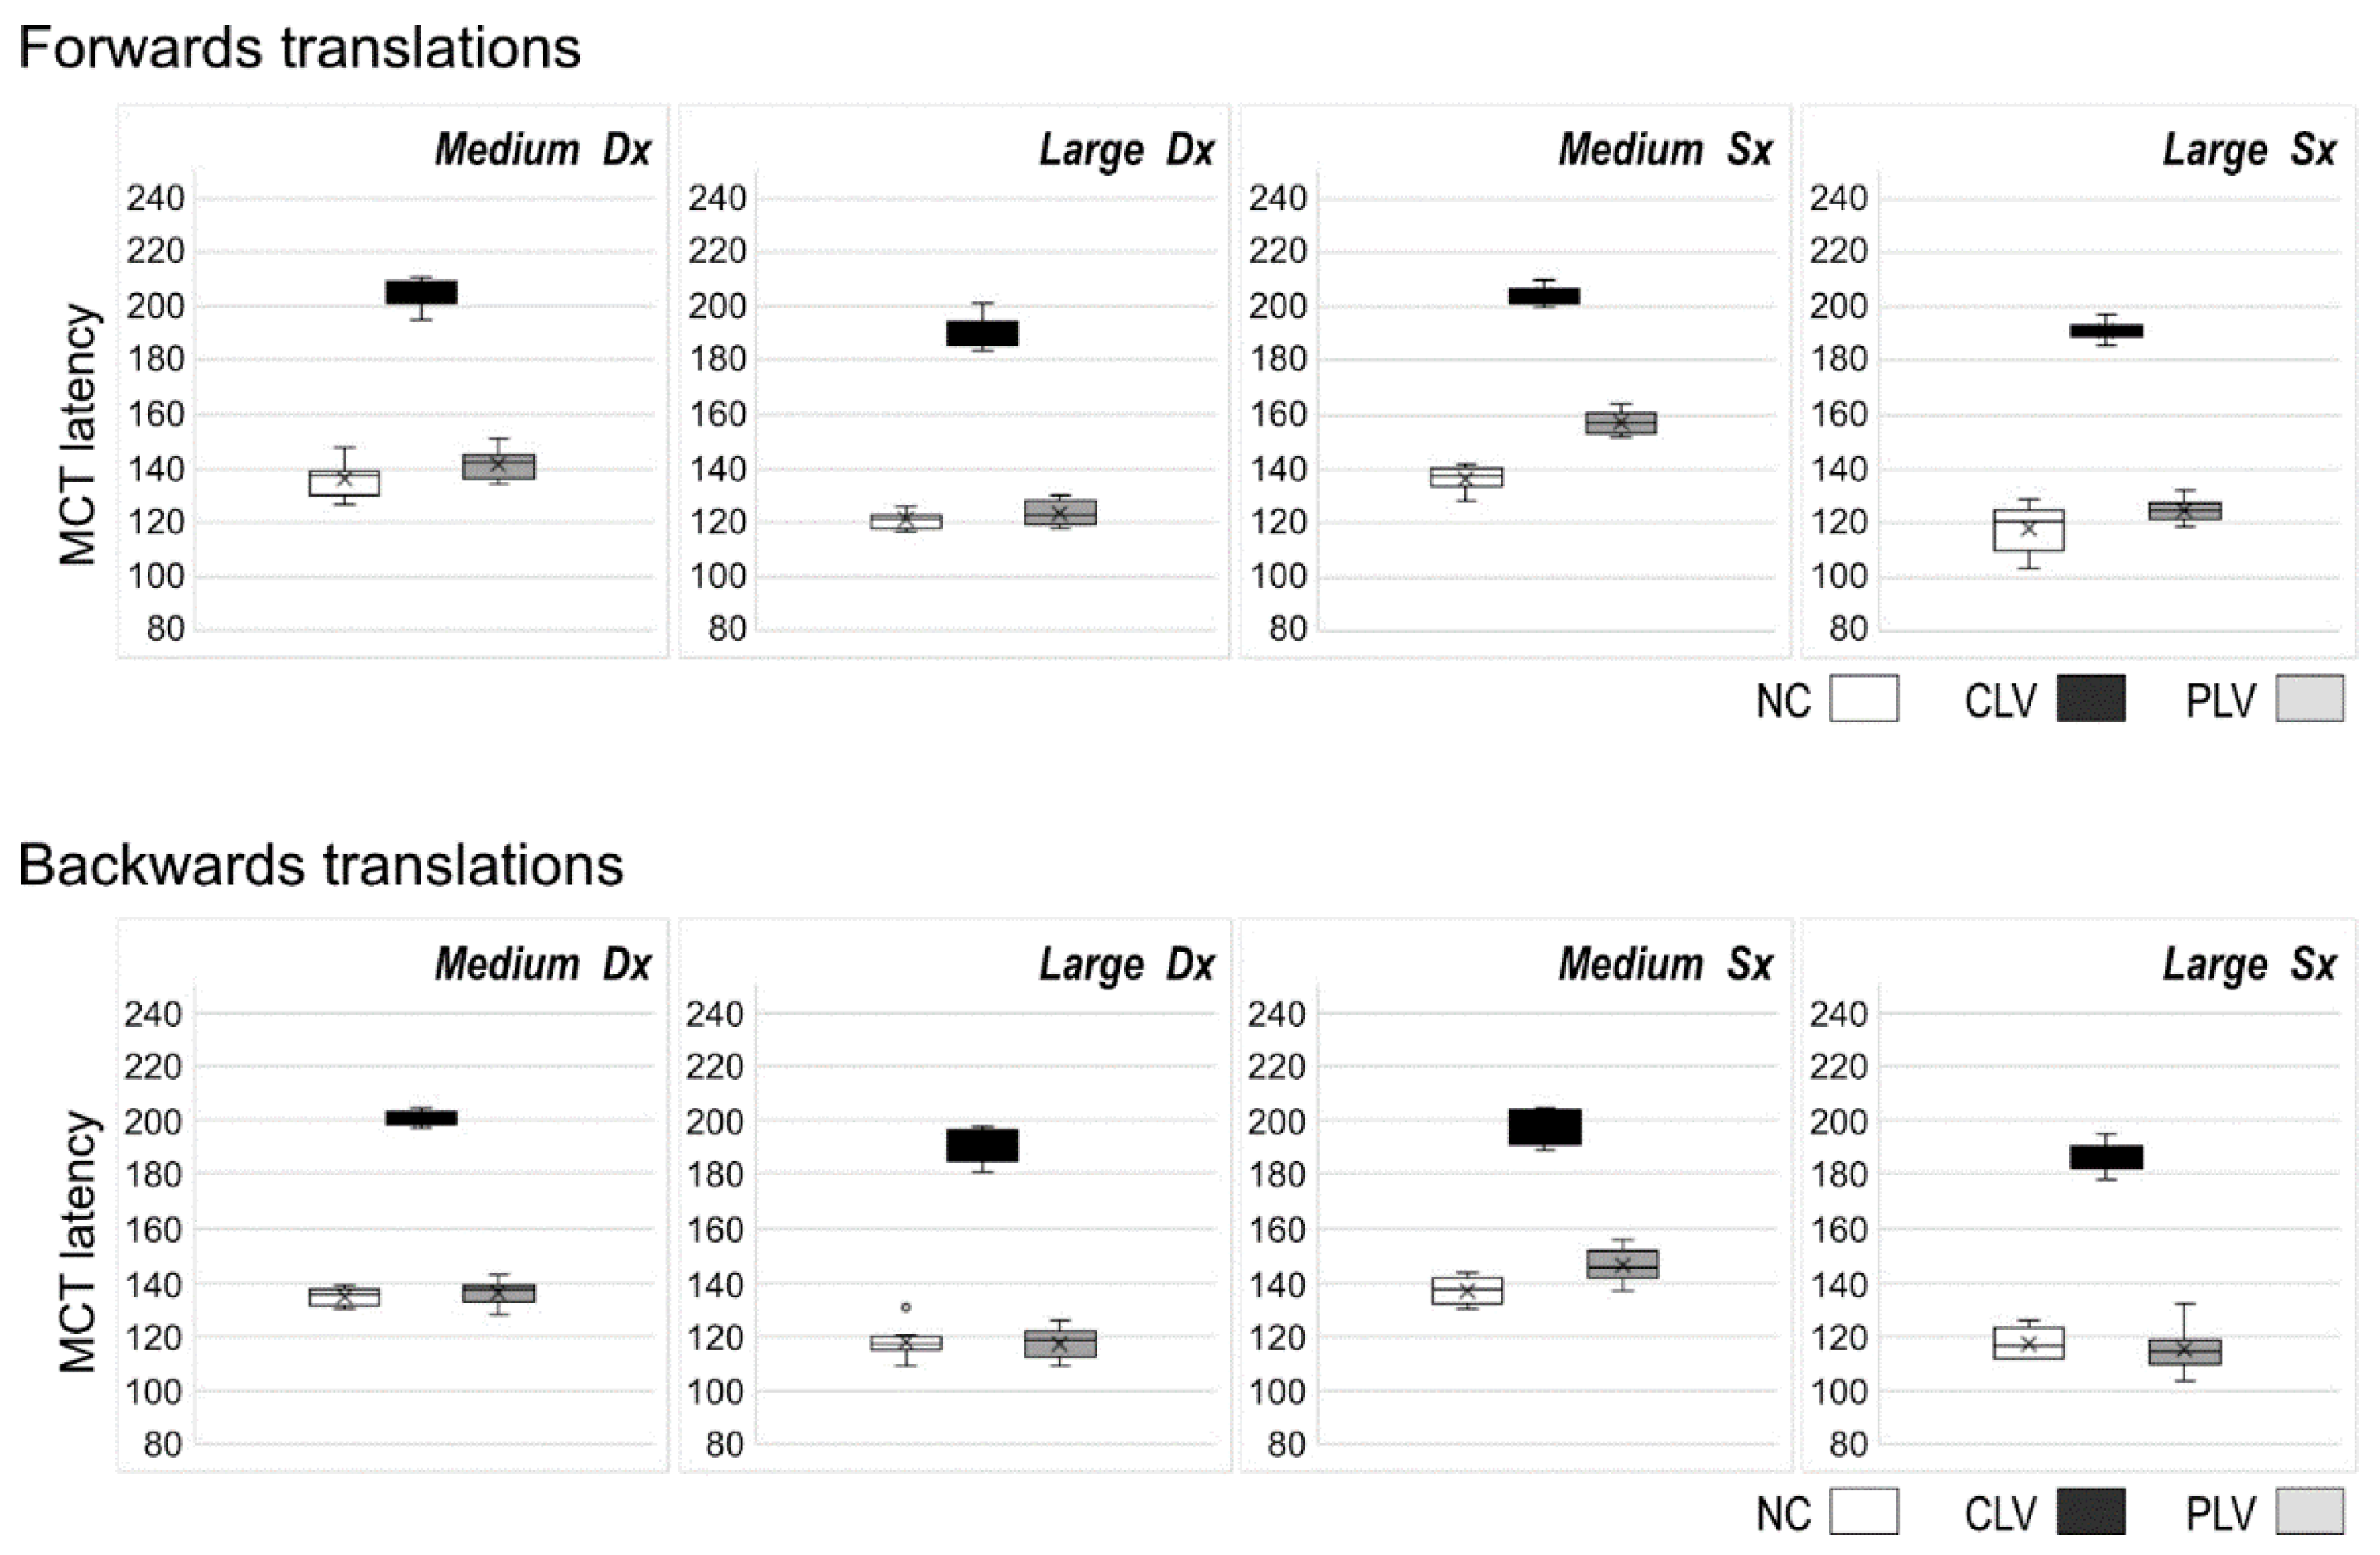
| MCT F | CLV | PLV | NC | NC/CLV | NC/PLV | CLV/PLV |
| M Dx | 203.3 ± 6 | 141.7 ± 5.6 | 136.8 ± 5.9 | Yes | No | Yes |
| L Dx | 189.5 ± 7.3 | 123.6 ± 4.5 | 121.9 ± 3.1 | Yes | No | Yes |
| M Sx | 202.4 ± 5 | 157.4 ± 4.1 | 137.3 ± 4.2 | Yes | Yes | Yes |
| L Sx | 190.9 ± 5.7 | 125.1 ± 4 | 118.2 ± 8 | Yes | No | Yes |
| MCT B | CLV | PLV | NC | NC/CLV | NC/PLV | CLV/PLV |
| M Dx | 199.4 ± 5.6 | 136.4 ± 4.6 | 135.5 ± 3.2 | Yes | No | Yes |
| L Dx | 187.9 ± 6.5 | 117.6 ± 5.6 | 118.2 ± 4.4 | Yes | No | Yes |
| M Sx | 195.7 ± 8.5 | 146.5 ± 6.3 | 137.7 ± 4.7 | Yes | Yes | Yes |
| L Sx | 187.1 ± 6.3 | 115.5 ± 8.3 | 118.1 ± 5.2 | Yes | No | Yes |
Publisher’s Note: MDPI stays neutral with regard to jurisdictional claims in published maps and institutional affiliations. |
© 2022 by the authors. Licensee MDPI, Basel, Switzerland. This article is an open access article distributed under the terms and conditions of the Creative Commons Attribution (CC BY) license (https://creativecommons.org/licenses/by/4.0/).
Share and Cite
Cadoni, G.; Picciotti, P.M.; Rolesi, R.; Sulfaro, M.; Guidobaldi, M.; Amore, F.; Conti, G.; Paludetti, G.; Turco, S. Posturographic Analysis in Patients Affected by Central and Peripheral Visual Impairment. J. Pers. Med. 2022, 12, 1709. https://doi.org/10.3390/jpm12101709
Cadoni G, Picciotti PM, Rolesi R, Sulfaro M, Guidobaldi M, Amore F, Conti G, Paludetti G, Turco S. Posturographic Analysis in Patients Affected by Central and Peripheral Visual Impairment. Journal of Personalized Medicine. 2022; 12(10):1709. https://doi.org/10.3390/jpm12101709
Chicago/Turabian StyleCadoni, Gabriella, Pasqualina Maria Picciotti, Rolando Rolesi, Marco Sulfaro, Margherita Guidobaldi, Filippo Amore, Guido Conti, Gaetano Paludetti, and Simona Turco. 2022. "Posturographic Analysis in Patients Affected by Central and Peripheral Visual Impairment" Journal of Personalized Medicine 12, no. 10: 1709. https://doi.org/10.3390/jpm12101709