1. Introduction
The deep convolutional neural network (DCNN) has shown a significant breakthrough in many aspects of commercial image differentiation and identification. In recent years, DCNNs have also played important roles in medical image analysis [
1,
2]. For example, the ChestX-ray8 [
3] and MURA [
4] are two representative studies utilizing the state-of-the-art DCNN classification and visualization models to detect and locate disease patterns in the chest and musculoskeletal radiographs.
Some studies employ a more delicate “two-step” classification strategy, which first detects specific ROIs [
5,
6,
7,
8,
9], followed by conventional classification methods [
10,
11,
12]. A seminal work is the automatic knee osteoarthritis diagnosis in lateral knee radiographs, where knee regions are first identified [
13], followed by classification and heatmap visualization [
14]. The advantage of this “two-step” approach is the capability to identify subtle localized abnormalities and has gradually become the mainstream technology, especially for the analysis of PXRs, including fracture subclass identification [
15], hip osteoarthritis grading [
16], and avascular necrosis detection [
17]. Nonetheless, the above studies barely mentioned the model parameter settings and selection criteria, and none of them reported the confidence score for the detected ROIs, which the confidence score is a crucial metric indicating the likelihood that the predicated ROI contains the correct object.
A critical component for a successful “two-step” classification system is accurate ROI detection, which falls into computer vision object detection tasks [
18], usually tackled by different strategies [
19]. Among these methods, the bounding-box-based methodology is advantageous for its lower annotation workload and simple implementation, which is proven to be effective in popular computer vision applications in other sectors. In order to identify multiple objects across different scales in one image, one must generate anchor boxes of varied sizes and aspect ratios for hyper-parameter optimization. However, there is usually a small number of non-overlapping objects in medical images. It is not optimal to apply the same object detection parameters on different underlying applications.
In this work, we propose a labor-less practical framework of ROI detection and parameter selection in medical images. To the best of our knowledge, this is the first work that provides a systematic guideline for parameter selection based on the obtained datasets and has a promising potential for a wide range of medical image applications for further personalized medicine.
2. Materials and Methods
2.1. Dataset Acquisition
This retrospective study analyzed hip joints seen on 7399 PXRs from three diverse sources, including the Chang Gung Memorial Hospital Osteoarthritis (CGOA) dataset containing 4290 high-resolution radiographs, the second Osteoarthritis Initiative Hip (OAIH, pelvic radiograph dataset extracted from a subset of data from the OAI [
20]) dataset containing 3008 radiographs with relatively lower resolutions, and the third Google Image Search (GIS) dataset containing 101 heterogeneous radiographs.
Table 1 lists the summary statistics of these datasets. This experimental design, which utilizes radiographs generated from diverse sources of different imaging protocols, resolutions, and ethnicities, ensures that model generalization can be achieved. Details of these three datasets can be found in
Table 1.
2.2. Data Annotation
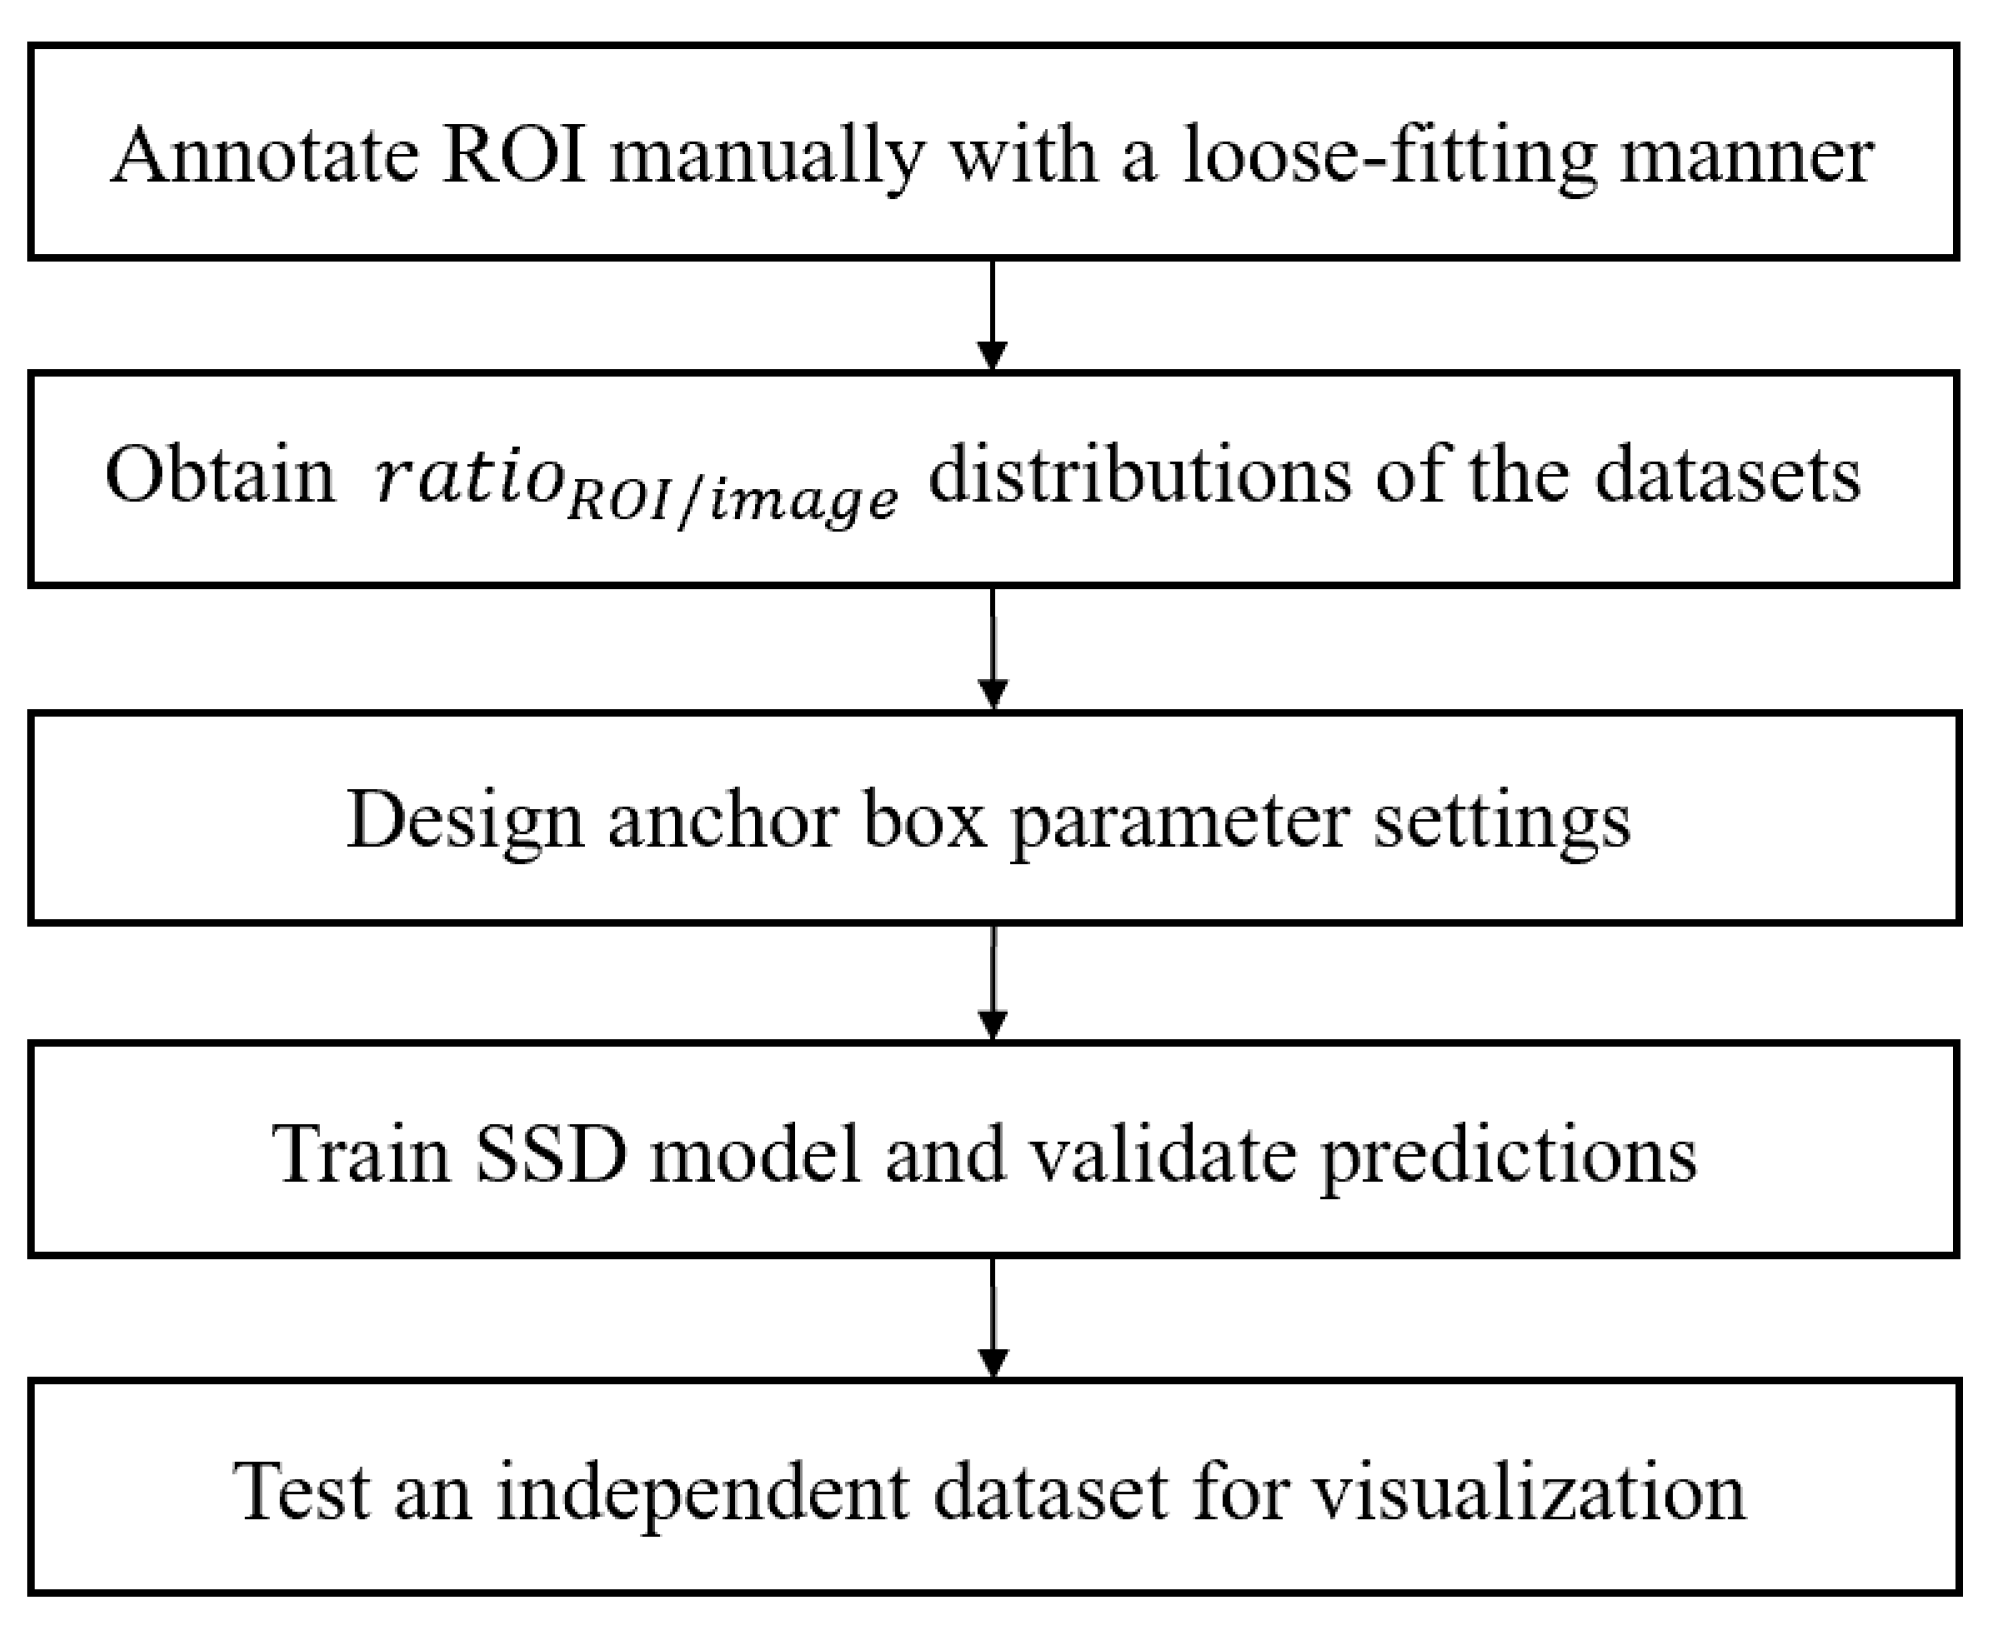
Figure 1 shows the overview of the proposed framework.
Clinical readings on etiology and grading of all CGOA images were performed by one physician with 15 years of clinical experience. To annotate hip regions of interest, we employed three annotators trained to place square bounding boxes approximately centered at the femoral head or the artificial hip joint with customized GUI software. It is noted that identifying a complete round femoral head in healthy hips is relatively straightforward; however, for cases with disrupted hip conditions with collapsed femoral heads, we employed a loose-fitting manner to make sure every hip joint lay appropriately in the bounding box. All the labeled ROIs in the CGOA dataset were visually reviewed by physicians, and the ROI annotators used the same rules to annotate the remaining OAIH and GIS datasets.
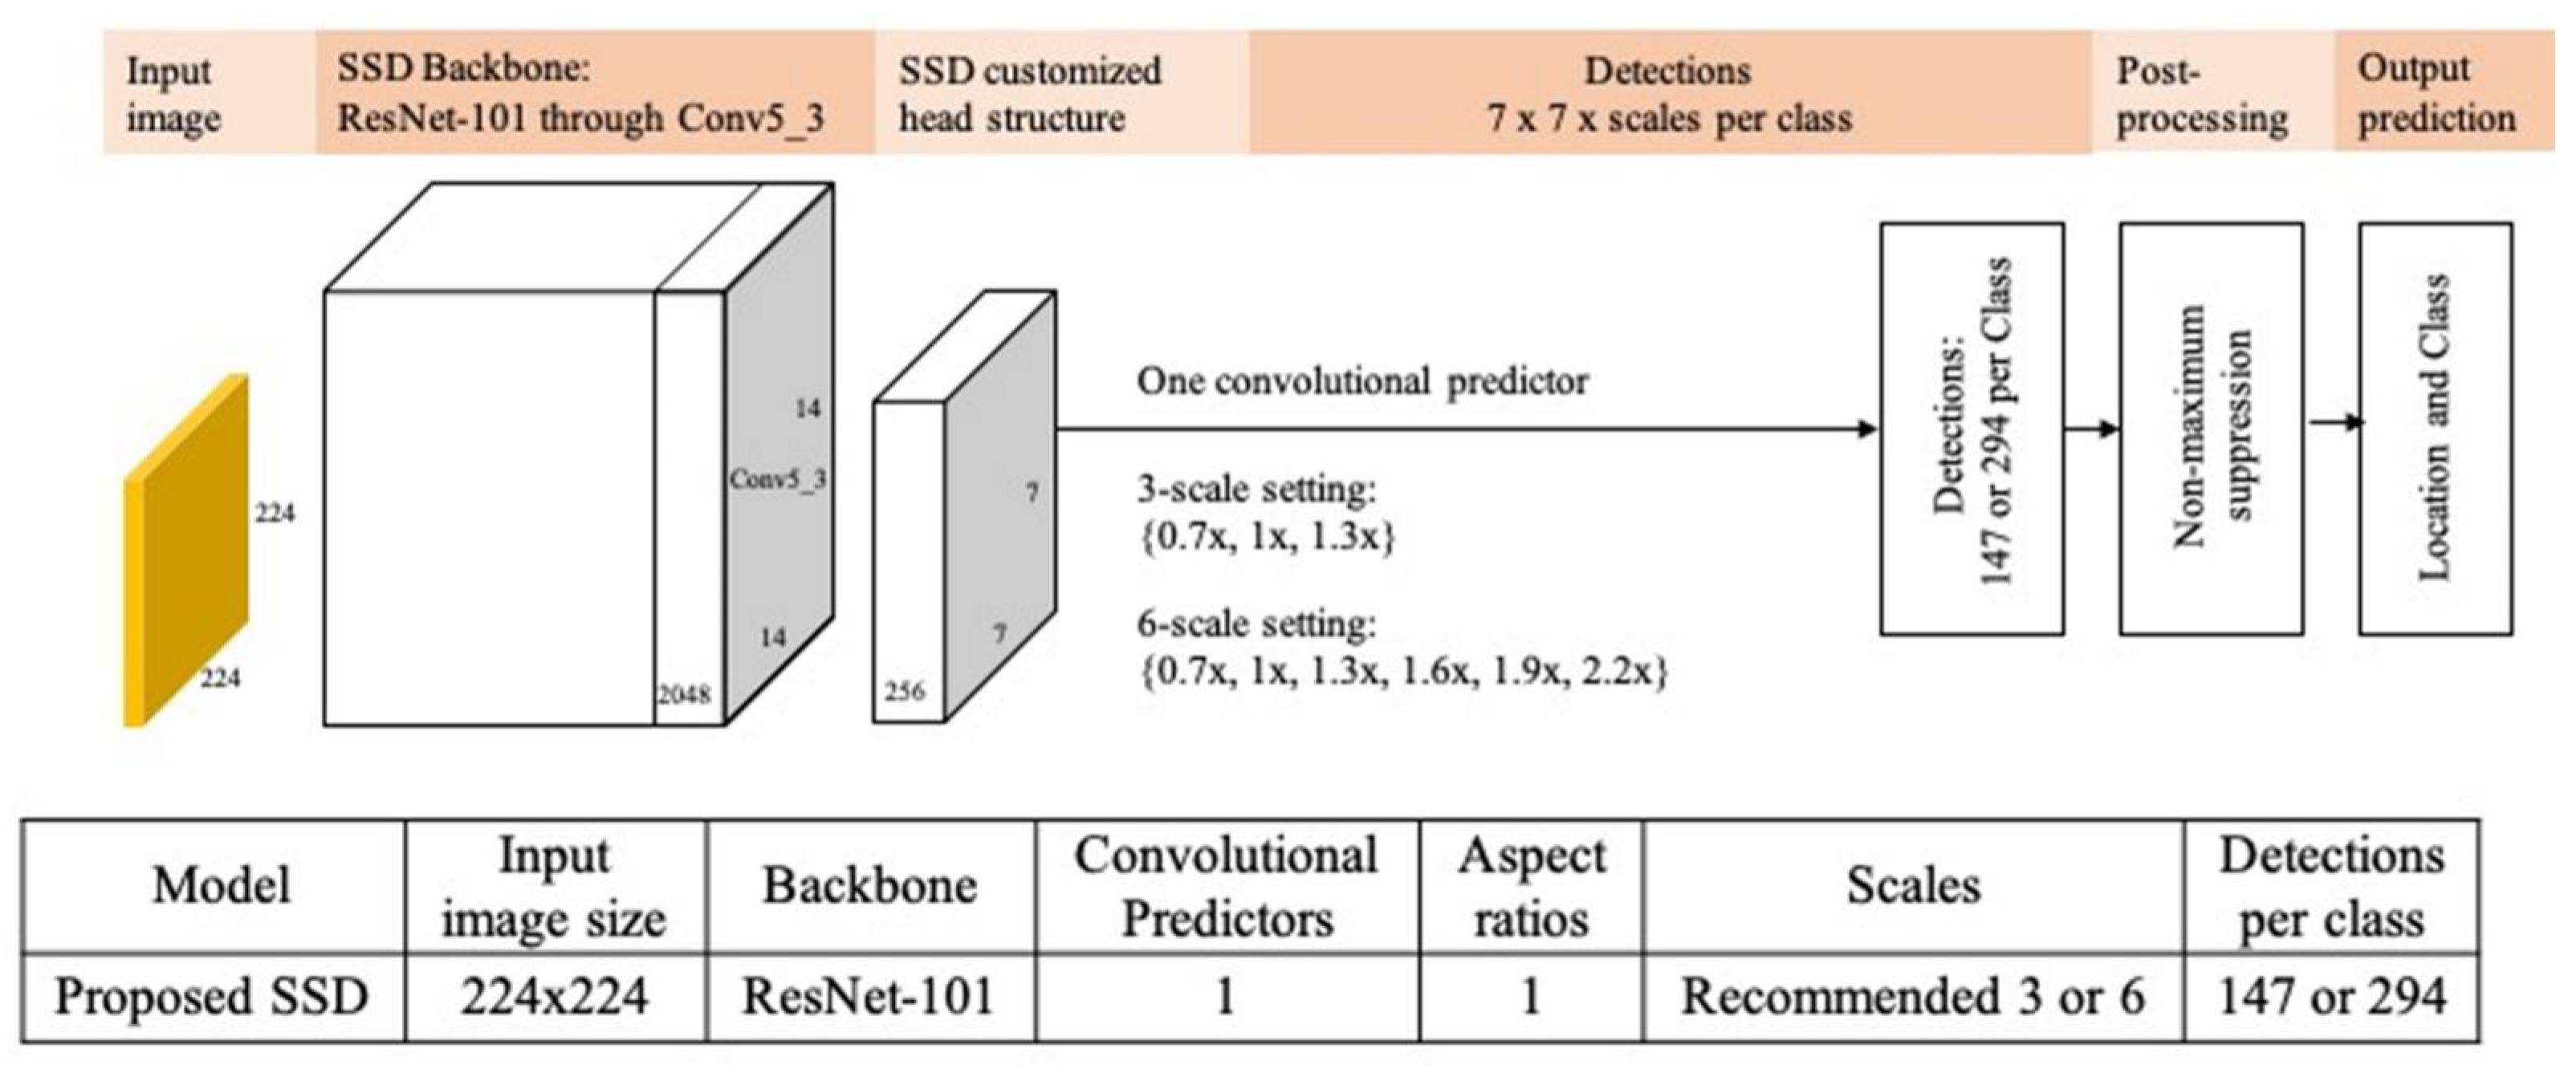
2.3. Proposed SSD Model Architecture for ROI Detection in Hip Radiographs
The proposed hip region detection architecture simplifies existing SSD model architecture (as
Figure 2) [
9], which was originally developed for detecting multiple objects with different sizes and aspect ratios in applications.
For ROI detection in medical images, we replaced the SSD VGG-16 backbone by ResNet-101 [
11] backbone, which was pre-trained on ImageNet [
21]. All these modifications could reduce ROI detections from several thousands to a few hundreds, decreasing training time and complexity as well as increasing detection accuracy and confidence.
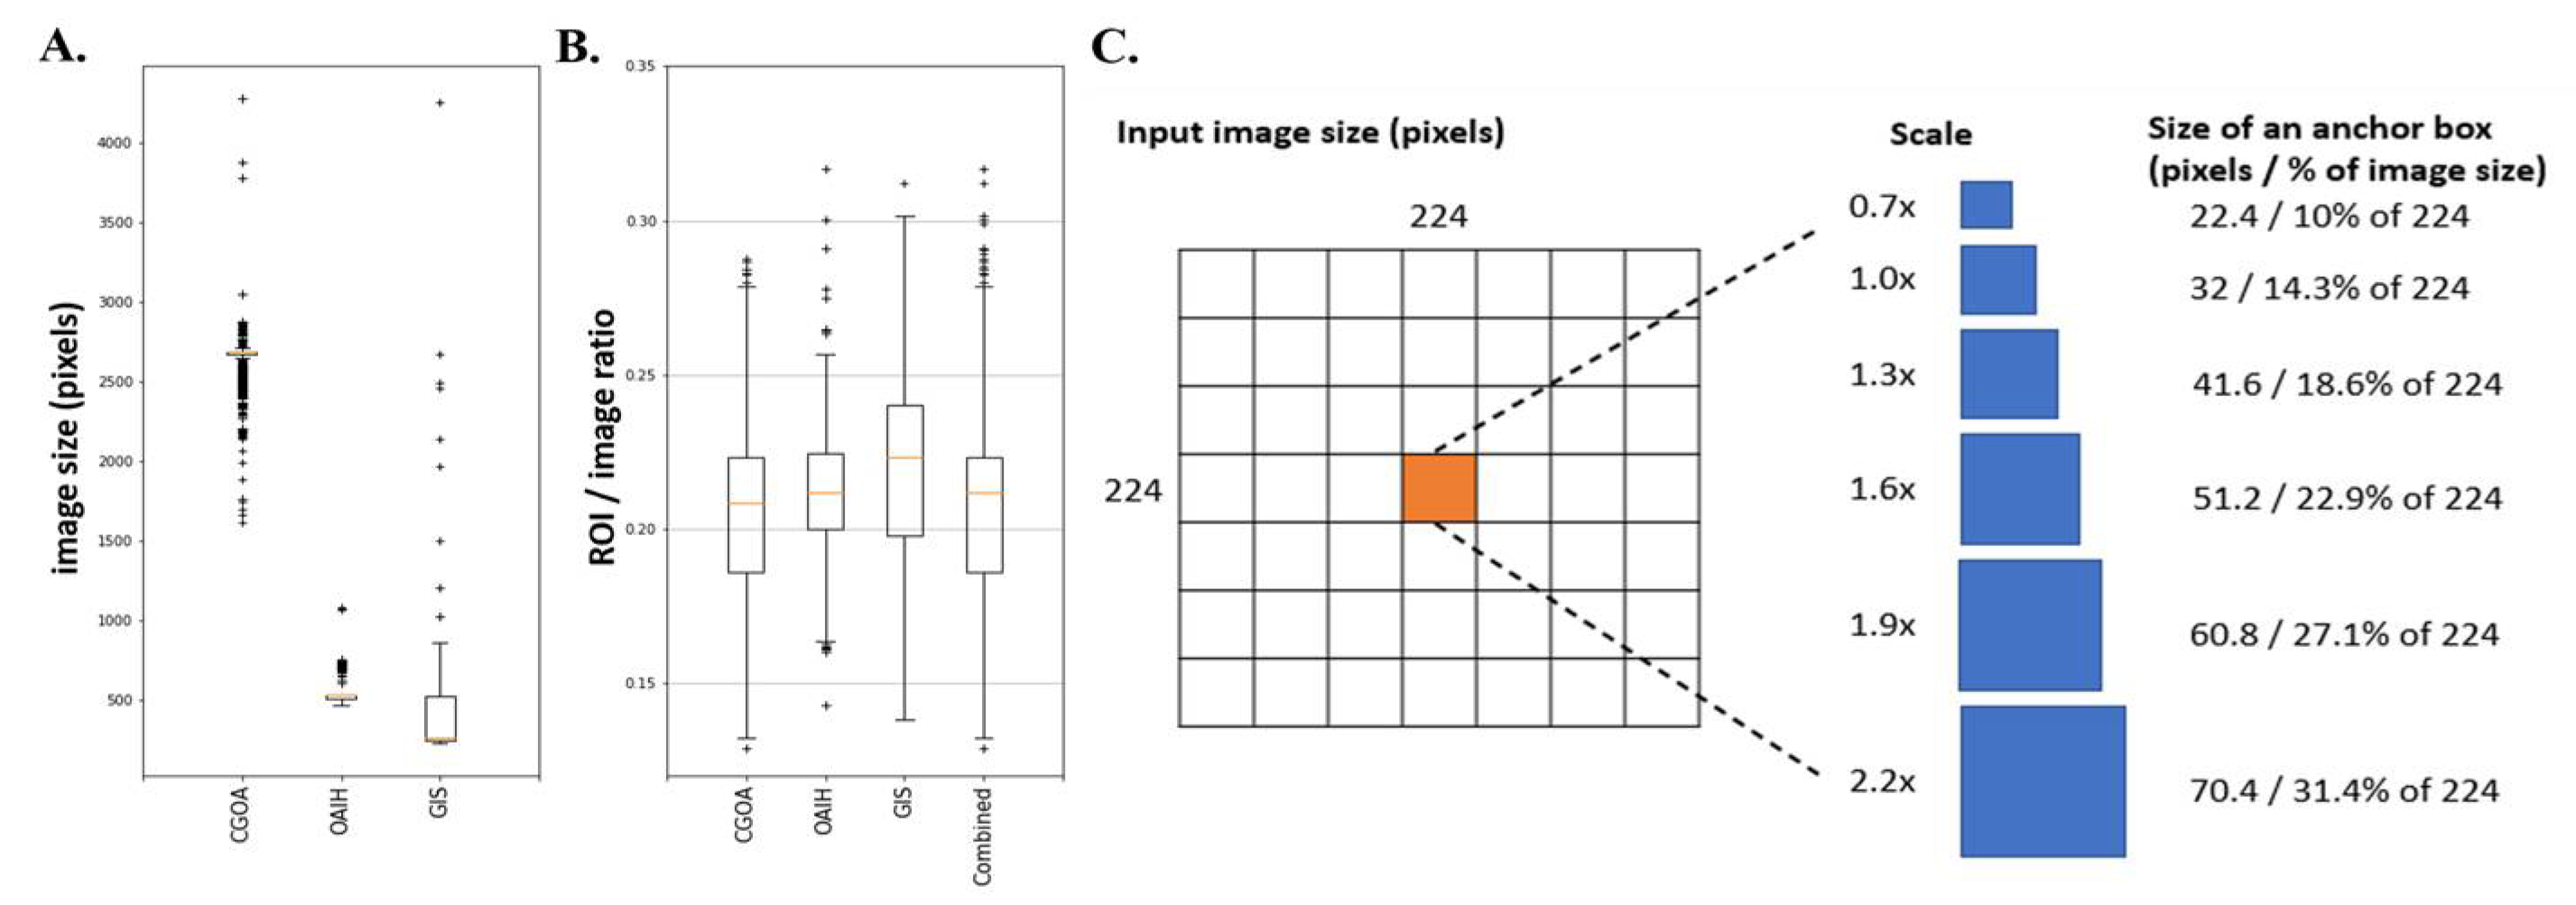
To best determine the anchor box parameter settings, we first defined the size of the square ROI divided by the length of the long side of the input image (zero padding to a square if needed). This ratio is designed as a normalizer, making the anchor boxes and ROI instances compatible across different datasets. Next, we analyzed image size distributions (
Figure 3A) and distributions (
Figure 3B) of the three available heterogeneous datasets, where the ratios lie mostly between 10% to 30%.
We specified the input image size of 224 × 224 pixels split by 7 × 7 grid cells, where each grid cell is of size 32 × 32 pixels. We set 6 equally spaced scales parameters {0.7, 1.0, 1.3, 1.6, 1.9, 2.2} (
Figure 3C) so that the smallest and largest anchor boxes could cover 10% and 31.4% of the images, respectively. This design ensures that the designed anchor boxes can identify appropriate hip ROIs in the datasets.
2.4. Data Preprocessing, Training, and Evaluation
For data preprocessing, each radiograph was zero padding to a square image and resized to 224 × 224 pixels with 8-bit grayscale before feeding into the model. The model was implemented by fastai v0.7 library [
22] with Python 3.6.4, and we randomly split the combined CGOA and OAIH dataset into 90% for training and 10% for validation once, and used all 101 GIS radiographs as the independent test dataset. We fixed the same training and validation images in either the combined dataset or each individual dataset in all experiments for fair comparison. For evaluation, we used the standard IoU metric for comparing the predicted bounding box
Bpred and ground truth bounding box
Bgt:
where
and
denote intersection and union, respectively. We reported the associated confidence, which denotes the likelihood that the anchor box contains an object, for each predicted bounding box, average IoU, average confidence, minimal confidence, and AP50, as the 0.5 cutoff indicates poor ROI detection, which may cause issues for downstream analysis.
3. Results
3.1. Demographics of the Study Population
The original CGOA cohort contained 4643 high resolution radiographs, including 3013 patients who underwent hip surgery with an average age of 63.06 ± 15.72 years and 40.8% being male, and 1630 control cases from emergency room without undergoing hip surgery with an average age of 44.88 ± 20.46 years and 68.2% being male. Among the 3013 surgical patients, 353 cases with severe fractures were excluded due to completely different morphology and treatment options. The remaining 2660 trauma patients including hundreds of occult fracture cases and 1630 control cases constructed the COGA dataset. The second OAIH dataset was a consolidated pelvic radiograph dataset extracted from subset of data from the OAI project, which recruited 4796 participants from February 2004 to May 2006 to form a baseline cohort (58% female and ranged in age from 45 to 79 years at time of recruitment). The third GIS dataset was acquired through Google image search engine, and the demographics are not available.
3.2. Model Performance and Visualization
In
Table 2, we take a closer look at the best performance results and carefully examine those cases where hip ROIs had IoU < 0.5. As AP50 metrics were 1 in both training and validation set and 0.9901 in the independent GIS test set, we only identified two cases below IoU 0.5 cutoff, which may indicate poor ROI detection and cause issues for downstream analysis.
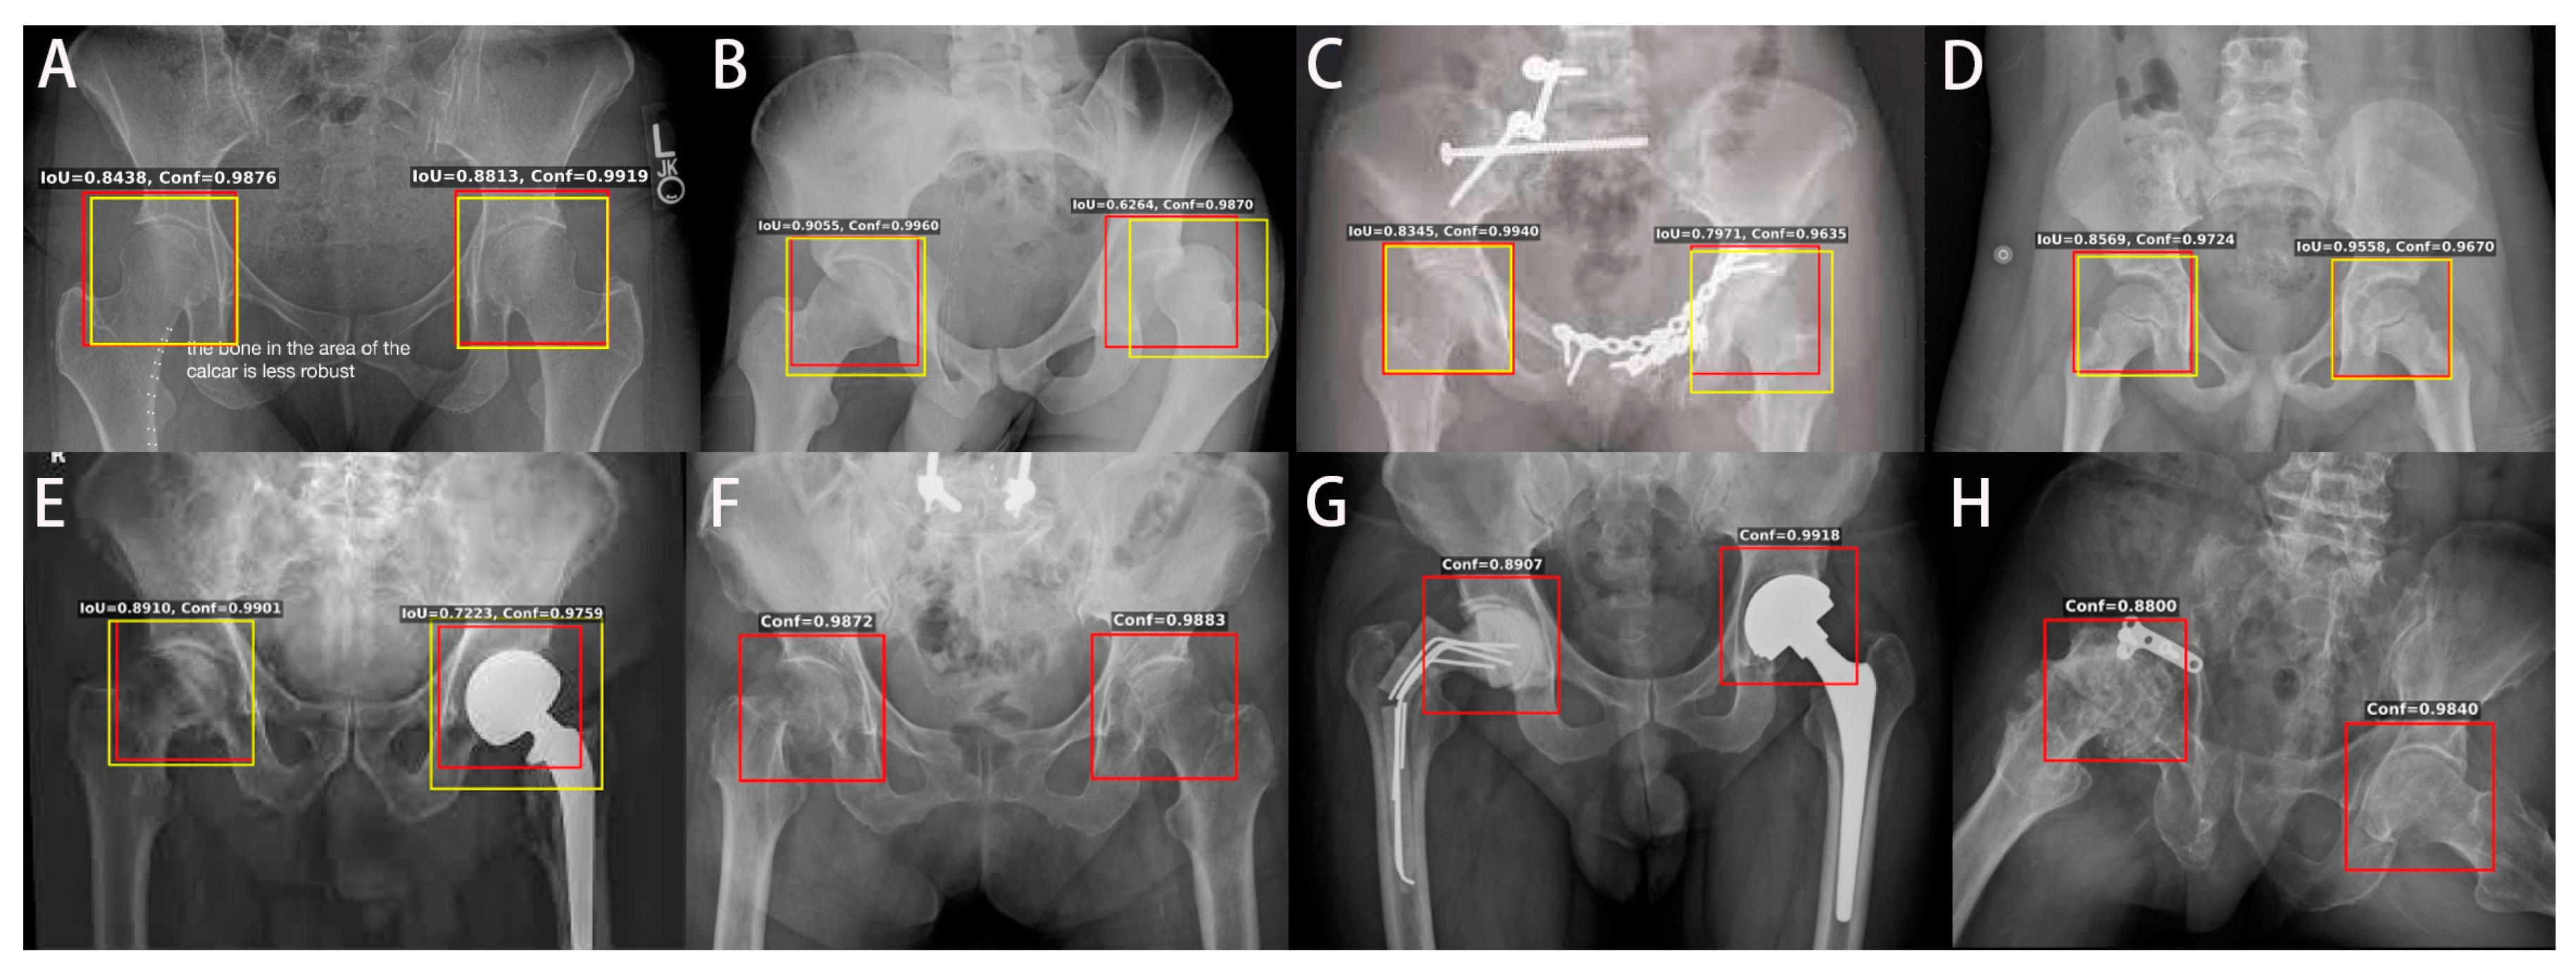
We further examined other radiographs in the heterogeneous test set, and the hip ROI detection showed several representative results, as
Figure 4 presents.
Figure 4A shows a radiograph with some text outside the key hip area.
Figure 4B shows the dislocation on the left hip, but the detected hip ROI covers most key features of the left hip.
Figure 4C shows a radiograph with plates on the left pubic ramus and acetabulum, and ROI can detect the hips correctly.
Figure 4D shows a radiograph with pediatric patients.
Figure 4E shows left hip artificial can be detected correctly.
Figure 4F hip ROI indicated right proximal femoral fracture.
Figure 4G shows right temporal cemented prosthesis fracture and left total hip replacement, and the hip ROI can be detected. Finally, as shown in
Figure 4H, the hip ROI was able to detect right acetabular fracture with plate fixation and destructed femoral head. These results suggest that our model with specially designed anchors and trained by diverse datasets is a general and robust hip region detector that can be applicable for a wide range of heterogeneous datasets with different qualities and resolutions and can be potentially useful for automated assessment of many hip bone conditions.
4. Discussion
In this work, we have demonstrated a practical framework for detecting regions of interest in medical images. With the case study for hip detection in PXRs, we achieved average IoU over 80% and average confidence higher than 95%. These independent test set showed promising ROI detection results on GIS with heterogeneous resolutions and appearance. The proposed hip region detection architecture simplified existing SSD model architecture, which was originally developed for detecting multiple objects with different sizes and aspect ratios in applications. For ROI detection in medical images, there are usually one or two important organs in one radiograph. It is feasible to have a simplified SSD architecture with only one feature layer as the only convolutional predictor, with an appropriate receptive field size, one aspect ratio (1:1 in for hip ROI), and a small set of scales.
Compared to traditional object detection tasks, which need to recognize multiple objects with different sizes and aspect ratios in images and videos, the proposed SSD architecture has the advantages of simpler structure, higher IoU accuracy, and reliable confidence. The challenge of determining those empirical parameter settings now relies on the basic statistics on the available datasets to generate enough anchor boxes. Our results suggest that more anchors do not necessarily encourage higher IoU but may decrease the prediction performance. The proposed method provides a more effective approach for anchor design and parameter optimization.
Annotation by doctors is time-consuming and is usually the bottleneck for medical image analysis. The approximate identification of hip regions by automated and accurate ROI detection is critical for automated computer-assisted analysis for screening and diagnostics. The proposed framework provides a guideline for parameter settings in anchor-based object detection algorithms, and it is especially useful for applications such as joint identification in medical image problems. Several studies have reported good results [
14,
15,
16,
17]. However, heavy labeling workload and cost of physicians’ label are another consideration that has limited this method from going global. Our study provided a method of manual annotation with approximation identification of hip regions that can be performed effectively and inexpensively.
Medical artificial intelligence is progressive in order to change the healthcare system, and various DCNNs have showed that it is feasible to detect lesions from pathologic images [
23] and radiography [
24]. These algorithms presented outstanding achievement in disease detection or prediction of whose performance is not inferior to that of the physicians [
23,
24,
25]. These results inspire us in that DCNN might help individuals in the healthcare sector in different ways. However, the development of medical AI is not accessible due to some limitations. The data clearance and accurate label were considered fundamental for deep learning because of the limited size and data quality of medical images [
19] and the high cost of a medical expert to perform labeling [
26]. Moreover, the hip ROI detection system can help the physician to label the lesion in a weak supervision way, wherein we can pick out the hip regions and save time for the physician to crop and copy the images. The reduction of the barrier between an outliner and the way in which to attract more physicians and scientists to join a new rising technologic field are other issues to be considered in the real world. In this study, we developed the diagnostic assistance system and created a useful tool for reducing the workload during data collection and tuning. With our tool, we can simply label workload, minimize the calculation requirement, and eventually make the physician use it in the way they need. There are numerous existing programs [
27,
28] that can help orthopedics to plan the surgical strategy. Our algorithm might accelerate the speed of these programs by reducing calculation requirements in the future. The utility of such ROI detection approaches highly depends on the downstream applications. With input of clinical physicians’ expertise, this automated hip ROI detection enables applications such as fracture identification, osteoarthritis assessment, osteoporosis, and even surgical prediction in the future. The evaluations of such applications and integrated systems remain to be investigated in future works and remain to be open research topics.
5. Limitation
Our study provided a feasible framework of automated ROI labeling. However, there are still some limitations in the existing method. First, the manual hip annotation with loose-fitting criteria is not unique and can be varied from person to person, especially for those cases with destructed hips. In these situations, a closer visual examination is needed. Because of the data distribution, we excluded most images from patients with endomedullary prostheses to make the training data solid. Therefore, we did not have these kinds of images for further validation, which might impact the usability of this algorithm. Lastly, limited medical image data might influence the performance of this algorithm. Increasing data from other sources might increase the performance and prevent the possibility of overfitting.
6. Conclusions
In conclusion, with the proposed DCNN framework, we can identify the hip joint with high accuracy, reliability, and reproducibility. It has a clear approach for ROI detection in plain X-ray and has practical usefulness for future applications in medical imaging. Increasing data and destructed hip analysis might improve the performance of this algorithm. However, the downstream application of hip ROI detection is a further research direction, and with our tool, we can simply label workload and eventually adjust the algorithm to fulfil the physicians’ need to achieve the aim of personalized healthcare.
Author Contributions
F.-Y.L., S.-C.C. and C.-H.L. designed the experiments; C.-C.C., C.-T.C. and C.-H.L. acquired radiographics for use in the study and provided strategic support; F.-Y.L. and S.-C.C. wrote code to achieve different tasks and carried out all experiments; F.-Y.L. implemented the annotation tools for data annotation; F.-Y.L., S.-C.C., C.-P.H. and C.-H.L. provided labels for use in measuring algorithm performance; F.-Y.L., C.-Y.F. and C.-C.C. drafted the manuscript; S.-C.C. helped extensively with writing the manuscript; S.-C.C., M.S.L. and C.-H.L. supervised the project; C.-T.W., C.-H.L. and M.S.L. revised this manuscript. All authors have read and agreed to the published version of the manuscript.
Funding
This research was funded by the Ministry of Science and Technology, Taiwan, MOST109-2622-B-182A-001 (NCRPG3J0012), and Chang Gung Memorial Hospital, grant numbers CMRPG3K0801, CMRPG3L0381 and CIRPG3H0021.
Institutional Review Board Statement
The study was conducted according to the guidelines of the Declaration of Helsinki and approved by the Institutional Review Board of Chang Gung Memorial hospital, no. 201801897B0.
Informed Consent Statement
Not applicable.
Data Availability Statement
The data are partially available under the request of the audience.
Acknowledgments
The authors thank CMRPG1K0091 and CIRPG3H0021 for supporting the study and operative system.
Conflicts of Interest
The authors declare no conflict of interest. The funders had no role in the design of the study; in the collection, analyses, or interpretation of data; in the writing of the manuscript; or in the decision to publish the results.
References
- Cheng, C.-T.; Ho, T.-Y.; Lee, T.-Y.; Chang, C.-C.; Chou, C.-C.; Chen, C.-C.; Chung, I.-F.; Liao, C.-H. Application of a deep learning algorithm for detection and visualization of hip fractures on plain pelvic radiographs. Eur. Radiol. 2019, 29, 5469–5477. [Google Scholar] [CrossRef] [PubMed] [Green Version]
- Xue, Y.; Zhang, R.; Deng, Y.; Chen, K.; Jiang, T. A preliminary examination of the diagnostic value of deep learning in hip osteoarthritis. PLoS ONE 2017, 12, e0178992. [Google Scholar] [CrossRef] [PubMed] [Green Version]
- Wang, X.; Peng, Y.; Lu, L.; Lu, Z.; Bagheri, M.; Summers, R.M. Chest X-ray 8: Hospital-scale chest X-ray database and benchmarks on weakly-supervised classification and localization of common thorax diseases. In Proceedings of the IEEE Conference on Computer Vision and Pattern Recognition, Las Vegas, NV, USA, 27–30 June 2016; pp. 2097–2106. [Google Scholar]
- Rajpurkar, P.; Irvin, J.; Bagul, A.; Ding, D.; Duan, T.; Mehta, H.; Yang, B.; Zhu, K.; Laird, D.; Ball, R.L.; et al. MURA: Large dataset for abnormality detection in musculoskeletal radiographs. arXiv 2017, arXiv:1712.06957. [Google Scholar]
- Redmon, J.; Farhadi, A. YOLOv3: An incremental improvement. arXiv 2018, arXiv:1804.02767. [Google Scholar]
- Redmon, J.; Divvala, S.; Girshick, R.; Farhadi, A. You only look once: Unified, real-time object detection. In Proceedings of the IEEE Conference on Computer Vision and Pattern Recognition, Las Vegas, NV, USA, 27–30 June 2016; pp. 779–788. [Google Scholar]
- Redmon, J.; Farhadi, A. YOLO9000: Better, Faster, Stronger. arXiv 2016, arXiv:1506.02640. [Google Scholar]
- Bochkovskiy, A.; Wang, C.-Y.; Liao, H.-Y.M. YOLOv4: Optimal speed and accuracy of object detection. arXiv 2020, arXiv:2004.10934. [Google Scholar]
- Liu, W.; Anguelov, D.; Erhan, D.; Szegedy, C.; Reed, S.; Fu, C.-Y.; Berg, A.C. SSD: Single shot multibox detector. In Proceedings of the Computer Vision—ECCV 2016; Springer: Berlin/Heidelberg, Germany, 2016; pp. 21–37. [Google Scholar]
- Simonyan, K.; Zisserman, A. Very deep convolutional networks for large-scale image recognition. arXiv 2014, arXiv:1409.1556. [Google Scholar]
- He, K.; Zhang, X.; Ren, S.; Sun, J. Deep residual learning for image recognition. In Proceedings of the IEEE Conference on Computer Vision and Pattern Recognition, Las Vegas, NV, USA, 27–30 June 2016; pp. 770–778. [Google Scholar]
- Xie, S.; Girshick, R.; Dollár, P.; Tu, Z.; He, K. Aggregated residual transformations for deep neural networks. In Proceedings of the IEEE Conference on Computer Vision and Pattern Recognition, Honolulu, HI, USA, 21–26 July 2017; pp. 1492–1500. [Google Scholar]
- Tiulpin, A.; Thevenot, J.; Rahtu, E.; Saarakkala, S. A novel method for automatic localization of joint area on knee plain radiographs. In Proceedings of the Image Analysis; Springer: Berlin/Heidelberg, Germany, 2017; pp. 290–301. [Google Scholar]
- Tiulpin, A.; Thevenot, J.; Rahtu, E.; Lehenkari, P.; Saarakkala, S. Automatic knee osteoarthritis diagnosis from plain radiographs: A deep learning-based approach. Sci. Rep. 2018, 8, 1727. [Google Scholar] [CrossRef] [PubMed]
- Krogue, J.D.; Cheng, K.V.; Hwang, K.M.; Toogood, P.; Meinberg, E.G.; Geiger, E.J.; Zaid, M.; McGill, K.C.; Patel, R.; Sohn, J.H.; et al. Automatic hip fracture identification and functional subclassification with deep learning. Radiol. Artif. Intell. 2020, 2, e190023. [Google Scholar] [CrossRef] [Green Version]
- von Schacky, C.E.; Sohn, J.H.; Liu, F.; Ozhinsky, E.; Jungmann, P.M.; Nardo, L.; Posadzy, M.; Foreman, S.C.; Nevitt, M.C.; Link, T.M.; et al. Development and validation of a multitask deep learning model for severity grading of hip osteoarthritis features on radiographs. Radiology 2020, 295, 136–145. [Google Scholar] [CrossRef]
- Li, Y.; Li, Y.; Tian, H. Deep learning-based end-to-end diagnosis system for avascular necrosis of femoral head. IEEE J. Biomed. Health Inform. 2020. [Google Scholar] [CrossRef] [PubMed]
- Zhao, Z.-Q.; Zheng, P.; Xu, S.-T.; Wu, X. Object detection with deep learning: A review. IEEE Trans. Neural Netw. Learn. Syst. 2019, 30, 3212–3232. [Google Scholar] [CrossRef] [Green Version]
- Esteva, A.; Chou, K.; Yeung, S.; Naik, N.; Madani, A.; Mottaghi, A.; Liu, Y.; Topol, E.; Dean, J.; Socher, R. Deep learning-enabled medical computer vision. NPJ Digit. Med. 2021, 4, 5. [Google Scholar] [CrossRef] [PubMed]
- Joseph, G.B.; Hilton, J.F.; Jungmann, P.M.; Lynch, J.A.; Lane, N.E.; Liu, F.; McCulloch, C.E.; Tolstykh, I.; Link, T.M.; Nevitt, M.C. Do persons with asymmetric hip pain or radiographic hip OA have worse pain and structure outcomes in the knee opposite the more affected hip? Data from the Osteoarthritis Initiative. Osteoarthr. Cartil. 2016, 24, 427–435. [Google Scholar] [CrossRef] [PubMed] [Green Version]
- Russakovsky, O.; Deng, J.; Su, H.; Krause, J.; Satheesh, S.; Ma, S.; Huang, Z.; Karpathy, A.; Khosla, A.; Bernstein, M.; et al. ImageNet large scale visual recognition challenge. Int. J. Comput. Vis. 2015, 115, 211–252. [Google Scholar] [CrossRef] [Green Version]
- Howard, J.; Gugger, S. Fastai: A layered API for deep learning. Information 2020, 11, 108. [Google Scholar] [CrossRef] [Green Version]
- Esteva, A.; Kuprel, B.; Novoa, R.A.; Ko, J.; Swetter, S.M.; Blau, H.M.; Thrun, S. Dermatologist-level classification of skin cancer with deep neural networks. Nature 2017, 542, 115–118. [Google Scholar] [CrossRef] [PubMed]
- Cheng, C.-T.; Wang, Y.; Chen, H.-W.; Hsiao, P.-M.; Yeh, C.-N.; Hsieh, C.-H.; Miao, S.; Xiao, J.; Liao, C.-H.; Lu, L. A scalable physician-level deep learning algorithm detects universal trauma on pelvic radiographs. Nat. Commun. 2021, 12, 1066. [Google Scholar] [CrossRef]
- Gulshan, V.; Peng, L.; Coram, M.; Stumpe, M.C.; Wu, D.; Narayanaswamy, A.; Venugopalan, S.; Widner, K.; Madams, T.; Cuadros, J.; et al. Development and validation of a deep learning algorithm for detection of diabetic retinopathy in retinal fundus photographs. JAMA 2016, 316, 2402–2410. [Google Scholar] [CrossRef]
- Tobore, I.; Li, J.; Yuhang, L.; Al-Handarish, Y.; Kandwal, A.; Nie, Z.; Wang, L. Deep learning intervention for health care challenges: Some biomedical domain considerations. JMIR Mhealth Uhealth 2019, 7, e11966. [Google Scholar] [CrossRef] [PubMed]
- Meermans, G.; Malik, A.; Witt, J.; Haddad, F. Preoperative radiographic assessment of limb-length discrepancy in total hip arthroplasty. Clin. Orthop. Relat. Res. 2011, 469, 1677–1682. [Google Scholar] [CrossRef] [PubMed] [Green Version]
- Schröter, S.; Ihle, C.; Mueller, J.; Lobenhoffer, P.; Stöckle, U.; van Heerwaarden, R. Digital planning of high tibial osteotomy. Interrater reliability by using two different software. Knee Surgery Sports Traumatol. Arthrosc. 2013, 21, 189–196. [Google Scholar] [CrossRef] [PubMed]
| Publisher’s Note: MDPI stays neutral with regard to jurisdictional claims in published maps and institutional affiliations. |
© 2021 by the authors. Licensee MDPI, Basel, Switzerland. This article is an open access article distributed under the terms and conditions of the Creative Commons Attribution (CC BY) license (https://creativecommons.org/licenses/by/4.0/).


 ,
, 


