Retrospective CT/MRI Texture Analysis of Rapidly Progressive Hepatocellular Carcinoma

 ,
,  , and
, and
Abstract
:
1. Introduction
2. Materials and Methods
2.1. MR Technique
2.2. CT Technique
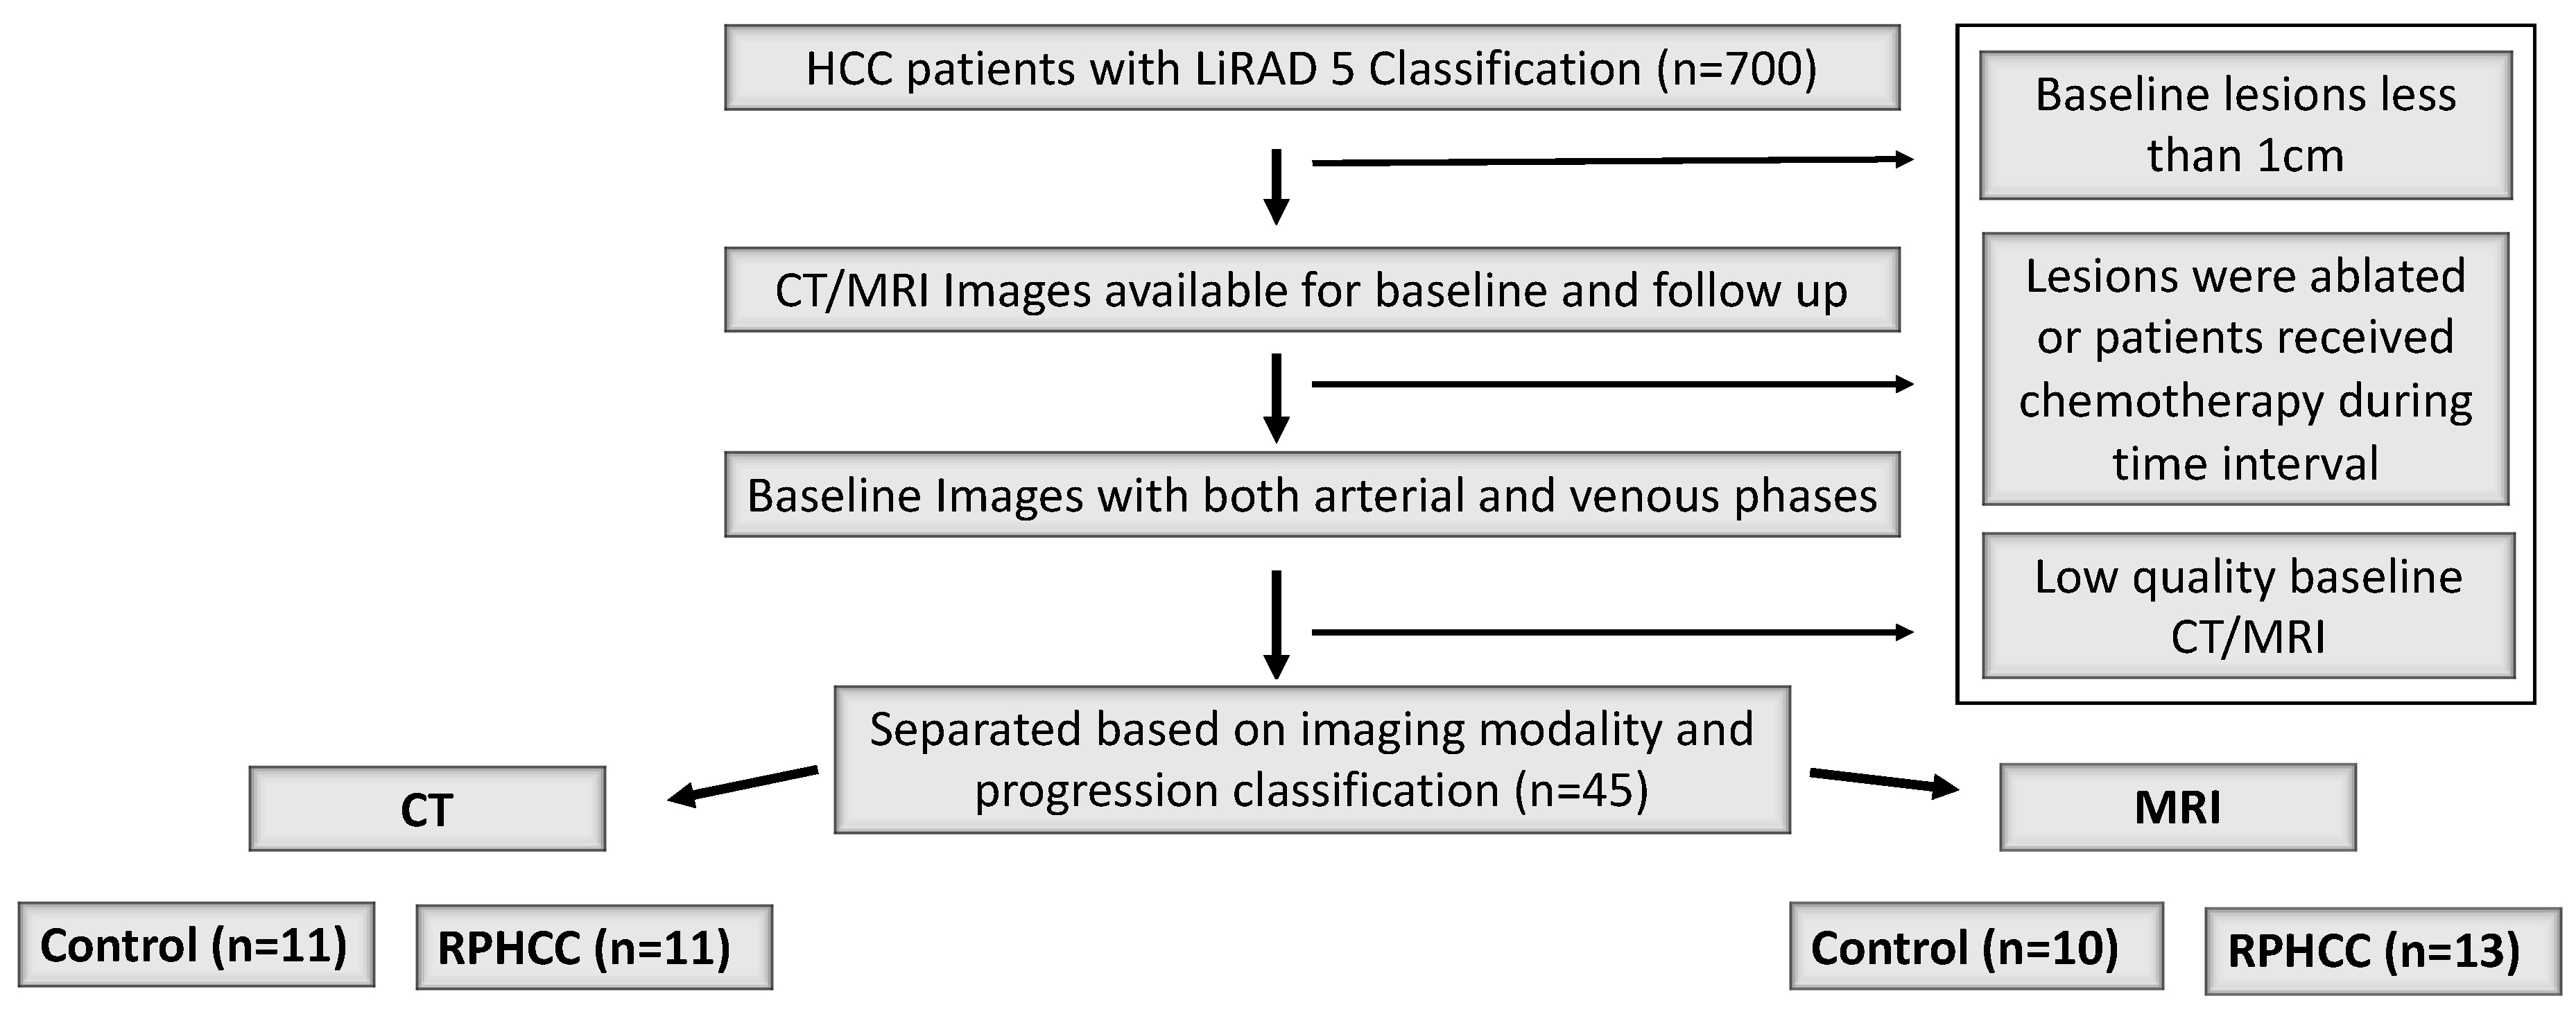
2.3. Study Population
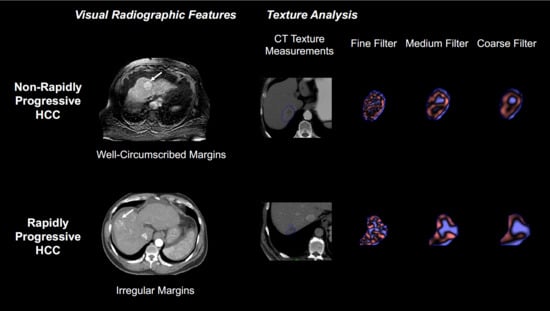
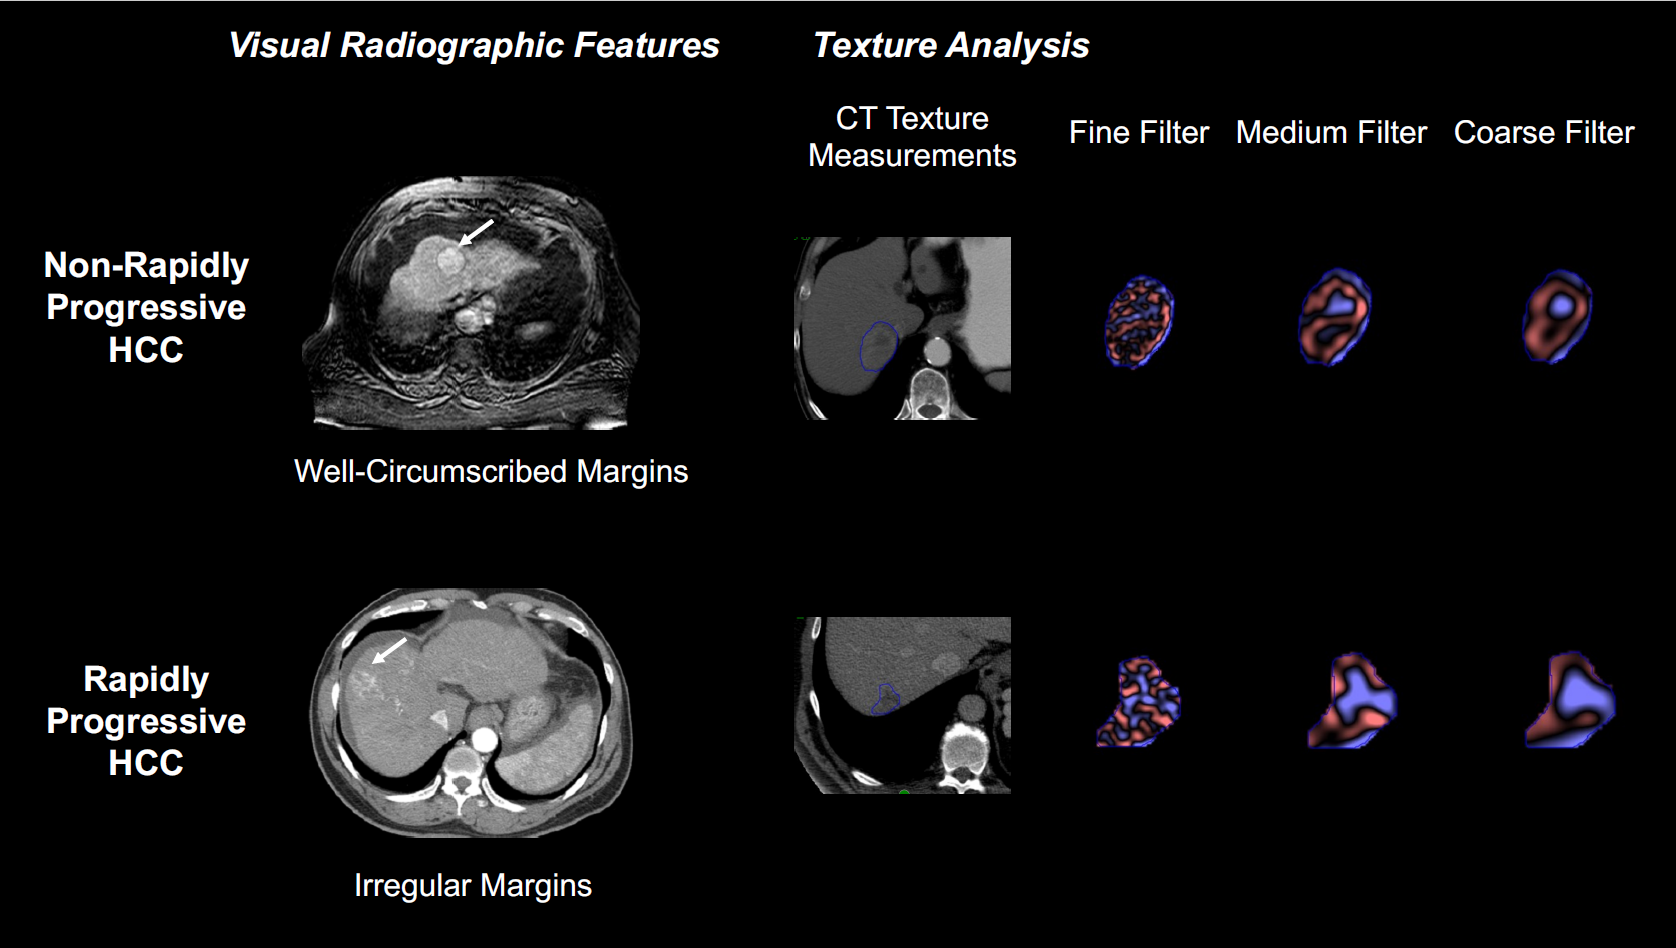
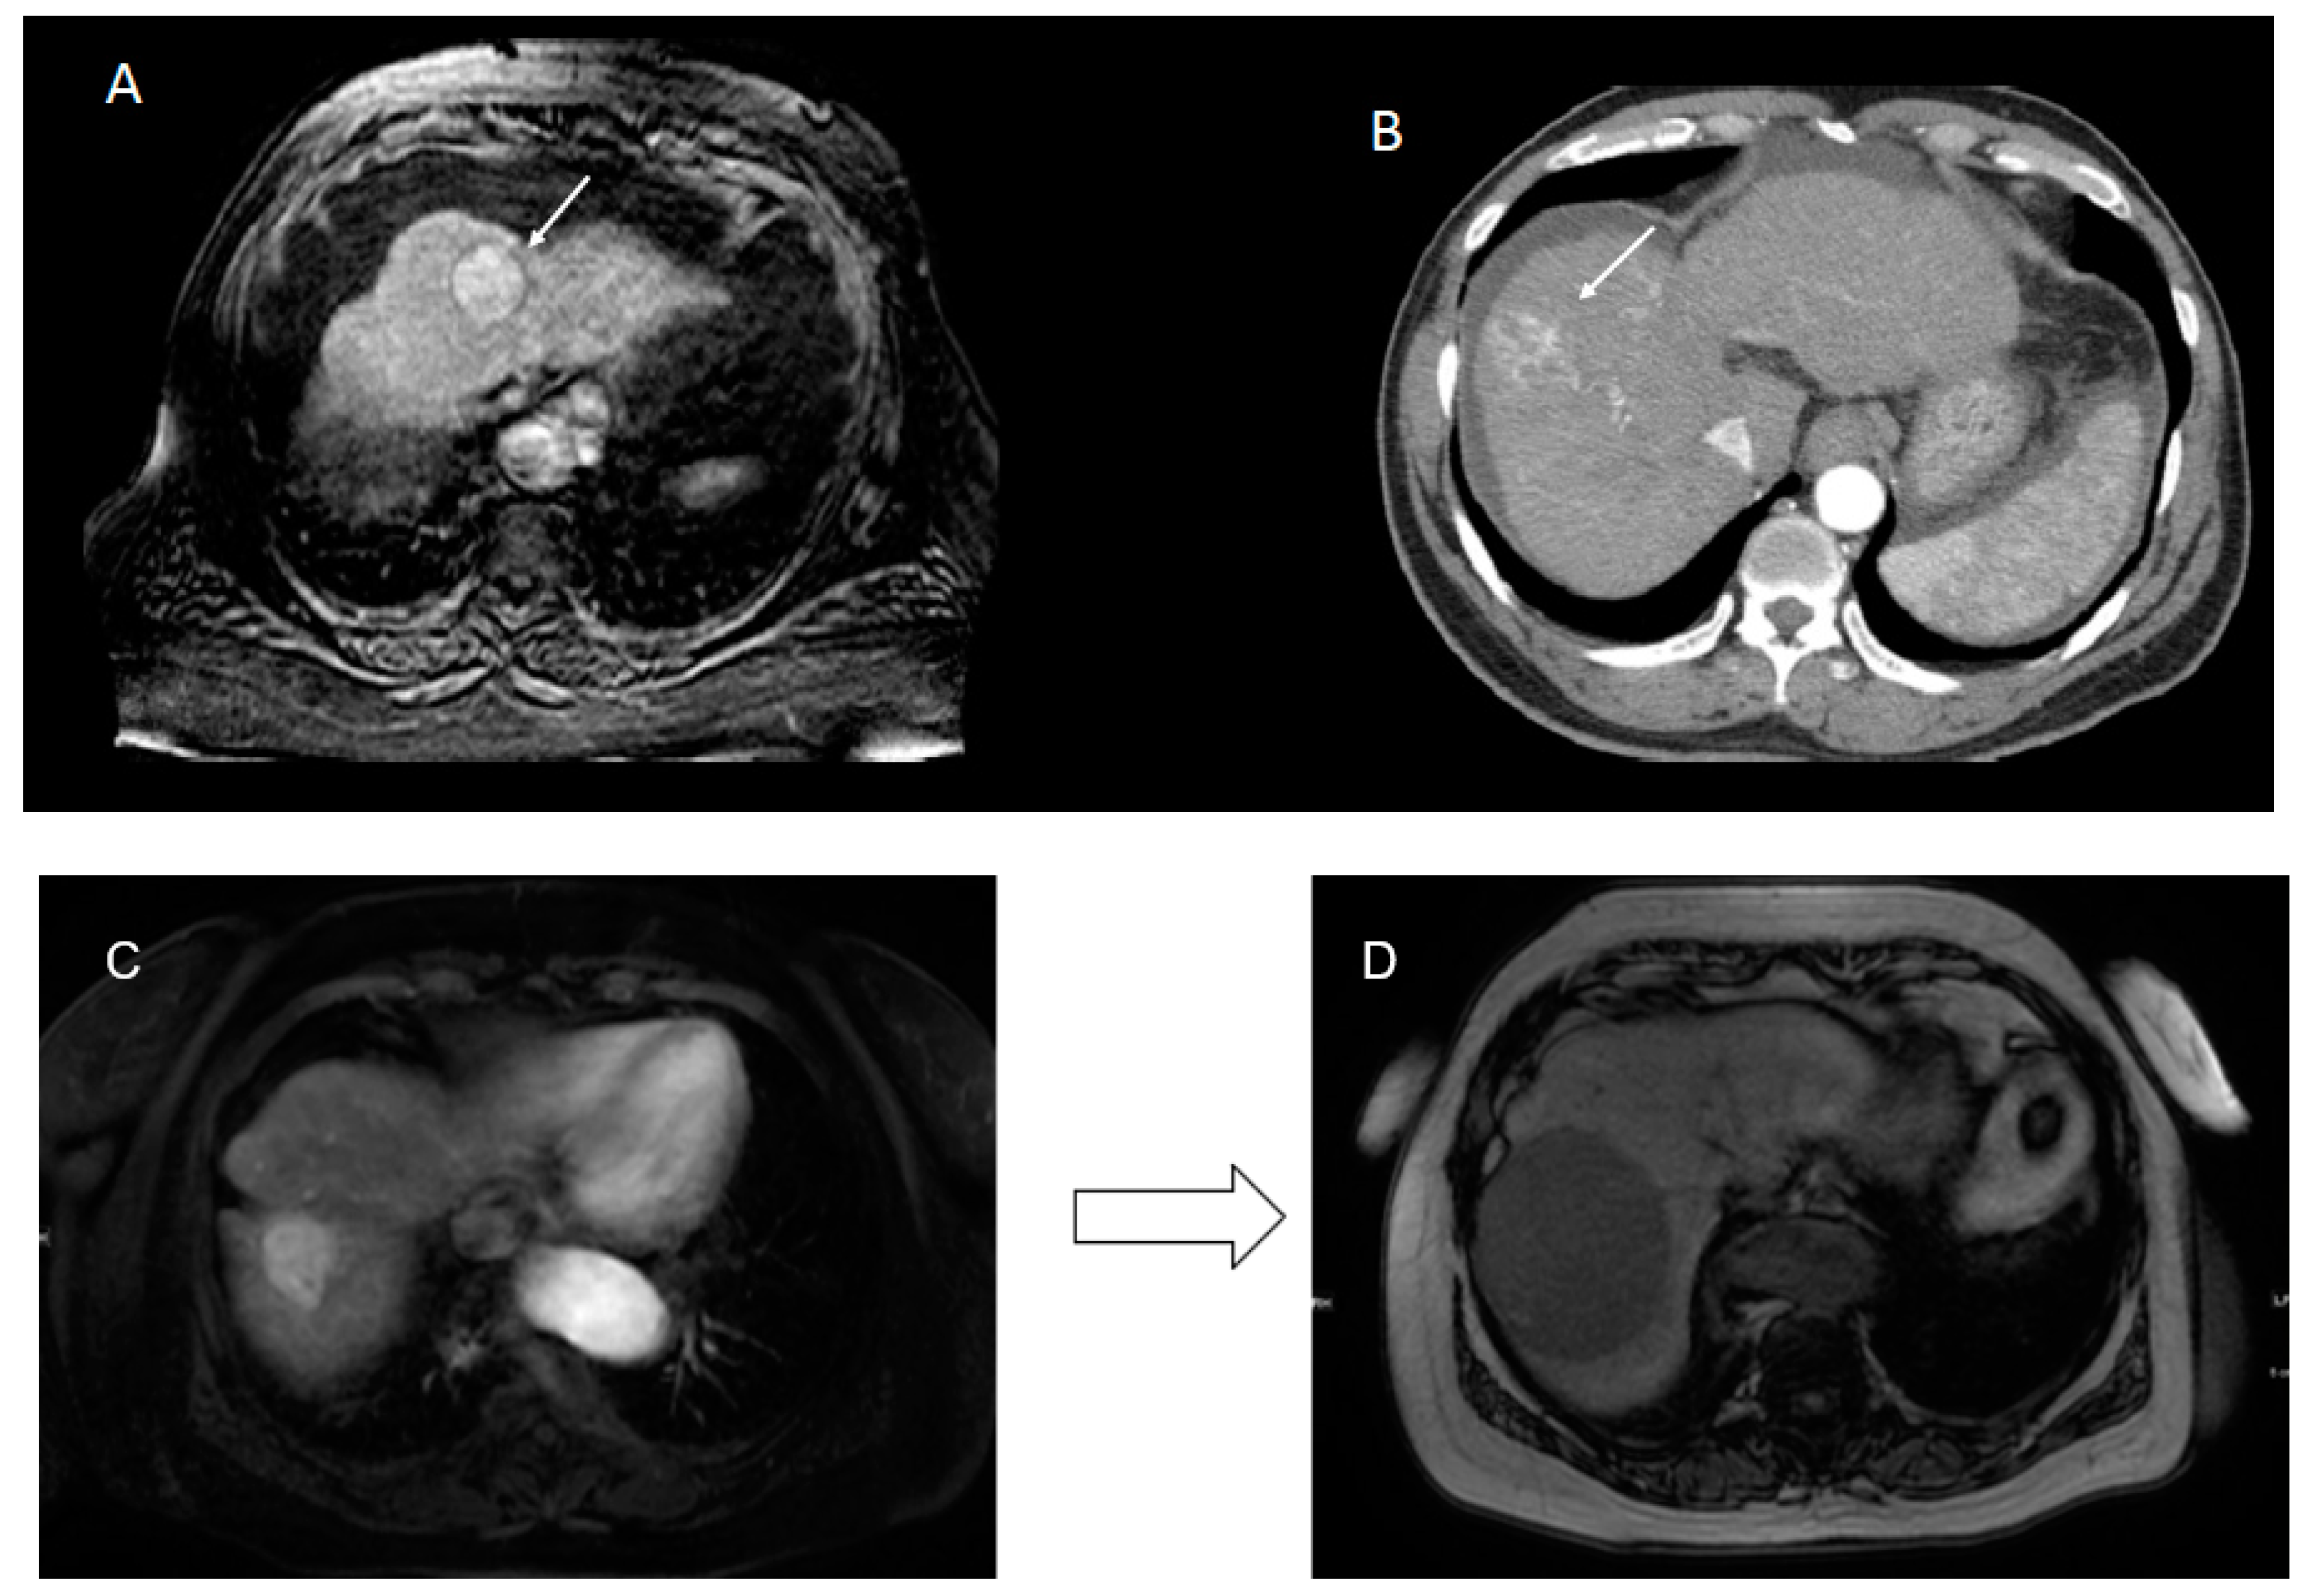
2.4. Qualitative Visual Analysis
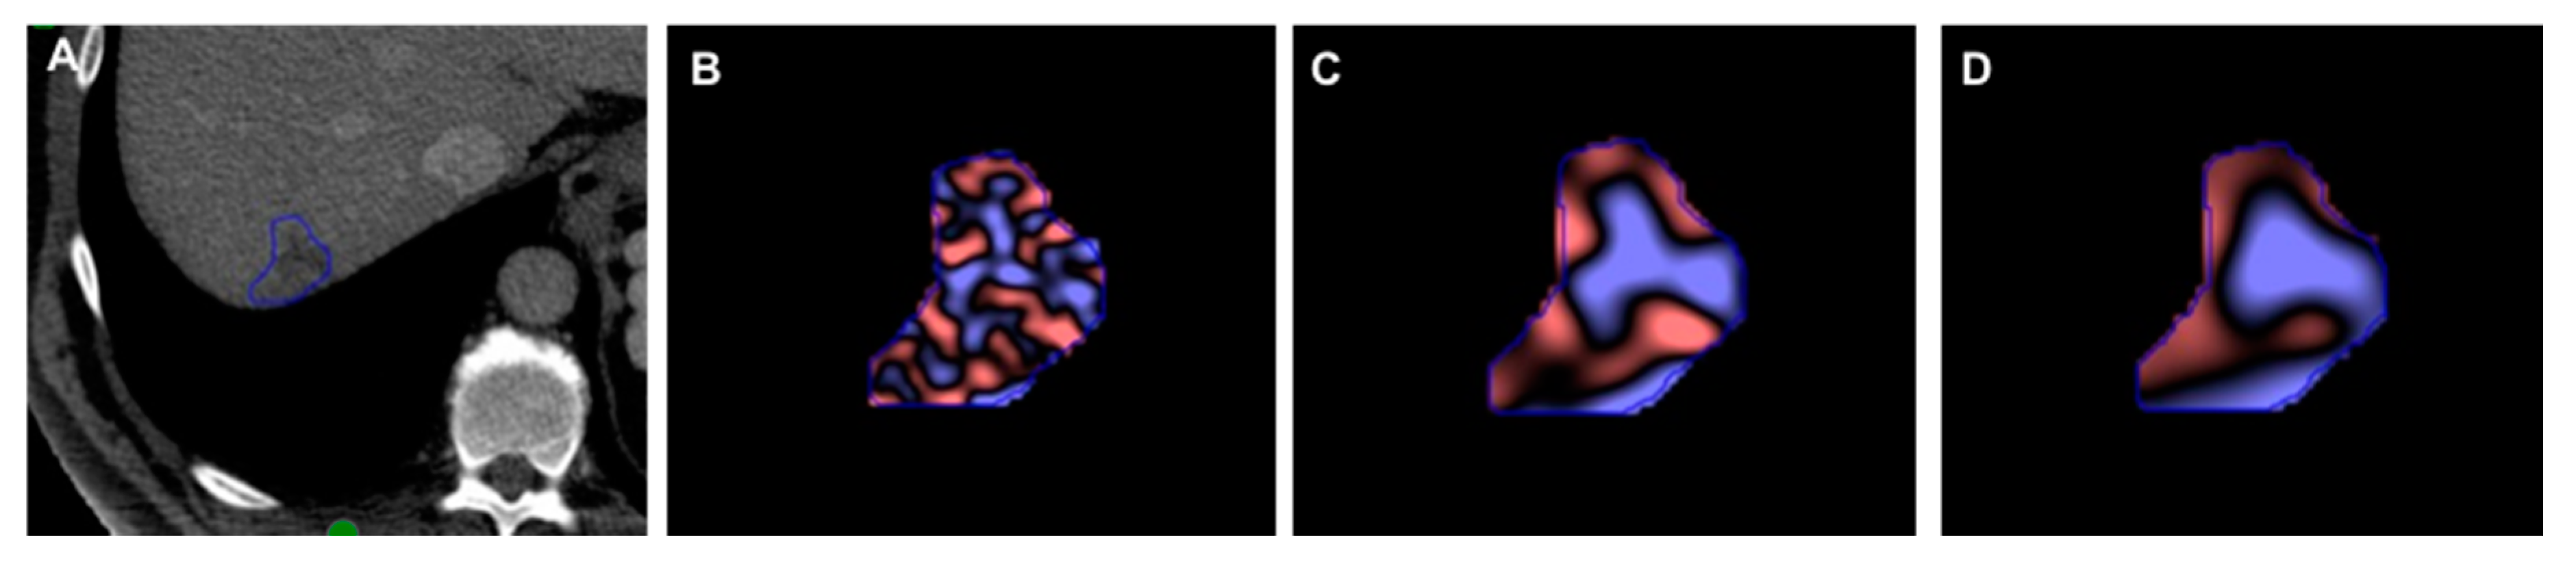
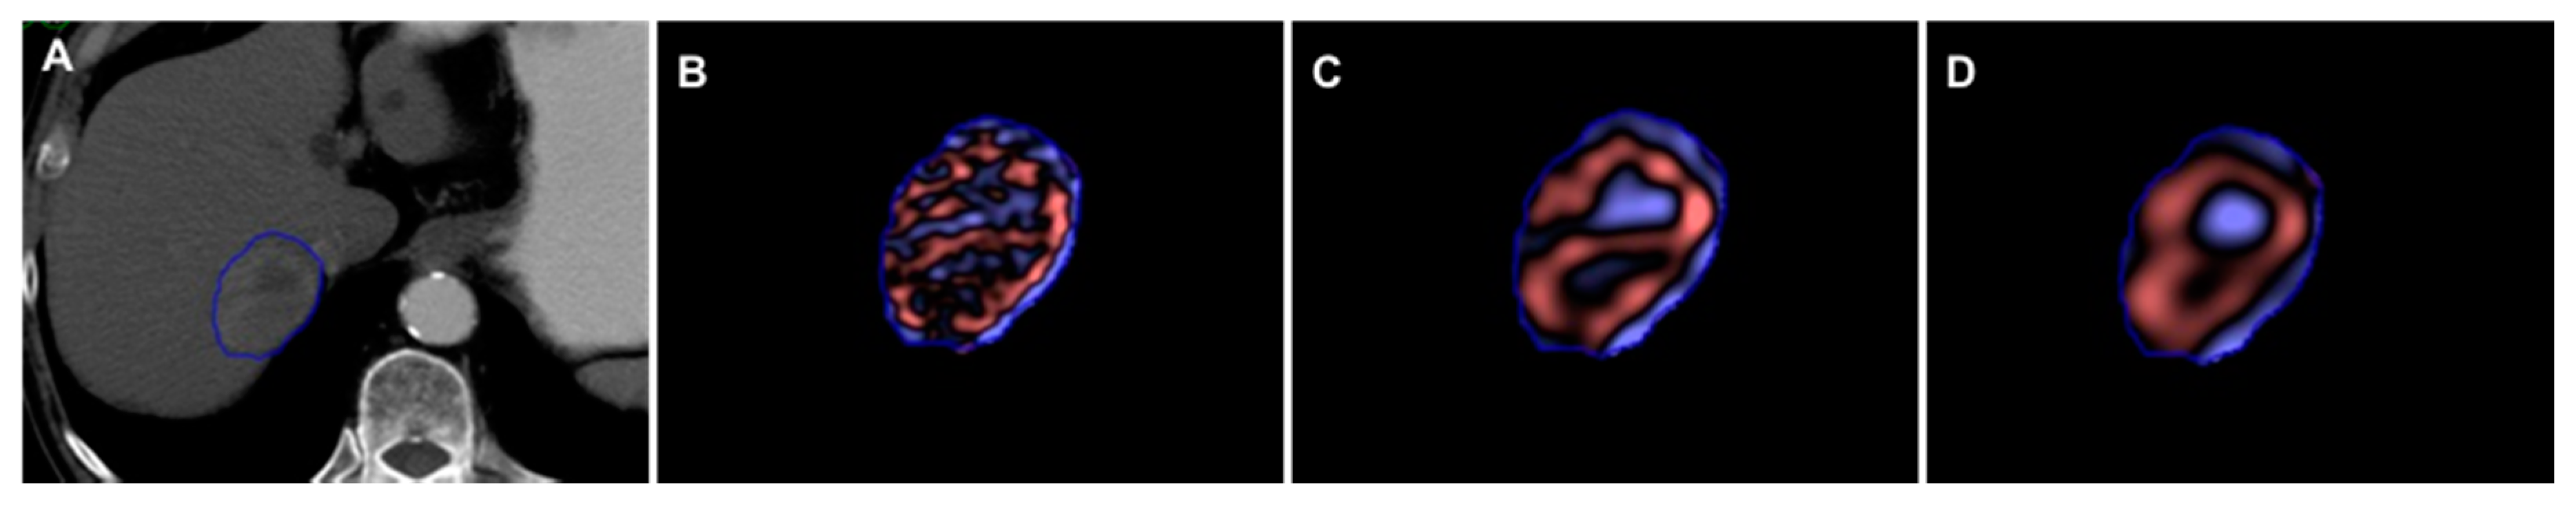
2.5. Texture Analysis
2.6. Statistical Analysis
3. Results
3.1. Cohort and Visual Features
3.2. Differences in Texture Features
3.3. Diagnostic Criteria Based on Results of CT Texture Features
4. Discussion
5. Conclusions
Author Contributions
Funding
Conflicts of Interest
References
- El-Serag, H.B. Hepatocellular carcinoma. N. Engl. J. Med. 2011, 365, 1118–1127. [Google Scholar] [CrossRef]
- Zheng, B.-H.; Liu, L.-Z.; Zhang, Z.-Z.; Shi, J.-Y.; Dong, L.-Q.; Tian, L.-Y.; Ding, Z.-B.; Ji, Y.; Rao, S.-X.; Zhou, J.; et al. Radiomics score: A potential prognostic imaging feature for postoperative survival of solitary HCC patients. BMC Cancer 2018, 18, 1148. [Google Scholar] [CrossRef] [PubMed]
- Erstad, D.J.; Tanabe, K.K. Hepatocellular carcinoma: Early-stage management challenges. J. Hepatocell. Carcinoma 2017, 4, 81–92. [Google Scholar] [CrossRef] [PubMed] [Green Version]
- Zhu, Z.-J. Milan criteria and its expansions in liver transplantation for hepatocellular carcinoma. Hepatobiliary Surg. Nutr. 2016, 5, 498–502. [Google Scholar] [CrossRef] [PubMed] [Green Version]
- Mehta, N.; Sarkar, M.; Dodge, J.L.; Fidelman, N.; Roberts, J.P.; Yao, F.Y. Intention to treat outcome of T1 hepatocellular carcinoma with the “wait and not ablate” approach until meeting T2 criteria for liver transplant listing. Liver Transplant. 2016, 22, 178–187. [Google Scholar] [CrossRef]
- An, C.; Choi, Y.A.; Choi, D.; Paik, Y.H.; Ahn, S.H.; Kim, D.Y.; Paik, S.W.; Han, K.-H.; Park, M.-S. Growth rate of early-stage hepatocellular carcinoma in patients with chronic liver disease. Clin. Mol. Hepatol. 2015, 21, 279–286. [Google Scholar] [CrossRef] [Green Version]
- Kierans, A.S.; Leonardou, P.; Hayashi, P.; Brubaker, L.M.; Elazzazi, M.; Shaikh, F.; Semelka, R.C. MRI findings of rapidly progressive hepatocellular carcinoma. Magn. Reson. Imaging 2010, 28, 790–796. [Google Scholar] [CrossRef]
- Ruzzenente, A.; De Manzoni, G.; Molfetta, M.; Pachera, S.; Genco, B.; Donataccio, M.; Guglielmi, A. Rapid progression of hepatocellular carcinoma after Radiofrequency Ablation. World J. Gastroenterol. 2004, 10, 1137–1140. [Google Scholar] [CrossRef]
- Lubner, M.G.; Smith, A.D.; Sandrasegaran, K.; Sahani, D.V.; Pickhardt, P.J. CT Texture Analysis: Definitions, Applications, Biologic Correlates, and Challenges. Radiographics 2017, 37, 1483–1503. [Google Scholar] [CrossRef]
- Mulé, S.; Thiefin, G.; Costentin, C.; Durot, C.; Rahmouni, A.; Luciani, A.; Hoeffel, C. Advanced Hepatocellular Carcinoma: Pretreatment Contrast-enhanced CT Texture Parameters as Predictive Biomarkers of Survival in Patients Treated with Sorafenib. Radiology 2018, 288, 445–455. [Google Scholar] [CrossRef] [Green Version]
- Miles, K.A.; Ganeshan, B.; Hayball, M.P. CT texture analysis using the filtration-histogram method: What do the measurements mean? Cancer Imaging 2013, 13, 400–406. [Google Scholar] [CrossRef] [PubMed] [Green Version]
- Lubner, M.G.; Jones, D.; Kloke, J.; Said, A.; Pickhardt, P.J. CT texture analysis of the liver for assessing hepatic fibrosis in patients with hepatitis C virus. Br. J. Radiol. 2018, 92, 20180153. [Google Scholar] [CrossRef] [PubMed]
- Lee, S.J.; Zea, R.; Kim, D.H.; Lubner, M.G.; A Deming, D.; Pickhardt, P.J. CT texture features of liver parenchyma for predicting development of metastatic disease and overall survival in patients with colorectal cancer. Eur. Radiol. 2017, 28, 1520–1528. [Google Scholar] [CrossRef] [PubMed]
- Oh, J.; Lee, J.M.; Park, J.; Joo, I.; Yoon, J.H.; Lee, D.H.; Ganeshan, B.; Han, J.K. Hepatocellular Carcinoma: Texture Analysis of Preoperative Computed Tomography Images Can Provide Markers of Tumor Grade and Disease-Free Survival. Korean J. Radiol. 2019, 20, 569–579. [Google Scholar] [CrossRef] [PubMed] [Green Version]
- Jarnagin, W.; Chapman, W.C.; Curley, S.; D’Angelica, M.; Rosen, C.; Dixon, E.; Nagorney, D.M. Surgical treatment of hepatocellular carcinoma: Expert consensus statement. HPB 2010, 12, 302–310. [Google Scholar] [CrossRef] [Green Version]
- Lee, J.H.; Lee, J.M.; Kim, S.J.; Baek, J.H.; Yun, S.H.; Kim, K.W.; Han, J.K.; I Choi, B. Enhancement patterns of hepatocellular carcinomas on multiphasic multidetector row CT: Comparison with pathological differentiation. Br. J. Radiol. 2012, 85, e573–e583. [Google Scholar] [CrossRef] [Green Version]
- Huang, K.; Dong, Z.; Cai, H.; Huang, M.; Peng, Z.-P.; Xu, L.; Jia, Y.; Song, C.; Li, Z.-P.; Feng, S.-T. Imaging biomarkers for well and moderate hepatocellular carcinoma: Preoperative magnetic resonance image and histopathological correlation. BMC Cancer 2019, 19, 364. [Google Scholar] [CrossRef] [Green Version]
- El Jabbour, T.; Lagana, S.M.; Lee, H. Update on hepatocellular carcinoma: Pathologists’ review. World J. Gastroenterol. 2019, 25, 1653–1665. [Google Scholar] [CrossRef]
- Sugimoto, K.; Kim, S.R.; Imoto, S.; Tohyama, M.; Kim, S.K.; Matsuoka, T.; Yano, Y.; Kudo, M.; Hayashi, Y. Characteristics of Hypovascular versus Hypervascular Well-Differentiated Hepatocellular Carcinoma Smaller Than 2 cm—Focus on Tumor Size, Markers and Imaging Detectability. Dig. Dis. 2015, 33, 721–727. [Google Scholar] [CrossRef]
- Ishigami, K.; Yoshimitsu, K.; Nishihara, Y.; Irie, H.; Asayama, Y.; Tajima, T.; Nishie, A.; Hirakawa, M.; Ushijima, Y.; Okamoto, D.; et al. Hepatocellular Carcinoma with a Pseudocapsule on Gadolinium-enhanced MR Images: Correlation with Histopathologic Findings. Radiology 2009, 250, 435–443. [Google Scholar] [CrossRef] [Green Version]
- Defour, L.B.; Mulé, S.; Tenenhaus, A.; Piardi, T.; Sommacale, D.; Hoeffel, C.; Thiefin, G. Hepatocellular carcinoma: CT texture analysis as a predictor of survival after surgical resection. Eur. Radiol. 2018, 29, 1231–1239. [Google Scholar] [CrossRef] [PubMed]
- Kiryu, S.; Akai, H.; Nojima, M.; Hasegawa, K.; Shinkawa, H.; Kokudo, N.; Yasaka, K.; Ohtomo, K. Impact of hepatocellular carcinoma heterogeneity on computed tomography as a prognostic indicator. Sci. Rep. 2017, 7, 1–8. [Google Scholar] [CrossRef] [PubMed]
- Kim, J.; Choi, S.J.; Lee, S.-H.; Lee, H.Y.; Park, H. Predicting Survival Using Pretreatment CT for Patients with Hepatocellular Carcinoma Treated With Transarterial Chemoembolization: Comparison of Models Using Radiomics. Am. J. Roentgenol. 2018, 211, 1026–1034. [Google Scholar] [CrossRef] [PubMed]
- Zhang, J.; Liu, X.; Zhang, H.; He, X.; Liu, Y.; Zhou, J.; Guo, D. Texture Analysis Based on Preoperative Magnetic Resonance Imaging (MRI) and Conventional MRI Features for Predicting the Early Recurrence of Single Hepatocellular Carcinoma after Hepatectomy. Acad. Radiol. 2019, 26, 1164–1173. [Google Scholar] [CrossRef] [PubMed]
- Stocker, D.; Marquez, H.P.; Wagner, M.W.; Raptis, D.A.; Clavien, P.-A.; Boss, A.; Fischer, M.A.; Wurnig, M.C. MRI texture analysis for differentiation of malignant and benign hepatocellular tumors in the non-cirrhotic liver. Heliyon 2018, 4, e00987. [Google Scholar] [CrossRef] [Green Version]
- Choi, S.H.; Lee, S.S.; Park, S.H.; Kim, K.M.; Yu, E.; Park, Y.; Shin, Y.M.; Lee, M.-G. LI-RADS Classification and Prognosis of Primary Liver Cancers at Gadoxetic Acid-enhanced MRI. Radiology 2018, 290, 388–397. [Google Scholar] [CrossRef]


| RPHCC (n = 24) | Control (n = 21) | All (n = 45) | |
|---|---|---|---|
| Demographics | |||
| Age (range) | 64 | 69.48 | 66.56 |
| %Male | 75.00% | 76.19% | 75.56% |
| Caucasian | 37.50% | 47.62% | 42.22% |
| African American | 25.00% | 14.29% | 20.00% |
| Other | 37.50% | 38.10% | 37.78% |
| Comorbidities | |||
| Hep B | 4.17% | 9.52% | 6.67% |
| Hep C | 50.00% | 52.38% | 51.11% |
| Cirrhosis | 66.67% | 76.19% | 71.11% |
| NASH | 16.67% | 9.52% | 13.33% |
| Diabetes | 54.17% | 42.86% | 48.89% |
| Chronic Kidney Disease | 8.33% | 9.52% | 8.89% |
| Child-Pugh Class | |||
| Class A | 54.17% | 47.62% | 51.11% |
| Class B | 41.67% | 52.38% | 46.67% |
| Class C | 4.17% | 0.00% | 2.22% |
| Mean MELD Score | 10.53 | 10.57 | 10.55 |
| Variable | CT-RPHCC (n = 11) | CT-Control (n = 11) | CT p-Value | MR-RPHCC (n = 13) | MR-Control (n = 10) | MR p-Value |
|---|---|---|---|---|---|---|
| Irregular Margins | 54.55% | 0% | 0.028 * | 23.07% | 0% | 0.539 |
| Necrotic Component | 54.55% | 5.45% | 0.797 | 22.69% | 9.0% | 0.314 |
| Internal Vascularity | 27.27% | 36.36% | 0.748 | 30.7% | 10.0% | 0.582 |
| Wash-Out | 81.81% | 100% | 0.478 | 100% | 90.0% | 0.722 |
| Pseudo-Capsule | 18.18% | 63.63% | 0.076 | 61.53% | 50.0% | 0.539 |
| Tumor Thrombus | 9.01% | 0% | 0.748 | 0% | 0% | 1.000 |
| Baseline Lesion Size | 3.37 cm | 3.58 cm | 0.193 | 2.45 cm | 2.66 cm | 0.722 |
| AFP > 10 | 42.85% | 60.0% | 0.755 | 62.5% | 57.14% | 0.867 |
| Variable | CT | CT | CT | CT | CT | CT | MR | MR | MR | MR | MR | MR |
|---|---|---|---|---|---|---|---|---|---|---|---|---|
| SSF-0 | SSF-2 | SSF-3 | SSF-4 | SSF-5 | SSF-6 | SSF-0 | SSF-2 | SSF-3 | SSF-4 | SSF-5 | SSF-6 | |
| Mean | 0.171 | 0.056 | 0.028 * | 0.040 * | 0.023 * | 0.023 * | 0.346 | 0.821 | 0.923 | 0.974 | 0.974 | 0.974 |
| SD | 0.606 | 0.478 | 0.217 | 0.151 | 0.133 | 0.056 | 0.628 | 0.722 | 0.821 | 0.771 | 0.771 | 0.974 |
| Entropy | 0.606 | 0.562 | 0.27 | 0.193 | 0.116 | 0.076 | 0.974 | 1 | 0.872 | 0.772 | 0.674 | 0.582 |
| MPP | 0.133 | 0.562 | 0.133 | 0.076 | 0.040 * | 0.023 * | 0.346 | 0.821 | 0.771 | 0.923 | 1 | 0.974 |
| Skewness | 0.193 | 0.652 | 0.562 | 0.898 | 0.898 | 0.847 | 0.08 | 0.456 | 0.497 | 0.582 | 0.346 | 0.346 |
| Kurtosis | 0.652 | 0.606 | 0.3 | 0.401 | 0.332 | 0.478 | 0.159 | 0.418 | 0.203 | 0.228 | 0.283 | 0.381 |
| Total | 0.748 | 0.748 | 0.748 | 0.748 | 0.748 | 0.748 | 0.381 | 0.381 | 0.381 | 0.381 | 0.381 | 0.381 |
| Criteria | Sensitivity | Specificity | AUC | p-Value |
|---|---|---|---|---|
| Mean_SSF6 < 16.57 | 90.1% | 63.6% | 0.785 | 0.023 |
| MPP_SSF6 < 33.73 | 81.8% | 63.6% | 0.785 | 0.023 |
| SD_SSF6 < 42.40 | 81.8% | 63.6% | 0.744 | 0.053 |
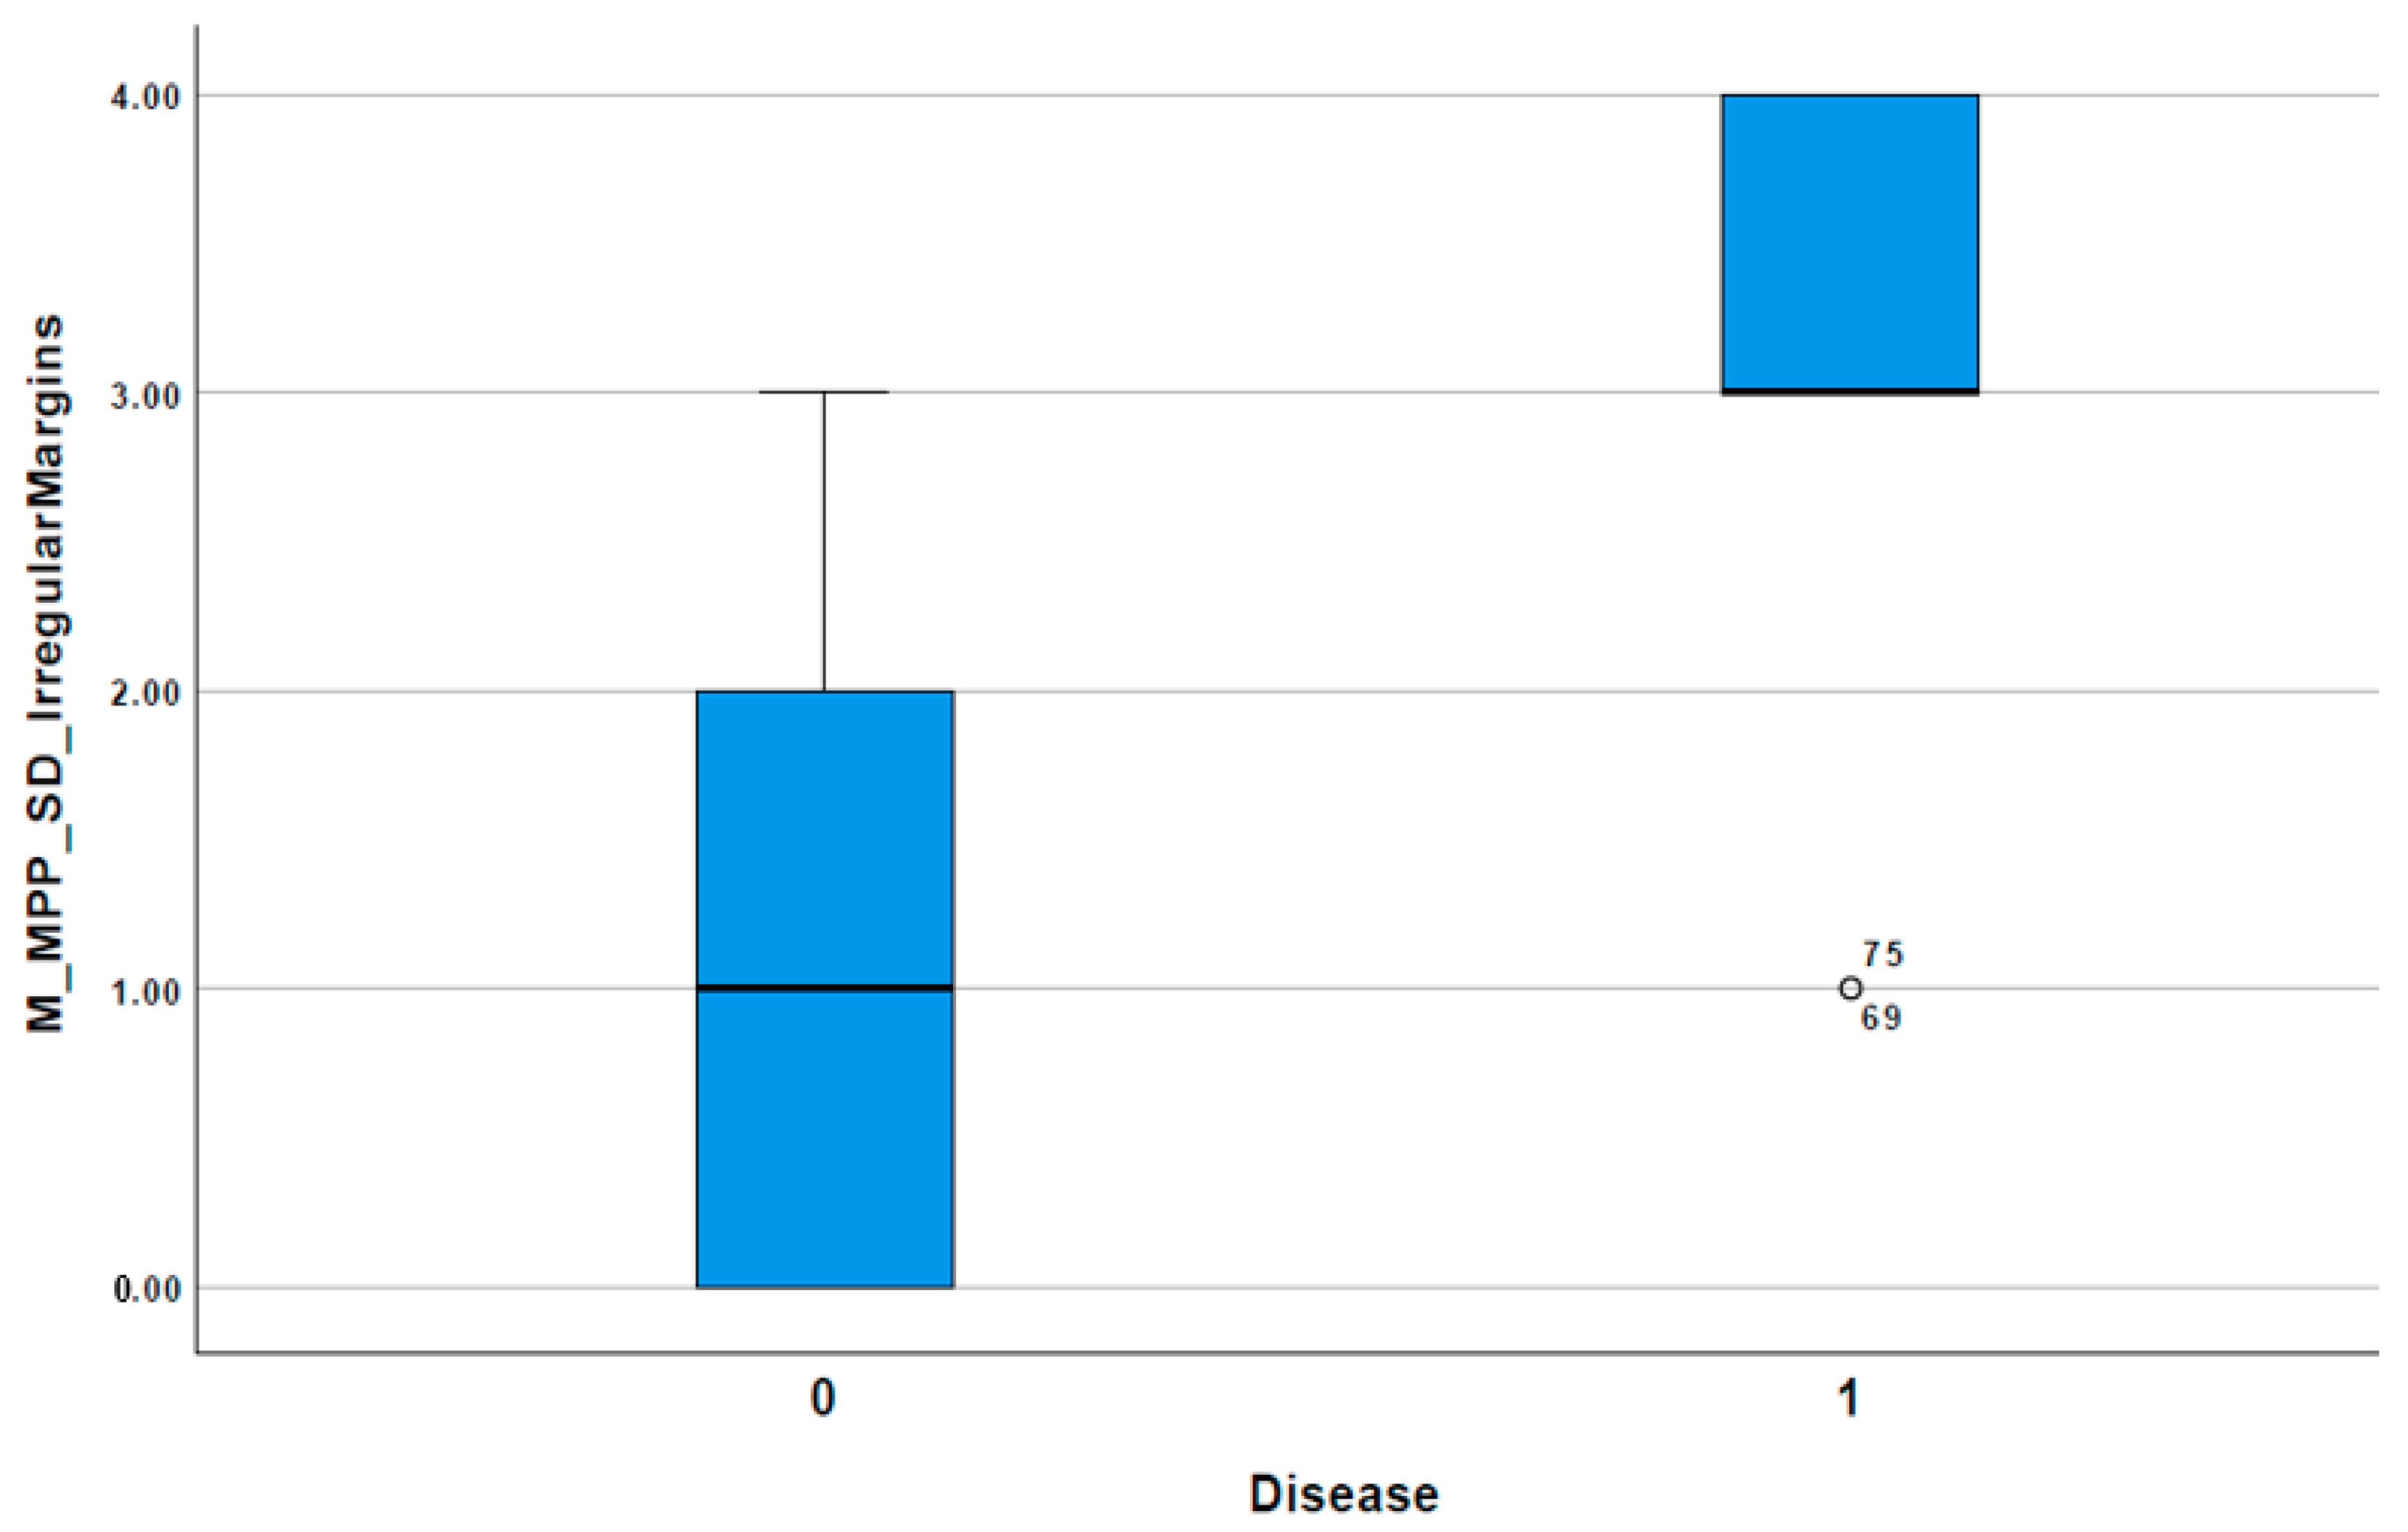
| Irregular Margins | 54.5% | 100% | 0.773 | 0.030 |
| Binary Diagnostic Composite Score ≥ 3 | 81.8% | 81.8% | 0.884 | 0.002 |
© 2020 by the authors. Licensee MDPI, Basel, Switzerland. This article is an open access article distributed under the terms and conditions of the Creative Commons Attribution (CC BY) license (http://creativecommons.org/licenses/by/4.0/).
Share and Cite
Kim, C.; Cigarroa, N.; Surabhi, V.; Ganeshan, B.; Pillai, A.K. Retrospective CT/MRI Texture Analysis of Rapidly Progressive Hepatocellular Carcinoma. J. Pers. Med. 2020, 10, 136. https://doi.org/10.3390/jpm10030136
Kim C, Cigarroa N, Surabhi V, Ganeshan B, Pillai AK. Retrospective CT/MRI Texture Analysis of Rapidly Progressive Hepatocellular Carcinoma. Journal of Personalized Medicine. 2020; 10(3):136. https://doi.org/10.3390/jpm10030136
Chicago/Turabian StyleKim, Charissa, Natasha Cigarroa, Venkateswar Surabhi, Balaji Ganeshan, and Anil K. Pillai. 2020. "Retrospective CT/MRI Texture Analysis of Rapidly Progressive Hepatocellular Carcinoma" Journal of Personalized Medicine 10, no. 3: 136. https://doi.org/10.3390/jpm10030136