Radiomic Analysis of MRI Images is Instrumental to the Stratification of Ovarian Cysts


 , , , and
Abstract
:
1. Introduction
2. Materials and Methods
2.1. Patients
2.2. Reference Standard
2.3. Imaging Protocol
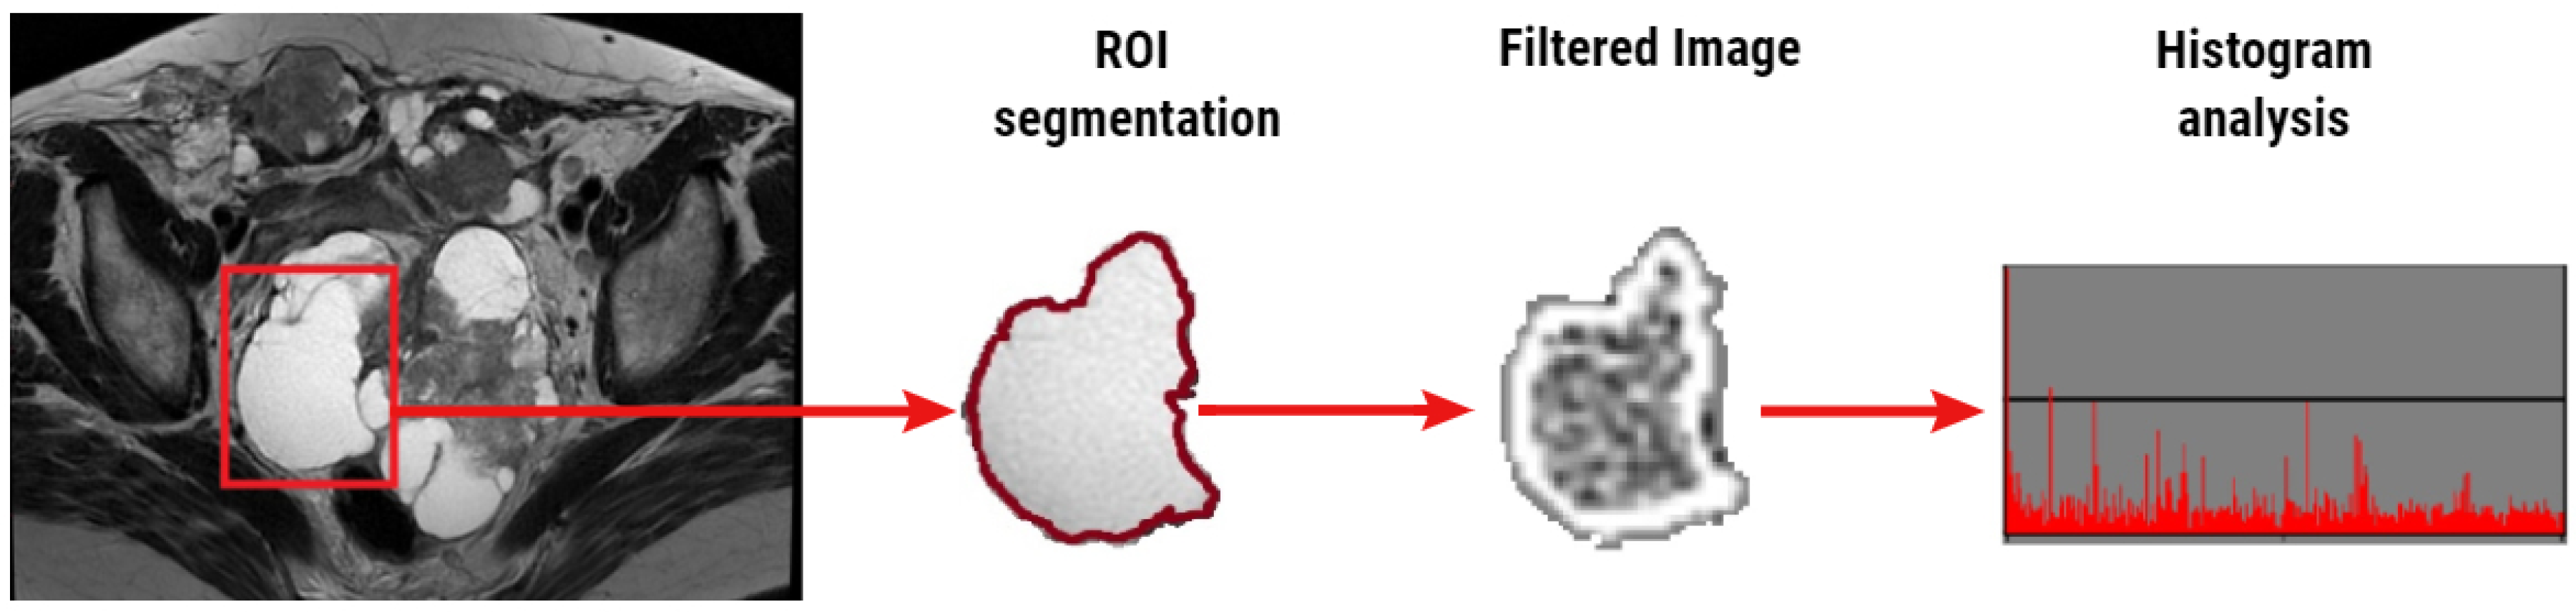
2.4. Texture Analysis
2.5. Statistical Analysis
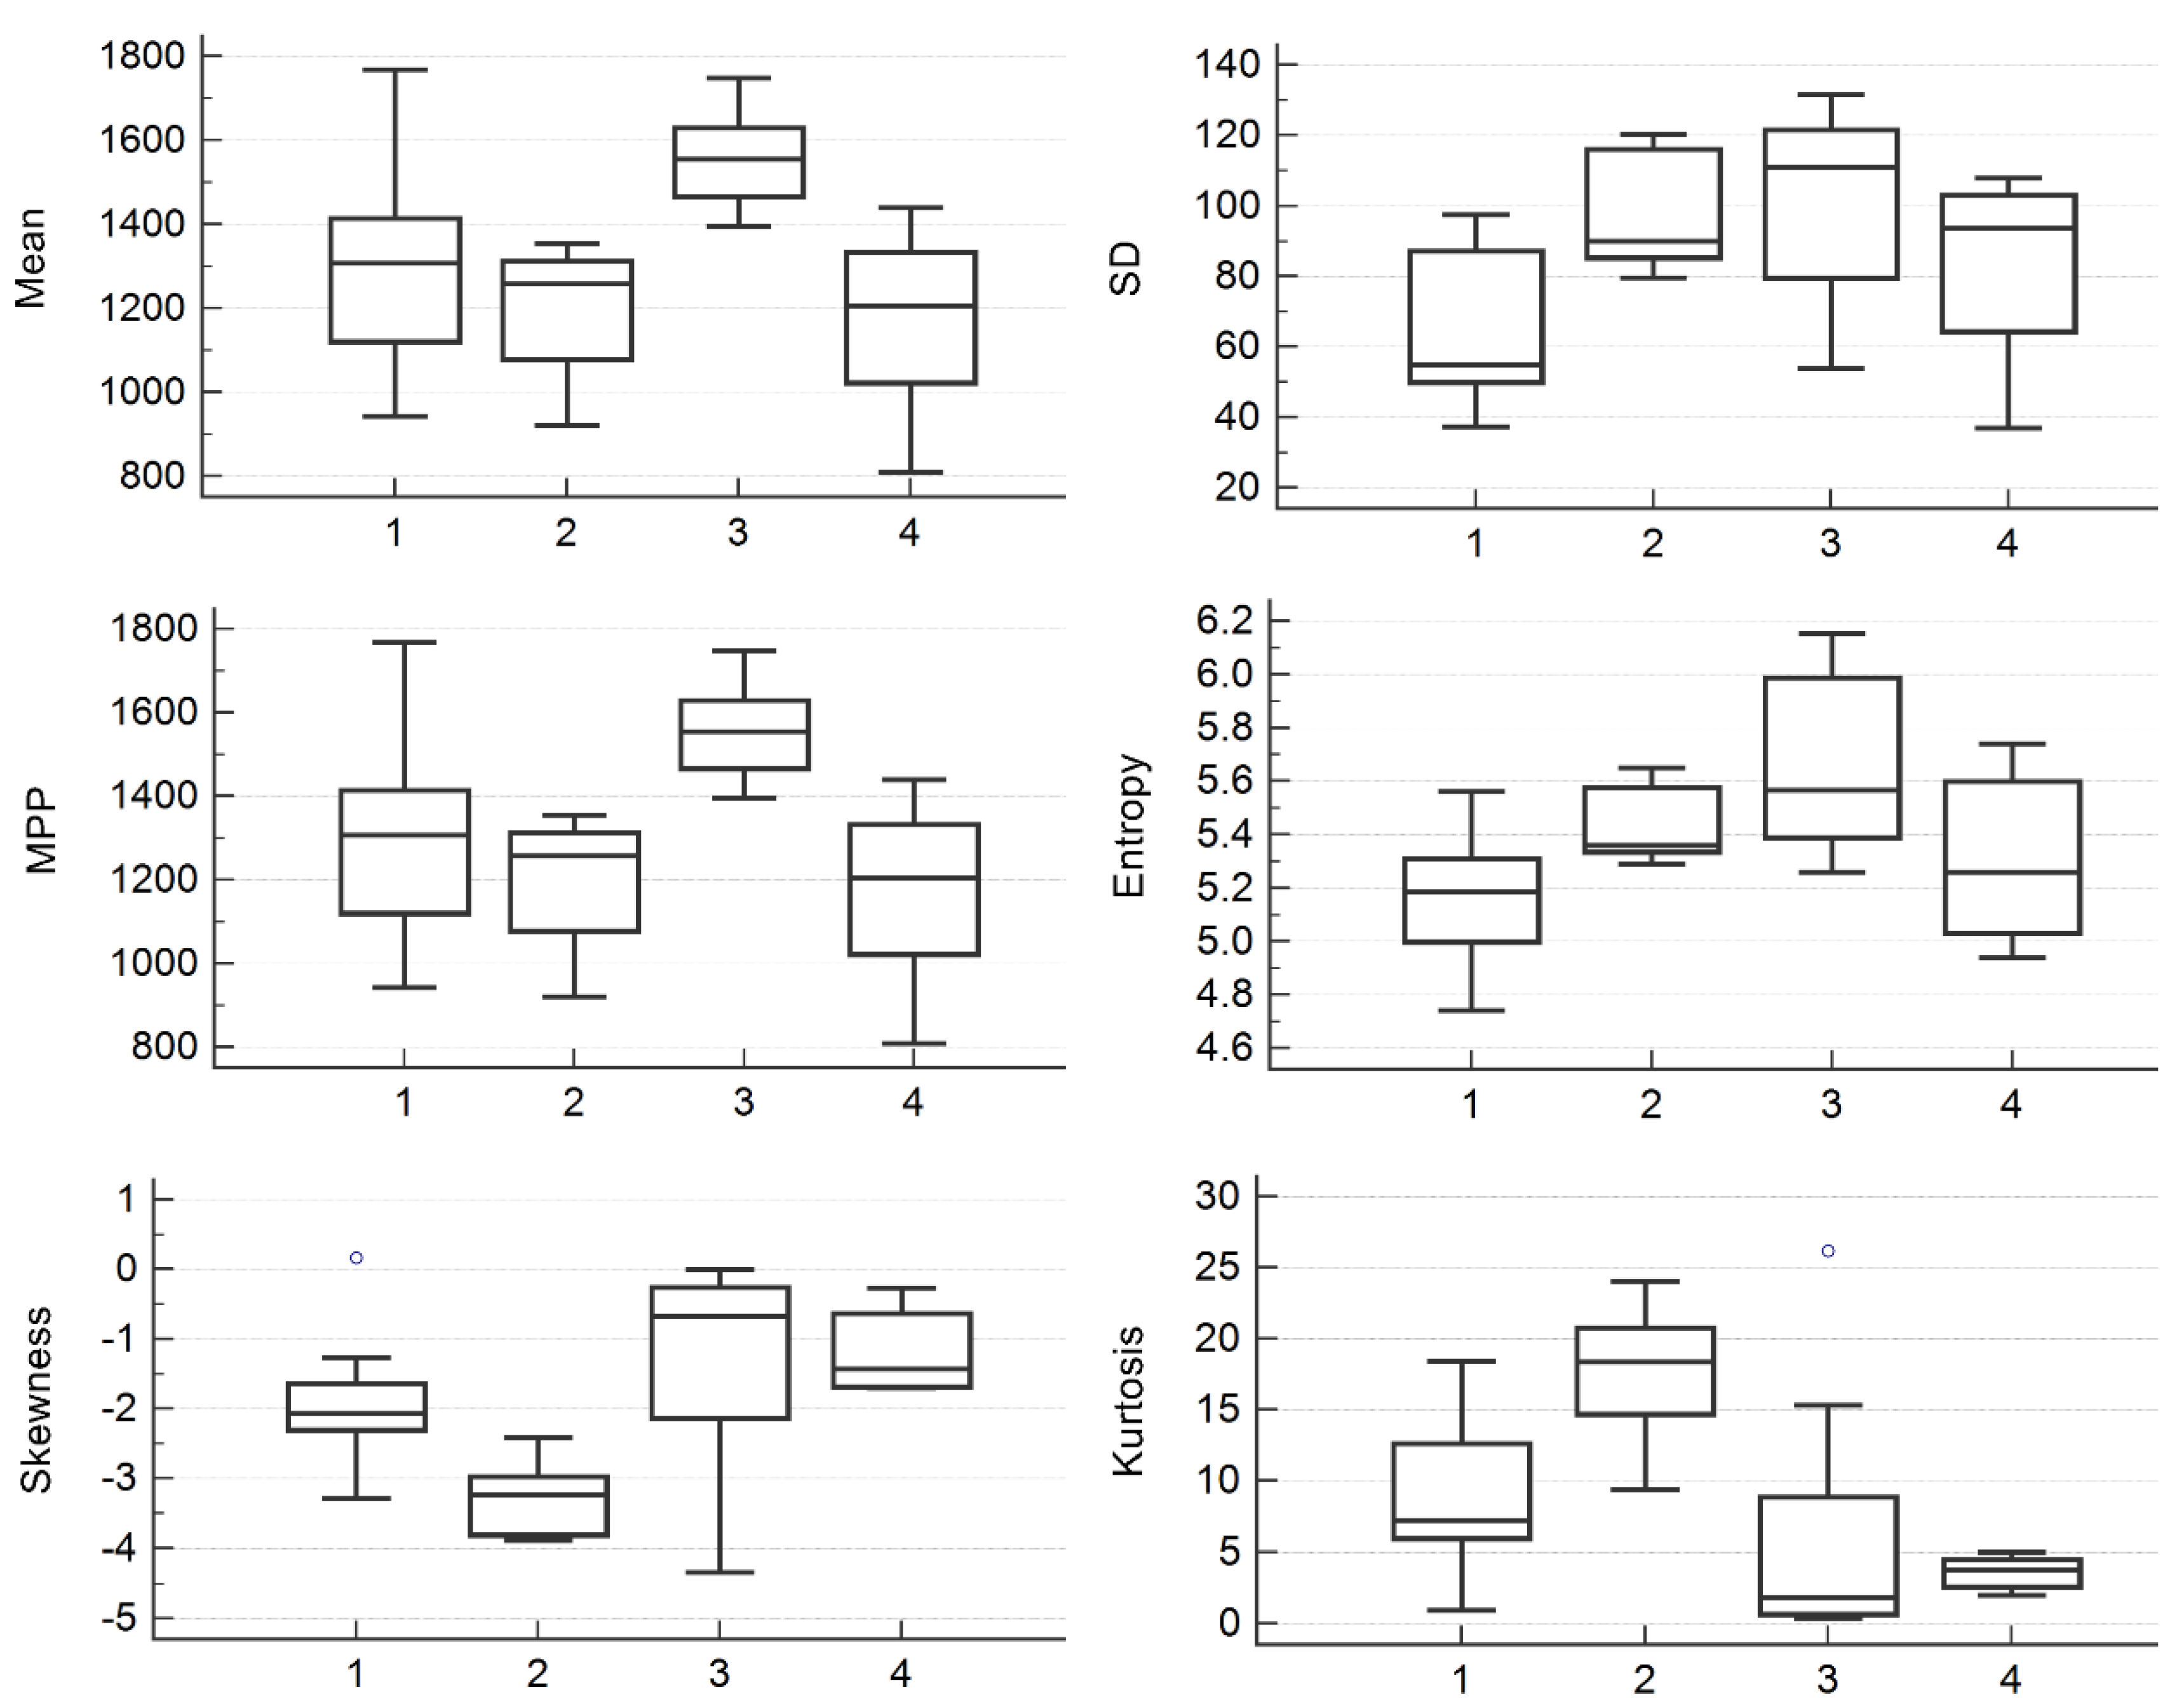
3. Results
4. Discussion
4.1. Study Outcomes
4.2. Limitations of the Current Imaging and Cytological Diagnosis of Ovarian Malignancies
4.3. Future Perspectives
4.4. Socioeconomical Aspects
4.5. Study Limitations
5. Conclusions
Author Contributions
Funding
Conflicts of Interest
References
- Zahra, F. Pattern of benign ovarian cysts in Qatari women. Qatar Med. J. 2016, 2016, 17. [Google Scholar] [CrossRef] [PubMed] [Green Version]
- Abduljabbar, H.S.; Bukhari, Y.A.; Al Hachim, E.G.A.; Ashour, G.S.; Amer, A.A.; Shaikhoon, M.M.; Khojah, M.I. Review of 244 cases of ovarian cysts. Saudi Med. J. 2015, 36, 834–838. [Google Scholar] [CrossRef] [PubMed]
- Foti, P.; Attinà, G.; Spadola, S.; Caltabiano, R.; Farina, R.; Palmucci, S.; Zarbo, G.; Zarbo, R.; D’Arrigo, M.; Milone, P.; et al. MR imaging of ovarian masses: Classification and differential diagnosis. Insights Imaging 2015, 7, 21–41. [Google Scholar] [CrossRef] [PubMed] [Green Version]
- Van Nagell, J.R.; Miller, R.W. Evaluation and management of ultrasonographically detected ovarian tumors in asymptomatic women. Obstet. Gynecol. 2016, 127, 848–858. [Google Scholar] [CrossRef] [PubMed]
- Forstner, R.; Thomassin-Naggara, I.; Cunha, T.M.; Kinkel, K.; Masselli, G.; Kubik-Huch, R.; Spencer, J.A.; Rockall, A. ESUR recommendations for MR imaging of the sonographically indeterminate adnexal mass: An update. Eur. Radiol. 2016, 27, 2248–2257. [Google Scholar] [CrossRef] [PubMed] [Green Version]
- Chilla, B.; Hauser, N.; Singer, G.; Trippel, M.; Froehlich, J.M.; Kubik-Huch, R. Indeterminate adnexal masses at ultrasound: Effect of MRI imaging findings on diagnostic thinking and therapeutic decisions. Eur. Radiol. 2010, 21, 1301–1310. [Google Scholar] [CrossRef]
- Fujii, S.; Kakite, S.; Nishihara, K.; Kanasaki, Y.; Harada, T.; Kigawa, J.; Kaminou, T.; Ogawa, T. Diagnostic accuracy of diffusion-weighted imaging in differentiating benign from malignant ovarian lesions. J. Magn. Reson. Imaging 2008, 28, 1149–1156. [Google Scholar] [CrossRef]
- Thomassin-Naggara, I.; Balvay, D.; Aubert, E.; Daraï, E.; Rouzier, R.; Cuenod, C.A.; Bazot, M. Quantitative dynamic contrast-enhanced MR imaging analysis of complex adnexal masses: A preliminary study. Eur. Radiol. 2011, 22, 738–745. [Google Scholar] [CrossRef]
- Russel, P. Surface epithelial—Stromal tumors of the OVARY. In Blaustein’s Pathology of the Female Genital Tract, 4th ed.; Kurman, R.J., Ed.; Springer-Verlag: New York, NY, USA, 1994; pp. 705–782. [Google Scholar]
- Wood, D.; Fitzpatrick, T.; Bibbo, M. Peritoneal washings and ovary. In Comprehensive Cytopathology E-Book; Wilbur, D., Ed.; Elsevier Health Sciences: Amsterdam, The Netherlands, 2014; pp. 291–301. [Google Scholar]
- Corwin, M.T.; Gerscovich, E.O.; Lamba, R.; Wilson, M.D.; McGahan, J.P. Differentiation of ovarian endometriomas from hemorrhagic cysts at MR imaging: Utility of the T2 dark spot sign. Radiology 2014, 271, 126–132. [Google Scholar] [CrossRef]
- Jung, S.I.; Park, H.S.; Kim, Y.J.; Jeon, H.J. Multidetector computed tomography for the assessment of adnexal mass: Is unenhanced CT scan necessary? Korean J. Radiol. 2014, 15, 72–79. [Google Scholar] [CrossRef]
- Castellano, G.; Bonilha, L.; Li, L.M.; Cendes, F. Texture analysis of medical images. Clin. Radiol. 2004, 59, 1061–1069. [Google Scholar] [CrossRef] [PubMed]
- Materka, A. Texture analysis methodologies for magnetic resonance imaging. Dialog Clin. Neurosci. 2004, 6, 243–250. [Google Scholar]
- Lu, M.; Zhan, X. The crucial role of multiomic approach in cancer research and clinically relevant outcomes. EPMA J. 2018, 9, 77–102. [Google Scholar] [CrossRef] [PubMed] [Green Version]
- Benign, Proliferative Noninvasive (Borderline), and Invasive Epithelial Tumors of the Ovary|GLOWM n.d. Available online: https://www.glowm.com/section_view/heading/benign-proliferative-noninvasive-borderline-and-invasive-epithelial-tumors-of-the-ovary/item/248 (accessed on 27 June 2020).
- Mulvany, N.J. Aspiration cytology of ovarian cysts and cystic neoplasms. A study of 235 aspirates. Acta Cytol. 1996, 40, 911–920. [Google Scholar] [CrossRef]
- Win, T.T.; Mahmood, N.M.Z.N.; Ma, S.O.; Ismail, M. Bilateral ovarian clear cell carcinoma arising in 17 year longstanding history of bilateral ovarian endometriosis. Iranian J. Pathol. 2017, 11, 478–482. [Google Scholar]
- Zhou, A.G.; Levinson, K.L.; Rosenthal, D.L.; Vandenbussche, C.J. Performance of ovarian cyst fluid fine-needle aspiration cytology. Cancer Cytopathol. 2017, 126, 112–121. [Google Scholar] [CrossRef] [Green Version]
- Kristjansdottir, B.; LeVan, K.; Partheen, K.; Carlsohn, E.; Sundfeldt, K. Potential tumor biomarkers identified in ovarian cyst fluid by quantitative proteomic analysis, iTRAQ. Clin. Proteom. 2013, 10, 4. [Google Scholar] [CrossRef] [Green Version]
- Lubner, M.G.; Smith, A.D.; Sandrasegaran, K.; Sahani, D.V.; Pickhardt, P.J. CT Texture analysis: Definitions, applications, biologic correlates, and challenges. RadioGraphics 2017, 37, 1483–1503. [Google Scholar] [CrossRef]
- Kovacic, J.; Rainer, S.; Levicnik, A. Aspiration cytology of normal structures and non-neoplastic cysts of the ovary. In Blaustein’s Pathology of the Female Genital Tract, 4th ed.; Kurman, R.J., Ed.; Springer-Verlag: New York, NY, USA, 1994; pp. 716–740. [Google Scholar]
- Kim, H.-J.; Lee, S.-Y.; Shin, Y.R.; Park, C.S.; Kim, K. The value of diffusion-weighted imaging in the differential diagnosis of ovarian lesions: A meta-analysis. PLoS ONE 2016, 11, e0149465. [Google Scholar] [CrossRef] [Green Version]
- Bazot, M.; Darai, E.; Nassar-Slaba, J.; Lafont, C.; Thomassin-Naggara, I. Value of magnetic resonance imaging for the diagnosis of ovarian tumors: A review. J. Comput. Assist. Tomogr. 2008, 32, 712–723. [Google Scholar] [CrossRef]
- Prasad, R.A.; Anand, R.; Easo, A.S.; Francis, R. Role of MRI in differentiating benign versus malignant ovarian lesions. Int. J. Contemp. Med. Res. 2018, 5. [Google Scholar] [CrossRef]
- Adusumilli, S.; Hussain, H.K.; Caoili, E.M.; Weadock, W.J.; Murray, J.P.; Johnson, T.D.; Chen, Q.; Desjardins, B. MRI of sonographically indeterminate adnexal masses. Am. J. Roentgenol. 2006, 187, 732–740. [Google Scholar] [CrossRef] [PubMed]
- Potter, A.W.; Chandrasekhar, C.A. US and CT evaluation of acute pelvic pain of gynecologic origin in nonpregnant premenopausal patients. RadioGraphics 2008, 28, 1645–1659. [Google Scholar] [CrossRef]
- Khaw, K.; Walker, W. Ultrasound guided fine needle aspiration of ovarian cysts: Diagnosis and treatment in pregnant and non-pregnant women. Clin. Radiol. 1990, 41, 105–108. [Google Scholar] [CrossRef]
- Kane, M.G.; Krejs, G.J. Complications of diagnostic laparoscopy in Dallas: A 7-year prospective study. Gastrointest. Endosc. 1984, 30, 237–240. [Google Scholar] [CrossRef]
- De Crespigny, L. A comparison of ovarian cyst aspirate cystology and histology. The case against aspiration of cystic pelvic masses. Aust. N. Z. J. Obstet. Gynaecol. 1995, 35, 233–235. [Google Scholar]
- Diernaes, E.; Rasmussen, J.; Soerensen, T.; Hasch, E. Ovarian cysts: Management by puncture? Lancet 1987, 329, 1084. [Google Scholar] [CrossRef]
- Moran, O.; Menczer, J.; Ben-Baruch, G.; Lipitz, S.; Goor, E. Cytologic examination of ovarian cyst fluid for the distinction between benign and malignant tumors. Obstet. Gynecol. 1993, 82, 444–446. [Google Scholar]
- Papathanasiou, K.; Giannoulis, C.; Dovas, D.; Tolikas, A.; Tantanasis, T.; Tzafettas, J.M. Fine needle aspiration cytology of the ovary: Is it reliable? Clin. Exp. Obstet. Gynecol. 2004, 31, 191–193. [Google Scholar]
- Li, N.; Zhan, X. Identification of clinical trait-related lncRNA and mRNA biomarkers with weighted gene co-expression network analysis as useful tool for personalized medicine in ovarian cancer. EPMA J. 2019, 10, 273–290. [Google Scholar] [CrossRef] [Green Version]
- Diehn, M.; Nardini, C.; Wang, D.S.; McGovern, S.; Jayaraman, M.V.; Liang, Y.; Aldape, K.; Cha, S.; Kuo, M.D. Identification of noninvasive imaging surrogates for brain tumor gene-expression modules. Proc. Natl. Acad. Sci. USA 2008, 105, 5213–5218. [Google Scholar] [CrossRef] [Green Version]
- Cook, G.; Yip, C.; Siddique, M.; Goh, V.; Chicklore, S.; Roy, A.; Marsden, P.; Ahmad, S.; Landau, D. Are pretreatment 18F-FDG PET tumor textural features in non-small cell lung cancer associated with response and survival after chemoradiotherapy? J. Nucl. Med. 2013, 54, 19–26. [Google Scholar] [CrossRef] [PubMed] [Green Version]
- Coroller, T.P.; Grossmann, P.; Hou, Y.; Velazquez, E.R.; Leijenaar, R.T.; Hermann, G.; Lambin, P.; Haibe-Kains, B.; Mak, R.H.; Aerts, H.J.W.L. CT-based radiomic signature predicts distant metastasis in lung adenocarcinoma. Radiother. Oncol. 2015, 114, 345–350. [Google Scholar] [CrossRef] [PubMed]
- Janssens, J.P.; Schuster, K.; Voss, A. Preventive, predictive, and personalized medicine for effective and affordable cancer care. EPMA J. 2018, 9, 113–123. [Google Scholar] [CrossRef] [PubMed]
- Schwartz, P.E. The role of tumor markers in the preoperative diagnosis of ovarian cysts. Clin. Obstet. Gynecol. 1993, 36, 384–394. [Google Scholar] [CrossRef] [PubMed]
- Zanetta, G.; Lissoni, A.; Torri, V.; Valle, C.D.; Trio, D.; Rangoni, G.; Mangioni, C. Role of puncture and aspiration in expectant management of simple ovarian cysts: A randomised study. BMJ 1996, 313, 1110–1113. [Google Scholar] [CrossRef] [PubMed] [Green Version]
- Nikolaou, M.; Adonakis, G.; Zyli, P.; Androutsopoulos, G.; Saltamavros, A.; Psachoulia, C.; Tsapanos, V.; Decavalas, G. Transvaginal ultrasound-guided aspiration of benign ovarian cysts. J. Obstet. Gynaecol. 2014, 34, 332–335. [Google Scholar] [CrossRef] [PubMed]
- Ng, F.; Kozarski, R.; Ganeshan, B.; Goh, V. Assessment of tumor heterogeneity by CT texture analysis: Can the largest cross-sectional area be used as an alternative to whole tumor analysis? Eur. J. Radiol. 2013, 82, 342–348. [Google Scholar] [CrossRef]
- Lewis, M.A.; Ganeshan, B.; Barnes, A.; Bisdas, S.; Jaunmuktane, Z.; Brandner, S.; Endozo, R.; Groves, A.; Thust, S. Filtration-histogram based magnetic resonance texture analysis (MRTA) for glioma IDH and 1p19q genotyping. Eur. J. Radiol. 2019, 113, 116–123. [Google Scholar] [CrossRef]
- Win, T.; Miles, K.; Janes, S.M.; Ganeshan, B.; Shastry, M.; Endozo, R.; Meagher, M.; Shortman, R.I.; Wan, S.; Kayani, I.; et al. Tumor heterogeneity and permeability as measured on the CT component of PET/CT predict survival in patients with non-small cell lung cancer. Clin. Cancer Res. 2013, 19, 3591–3599. [Google Scholar] [CrossRef] [Green Version]
- Dohan, A.; Gallix, B.; Guiu, B.; Le Malicot, K.; Reinhold, C.; Soyer, P.; Bennouna, J.; Ghiringhelli, F.; Barbier, E.; Boige, V.; et al. Early evaluation using a radiomic signature of unresectable hepatic metastases to predict outcome in patients with colorectal cancer treated with FOLFIRI and bevacizumab. Gut 2019, 69, 531–539. [Google Scholar] [CrossRef] [PubMed]
- Miles, K.; Ganeshan, B.; Griffiths, M.R.; Young, R.C.D.; Chatwin, C.R. Colorectal cancer: Texture analysis of portal phase hepatic CT images as a potential marker of survival. Radiology 2009, 250, 444–452. [Google Scholar] [CrossRef] [PubMed]
- Yasaka, K.; Akai, H.; Mackin, D.; Court, L.E.; Moros, E.G.; Ohtomo, K.; Kiryu, S. Precision of quantitative computed tomography texture analysis using image filtering. Medicine (Baltimore) 2017, 96, e6993. [Google Scholar] [CrossRef] [PubMed]
- Gourtsoyianni, S.; Doumou, G.; Prezzi, D.; Taylor, B.; Stirling, J.J.; Taylor, N.J.; Siddique, M.; Cook, G.; Glynne-Jones, R.; Goh, V. Primary rectal cancer: Repeatability of global and local-regional MR imaging texture features. Radiology 2017, 284, 552–561. [Google Scholar] [CrossRef] [PubMed] [Green Version]
- Cui, H.; Devlies, W.; Ravenscroft, S.; Heers, H.; Freidin, A.J.; Cleveland, R.O.; Ganeshan, B.; Turney, B.W. CT texture analysis of ex vivo renal stones predicts ease of fragmentation with shockwave lithotripsy. J. Endourol. 2017, 31, 694–700. [Google Scholar] [CrossRef] [Green Version]


| Type of Lesion | Number of Lesions | Pathological Confirmation | Pathological Findings | |
|---|---|---|---|---|
| Lesions/Total | Time (Days) | |||
| High-grade serous carcinoma | 5 | 5/5 | 64.4 ± 31.8 | serous fluid, 20% *; gelatinous content, 20%; brownish fluid, 40%; turbid liquid, 40%. |
| Clear cell carcinoma | 8 | 8/8 | 96.2 ± 21.5 | clear liquid, 75%; slightly hemorrhagic fluid, 25%. |
| Serous cystadenoma | 5 | 5/5 | 62.1 ± 34.3 | clear liquid, 60%; yellow turbid, 40%. |
| Functional cysts | 10 | 4/10 | 48.7 ± 18.5 | yellow fluid, 75%; serous fluid 25% |
| SSF | Texture Parameter | |||||
|---|---|---|---|---|---|---|
| Mean | SD | MPP | Entropy | Skewness | Kurtosis | |
| 0 | 0.01 | 0.027 | 0.01 | 0.02 | 0.027 | 0.009 |
| 2 | 0.025 | 0.082 | 0.053 | 0.683 | 0.375 | 0.017 |
| 4 | 0.016 | 0.119 | 0.018 | 0.455 | 0.034 | 0.088 |
| 6 | 0.019 | 0.507 | 0.021 | 0.433 | 0.028 | 0.341 |
| SSF | Texture Parameter | |||||
|---|---|---|---|---|---|---|
| Mean | SD | MPP | Entropy | Skewness | Kurtosis | |
| 0 | 0.13 | 0.088 | 0.13 | 0.072 | 0.017 | 0.002 |
| 2 | 0.235 | 0.201 | 0.201 | 0.683 | 0.892 | 0.751 |
| 4 | 0.217 | 0.033 | 0.201 | 0.525 | 0.786 | 0.786 |
| 6 | 0.387 | 0.294 | 0.363 | 0.65 | 0.44 | 0.44 |
| Texture Parameter | Benign Group | Malignant Group |
|---|---|---|
| SD (SSF = 4) | 446.05 (363.97–501.23) | 611.05 (476.09–664.54) |
| Skewness (SSF = 0) | −2.31 (−3.21 to −1.76) | −0.92 (−1.68 to −0.37) |
| Kurtosis (SSF = 0) | 9.41 (6.46–18.26) | 2.41 (1.43–4.46) |
| Parameter | Coefficient | Standard Error | p-Value | VIF |
|---|---|---|---|---|
| SD | 0.001 | <0.001 | 0.03 | 1.03 |
| Skewness | 0.202 | 0.194 | 0.3 | 8.89 |
| Kurtosis | 0.004 | 0.032 | 0.9 | 8.9 |
| Sign.lvl. | 0.016 | |||
| R2 | 0.342 | |||
| R2 adjusted | 0.26 | |||
| M.C. Coeff | 0.585 |
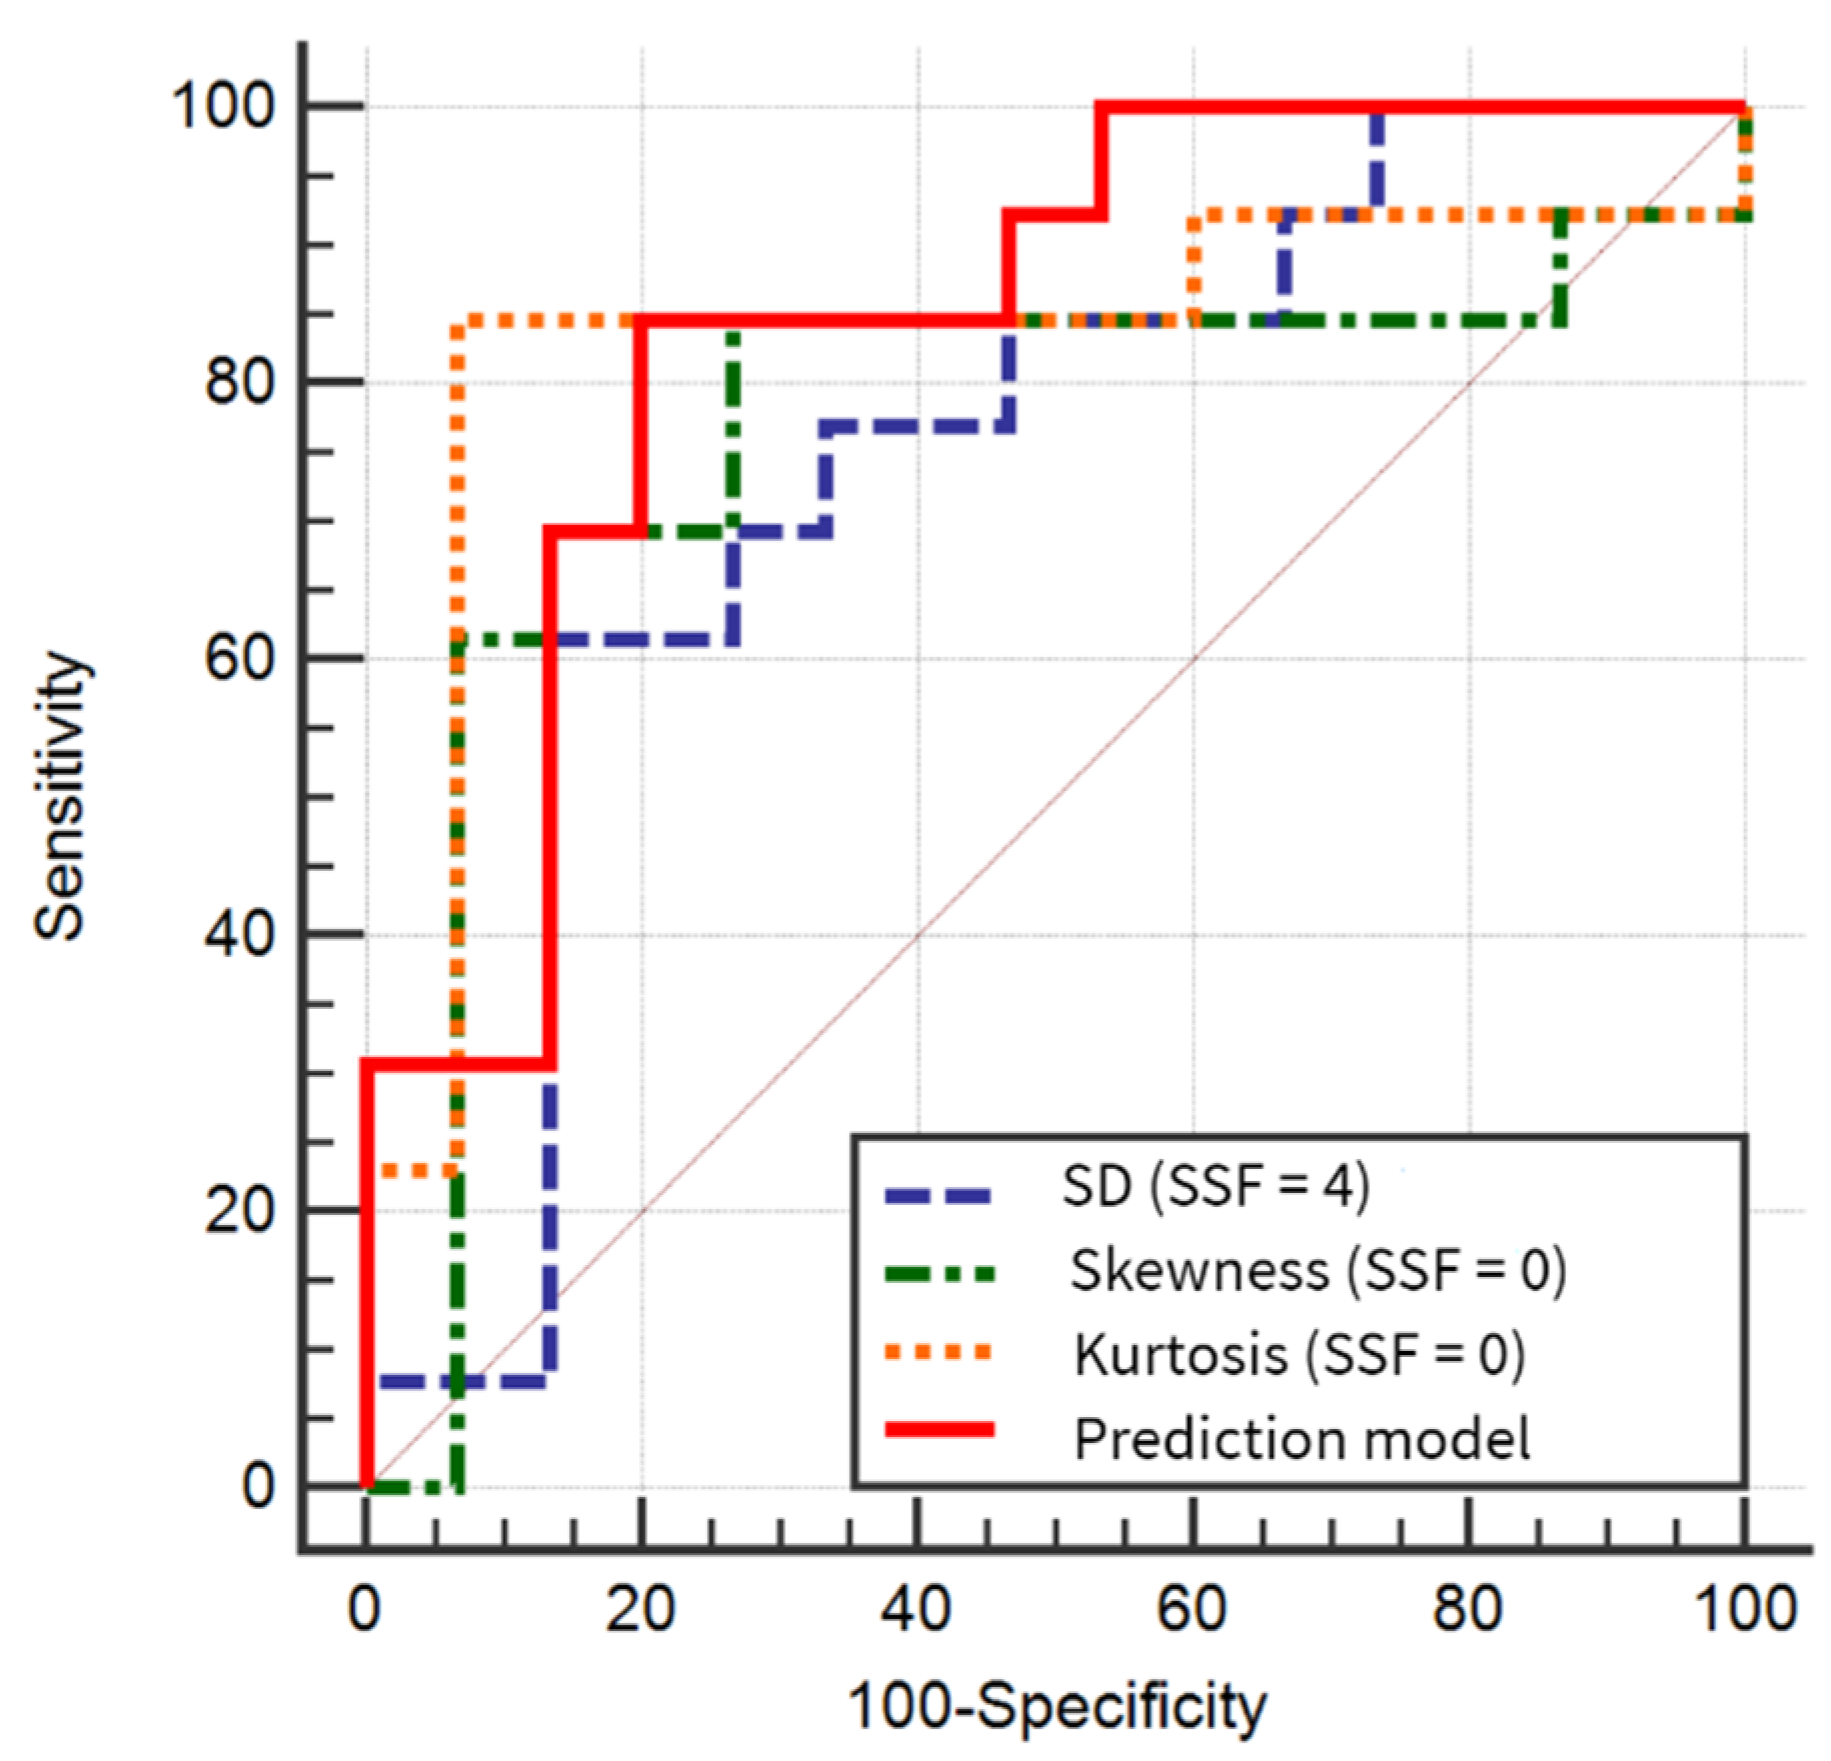
| Texture Parameter | AUC | Sign. Level | J | Cut-off Value | Sensitivity(%) | Specificity(%) | p-Value | p-Value | p-Value | p-Value |
|---|---|---|---|---|---|---|---|---|---|---|
| SD (SSF = 4) | 0.738 (0.539–0.885) | 0.0167 | 0.48 | >528.57 | 61.54 (31.6–86.1) | 86.67 (59.5–98.3) | REF | 0.87 | 0.5 | 0.29 |
| Skewness (SSF = 0) | 0.746 (0.567–0.903) | 0.013 | 0.57 | >(−2.07) | 84.62 (54.6–98.1) | 73.33 (44.9–92.2) | 0.87 | REF | 0.03 | 0.3 |
| Kurtosis (SSF = 0) | 0.836 (0.648–0.948) | 0.0003 | 0.77 | ≤5 | 84.62 (54.6–98.1) | 93.33 (68.1–99.8) | 0.5 | 0.03 | REF | 0.9 |
| Prediction model | 0.841 (0.654–0.951) | <0.0001 | 0.64 | >0.4186 | 84.62 (54.6–98.1) | 80 (51.9–95.7) | 0.29 | 0.3 | 0.9 | REF |
© 2020 by the authors. Licensee MDPI, Basel, Switzerland. This article is an open access article distributed under the terms and conditions of the Creative Commons Attribution (CC BY) license (http://creativecommons.org/licenses/by/4.0/).
Share and Cite
Lupean, R.-A.; Ștefan, P.-A.; Feier, D.S.; Csutak, C.; Ganeshan, B.; Lebovici, A.; Petresc, B.; Mihu, C.M. Radiomic Analysis of MRI Images is Instrumental to the Stratification of Ovarian Cysts. J. Pers. Med. 2020, 10, 127. https://doi.org/10.3390/jpm10030127
Lupean R-A, Ștefan P-A, Feier DS, Csutak C, Ganeshan B, Lebovici A, Petresc B, Mihu CM. Radiomic Analysis of MRI Images is Instrumental to the Stratification of Ovarian Cysts. Journal of Personalized Medicine. 2020; 10(3):127. https://doi.org/10.3390/jpm10030127
Chicago/Turabian StyleLupean, Roxana-Adelina, Paul-Andrei Ștefan, Diana Sorina Feier, Csaba Csutak, Balaji Ganeshan, Andrei Lebovici, Bianca Petresc, and Carmen Mihaela Mihu. 2020. "Radiomic Analysis of MRI Images is Instrumental to the Stratification of Ovarian Cysts" Journal of Personalized Medicine 10, no. 3: 127. https://doi.org/10.3390/jpm10030127