


Developing a Deep-Learning-Based Coronary Artery Disease Detection Technique Using Computer Tomography Images


Abstract
:1. Introduction
- An image enhancement technique to improve the quality of the CT images.
- An intelligent feature extraction approach for extracting key features.
- A hyperparameter-tuned CNN technique for identifying CAD.
2. Materials and Methods
2.1. Dataset Characteristics
2.2. Proposed Methodology
2.2.1. Feature Extraction
2.2.2. Fine-Tuned CNN Model
2.2.3. Performance Evaluation
3. Results
4. Discussion
5. Conclusions
Author Contributions
Funding
Institutional Review Board Statement
Informed Consent Statement
Data Availability Statement
Conflicts of Interest
References
- WHO. Available online: https://www.who.int/health-topics/cardiovascular-diseases#tab=tab_1 (accessed on 15 December 2022).
- Lin, A.; Kolossváry, M.; Motwani, M.; Išgum, I.; Maurovich-Horvat, P.; Slomka, P.J.; Dey, D. Artificial intelligence in cardiovascular imaging for risk stratification in coronary artery disease. Radiol. Cardiothorac. Imaging 2021, 3, e200512. [Google Scholar] [CrossRef] [PubMed]
- Han, D.; Liu, J.; Sun, Z.; Cui, Y.; He, Y.; Yang, Z. Deep learning analysis in coronary computed tomographic angiography imaging for the assessment of patients with coronary artery stenosis. Comput. Methods Programs Biomed. 2020, 196, 105651. [Google Scholar] [CrossRef] [PubMed]
- AlOthman, A.F.; Sait, A.R.W.; Alhussain, T.A. Detecting Coronary Artery Disease from Computed Tomography Images Using a Deep Learning Technique. Diagnostics 2022, 12, 2073. [Google Scholar] [CrossRef] [PubMed]
- Demirer, M.; Gupta, V.; Bigelow, M.; Erdal, B.; Prevedello, L.; White, R. Image dataset for a CNN algorithm development to detect coronary atherosclerosis in coronary CT angiography. Mendeley Data 2019. [Google Scholar] [CrossRef]
- Zeng, A.; Wu, C.; Huang, M.; Zhuang, J.; Bi, S.; Pan, D.; Ullah, N.; Khan, K.N.; Wang, T.; Shi, Y.; et al. ImageCAS: A Large-Scale Dataset and Benchmark for Coronary Artery Segmentation based on Computed Tomography Angiography Images. arXiv 2022, arXiv:2211.01607. [Google Scholar]
- Papandrianos, N.; Papageorgiou, E. Automatic Diagnosis of Coronary Artery Disease in SPECT Myocardial Perfusion Imaging Employing Deep Learning. Appl. Sci. 2021, 11, 6362. [Google Scholar] [CrossRef]
- Moon, J.H.; Cha, W.C.; Chung, M.J.; Lee, K.S.; Cho, B.H.; Choi, J.H. Automatic stenosis recognition from coronary angiography using convolutional neural networks. Comput. Methods Programs Biomed. 2021, 198, 105819. [Google Scholar] [CrossRef]
- Banerjee, R.; Ghose, A.; Mandana, K.M. A hybrid CNN-LSTM architecture for detection of coronary artery disease from ECG. In Proceedings of the International Joint Conference on Neural Networks (IJCNN), Glasgow, UK, 19–24 July 2020; pp. 1–8. [Google Scholar]
- Liu, C.Y.; Tang, C.X.; Zhang, X.L.; Chen, S.; Xie, Y.; Zhang, X.Y.; Qiao, H.Y.; Zhou, C.S.; Xu, P.P.; Lu, M.J.; et al. Deep learning powered coronary CT angiography for detecting obstructive coronary artery disease: The effect of reader experience, calcification and image quality. Eur. J. Radiol. 2021, 142, 109835. [Google Scholar] [CrossRef]
- Yi, Y.; Xu, C.; Xu, M.; Yan, J.; Li, Y.Y.; Wang, J.; Yang, S.J.; Guo, Y.B.; Wang, Y.; Li, Y.M.; et al. Diagnostic improvements of deep learning–based image reconstruction for assessing calcification-related obstructive coronary artery disease. Front. Cardiovasc. Med. 2021, 8, 758793. [Google Scholar] [CrossRef]
- Hampe, N.; Wolterink, J.M.; Van Velzen, S.G.; Leiner, T.; Išgum, I. Machine learning for assessment of coronary artery disease in cardiac CT: A survey. Front. Cardiovasc. Med. 2019, 6, 172. [Google Scholar] [CrossRef] [Green Version]
- Baskaran, L.; Ying, X.; Xu, Z.; Al’Aref, S.J.; Lee, B.C.; Lee, S.E.; Danad, I.; Park, H.B.; Bathina, R.; Baggiano, A.; et al. Machine learning insight into the role of imaging and clinical variables for the prediction of obstructive coronary artery disease and revascularization: An exploratory analysis of the CONSERVE study. PLoS ONE 2020, 15, e0233791. [Google Scholar] [CrossRef] [PubMed]
- Chen, M.; Wang, X.; Hao, G.; Cheng, X.; Ma, C.; Guo, N.; Hu, S.; Tao, Q.; Yao, F.; Hu, C. Diagnostic performance of deep learning-based vascular extraction and stenosis detection technique for coronary artery disease. Br. J. Radiol. 2020, 93, 20191028. [Google Scholar] [CrossRef] [PubMed]
- Li, Y.; Wu, Y.; He, J.; Jiang, W.; Wang, J.; Peng, Y.; Jia, Y.; Xiong, T.; Jia, K.; Yi, Z.; et al. Automatic coronary artery segmentation and diagnosis of stenosis by deep learning based on computed tomographic coronary angiography. Eur. Radiol. 2022, 32, 6037–6045. [Google Scholar] [CrossRef]
- Yang, W.; Chen, C.; Yang, Y.; Chen, L.; Yang, C.; Gong, L.; Wang, J.; Shi, F.; Wu, D.; Yan, F. Diagnostic performance of deep learning-based vessel extraction and stenosis detection on coronary computed tomography angiography for coronary artery disease: A multi-reader multi-case study. La Radiol. Med. 2023, 3, 307–315. [Google Scholar] [CrossRef]
- Nous, F.M.; Budde, R.P.; Lubbers, M.M.; Yamasaki, Y.; Kardys, I.; Bruning, T.A.; Akkerhuis, J.M.; Kofflard, M.J.; Kietselaer, B.; Galema, T.W.; et al. Impact of machine-learning CT-derived fractional flow reserve for the diagnosis and management of coronary artery disease in the randomized CRESCENT trials. Eur. Radiol. 2020, 30, 3692–3701. [Google Scholar] [CrossRef]
- Hurtik, P.; Molek, V.; Hula, J. Data preprocessing technique for neural networks based on image represented by a fuzzy function. IEEE Trans. Fuzzy Syst. 2019, 28, 1195–1204. [Google Scholar] [CrossRef]
- Candemir, S.; White, R.D.; Demirer, M.; Gupta, V.; Bigelow, M.T.; Prevedello, L.M.; Erdal, B.S. Automated coronary artery atherosclerosis detection and weakly supervised localization on coronary CT angiography with a deep 3-dimensional convolutional neural network. Comput. Med. Imaging Graph. 2020, 83, 101721. [Google Scholar] [CrossRef]
- Wang, C.Y.; Bochkovskiy, A.; Liao, H.Y.M. YOLOv7: Trainable bag-of-freebies sets new state-of-the-art for real-time object detectors. arXiv 2022, arXiv:2207.02696. [Google Scholar]
- Zhou, Z.; Siddiquee, M.M.R.; Tajbakhsh, N.; Liang, J. UNet++: Redesigning skip connections to exploit multiscale features in image segmentation. IEEE Trans. Med. Imaging 2019, 39, 1856–1867. [Google Scholar] [CrossRef] [Green Version]
- Abualigah, L.; Yousri, D.; Abd Elaziz, M.; Ewees, A.A.; Al-Qaness, M.A.; Gandomi, A.H. Aquila optimizer: A novel meta-heuristic optimization algorithm. Comput. Ind. Eng. 2021, 157, 107250. [Google Scholar] [CrossRef]
- Overmars, L.M.; van Es, B.; Groepenhoff, F.; De Groot, M.C.; Pasterkamp, G.; den Ruijter, H.M.; van Solinge, W.W.; Hoefer, I.E.; Haitjema, S. Preventing unnecessary imaging in patients suspect of coronary artery disease through machine learning of electronic health records. Eur. Heart J.-Digit. Health 2022, 3, 11–19. [Google Scholar] [CrossRef] [PubMed]
- Tian, F.; Gao, Y.; Fang, Z.; Gu, J. Automatic coronary artery segmentation algorithm based on deep learning and digital image processing. Appl. Intell. 2021, 51, 8881–8895. [Google Scholar] [CrossRef]
- Kawasaki, T.; Kidoh, M.; Kido, T.; Sueta, D.; Fujimoto, S.; Kumamaru, K.K.; Uetani, T.; Tanabe, Y.; Ueda, T.; Sakabe, D.; et al. Evaluation of significant coronary artery disease based on CT fractional flow reserve and plaque characteristics using random forest analysis in machine learning. Acad. Radiol. 2020, 27, 1700–1708. [Google Scholar] [CrossRef] [PubMed]
- Lei, Y.; Guo, B.; Fu, Y.; Wang, T.; Liu, T.; Curran, W.; Zhang, L.; Yang, X. Automated coronary artery segmentation in coronary computed tomography angiography (CCTA) using deep learning neural networks. In Proceedings of the Medical Imaging 2020: Imaging Informatics for Healthcare, Research, and Applications, Houston, TX, USA, 16–17 February 2020; Volume 11318, pp. 279–284. [Google Scholar]
- van Hamersvelt, R.W.; Zreik, M.; Voskuil, M.; Viergever, M.A.; Išgum, I.; Leiner, T. Deep learning analysis of left ventricular myocardium in CT angiographic intermediate-degree coronary stenosis improves the diagnostic accuracy for identification of functionally significant stenosis. Eur. Radiol. 2019, 29, 2350–2359. [Google Scholar] [CrossRef] [Green Version]
- Chu, M.; Wu, P.; Li, G.; Yang, W.; Gutiérrez-Chico, J.L.; Tu, S. Advances in Diagnosis, Therapy, and Prognosis of Coronary Artery Disease Powered by Deep Learning Algorithms. JACC Asia 2023, 3, 1–14. [Google Scholar] [CrossRef]
- Al’Aref, S.J.; Anchouche, K.; Singh, G.; Slomka, P.J.; Kolli, K.K.; Kumar, A.; Pandey, M.; Maliakal, G.; Van Rosendael, A.R.; Beecy, A.N.; et al. Clinical applications of machine learning in cardiovascular disease and its relevance to cardiac imaging. Eur. Heart J. 2019, 40, 1975–1986. [Google Scholar] [CrossRef]
- Denzinger, F.; Wels, M.; Breininger, K.; Taubmann, O.; Mühlberg, A.; Allmendinger, T.; Gülsün, M.A.; Schöbinger, M.; André, F.; Buss, S.J.; et al. How scan parameter choice affects deep learning-based coronary artery disease assessment from computed tomography. Sci. Rep. 2023, 13, 2563. [Google Scholar] [CrossRef]
- Jiang, Y.; Yang, Z.G.; Wang, J.; Shi, R.; Han, P.L.; Qian, W.L.; Yan, W.F.; Li, Y. Unsupervised machine learning based on clinical factors for the detection of coronary artery atherosclerosis in type 2 diabetes mellitus. Cardiovasc. Diabetol. 2022, 21, 259. [Google Scholar] [CrossRef]
- Lu, H.; Yao, Y.; Wang, L.; Yan, J.; Tu, S.; Xie, Y.; He, W. Research Progress of Machine Learning and Deep Learning in Intelligent Diagnosis of the Coronary Atherosclerotic Heart Disease. Comput. Math. Methods Med. 2022, 2022, 3016532. [Google Scholar] [CrossRef]
- Kolossváry, M.; De Cecco, C.N.; Feuchtner, G.; Maurovich-Horvat, P. Advanced atherosclerosis imaging by CT: Radiomics, machine learning and deep learning. J. Cardiovasc. Comput. Tomogr. 2019, 13, 274–280. [Google Scholar] [CrossRef]
- Muscogiuri, G.; Chiesa, M.; Trotta, M.; Gatti, M.; Palmisano, V.; Dell’Aversana, S.; Baessato, F.; Cavaliere, A.; Cicala, G.; Loffreno, A.; et al. Performance of a deep learning algorithm for the evaluation of CAD-RADS classification with CCTA. Atherosclerosis 2020, 294, 25–32. [Google Scholar] [CrossRef] [PubMed] [Green Version]
- Dong, C.; Xu, S.; Li, Z. A novel end-to-end deep learning solution for coronary artery segmentation from CCTA. Med. Phys. 2022, 49, 6945–6959. [Google Scholar] [CrossRef] [PubMed]
- Mathur, P.; Srivastava, S.; Xu, X.; Mehta, J.L. Artificial intelligence, machine learning, and cardiovascular disease. Clin. Med. Insights: Cardiol. 2020, 14, 1179546820927404. [Google Scholar] [CrossRef] [PubMed]
- Paul, J.F.; Rohnean, A.; Giroussens, H.; Pressat-Laffouilhere, T.; Wong, T. Evaluation of a deep learning model on coronary CT angiography for automatic stenosis detection. Diagn. Interv. Imaging 2022, 103, 316–323. [Google Scholar] [CrossRef] [PubMed]


| Dataset | Number of Images | Number of Patients | CAD | No CAD | Classifications |
|---|---|---|---|---|---|
| Dataset 1 | 2364 | 500 | 1182 | 1182 | 2 |
| Dataset 2 | 1000 | 1000 | 503 | 497 | 2 |
| Methods/Measures | Accuracy | Precision | Recall | F1-Measure | MCC | Kappa |
|---|---|---|---|---|---|---|
| Training | ||||||
| CAD | 98.60 | 98.10 | 98.60 | 98.35 | 95.30 | 95.60 |
| No CAD | 99.10 | 98.40 | 98.40 | 98.40 | 95.40 | 94.90 |
| Average | 98.85 | 98.25 | 98.50 | 98.37 | 95.35 | 95.25 |
| Testing | ||||||
| CAD | 99.20 | 98.60 | 98.60 | 98.65 | 95.60 | 95.20 |
| No CAD | 99.60 | 98.40 | 98.70 | 98.55 | 95.10 | 94.80 |
| Average | 99.40 | 98.50 | 98.65 | 98.60 | 95.35 | 95.00 |
| Methods/Measures | Accuracy | Precision | Recall | F1-Measure | MCC | Kappa |
|---|---|---|---|---|---|---|
| Training | ||||||
| CAD | 98.70 | 98.80 | 98.70 | 98.75 | 96.40 | 96.30 |
| No CAD | 99.10 | 99.20 | 99.40 | 99.30 | 96.30 | 96.10 |
| Average | 98.90 | 99.00 | 99.05 | 99.02 | 96.35 | 96.20 |
| Testing | ||||||
| CAD | 99.40 | 98.80 | 98.60 | 98.70 | 96.40 | 96.30 |
| No CAD | 99.60 | 99.10 | 99.30 | 99.20 | 96.30 | 96.20 |
| Average | 99.50 | 98.95 | 98.95 | 98.95 | 96.35 | 96.25 |
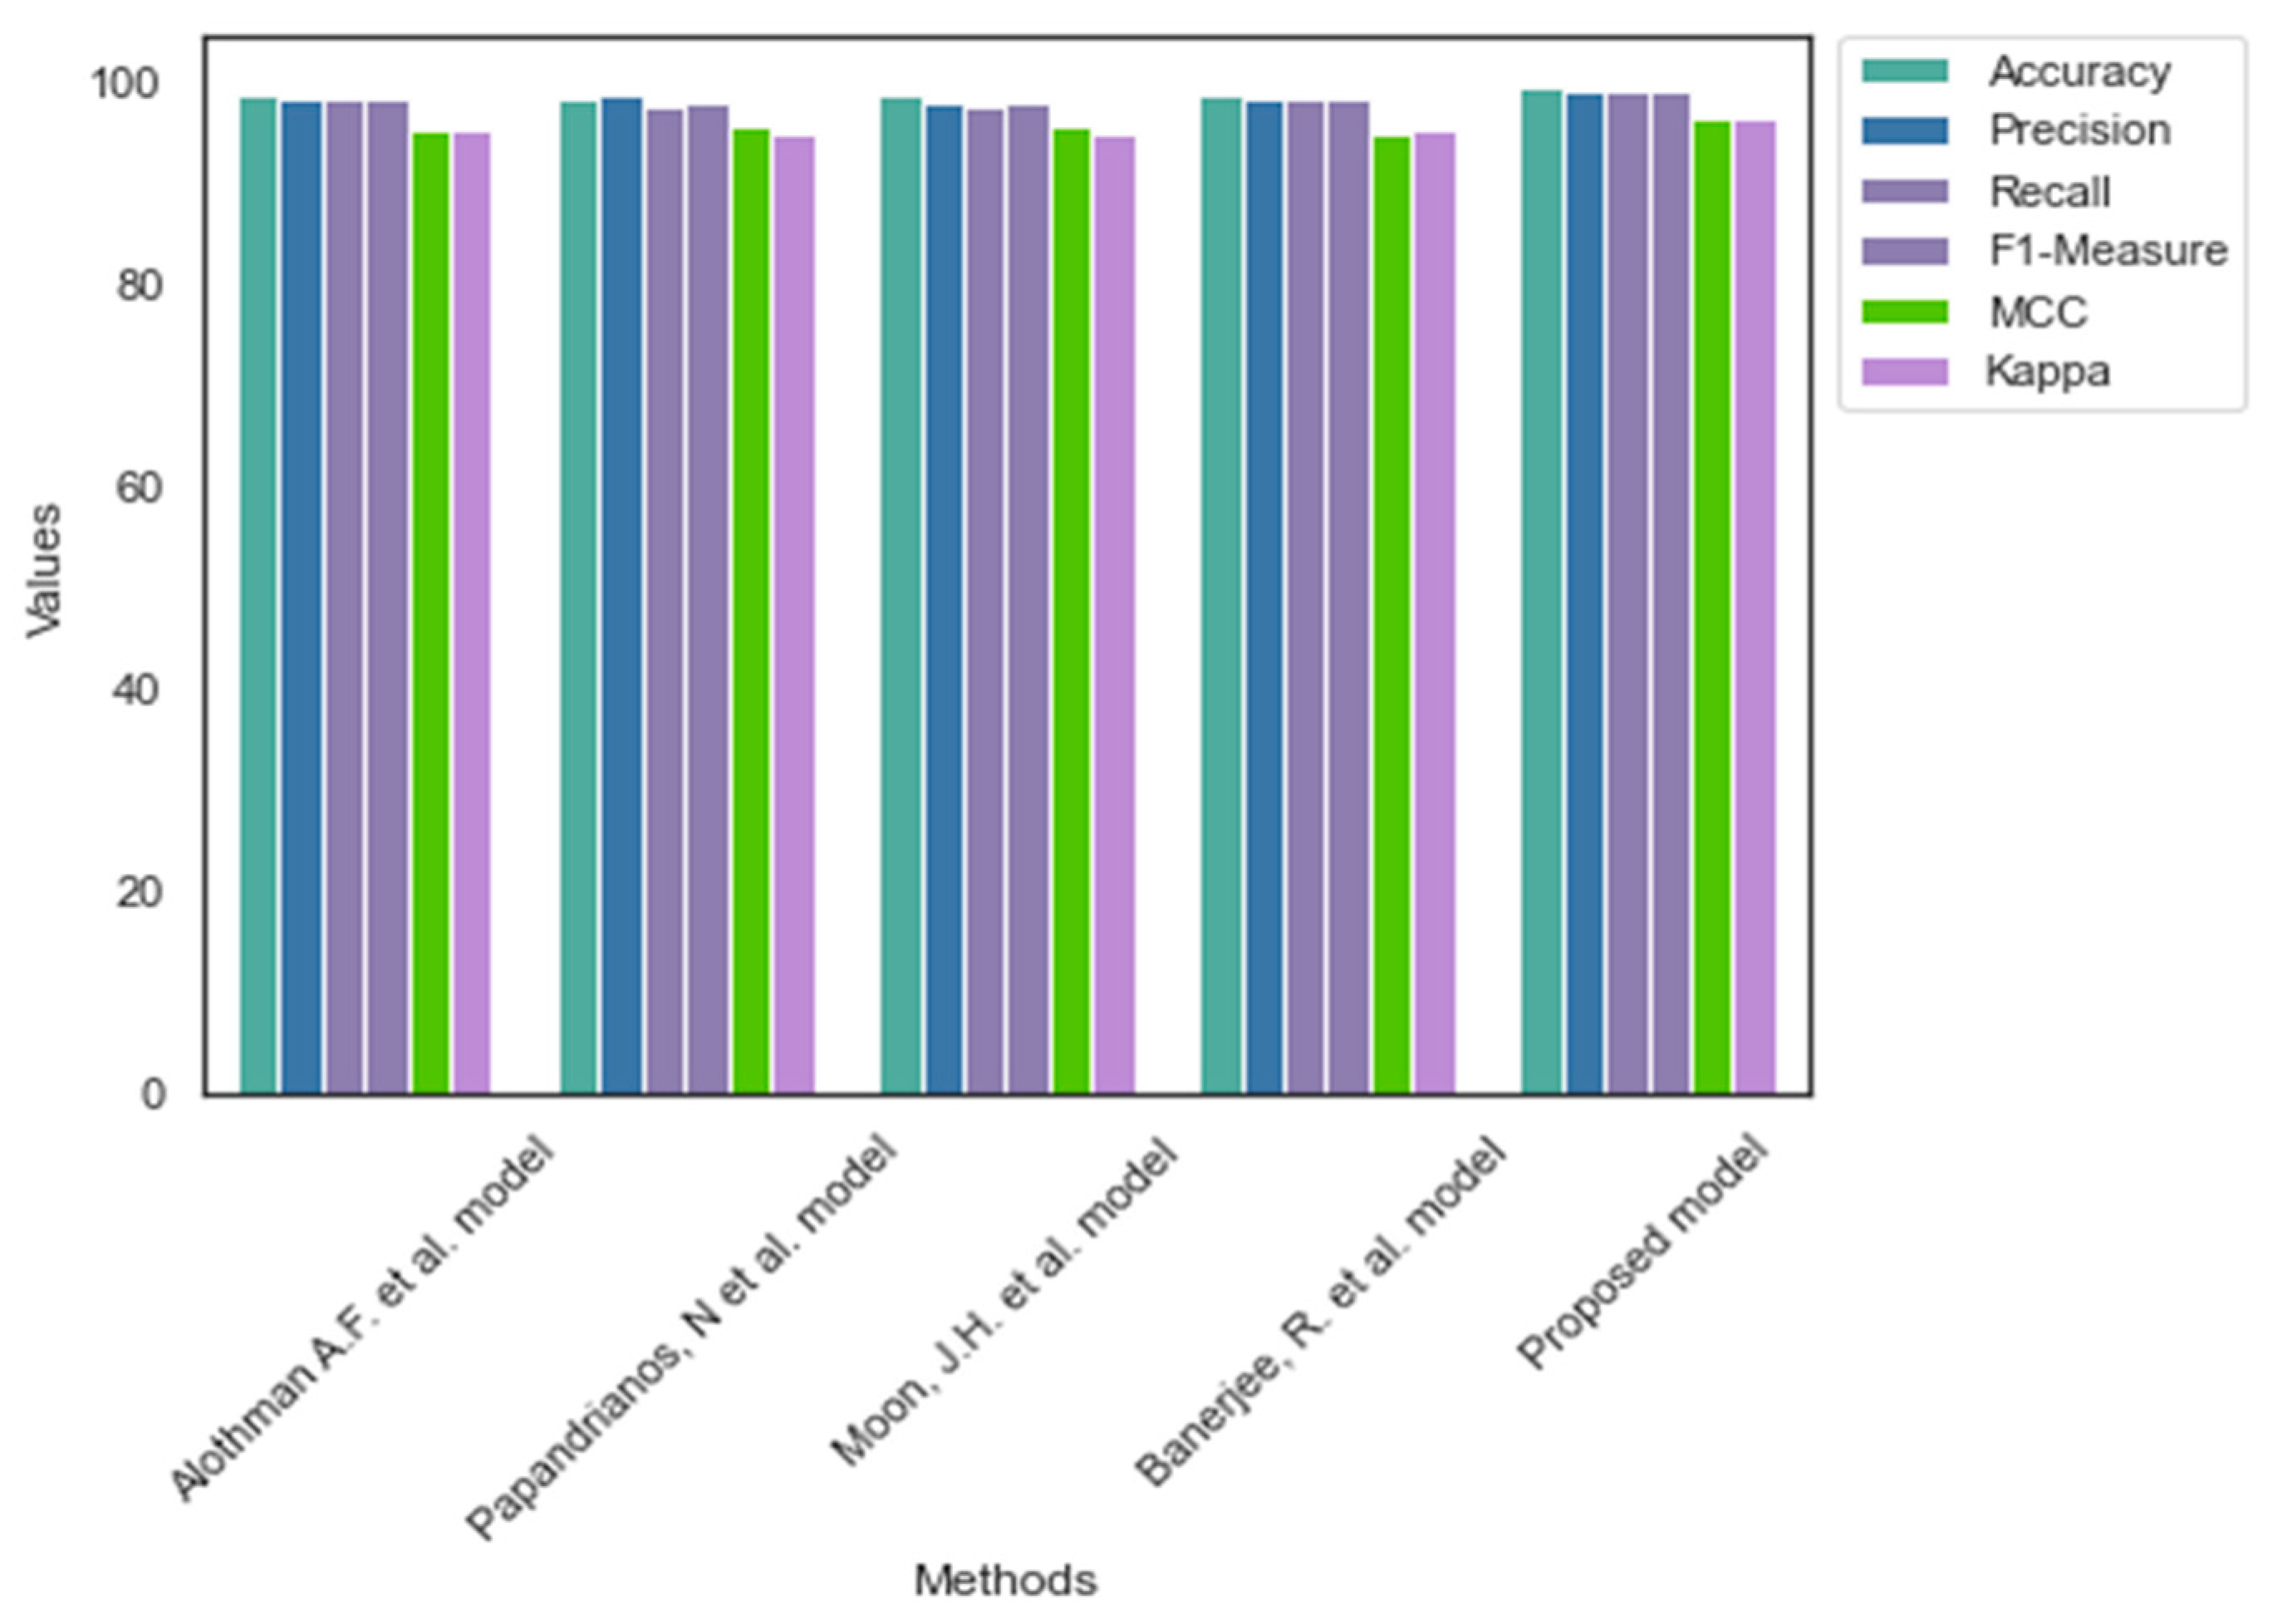
| Models/Measures | Accuracy | Precision | Recall | F1-Measure | MCC | Kappa |
|---|---|---|---|---|---|---|
| Alothman A.F. et al. [4] model | 98.60 | 98.20 | 97.80 | 98.00 | 94.10 | 94.20 |
| Papandrianos, N. et al. [7] model | 98.90 | 97.80 | 98.10 | 97.95 | 94.80 | 94.60 |
| Moon, J.H. et al. [8] model | 98.50 | 97.60 | 98.20 | 97.90 | 95.10 | 93.80 |
| Banerjee, R. et al. [9] model | 98.20 | 97.80 | 98.30 | 98.05 | 94.30 | 93.70 |
| Proposed model | 99.40 | 98.50 | 98.65 | 98.60 | 95.35 | 95.00 |
| Models/Measures | Accuracy | Precision | Recall | F1-Measure | MCC | Kappa |
|---|---|---|---|---|---|---|
| Alothman A.F. et al. [4] model | 98.60 | 98.20 | 98.10 | 98.15 | 95.30 | 95.10 |
| Papandrianos, N. et al. [7] model | 98.30 | 98.60 | 97.40 | 98.00 | 95.40 | 94.90 |
| Moon, J.H. et al. [8] model | 98.50 | 97.90 | 97.60 | 97.75 | 95.70 | 94.70 |
| Banerjee, R. et al. [9] model | 98.70 | 98.20 | 98.40 | 98.30 | 94.80 | 95.20 |
| Proposed model | 99.50 | 98.95 | 98.95 | 98.95 | 96.35 | 96.25 |
| Methods/Dataset | Dataset 1 | Dataset 2 | ||||
|---|---|---|---|---|---|---|
| No. of Parameters | Learning Rate | Learning Time (seconds) | No. of Parameters | Learning Rate | Learning Time (seconds) | |
| Alothman A.F. et al. [4] model | 4.3 M | 1 × 10⁻⁴ | 1.92 | 5.2 M | 1 × 10⁻³ | 1.98 |
| Papandrianos, N. et al. [7] model | 11.2 M | 1 × 10⁻³ | 2.1 | 6.3 M | 1 × 10⁻³ | 2.45 |
| Moon, J.H. et al. [8] model | 7.4 M | 1 × 10⁻³ | 2.36 | 11.2 M | 1 × 10⁻⁴ | 2.27 |
| Banerjee, R. et al. [9] model | 14.6 M | 1 × 10⁻³ | 2.3 | 6.1 M | 1 × 10⁻⁵ | 2.3 |
| Proposed model | 3.6 M | 1 × 10⁻⁴ | 1.4 | 3.7 M | 1 × 10⁻⁴ | 1.5 |
| Methods/Dataset | Dataset 1 | Dataset 2 | ||
|---|---|---|---|---|
| CI | SD | CI | SD | |
| Alothman A.F. et al. [4] model | [98.55–98.61] | 0.0017 | [96.62–96.71] | 0.0021 |
| Papandrianos, N. et al. [7] model | [97.41–97.48] | 0.0021 | [95.37–95.41] | 0.0042 |
| Moon, J.H. et al. [8] model | [97.32–97.42] | 0.0016 | [95.82–95.91] | 0.0029 |
| Banerjee, R. et al. [9] model | [97.91–98.02] | 0.0019 | [95.96–96.02] | 0.0031 |
| Proposed model | [98.64–98.72] | 0.0014 | [97.41–97.49] | 0.0019 |
Disclaimer/Publisher’s Note: The statements, opinions and data contained in all publications are solely those of the individual author(s) and contributor(s) and not of MDPI and/or the editor(s). MDPI and/or the editor(s) disclaim responsibility for any injury to people or property resulting from any ideas, methods, instructions or products referred to in the content. |
© 2023 by the authors. Licensee MDPI, Basel, Switzerland. This article is an open access article distributed under the terms and conditions of the Creative Commons Attribution (CC BY) license (https://creativecommons.org/licenses/by/4.0/).
Share and Cite
Wahab Sait, A.R.; Dutta, A.K. Developing a Deep-Learning-Based Coronary Artery Disease Detection Technique Using Computer Tomography Images. Diagnostics 2023, 13, 1312. https://doi.org/10.3390/diagnostics13071312
Wahab Sait AR, Dutta AK. Developing a Deep-Learning-Based Coronary Artery Disease Detection Technique Using Computer Tomography Images. Diagnostics. 2023; 13(7):1312. https://doi.org/10.3390/diagnostics13071312
Chicago/Turabian StyleWahab Sait, Abdul Rahaman, and Ashit Kumar Dutta. 2023. "Developing a Deep-Learning-Based Coronary Artery Disease Detection Technique Using Computer Tomography Images" Diagnostics 13, no. 7: 1312. https://doi.org/10.3390/diagnostics13071312