Article

Estimation of Lewis Blood Group Status by Fluorescence Melting Curve Analysis in Simultaneous Genotyping of c.385A>T and Fusion Gene in FUT2 and c.59T>G and c.314C>T in FUT3

Department of Forensic Medicine, Kurume University School of Medicine, Kurume 830-0011, Japan
*
Author to whom correspondence should be addressed.
Diagnostics 2023, 13(5), 931; https://doi.org/10.3390/diagnostics13050931
Submission received: 28 January 2023 / Revised: 15 February 2023 / Accepted: 28 February 2023 / Published: 1 March 2023
(This article belongs to the Section Pathology and Molecular Diagnostics)

Abstract

:
Lewis blood group status is determined by two fucosyltransferase activities: those of FUT2-encoded fucosyltransferase (Se enzyme) and FUT3-encoded fucosyltransferase (Le enzyme). In Japanese populations, c.385A>T in FUT2 and a fusion gene between FUT2 and its pseudogene SEC1P are the cause of most Se enzyme-deficient alleles (Sew and sefus), and c.59T>G and c.314C>T in FUT3 are tag SNPs for almost all nonfunctional FUT3 alleles (le59, le59,508, le59,1067, and le202,314). In this study, we first conducted a single-probe fluorescence melting curve analysis (FMCA) to determine c.385A>T and sefus using a pair of primers that collectively amplify FUT2, sefus, and SEC1P. Then, to estimate Lewis blood group status, a triplex FMCA was performed with a c.385A>T and sefus assay system by adding primers and probes to detect c.59T>G and c.314C>T in FUT3. We also validated these methods by analyzing the genotypes of 96 selected Japanese people whose FUT2 and FUT3 genotypes were already determined. The single-probe FMCA was able to identify six genotype combinations: 385A/A, 385T/T, sefus/sefus, 385A/T, 385A/sefus, and 385T/sefus. In addition, the triplex FMCA successfully identified both FUT2 and FUT3 genotypes, although the resolutions of the analysis of c.385A>T and sefus were somewhat reduced compared to that of the analysis of FUT2 alone. The estimation of the secretor status and Lewis blood group status using the form of FMCA used in this study may be useful for large-scale association studies in Japanese populations.

1. Introduction

The expression of Lewis blood group antigens, Lewis a (Lea) and Lewis b (Leb), is determined by the activity of FUT2-encoded fucosyltransferase (Se enzyme) and FUT3-encoded fucosyltransferase (Le enzyme) [1,2,3]. Secretors with at least one functional FUT2 allele (Se) express soluble ABH(O) antigens in saliva and other secretions, while non-secretors, homozygotes for the nonfunctional FUT2 (non-secretor) alleles (se), do not [3]. Weak secretors are homozygous for the weak-secretor allele (Sew) or compound heterozygous for Sew/se and are characterized by very low ABH antigen expression in secretions compared to secretors. This is because the activity of the Se enzyme encoded by Sew is very low but detectable due to a single nucleotide polymorphism (SNP), c.385A>T (p.Ile129Phe, rs1047781) [4,5]. In addition, Lewis-positive individuals with at least one functional FUT3 allele (Le) have Le(a-b+) red cells in their secretors, Le(a+b-) in their non-secretors, and Le(a+b+) in their weak secretors. On the other hand, Lewis-negative individuals, homozygotes for the nonfunctional FUT3 alleles (le), all have Le(a-b-) red cells [3]. Evidence is accumulating that secretor status and/or Lewis blood group status affects the susceptibility to a variety of clinical conditions, including some infectious diseases, inflammatory bowel disease, and plasma vitamin B12 levels [6,7,8,9,10,11,12,13,14,15].
To date, five se alleles resulting from non-allelic homologous recombination and several population-specific SNPs in FUT2 and FUT3 have been identified [16,17,18,19]. Among these, sefus, which results from an unequal crossover between FUT2 and its pseudogene SEC1P (Figure 1A), is present almost exclusively in Japanese populations with a frequency of 5–9% [5,19]. SEC1P has high sequence similarity to FUT2 and is located near FUT2 on chromosome 19q13.3 [20,21]. In addition, the causal SNP for Sew, c.385A>T, is restricted to East and Southeast Asians, including Japanese people, with a frequency of about 50% [5,16,22,23]. Furthermore, three tag SNPs, c.59T>G (p.Leu20Arg, rs28362459), c.314C>T (p.Thr105Met, rs778986), and c.484A>G (p.Trp68Arg, rs28362463) in FUT3, were suggested to be useful for estimating le allele frequency in many populations [24]. In Japanese populations, since Se enzyme-deficient alleles other than Sew and sefus are quite rare and c.59T>G and c.314C>T are tag SNPs for almost all le alleles (le59, le59,508, le59,1067, and le202,314), determining these polymorphisms could provide an accurate estimate of secretor status and Lewis blood group status.
Fluorescence melting curve analysis (FMCA) is a simple, robust, and rapid closed-tube post-PCR method for detecting SNPs that analyzes the difference between the melting curve profiles of the fluorescence-labeled probe and PCR amplicon [25,26]. In addition, multiplex assays can be performed by using different fluorescent dyes [24,26]. Recently, we developed a triplex FMCA procedure for the genotyping of three tag SNPs, c.59T>G, c.314C>T, and c.484A>G, in FUT3 to estimate le allele frequency [24].
In this study, we performed a FMCA that simultaneously determined the frequency of c.385A>T and sefus using a single probe. A triplex FMCA was then performed to estimate Lewis blood group status in Japanese people, adding primers and probes to detect c.59T>G and c.314C>T of FUT3 to c.385A>T and sefus assay system.

2. Materials and Methods

2.1. DNA Samples

The genomic DNAs of 96 Japanese people from Fukuoka whose FUT2 haplotypes had been determined previously using established methods such as the allele specific PCR and/or DNA sequencing [5] were used in this study. The study protocol was reviewed and approved by the ethical committee of Kurume University (approval no. 22158).

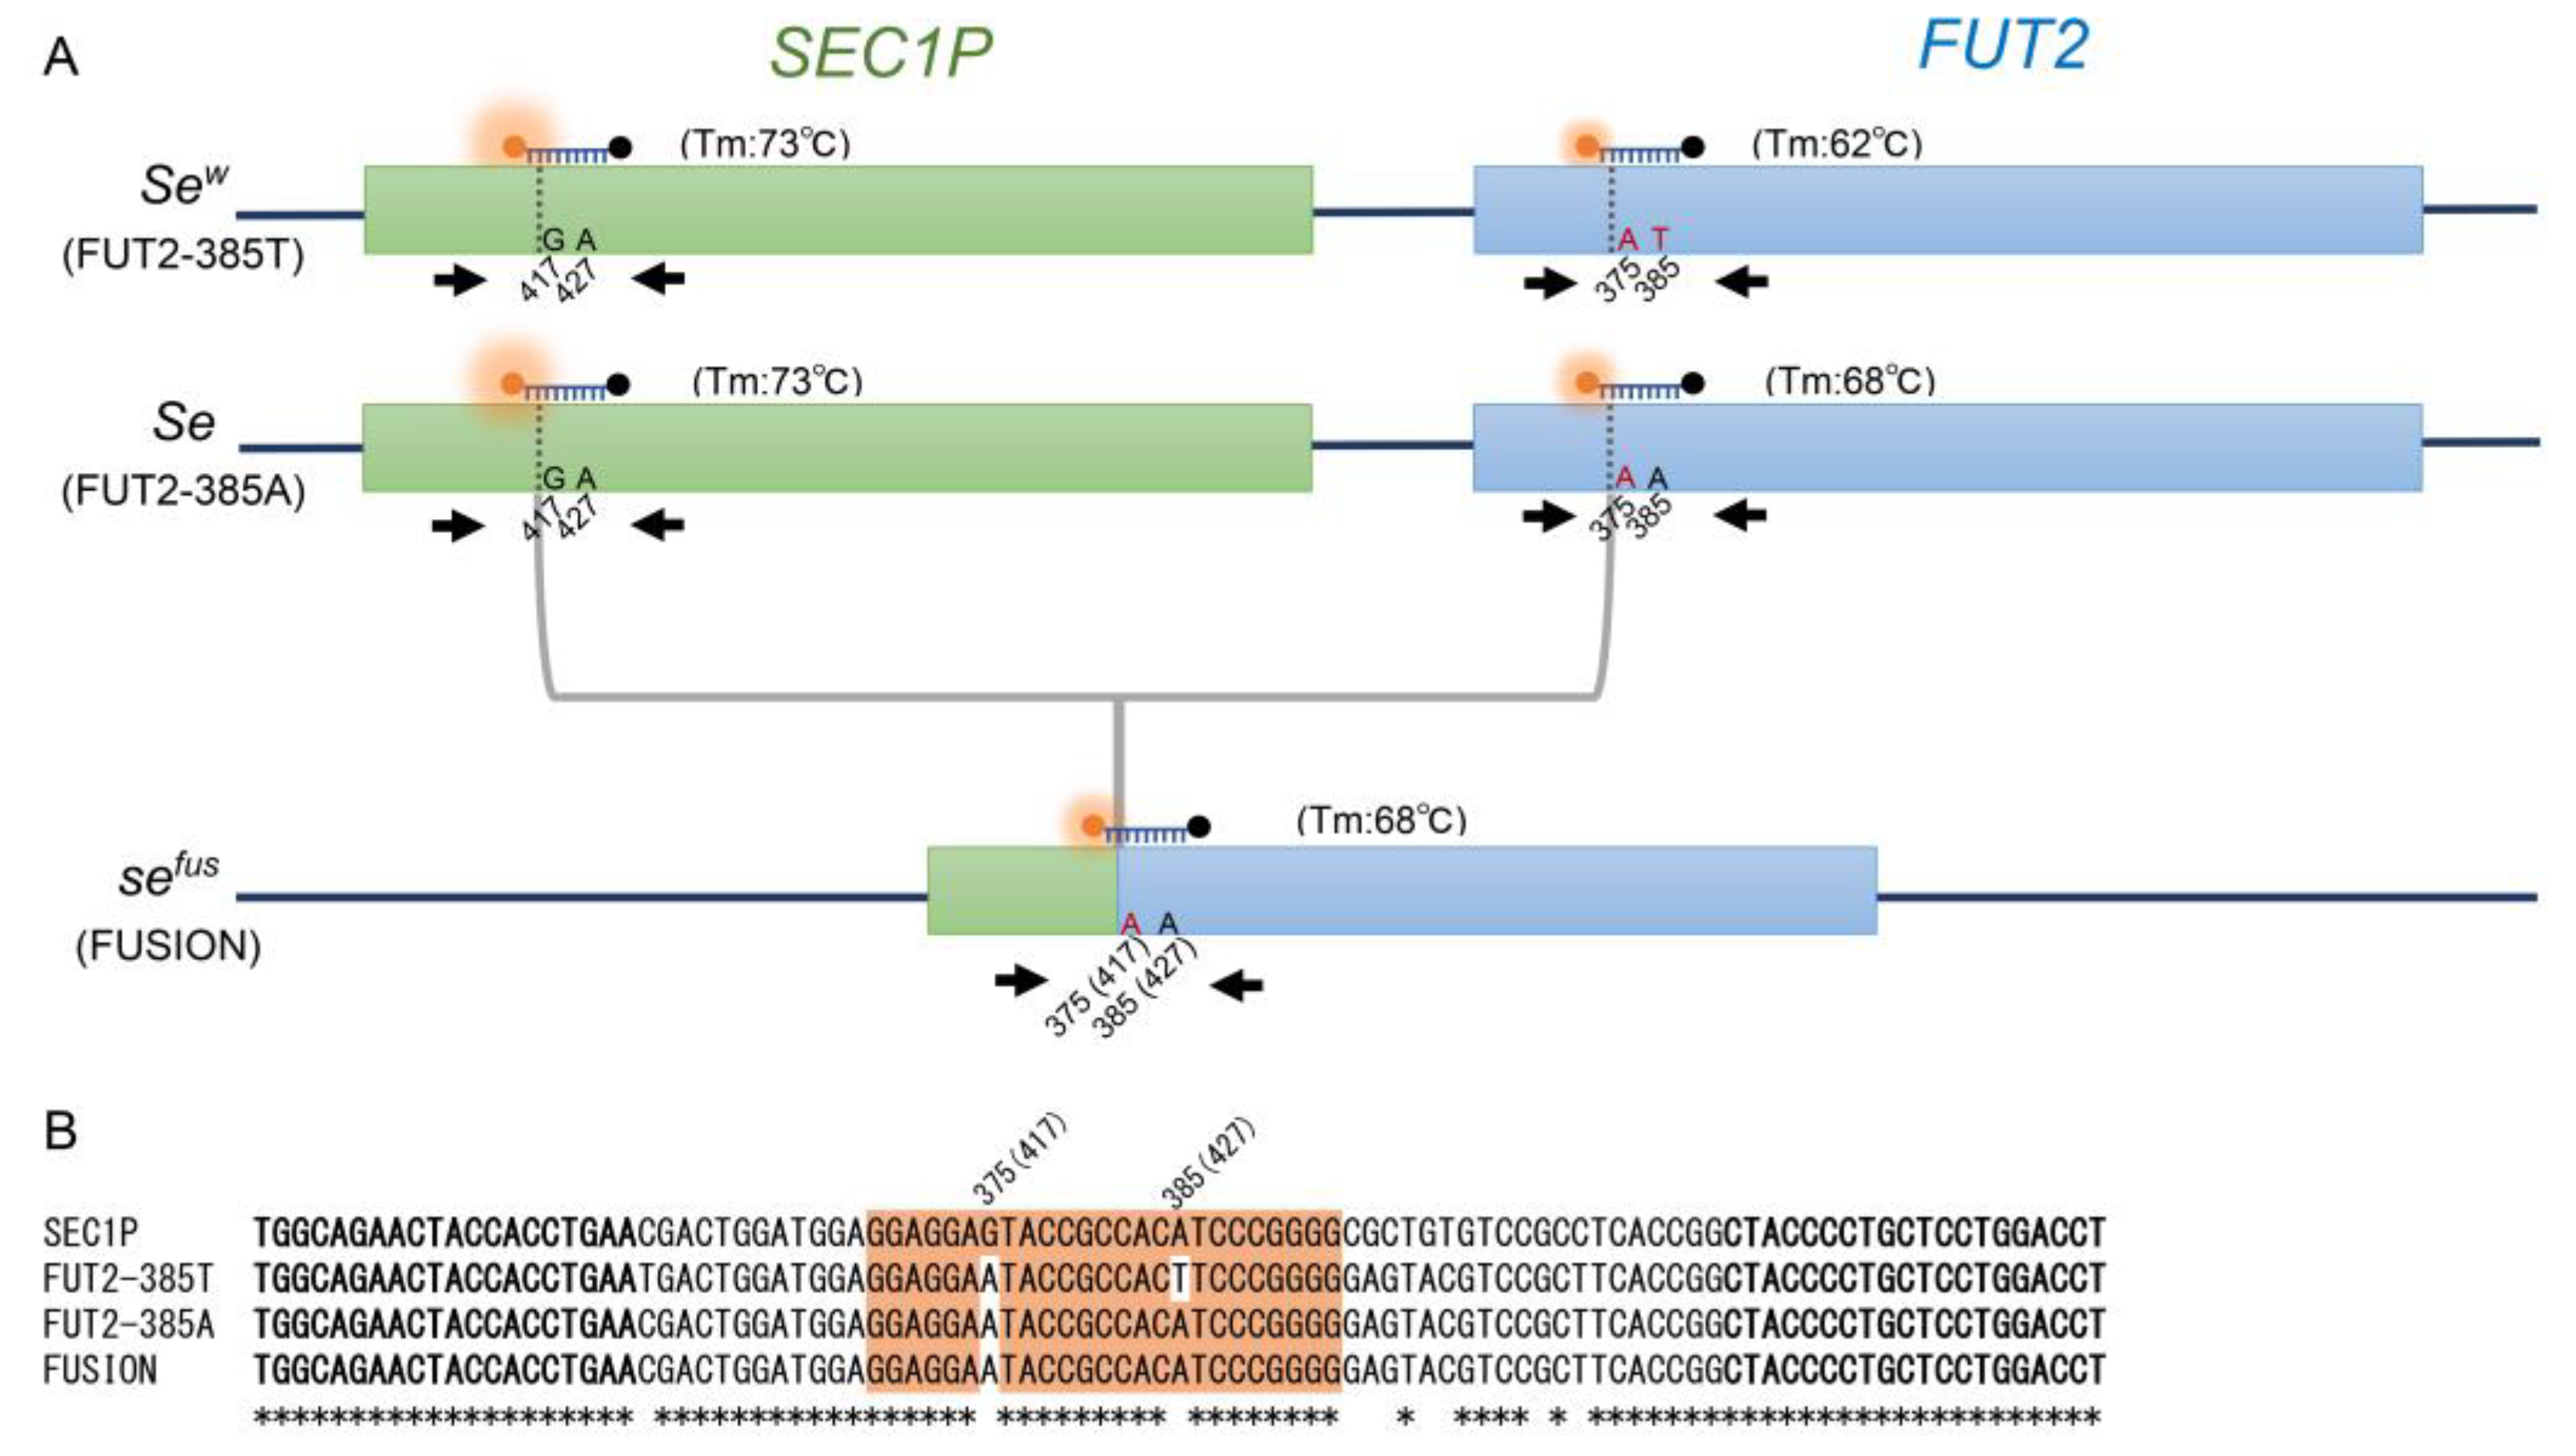
2.2. Asymmetric PCR for c.385A>T and sefus of FUT2

The nucleotide positions of the FUT2 and SEC1P genes were numbered as described previously [21]. All primers and probes were synthesized by Eurofins Genomics K.K (Tokyo, Japan). As shown in Figure 1A, we used a pair of primers that collectively amplify FUT2, sefus, and SEC1P. The forward primer, 5′-TGGCAGAACTACCACCTGAA-3′, matches exactly 337–356 bp of FUT2 and 379–398 bp of SEC1P, and is the same primer that previously detected c.385A>T by an unlabeled probe HRM analysis [27]. The reverse primer, 5′-AGGTCCAGGAGCAGGGGTAG-3ʹ, matches exactly the reverse sequences of 414–433 bp of FUT2 and of 456–475 bp of SEC1P, and is the same primer that previously detected sefus by a TaqMan probe assay and HRM analysis [19,28]. The SEC1P-FUT2 probe, HEX-5′-GGAGGAGTACCGCCACATCCCGGGG-3′-black hole quencher 1, matches exactly 411–435 bp of SEC1P, and 369–393 bp of FUT2, but differs by one base from the wild-type (385A allele) and sefus, and differs by two bases from the 385T allele. The asymmetric PCR reaction mixture with a final volume of 10 µL contained 5 µL of TaKaRa Taq HS Perfect Mix containing modified Taq DNA polymerase, which has neither 5′-3′ exonuclease nor 3′-5′ exonuclease activities (Takara, Tokyo, Japan), 50 nM of the forward primer, 500 nM of the reverse primer, 200 nM of the SEC1P-FUT2 probe, and 2–20 ng of genomic DNA. The PCR was conducted on LightCycler 480 Instrument II (Roche Diagnostics, Tokyo, Japan) with the following thermal conditions: 45 cycles of denaturation at 95 °C for 5 s, and annealing/extension at 60 °C for 15 s.

2.3. Triplex PCR for c.385A>T and sefus of FUT2, c.59T>G and c.314C>T of FUT3

Recently, we conducted a triplex FMCA for the genotyping of three tag SNPs, c.59T>G, c.314C>T, and c.484A>G, in FUT3 to estimate le allele frequency [24]. However, c.484A>G is highly specific to African populations and has not yet been observed in Asian populations, including Japanese populations. Therefore, in this study, previously reported primers and probes were added to the c.385A>T and sefus of the FUT2 assay system to detect c.59T>G and c.314C>T, excluding c.484A>G. However, since a HEX-labeled probe was used to detectc.385A>T and sefus, a FAM-labeled probe was used instead of a HEX-labeled probe to detect c.59T>G in this study. The primer and probe concentrations for c.59T>G and c.314C>T were as follows: 50 nM of each forward primer, 250 nM of each reverse primer, 50 nM of a probe for c.59T>G, and 100 nM of a probe for c.314C>T. The primer and probe concentrations for c.385A>T and sefus and the thermal conditions of the asymmetric PCR were the same as described above.

2.4. FMCA for Detection of c.385A>T and sefus of FUT2, c.59T>G and c.314C>T of FUT3

The PCR products were then heated to 95 °C for 1 min and cooled to 40 °C for 1 min, and fluorescence data were acquired using the VIC/HEX/Yellow 555 filter (excitation–emission: 533–580 nm) and/or the FAM filter (465–510 nm) and/or the Cy5/Cy5.5 filter (618–660 nm) during heating from 50 to 80 °C at a 0.1 °C/s ramp rate. Melting curve genotyping and melting temperature (Tm) analyses were carried out using the LightCycler 480 gene scanning software.

3. Results

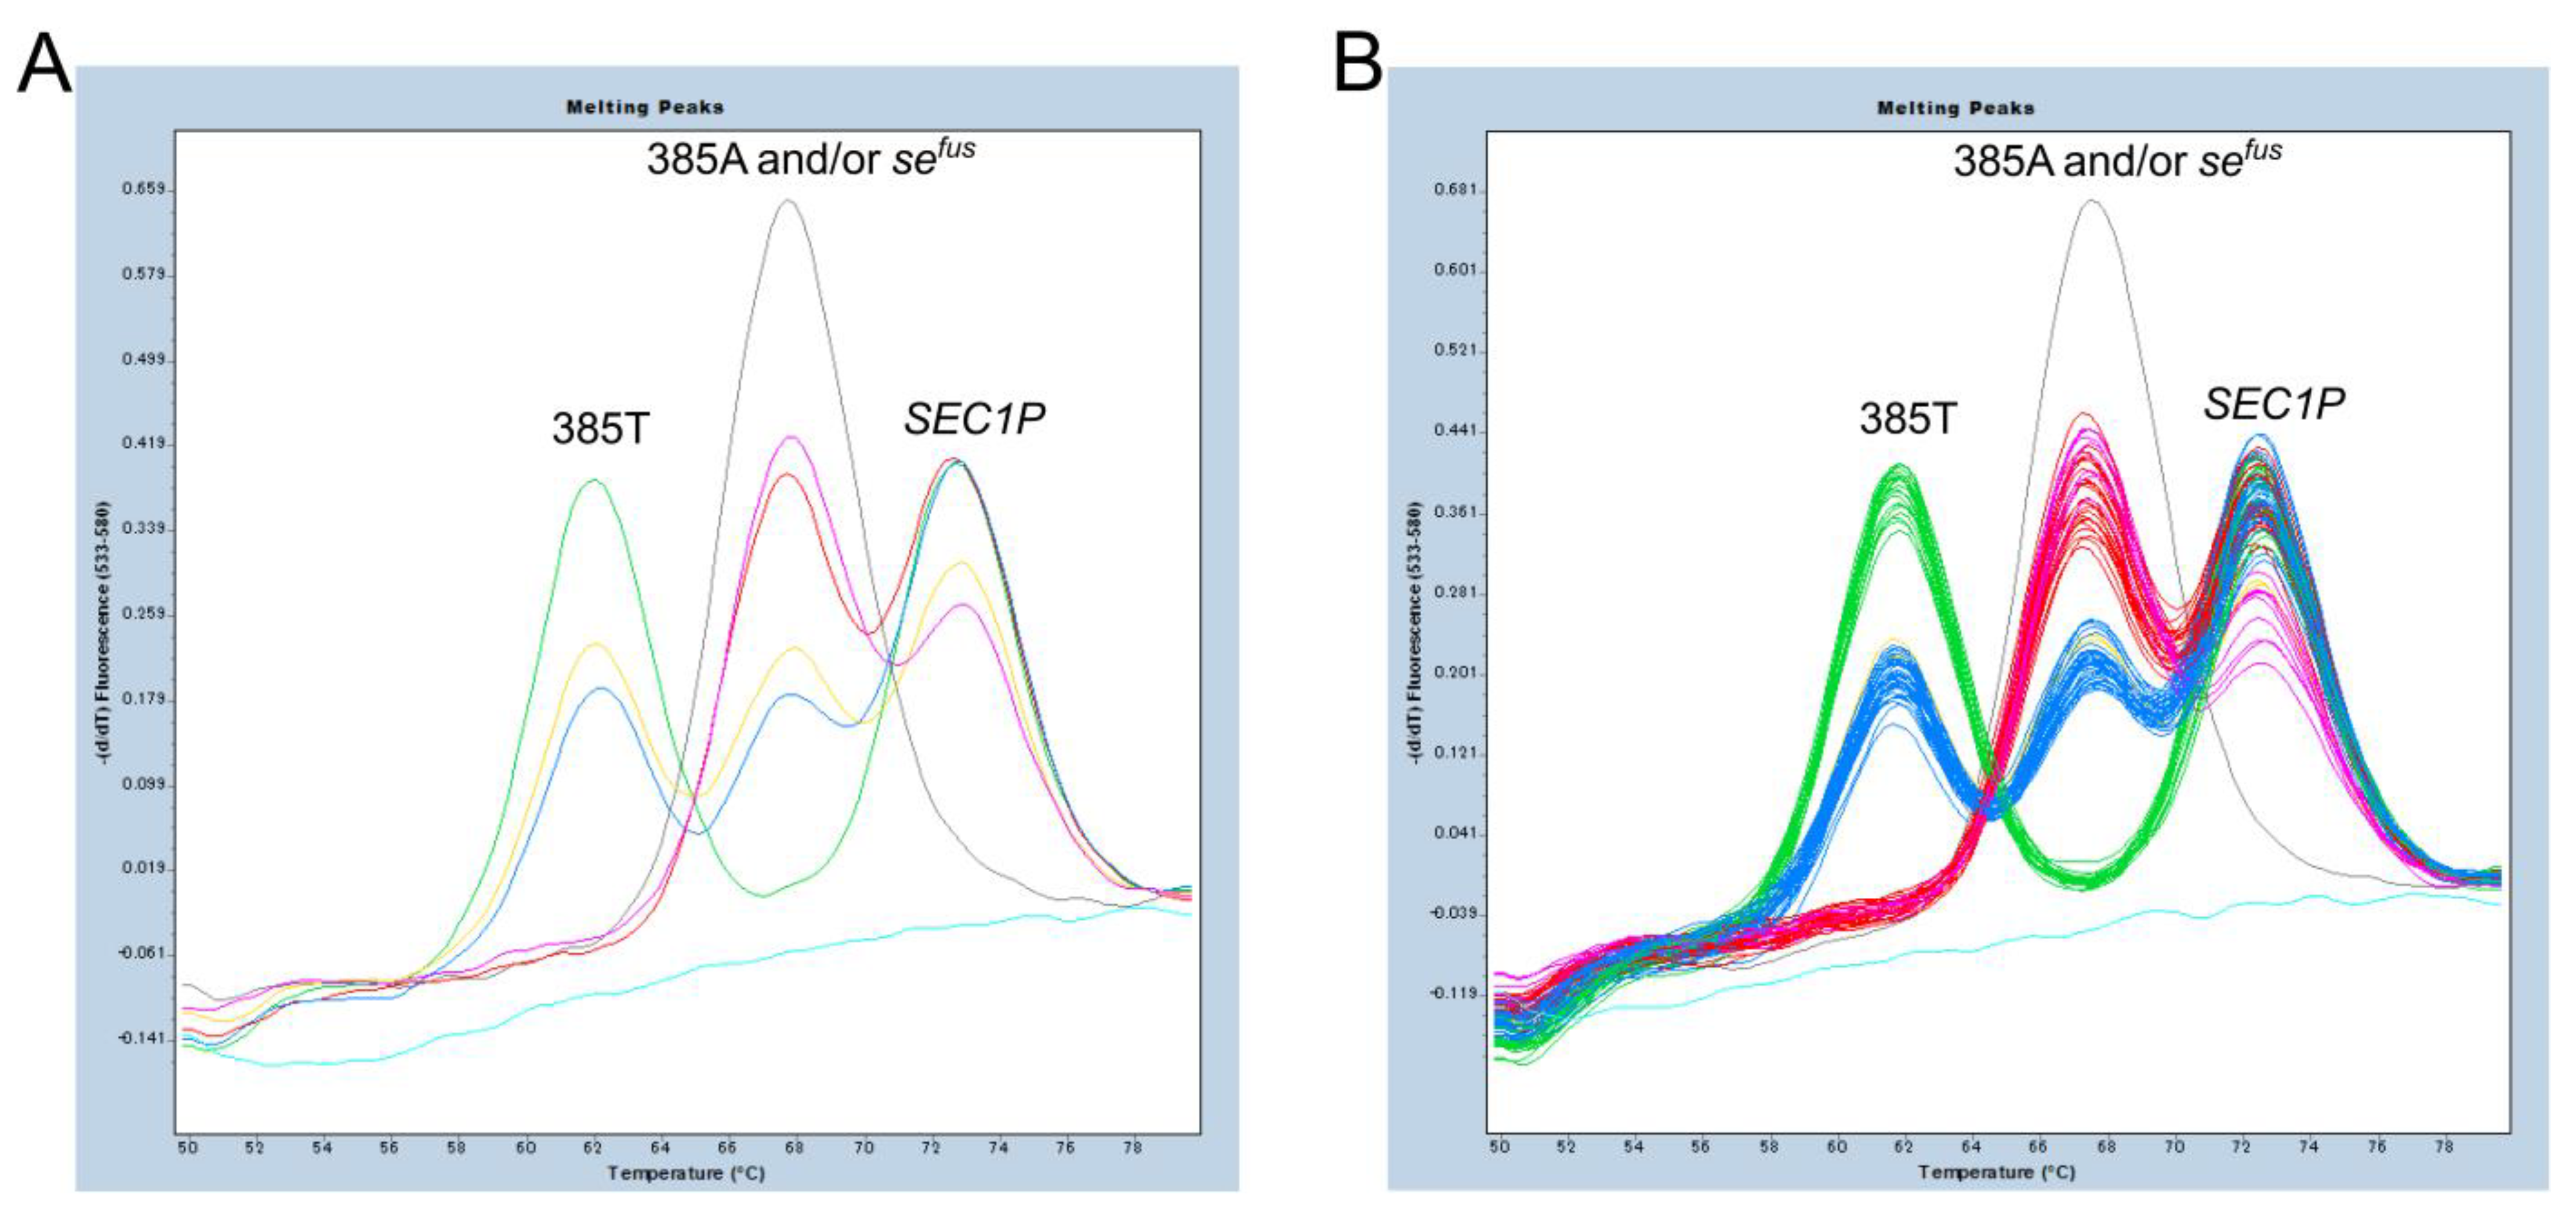
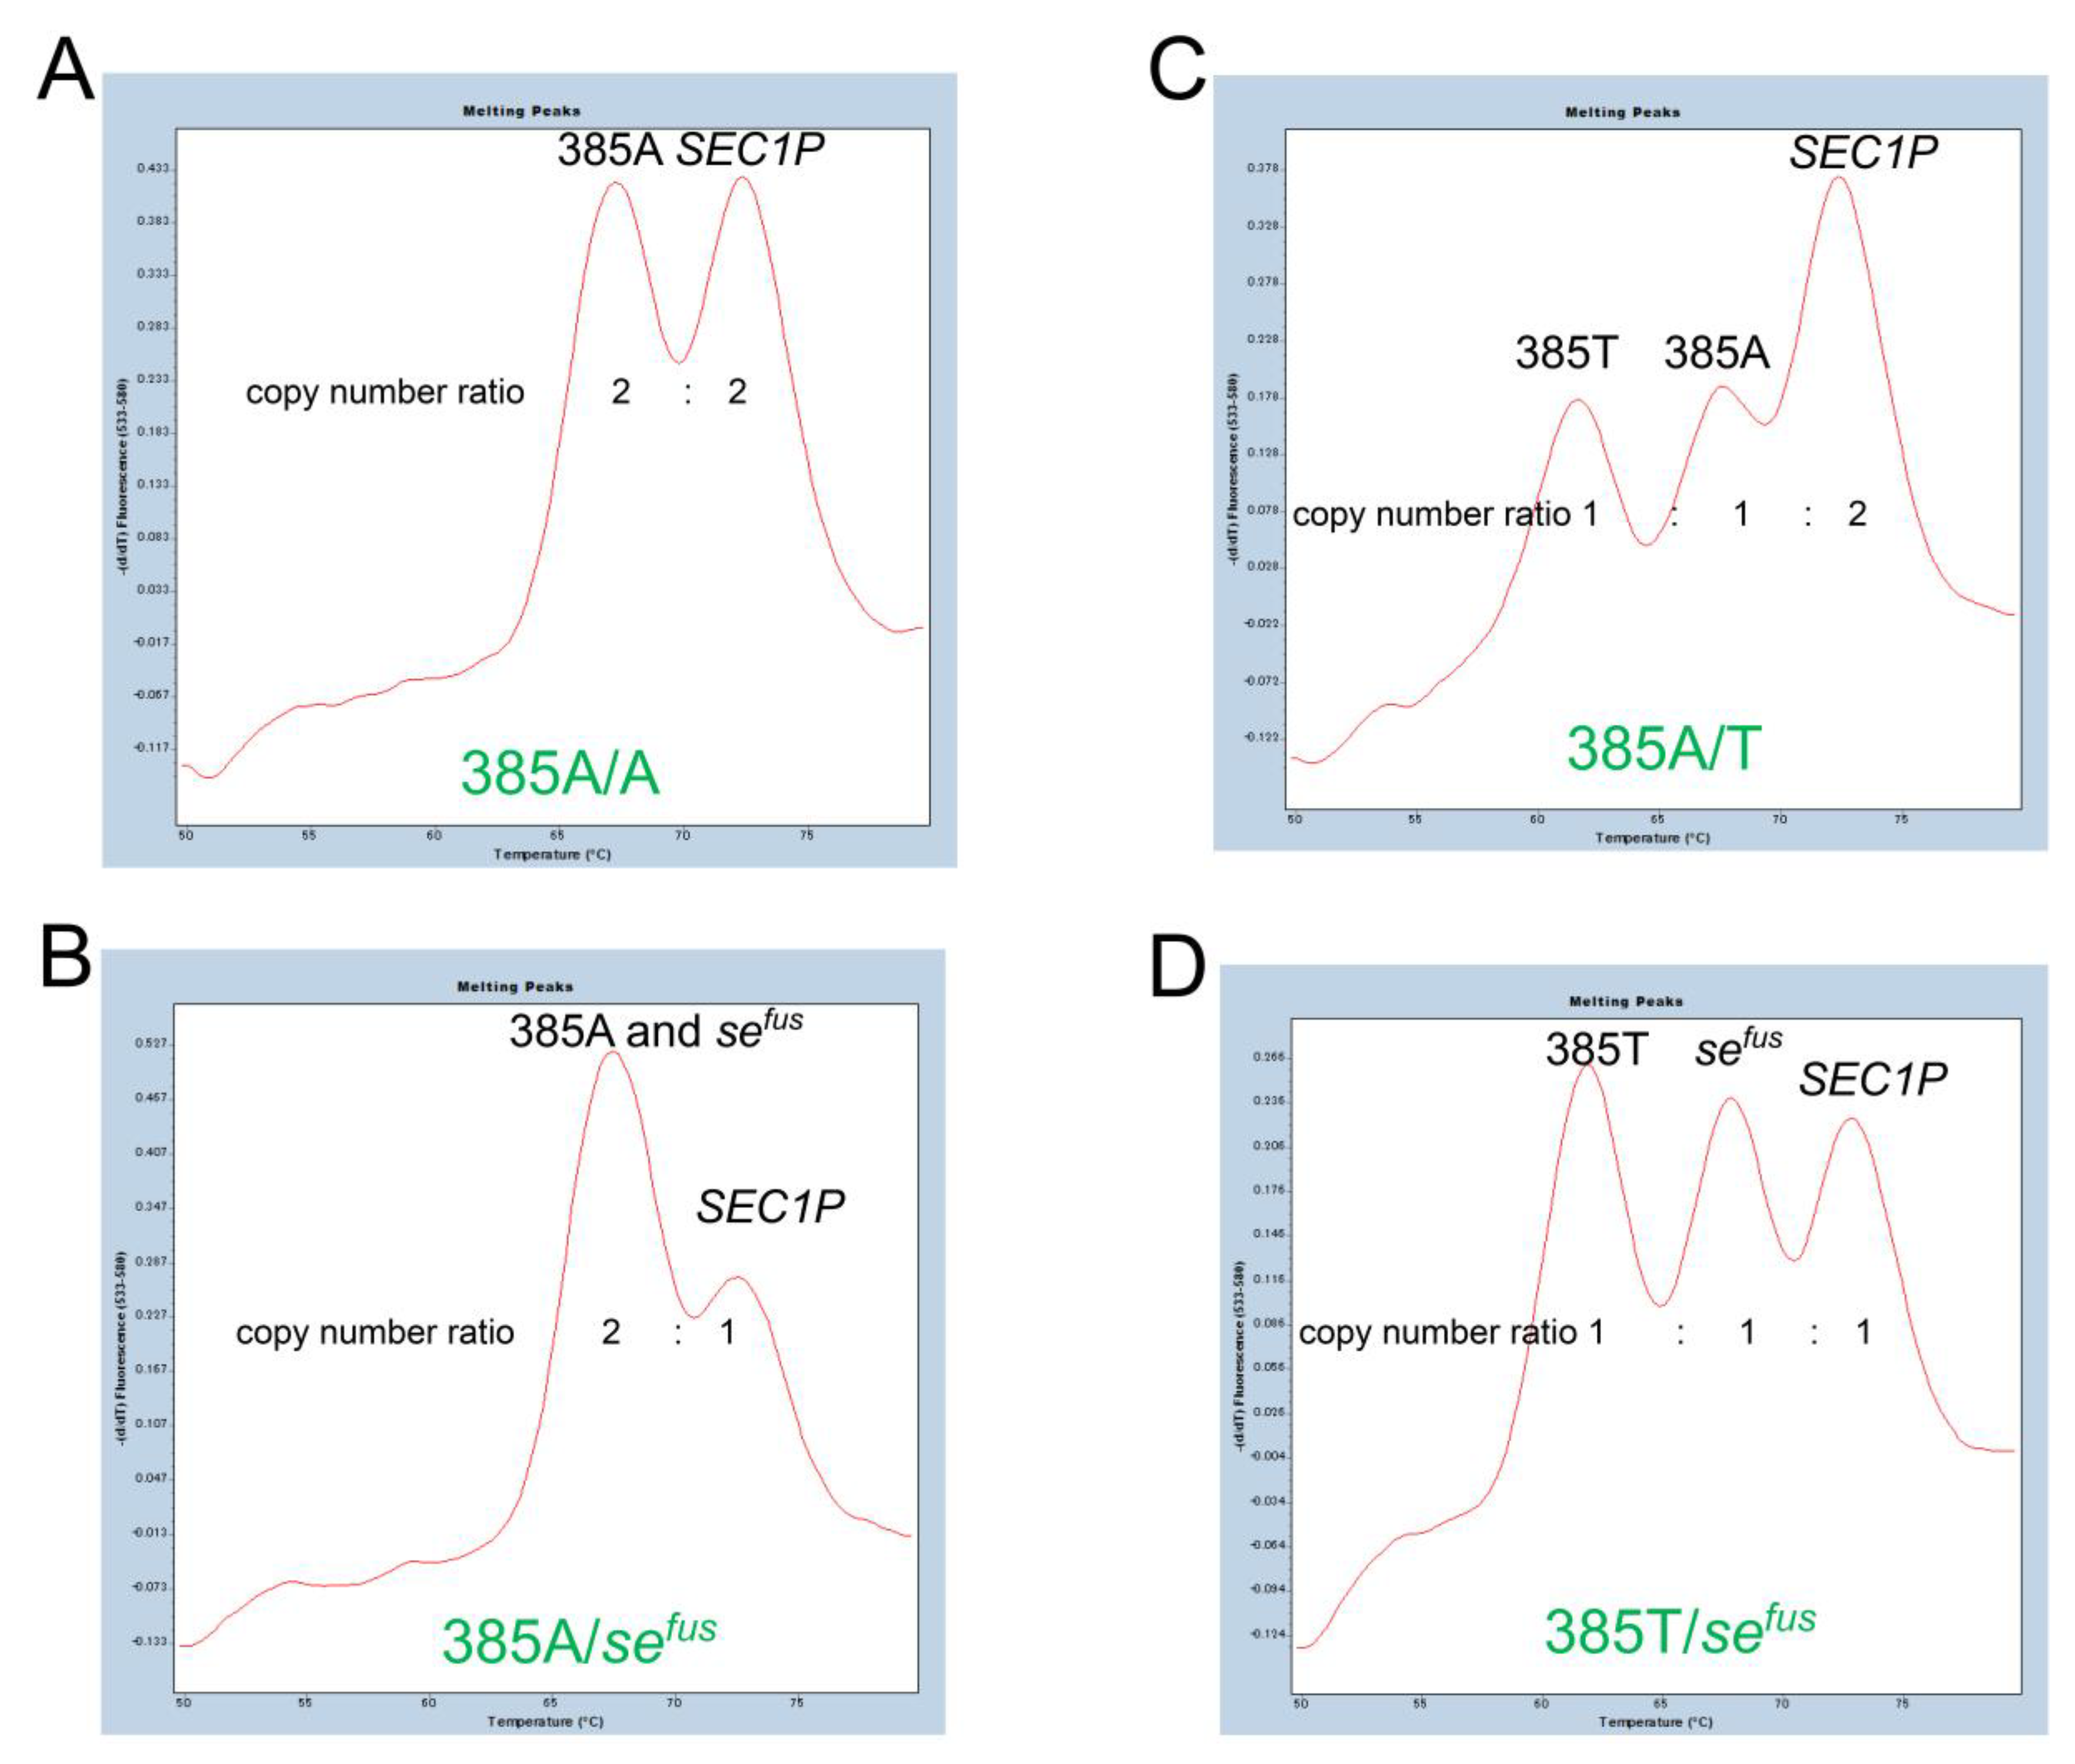
3.1. FMCA for Detection of c.385A>T and sefus of FUT2

In this study, we first attempted to detect c.385A>T and sefus with a single probe using a primer set that collectively amplified 97 bp amplicons of FUT2, sefus, and SEC1P. As shown in Figure 1B and Figure 2A, the highest Tm value around 73 °C was observed for the SEC1P amplicon because the probe sequence exactly matches that of SEC1P. On the other hand, an intermediate Tm value around 68 °C was observed for the 385A allele amplicon because the probe sequence differed by one base, and the lowest Tm value around 62 °C was observed for the 385T allele amplicon because the probe sequence differed by two bases. In addition, in sefus, the nucleotides corresponding to the positions of 375 bp and 385 bp in FUT2 (or 419 bp and 429 bp in SEC1P) were both “A”, and therefore, the Tm value for the sefus amplicon was the same (around 68 °C) as that for the 385A amplicon (Figure 1A,B).
A chromosome with the 385A or 385T allele had two regions (413–437 bp of SEC1P and 369–393 bp of FUT2) that hybridized with the probe (Figure 1A,B). On the other hand, a chromosome with the sefus allele had only one region that hybridized with the probe because sefus had been generated by an unequal crossover between the 253 and 416 bp positions of SEC1P and between the 211 and 374 bp positions of FUT2, and the position of 385 bp of FUT2 is located immediately at the 3′ region of the recombination sequence [19].
We then analyzed 96 Japanese people whose FUT2 haplotypes had already been determined by allele-specific PCR and/or DNA sequencing [5]. Homozygotes of sefus (sefus/sefus) showing only one melting peak at around 68 °C, and homozygotes of 385T allele (385T/T) showing two melting peaks at around 73 °C and 62 °C were completely separated by the default settings of the LightCycler 480 gene scanning software (normal sensitivity, score threshold 0.70, resolution threshold 0.10). On the other hand, homozygotes of the 385A allele (385A/A) and heterozygotes of 385A/sefus with two melting peaks at around 73 °C and 68 °C, or heterozygotes of c.385A>T (385A/T) and heterozygotes of 385T/sefus with three melting peaks at around 73 °C, 68 °C, and 62 °C, were classified into the same group in the default settings. However, it was possible to separate 385A/A from 385A/sefus and 385A/T from 385T/sefus by changing the settings to normal sensitivity with a score threshold of 0.85 and a resolution threshold of 0.00 (Figure 2B). The reason for this is that the peak height corresponding to SEC1P for sefus heterozygotes (385A/sefus and 385T/sefus, Figure 3B,D) are relatively lower than that corresponding to SEC1P for subjects without sefus (Figure 3A,C).
Although one weak secretor with the genotype Sew/se628, determined by a Sanger sequencing analysis, was misclassified as Se/Sew in this FMCA because the nucleotide at position 385 of se628 was an “A”, the other results were completely in accordance with previous ones [5]. The FUT2 genotyping results of conducting a FMCA of 96 Japanese people were as follows: 23 were 385A/A, 38 were 385A/T, 22 were 385T/T, 9 were 385A/sefus, 2 were 385A/sefus, and one was sefus/sefus. In addition, the repeatability the results was confirmed because the results of two independent assays were identical.

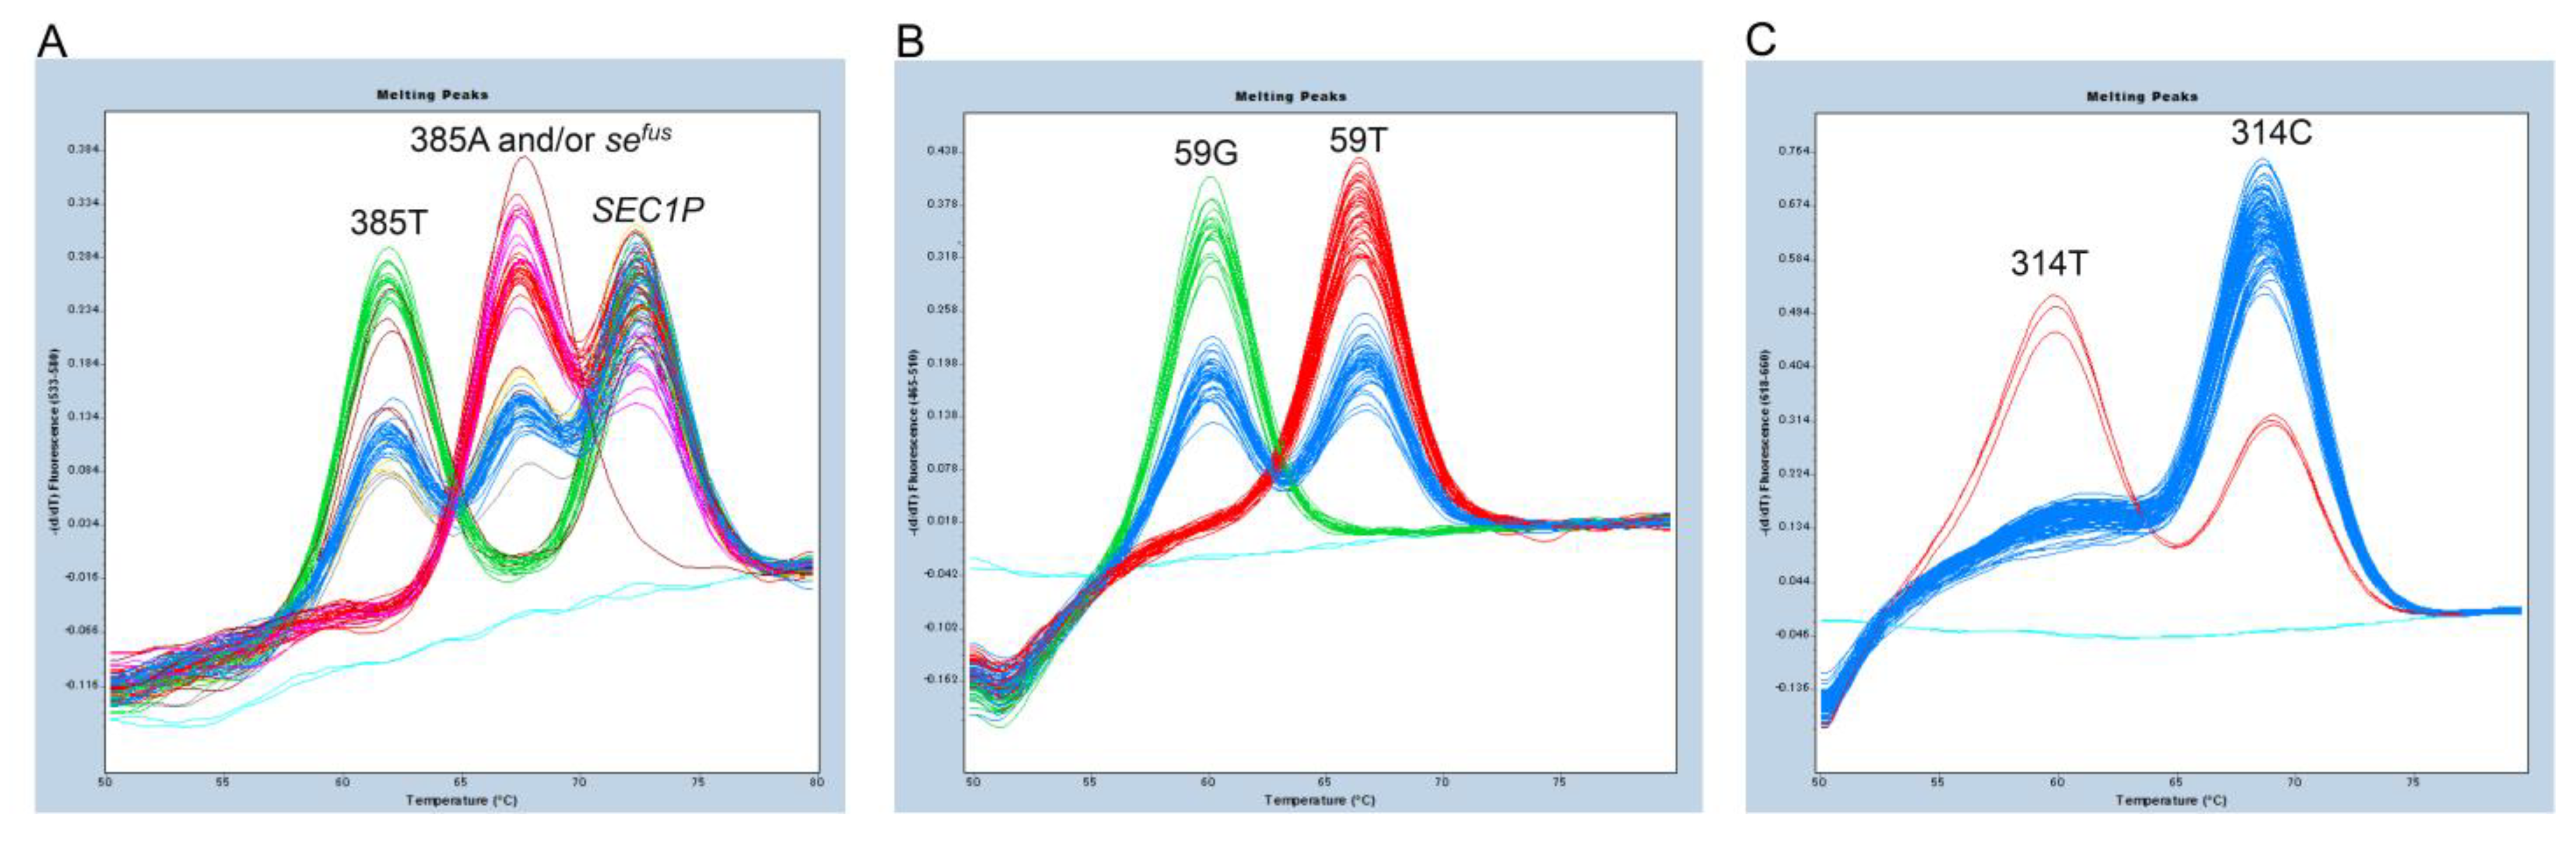
3.2. Triplex FMCA for Detection of c.385A>T and sefus of FUT2, c.59T>G and c.314C>T of FUT3

We then attempted a triplex FMCA that could estimate the Lewis blood group status of the Japanese people by adding primers and probes that detect c.59T>G and c.314C>T in FUT3 and c.385A>T and adding the sefus assay system. The melting curve genotyping results for c.385A>T and sefus from the triplex FMCA were similar to those from the single-probe FMCA with the default settings; however, unlike the single-probe FMCA, some melting peaks were divided into unknown groups (Figure 4A, shown in brown) when the score threshold was increased. Therefore, automatic discrimination by a software is difficult, but it seems possible to separate them by manual visual discrimination. This was possible because, as described above, the peak height corresponding to SEC1P in sefus heterozygotes was relatively lower than the peak height corresponding to SEC1P in subjects without sefus. On the other hand, c.59T>G and c.314C>T were clearly separated automatically, as described previously (Figure 4B,C). The FUT3 genotyping results of conducting a FMCA of 96 Japanese people were as follows: 35 were 59T/T, 43 were 59T/G, and 18 were 59G/G, while 93 were 314C/C and three were 314C/T.
Table 1 shows the FUT2 and FUT3 genotypes, secretor status, and Lewis blood group status of the 96 Japanese subjects estimated by the present triplex FMCA. Thus, by the FMCA, 60 of the 96 Japanese subjects were estimated to be Lewis-positive secretors with a Lewis phenotype of Le(a-b+); 16 were Lewis-positive weak secretors of Le(a+b+), one was a Lewis-positive non-secretor of Le(a+b-), and 19 were Lewis-negative subjects of Le(a-b-). In addition, 11 of the 19 people with a phenotype of Le(a-b-) were estimated to be secretors and 8 were estimated to be weak secretors.. Incidentally, conventional serological Lewis phenotyping is somewhat difficult because it depends largely on the strength and specificity of the anti-Lea and anti-Leb antibodies used and the skill of the observer [29]. In fact, in a previous study in which we analyzed the FUT2 of the same subjects used in this study, we misdiagnosed the serological Lewis phenotype Le(a+b+) as Le(a+b-) [5]. This may have been due to the specificity of the anti-Leb antibody used. Thus, we classified Le(a+b-) subjects as being of the Se enzyme-deficient phenotype, which includes both weak secretors and non-secretors. In any case, with the exception of one subject (as mentioned above), the previous Lewis phenotyping results were also compatible with the estimate of the Lewis phenotype made by the FMCA.

4. Discussion

Several real-time PCR based methods were developed to identify c.385A>T or sefus individually, including high-resolution melting (HRM) analysis and a TaqMan (hydrolysis probe) assay [19,27,28,30]. In this study, we developed an FMCA method to detect c.385A>T and sefus by an asymmetric PCR using a single probe. The probe-based FMCA showed significant Tm change (about 5–6 °C) between a wild type (385A) allele and/or sefus, and between a mutant type (385T) allele and SEC1P. Thus, this single-probe assay accurately determined 385A>T substitution. sefus was found almost solely in the Japanese population with a frequency of 5–9% [19], and thus, 11 of the 96 Japanese subjects were sefus heterozygotes (nine subjects were 385A/sefus, two subjects were 385T/sefus) in this study. As described previously, an artificial recombinant of SEC1P and FUT2 was generated during PCR amplification when a relatively small fragment specific to the sefus sequence was amplified [28]. To avoid the production of an artificial recombinant of SEC1P and FUT2, we selected primers that had amplified sefus and SEC1P in the previous studies [19,28], and that amplified sefus, SEC1P, and FUT2 in the present study. The present method has an advantage over the previous methods, which could only detect c.385A>T or sefus, in that it can simultaneously detect sefus and the c.385A>T of FUT2 in a single assay.
Because the sefus allele contains the 3′ region of the wild-type FUT2 sequence, it was previously misidentified as a functional 385A allele when c.385A>T was genotyped using primers that specifically amplified the FUT2 sequence surrounding 385A>T [19,28]. In the present study, in fact, the Tm value of the sefus signal was also the same as that of the 385A allele signal, but since a chromosome with sefus lacks SEC1P, it appeared that the zygosity of sefus could be determined by the peak height of the SEC1P signal. Namely, sefus/sefus lacked the SEC1P signal and sefus heterozygotes had relatively lower peak SEC1P signal height. The relatively lower peak SEC1P signal height of in the sefus heterozygotes could not be detected by the software of the real-time PCR instrument used with the default settings for melting curve genotyping. According to the instrument manual (LightCycler 480 Instrument Operator’s Manual), ‘score’ is an index of the similarity between the melting curves of a sample and the melting curve of the standard that is most similar to the sample, and ‘resolution’ is the index of the dissimilarity between the melting curve of the sample and the melting curve of the second most similar standard. Therefore, subtle differences in the relatively lower peak SEC1P signal height in the sefus heterozygotes could have been detected by increasing the score threshold and decreasing the resolution threshold from the default settings.
In addition, we developed a triplex FMCA prodcedure that could simultaneously detect the c.385A>T and sefus of FUT2 and the c.59T>G and c.314C>T of FUT3. Because the resolution was somewhat lower for the triplex FMCA than for the single-probe FMCA, it was difficult to automatically separate the six genotype combinations using the software. Nevertheless, it was possible to first separate them into four groups, sefus/sefus, 385T/T, 385A/A plus 385A/sefus, and 385A/T plus 385T/sefus, by the default settings, and then 385A/A was further separated from 385A/sefus and 385A/T from 385T/sefus by manually observing the relative peak SEC1P signal heights. Therefore, we could estimate not only secretor status but also Lewis blood group status in a single assay.
The c.375A>G (synonymous SNP, rs1800026) of FUT2 has been observed in African and Oceanian populations [31,32]. The FUT2 allele with this SNP would be determined as SEC1P in the present method. However, in other populations, including the Japanese population, this SNP seems to be rarely observed. Therefore, such a misdiagnosis is unlikely to occur in the genotyping of Japanese subjects. A limitation of the present method is that it cannot detect rare known se alleles such as se571 and se628 and rare unknown se and le alleles. In fact, we misdiagnosed one se628 allele as a functional allele by the present method. In addition, this method is useful almost exclusively for Japanese populations.
Sanger sequencing, the golden standard for the determination of SNPs, can detect these rare se alleles. However, compared to Sanger sequencing, for the whole coding region of FUT2, the present FMCA method is simple, cost-effective, and rapid, making it suitable for high-throughput analysis [33]. In addition, it is impossible to detect se alleles generated by non-allelic homologous recombination such as sefus by Sanger sequencing for the whole coding region of FUT2. Therefore, the probe-based FMCA procedure used in this study may have some advantages over Sanger sequencing.
The association between phenotypic polymorphisms of blood types, as represented by the ABO blood group, and specific diseases has been analyzed in the past by case-control studies, but few reports have shown an association of those with specific symptoms such as the presence of duodenal ulcers [34]. On the other hand, recent large-scale analyses using genomic DNA, including genome-wide association studies (GWAS), have revealed associations between SNPs in blood group genes and various unexpected diseases. Typical examples include the association of the ABO blood group gene polymorphisms with pancreatic cancer and thromboembolic and arterial disease [35,36]. Although the mechanisms by which blood group polymorphisms are involved in the pathogenesis of each of these diseases remain to be elucidated, the identification of associations with known genetic polymorphisms that seem to be unrelated to disease is one of the advantages of large-scale GWAS. As further analyses are conducted, it is possible that more diseases or clinical conditions will be found to be associated with secretor status and Lewis blood group.
Furthermore, while serological Lewis phenotyping could not determine the secretory status of Lewis-negative subjects, i.e., those without Le(a-b-), FUT2 genotyping could determine the secretory status of Lewis-negative subjects. A recent study suggested that red cells with Lewis a phenotype displayed strongly reduced SARS-CoV2-susceptibility [37]. However, as mentioned above, serological Lewis phenotyping is somewhat difficult. Thus, the estimation of Lewis phenotypes by reliable FUT2 and FUT3 genotyping is a useful alternative method for phenotyping, and the FMCA method used here appears to be a valid and feasible method for large-scale association studies of both secretor status and Lewis blood group status in Japanese populations.

Author Contributions

Conceptualization, Y.K.; methodology, Y.K.; investigation, M.S.; resources, M.S. and Y.K.; writing—original draft preparation, M.S.; writing—review and editing, Y.K.; supervision, Y.K. All authors have read and agreed to the published version of the manuscript.

Funding

This research received no external funding.

Institutional Review Board Statement

The study was conducted in accordance with the Declaration of Helsinki, and approved by the ethical committee of Kurume University (approval no. 22158, approved date: 31 October 2022).

Informed Consent Statement

The need for patient consent was waived due to the use of existing and already anonymized DNA samples.

Data Availability Statement

The data presented in this study are available on request from the corresponding author.

Acknowledgments

We thank Katherine Ono for editing the English in this manuscript.

Conflicts of Interest

The authors declare no conflict of interest.

References

  1. Oriol, R.; Danilovs, J.; Hawkins, B.R. A new genetic model proposing that the Se gene is a structural gene closely linked to the H gene. Am. J. Hum. Genet. 1981, 33, 421–431. [Google Scholar]
  2. Clausen, H.; Hakomori, S. ABH and related histo-blood group antigens; immunochemical differences in carrier isotypes and their distribution. Vox Sang. 1989, 56, 1–20. [Google Scholar] [CrossRef]
  3. Daniels, G. ABO, H, and Lewis Systems. In Human Blood Groups, 3rd ed.; Daniels, G., Ed.; Wiley-Blackwell: West Sussex, UK, 2013; pp. 11–95. [Google Scholar] [CrossRef]
  4. Henry, S.; Mollicone, R.; Fernandez, P.; Samuelsson, B.; Oriol, R.; Larson, G. Molecular basis for erythrocyte Le(a+ b+) and salivary ABH partial-secretor phenotypes: Expression of a FUT2 secretor allele with an A-->T mutation at nucleotide 385 correlates with reduced alpha(1,2) fucosyltransferase activity. Glycoconj. J. 1996, 13, 985–993. [Google Scholar] [CrossRef] [PubMed]
  5. Koda, Y.; Soejima, M.; Liu, Y.; Kimura, H. Molecular basis for secretor type alpha(1,2)-fucosyltransferase gene deficiency in a Japanese population: A fusion gene generated by unequal crossover responsible for the enzyme deficiency. Am. J. Hum. Genet. 1996, 59, 343–350. [Google Scholar] [PubMed]
  6. Boren, T.; Falk, P.; Roth, K.A.; Larson, G.; Normark, S. Attachment of Helicobacter pylori to human gastric epithelium mediated by blood group antigens. Science 1993, 262, 1892–1895. [Google Scholar] [CrossRef] [PubMed]
  7. Ali, S.; Niang, M.A.; N’Doye, I.; Critchlow, C.W.; Hawes, S.E.; Hill, A.V.; Kiviat, N.B. Secretor polymorphism and human immunodeficiency virus infection in Senegalese women. J. Infect. Dis. 2000, 181, 737–739. [Google Scholar] [CrossRef]
  8. Cakir, B.; Heiss, G.; Pankow, J.S.; Salomaa, V.; Sharrett, A.R.; Couper, D.; Weston, B.W. Association of the Lewis genotype with cardiovascular risk factors and subclinical carotid atherosclerosis: The Atherosclerosis Risk in Communities (ARIC) study. J. Intern. Med. 2004, 255, 40–51. [Google Scholar] [CrossRef] [Green Version]
  9. Hazra, A.; Kraft, P.; Selhub, J.; Giovannucci, E.L.; Thomas, G.; Hoover, R.N.; Chanock, S.J.; Hunter, D.J. Common variants of FUT2 are associated with plasma vitamin B12 levels. Nat. Genet. 2008, 40, 1160–1162. [Google Scholar] [CrossRef] [Green Version]
  10. McGovern, D.P.; Jones, M.R.; Taylor, K.D.; Marciante, K.; Yan, X.; Dubinsky, M.; Ippoliti, A.; Vasiliauskas, E.; Berel, D.; Derkowski, C.; et al. Fucosyltransferase 2 (FUT2) non-secretor status is associated with Crohn’s disease. Hum. Mol. Genet. 2010, 19, 3468–3476. [Google Scholar] [CrossRef] [Green Version]
  11. Hu, D.; Zhang, D.; Zheng, S.; Guo, M.; Lin, X.; Jiang, Y. Association of Ulcerative Colitis with FUT2 and FUT3 Polymorphisms in Patients from Southeast China. PLoS ONE 2016, 11, e0146557. [Google Scholar] [CrossRef] [Green Version]
  12. Santos-Cortez, R.L.P.; Chiong, C.M.; Frank, D.N.; Ryan, A.F.; Giese, A.P.J.; Bootpetch Roberts, T.; Daly, K.A.; Steritz, M.J.; Szeremeta, W.; Pedro, M.; et al. FUT2 Variants Confer Susceptibility to Familial Otitis Media. Am. J. Hum. Genet. 2018, 103, 679–690. [Google Scholar] [CrossRef] [PubMed] [Green Version]
  13. Jiang, G.; Han, R.; Chen, M.; Liu, R.; Wu, M.; Zhang, X.; Ma, Y.; Yuan, Y.; Wang, R.; Shuai, Z.; et al. Associations between fucosyltransferase 3 gene polymorphisms and ankylosing spondylitis: A case-control study of an east Chinese population. PLoS ONE 2020, 15, e0237219. [Google Scholar] [CrossRef] [PubMed]
  14. Loureiro Tonini, M.A.; Pires Goncalves Barreira, D.M.; Bueno de Freitas Santolin, L.; Bondi Volpini, L.P.; Gagliardi Leite, J.P.; Le Moullac-Vaidye, B.; Le Pendu, J.; Cruz Spano, L. FUT2, Secretor Status and FUT3 Polymorphisms of Children with Acute Diarrhea Infected with Rotavirus and Norovirus in Brazil. Viruses 2020, 12, 1084. [Google Scholar] [CrossRef] [PubMed]
  15. Matzhold, E.M.; Berghold, A.; Bemelmans, M.K.B.; Banfi, C.; Stelzl, E.; Kessler, H.H.; Steinmetz, I.; Krause, R.; Wurzer, H.; Schlenke, P.; et al. Lewis and ABO histo-blood types and the secretor status of patients hospitalized with COVID-19 implicate a role for ABO antibodies in susceptibility to infection with SARS-CoV-2. Transfusion 2021, 61, 2736–2745. [Google Scholar] [CrossRef]
  16. Koda, Y.; Tachida, H.; Pang, H.; Liu, Y.; Soejima, M.; Ghaderi, A.A.; Takenaka, O.; Kimura, H. Contrasting patterns of polymorphisms at the ABO-secretor gene (FUT2) and plasma alpha(1,3)fucosyltransferase gene (FUT6) in human populations. Genetics 2001, 158, 747–756. [Google Scholar] [CrossRef]
  17. Ferrer-Admetlla, A.; Sikora, M.; Laayouni, H.; Esteve, A.; Roubinet, F.; Blancher, A.; Calafell, F.; Bertranpetit, J.; Casals, F. A natural history of FUT2 polymorphism in humans. Mol. Biol. Evol. 2009, 26, 1993–2003. [Google Scholar] [CrossRef] [Green Version]
  18. Soejima, M.; Fujimoto, R.; Agusa, T.; Iwata, H.; Fujihara, J.; Takeshita, H.; Minh, T.B.; Trang, P.T.; Viet, P.H.; Nakajima, T.; et al. Genetic variation of FUT2 in a Vietnamese population: Identification of two novel Se enzyme-inactivating mutations. Transfusion 2012, 52, 1268–1275. [Google Scholar] [CrossRef]
  19. Soejima, M.; Koda, Y. High-resolution melting analysis for detection of fusion allele of FUT2. Electrophoresis 2021, 42, 315–318. [Google Scholar] [CrossRef]
  20. Rouquier, S.; Lowe, J.B.; Kelly, R.J.; Fertitta, A.L.; Lennon, G.G.; Giorgi, D. Molecular cloning of a human genomic region containing the H blood group alpha(1,2)fucosyltransferase gene and two H locus-related DNA restriction fragments. Isolation of a candidate for the human Secretor blood group locus. J. Biol. Chem. 1995, 270, 4632–4639. [Google Scholar] [CrossRef] [Green Version]
  21. Kelly, R.J.; Rouquier, S.; Giorgi, D.; Lennon, G.G.; Lowe, J.B. Sequence and expression of a candidate for the human Secretor blood group alpha(1,2)fucosyltransferase gene (FUT2). Homozygosity for an enzyme-inactivating nonsense mutation commonly correlates with the non-secretor phenotype. J. Biol. Chem. 1995, 270, 4640–4649. [Google Scholar] [CrossRef] [Green Version]
  22. Henry, S.; Mollicone, R.; Fernandez, P.; Samuelsson, B.; Oriol, R.; Larson, G. Homozygous expression of a missense mutation at nucleotide 385 in the FUT2 gene associates with the Le(a+b+) partial-secretor phenotype in an Indonesian family. Biochem. Biophys. Res. Commun. 1996, 219, 675–678. [Google Scholar] [CrossRef]
  23. Moller, M.; Joud, M.; Storry, J.R.; Olsson, M.L. Erythrogene: A database for in-depth analysis of the extensive variation in 36 blood group systems in the 1000 Genomes Project. Blood Adv. 2016, 1, 240–249. [Google Scholar] [CrossRef] [Green Version]
  24. Soejima, M.; Koda, Y. Fluorescence Melting Curve Analysis for Concurrent Genotyping of Three Tag SNPs in FUT3. Diagnostics 2022, 12, 3039. [Google Scholar] [CrossRef] [PubMed]
  25. El Housni, H.; Heimann, P.; Parma, J.; Vassart, G. Single-nucleotide polymorphism genotyping by melting analysis of dual-labeled probes: Examples using factor V Leiden and prothrombin 20210A mutations. Clin. Chem. 2003, 49, 1669–1672. [Google Scholar] [CrossRef] [PubMed] [Green Version]
  26. Huang, Q.; Liu, Z.; Liao, Y.; Chen, X.; Zhang, Y.; Li, Q. Multiplex fluorescence melting curve analysis for mutation detection with dual-labeled, self-quenched probes. PLoS ONE 2011, 6, e19206. [Google Scholar] [CrossRef] [PubMed]
  27. Soejima, M.; Koda, Y. Detection of the weak-secretor rs1047781 (385A>T) single nucleotide polymorphism using an unlabeled probe high-resolution melting-based method. Electrophoresis 2021, 42, 1362–1365. [Google Scholar] [CrossRef]
  28. Soejima, M.; Koda, Y. TaqMan real-time polymerase chain reaction for detection of SEC1-FUT2 hybrid alleles: Identification of novel hybrid allele. Clin. Chim. Acta 2013, 415, 59–62. [Google Scholar] [CrossRef]
  29. Good, A.H.; Yau, O.; Lamontagne, L.R.; Oriol, R. Serological and chemical specificities of twelve monoclonal anti-Lea and anti-Leb antibodies. Vox Sang. 1992, 62, 180–189. [Google Scholar] [CrossRef]
  30. Hutson, A.M.; Airaud, F.; LePendu, J.; Estes, M.K.; Atmar, R.L. Norwalk virus infection associates with secretor status genotyped from sera. J. Med. Virol. 2005, 77, 116–120. [Google Scholar] [CrossRef]
  31. Koda, Y.; Ishida, T.; Tachida, H.; Wang, B.; Pang, H.; Soejima, M.; Soemantri, A.; Kimura, H. DNA sequence variation of the human ABO-secretor locus (FUT2) in New Guinean populations: Possible early human migration from Africa. Hum. Genet. 2003, 113, 534–541. [Google Scholar] [CrossRef]
  32. Soejima, M.; Pang, H.; Koda, Y. Genetic variation of FUT2 in a Ghanaian population: Identification of four novel mutations and inference of balancing selection. Ann. Hematol. 2007, 86, 199–204. [Google Scholar] [CrossRef] [PubMed]
  33. Hippman, C.; Nislow, C. Pharmacogenomic Testing: Clinical Evidence and Implementation Challenges. J. Pers. Med. 2019, 9, 40. [Google Scholar] [CrossRef] [Green Version]
  34. Risch, N.J. Searching for genetic determinants in the new millennium. Nature 2000, 405, 847–856. [Google Scholar] [CrossRef]
  35. Amundadottir, L.; Kraft, P.; Stolzenberg-Solomon, R.Z.; Fuchs, C.S.; Petersen, G.M.; Arslan, A.A.; Bueno-de-Mesquita, H.B.; Gross, M.; Helzlsouer, K.; Jacobs, E.J.; et al. Genome-wide association study identifies variants in the ABO locus associated with susceptibility to pancreatic cancer. Nat. Genet. 2009, 41, 986–990. [Google Scholar] [CrossRef] [Green Version]
  36. Vasan, S.K.; Rostgaard, K.; Majeed, A.; Ullum, H.; Titlestad, K.E.; Pedersen, O.B.; Erikstrup, C.; Nielsen, K.R.; Melbye, M.; Nyren, O.; et al. ABO Blood Group and Risk of Thromboembolic and Arterial Disease: A Study of 1.5 Million Blood Donors. Circulation 2016, 133, 1449–1457, discussion 1457. [Google Scholar] [CrossRef] [PubMed]
  37. Moslemi, C.; Saekmose, S.; Larsen, R.; Brodersen, T.; Didriksen, M.; Hjalgrim, H.; Banasik, K.; Nielsen, K.R.; Bruun, M.T.; Dowsett, J.; et al. A large cohort study of the effects of Lewis, ABO, 13 other blood groups, and secretor status on COVID-19 susceptibility, severity, and long COVID-19. Transfusion 2023, 63, 47–58. [Google Scholar] [CrossRef] [PubMed]
Figure 1. Genomic structure of FUT2, SEC1P, and sefus, and primer and probe positions used (A). The protein coding region of FUT2 (FUT2-385A and FUT2-385T) is indicated by a blue box, that of SECIP is indicated by a green box, and that of sefus is indicated by green and blue boxes. The relative positions of the primers and probe anneal are indicated by black arrows, and the probe is indicated, in black combined with a fluorophore labeled at the 5′ end and a quencher labeled at the 3′ end. Nucleotides that differ from the sequence of the probe are indicated by red letters. Alignment of DNA sequences of amplified regions in FMCA; DNA sequences of FUT2 (FUT2-385A: allele of A at rs1047781; FUT2-385T: allele of T at rs1047781; FUSION: sefus allele) and corresponding regions of SEC1P, are indicated (B). Forward primer and reverse primer sequences are shown in bold. The probe sequence is indicated by orange boxes and nucleotides that differ from the sequence of probe are uncolored.
Diagnostics 13 00931 g001
Figure 2. Melting peak profiles of FMCA for detection of c.385A>T and sefus. Six Japanese (A) and 96 Japanese subjects (B) whose FUT2 genotypes were already determined were selected. The subjects with genotypes 385A/A (red), 385T/T (green), sefus/sefus (gray), 385A/T (blue), 385A/sefus (pink), and 385T/sefus (yellow) were clearly identified. The negative control is shown in light blue.
Diagnostics 13 00931 g002
Figure 3. Melting peak profiles of FMCA for four selected subjects with or without sefus. Melting peak profiles of 385A/A (A), 385A/sefus (B), 385A/T (C), and 385T/sefus (D). The copy number ratio of each peak is indicated.
Diagnostics 13 00931 g003
Figure 4. Melting peak profiles of triplex FMCA of 96 Japanese subjects. (A) Results for detection of c.385A>T and sefus of FUT2. The subjects with genotypes between 385A/A and 385A/sefus and between 385A/T and 385T/sefus were not completely separated automatically. The unknown group is indicated in brown. Light blue indicates the negative control. (B) Results of detection of c.59T>G of FUT3. The subjects with genotypes of 59T/T are shown in red, those with genotypes of 59T/G in blue, those with genotypes of 59G/G in green. The negative control is shown in light blue. (C) Results for detection of c.314C>T of FUT3. The subjects with genotypes of 314C/C are shown in blue, those with genotypes of 314C/T in red. The negative control is shown in light blue.
Diagnostics 13 00931 g004
Table 1. FUT2 and FUT3 genotypes and secretors and Lewis blood group phenotypes estimated by the triplex FMCA.
c.385A>TFusion GeneFUT2
Genotype
Secretor
Phenotype
c.59T>Gc.314C>TFUT3
Genotype
Lewis
Phenotype
Number
A/A-Se/SeSecretorT/TC/CLe/LeLe(a-b+)11
C/TLe/le202,314Le(a-b+)2
T/GC/CLe/le59Le(a-b+)7
C/Tle59/le202,314Le(a-b-)1
G/GC/Cle59/le59Le(a-b-)3
A/T-Se/SewSecretorT/TC/CLe/LeLe(a-b+)13
T/GC/CLe/le59Le(a-b+)19 *
G/GC/Cle59/le59Le(a-b-)6
T/T-Sew/SewWeak secretorT/TC/CLe/LeLe(a+b+)9
T/GC/CLe/le59Le(a+b+)5
G/GC/Cle59/le59Le(a-b-)8
A/Aone copySe/sefusSecretorT/TC/CLe/LeLe(a-b+)2
T/GC/CLe/le59Le(a-b+)6
G/GC/Cle59/le59Le(a-b-)1
T/Tone copySew/sefusWeak secretorT/GC/CLe/le59Le(a+b+)2
A/Atwo copiessefus/sefusNon-secretorT/GC/CLe/le59Le(a+b-)1
* One weak secretor with genotypes Sew/se628, estimated by Sanger sequencing analysis, was misdiagnosed as Se/Sew by this FMCA because the nucleotide at position 385 of se628 is an “A”; le59 includes le59, le59,508, and le59,1067.
Disclaimer/Publisher’s Note: The statements, opinions and data contained in all publications are solely those of the individual author(s) and contributor(s) and not of MDPI and/or the editor(s). MDPI and/or the editor(s) disclaim responsibility for any injury to people or property resulting from any ideas, methods, instructions or products referred to in the content.

