
Comparison of Ultra-Magnifying Endocytoscopic and Hematoxylin-Eosin-Stained Images of Lung Specimens
 , , , ,
Abstract
:1. Introduction
2. Materials and Methods
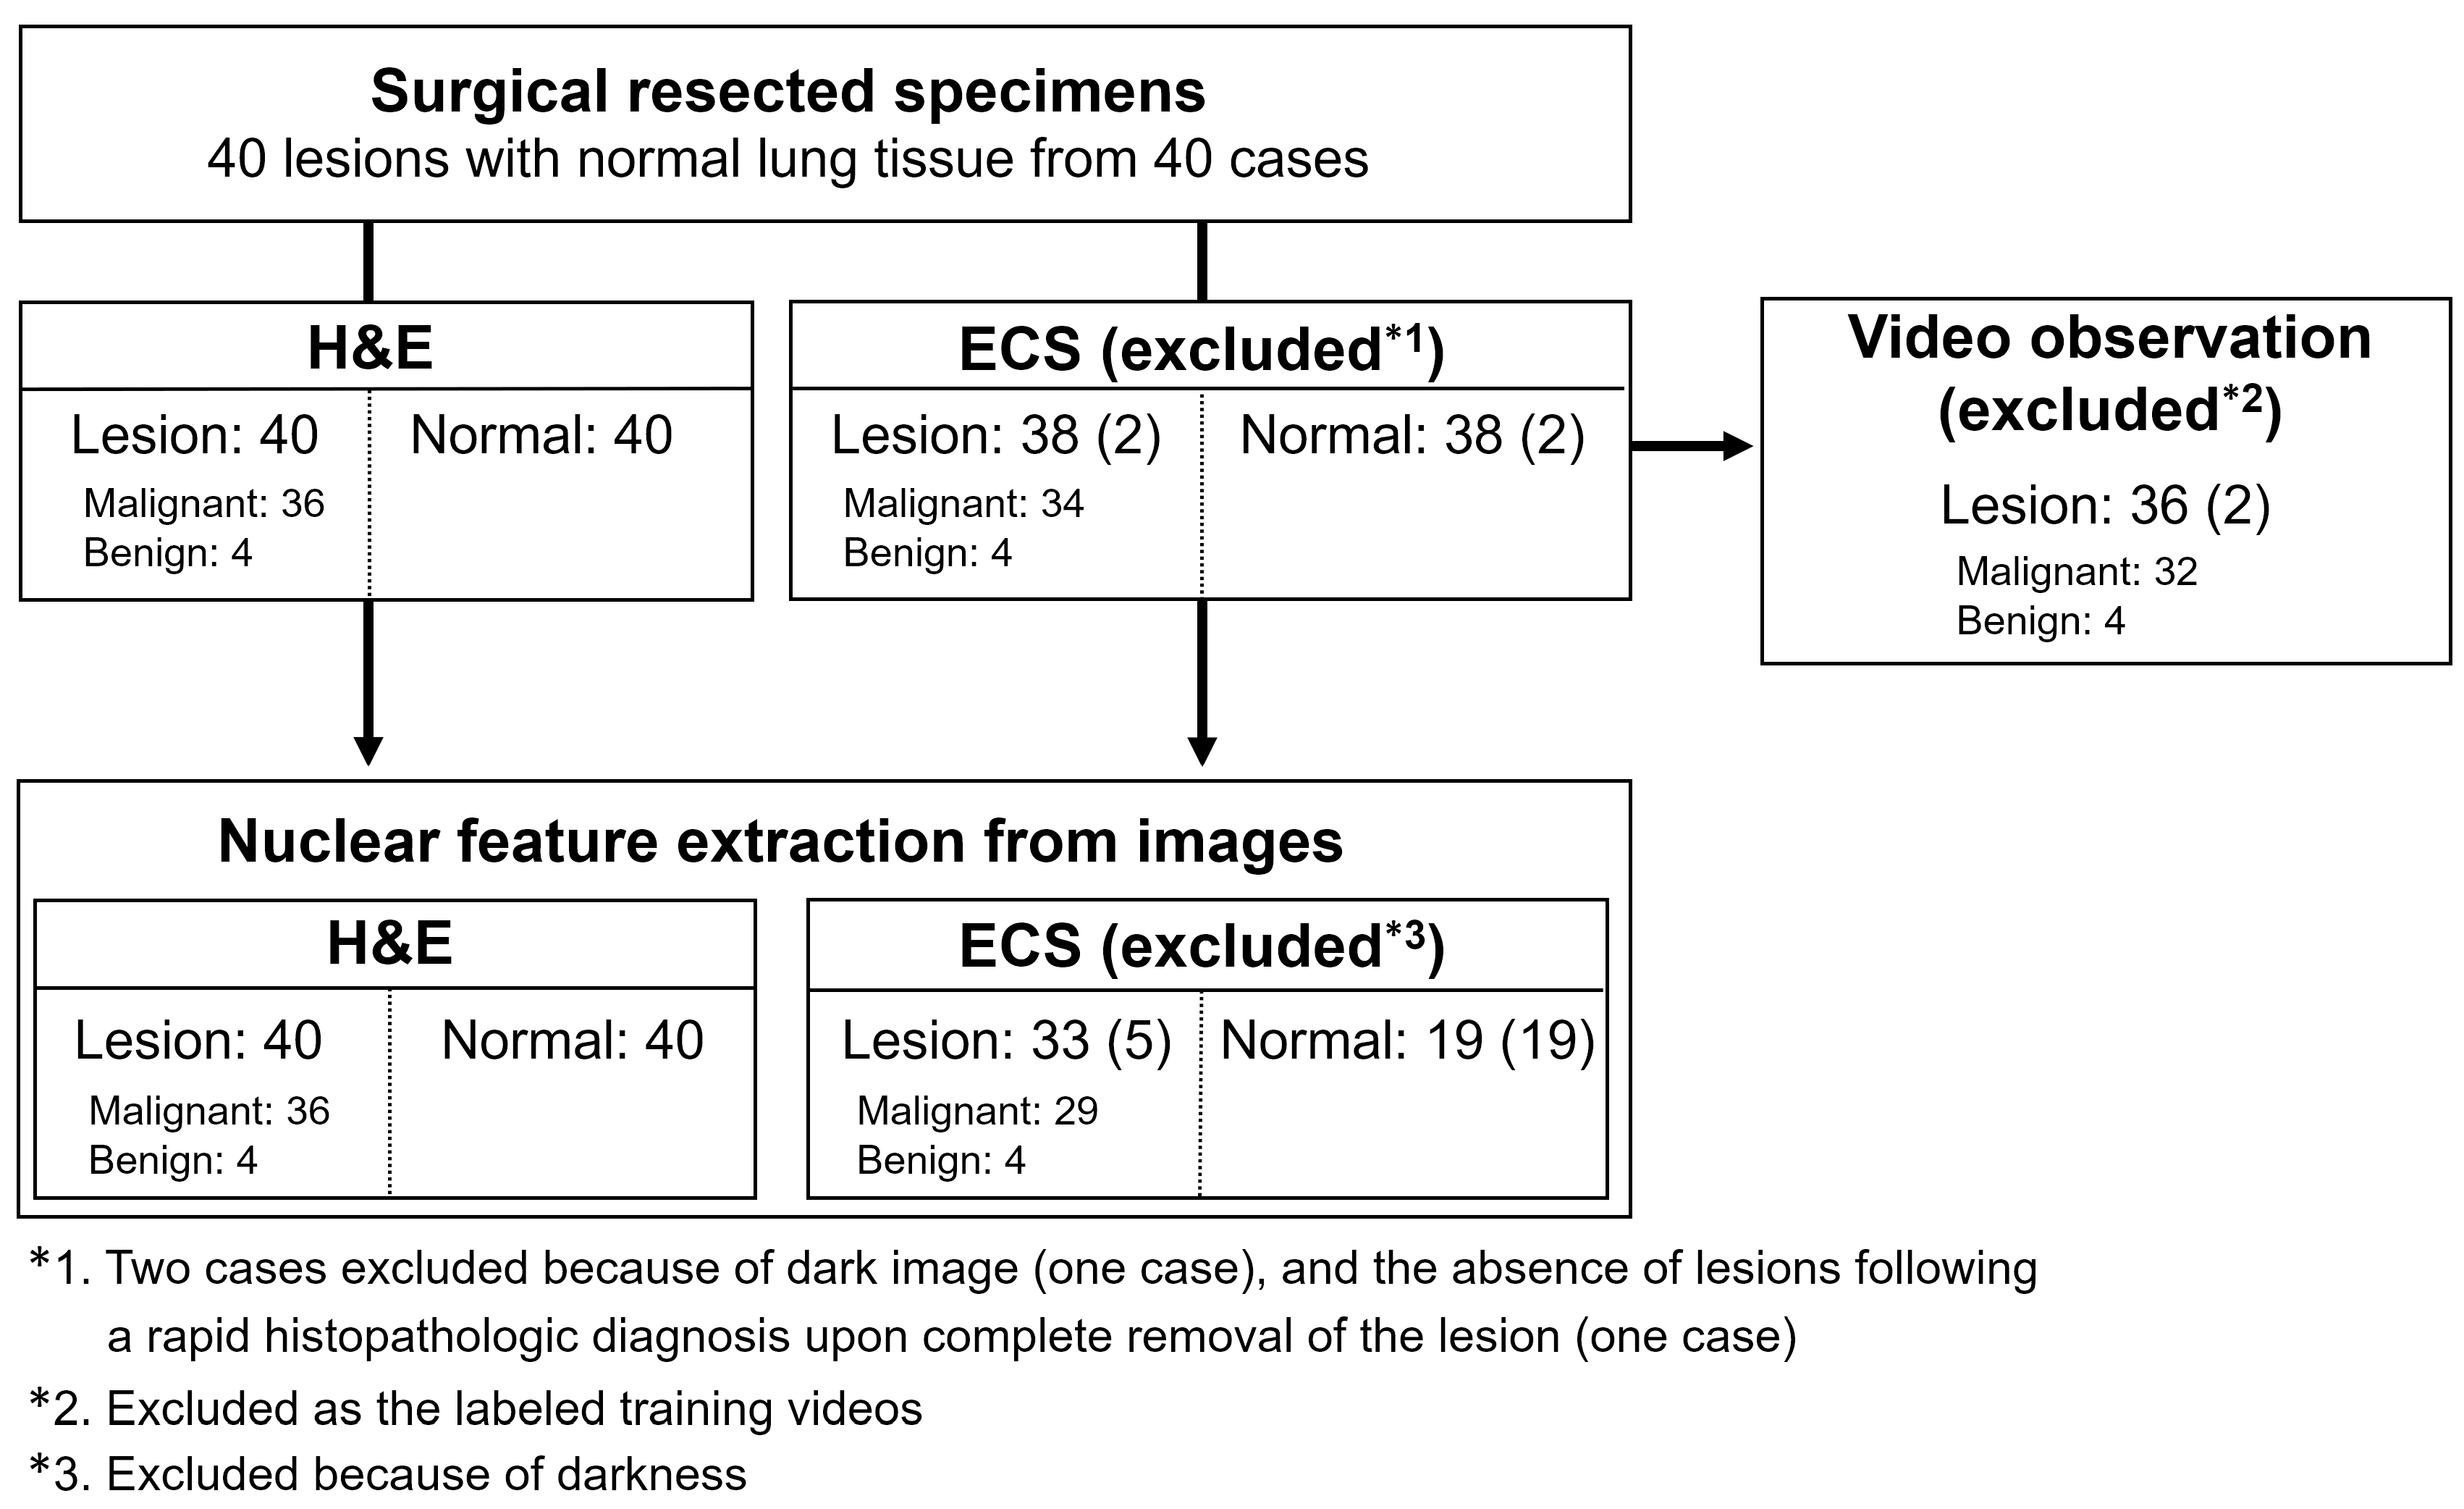
2.1. Study Design
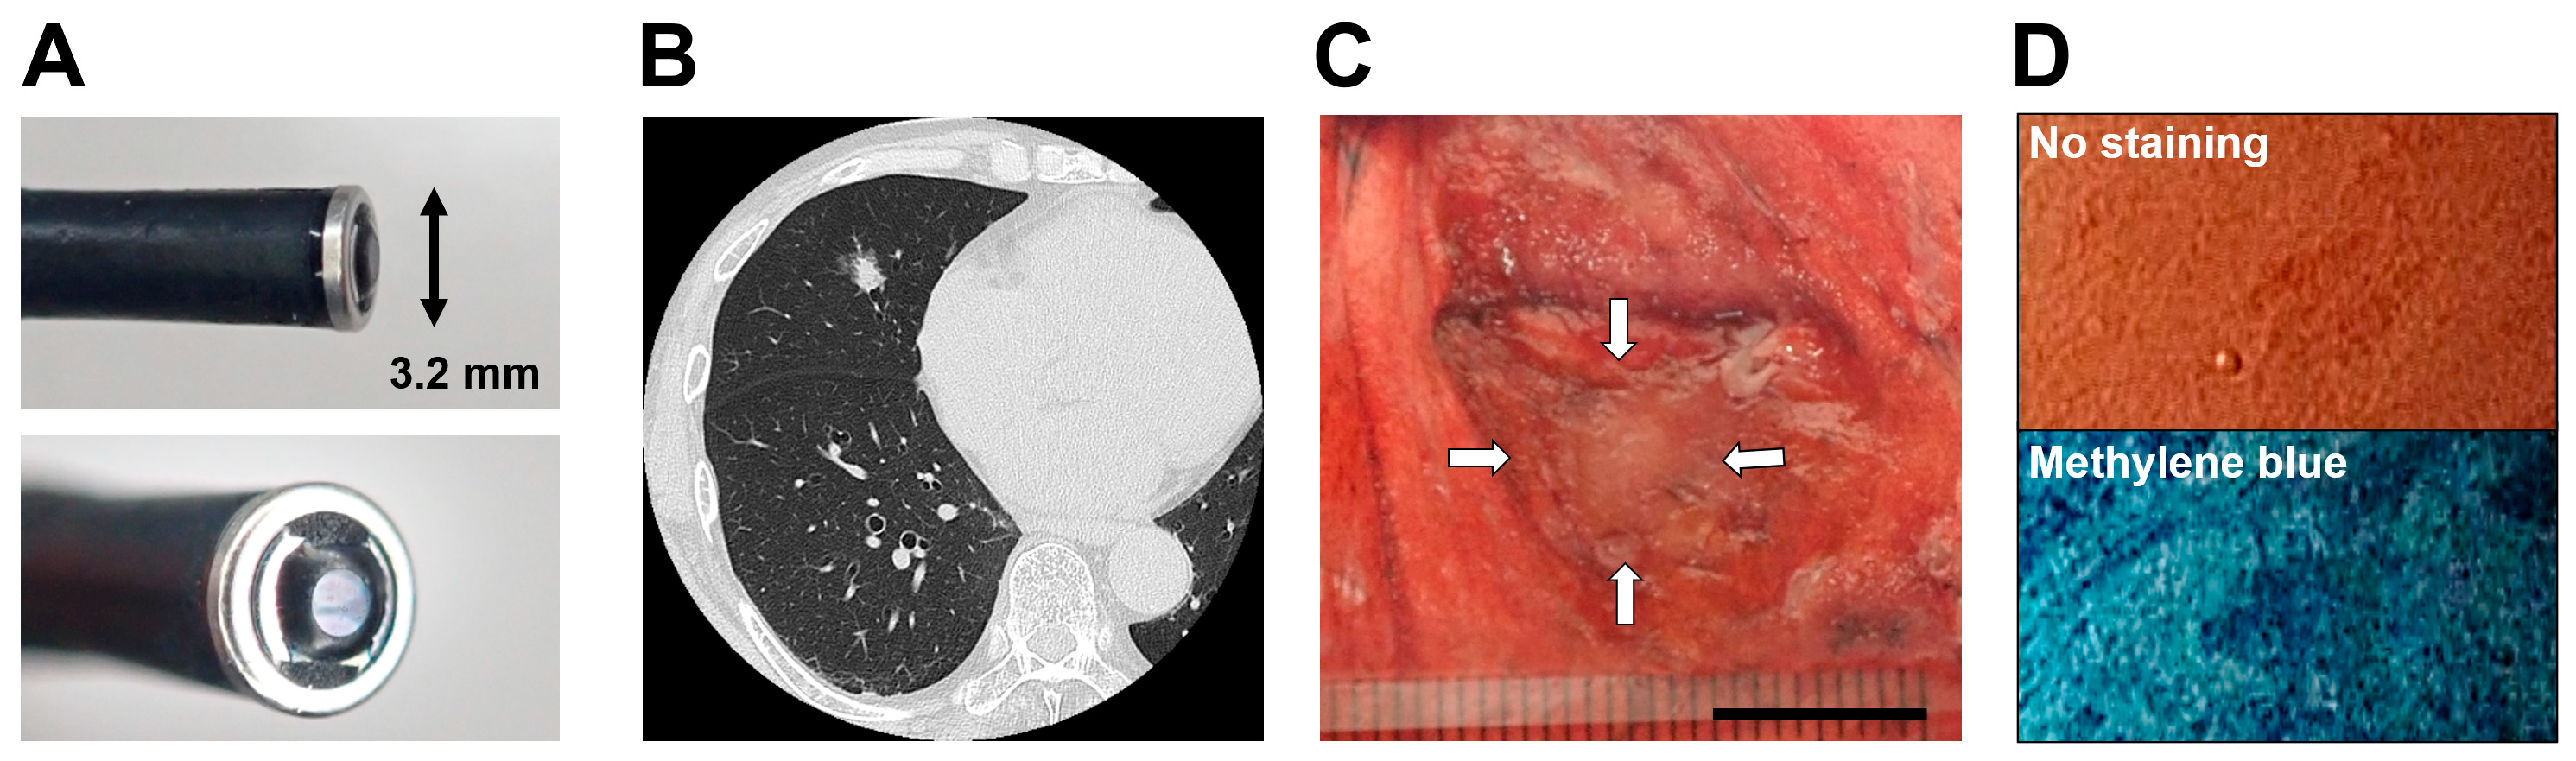
2.2. Endocytoscopy
2.3. Acquisition of the Endocytoscopic Images
2.4. Analyzing Nuclear Features
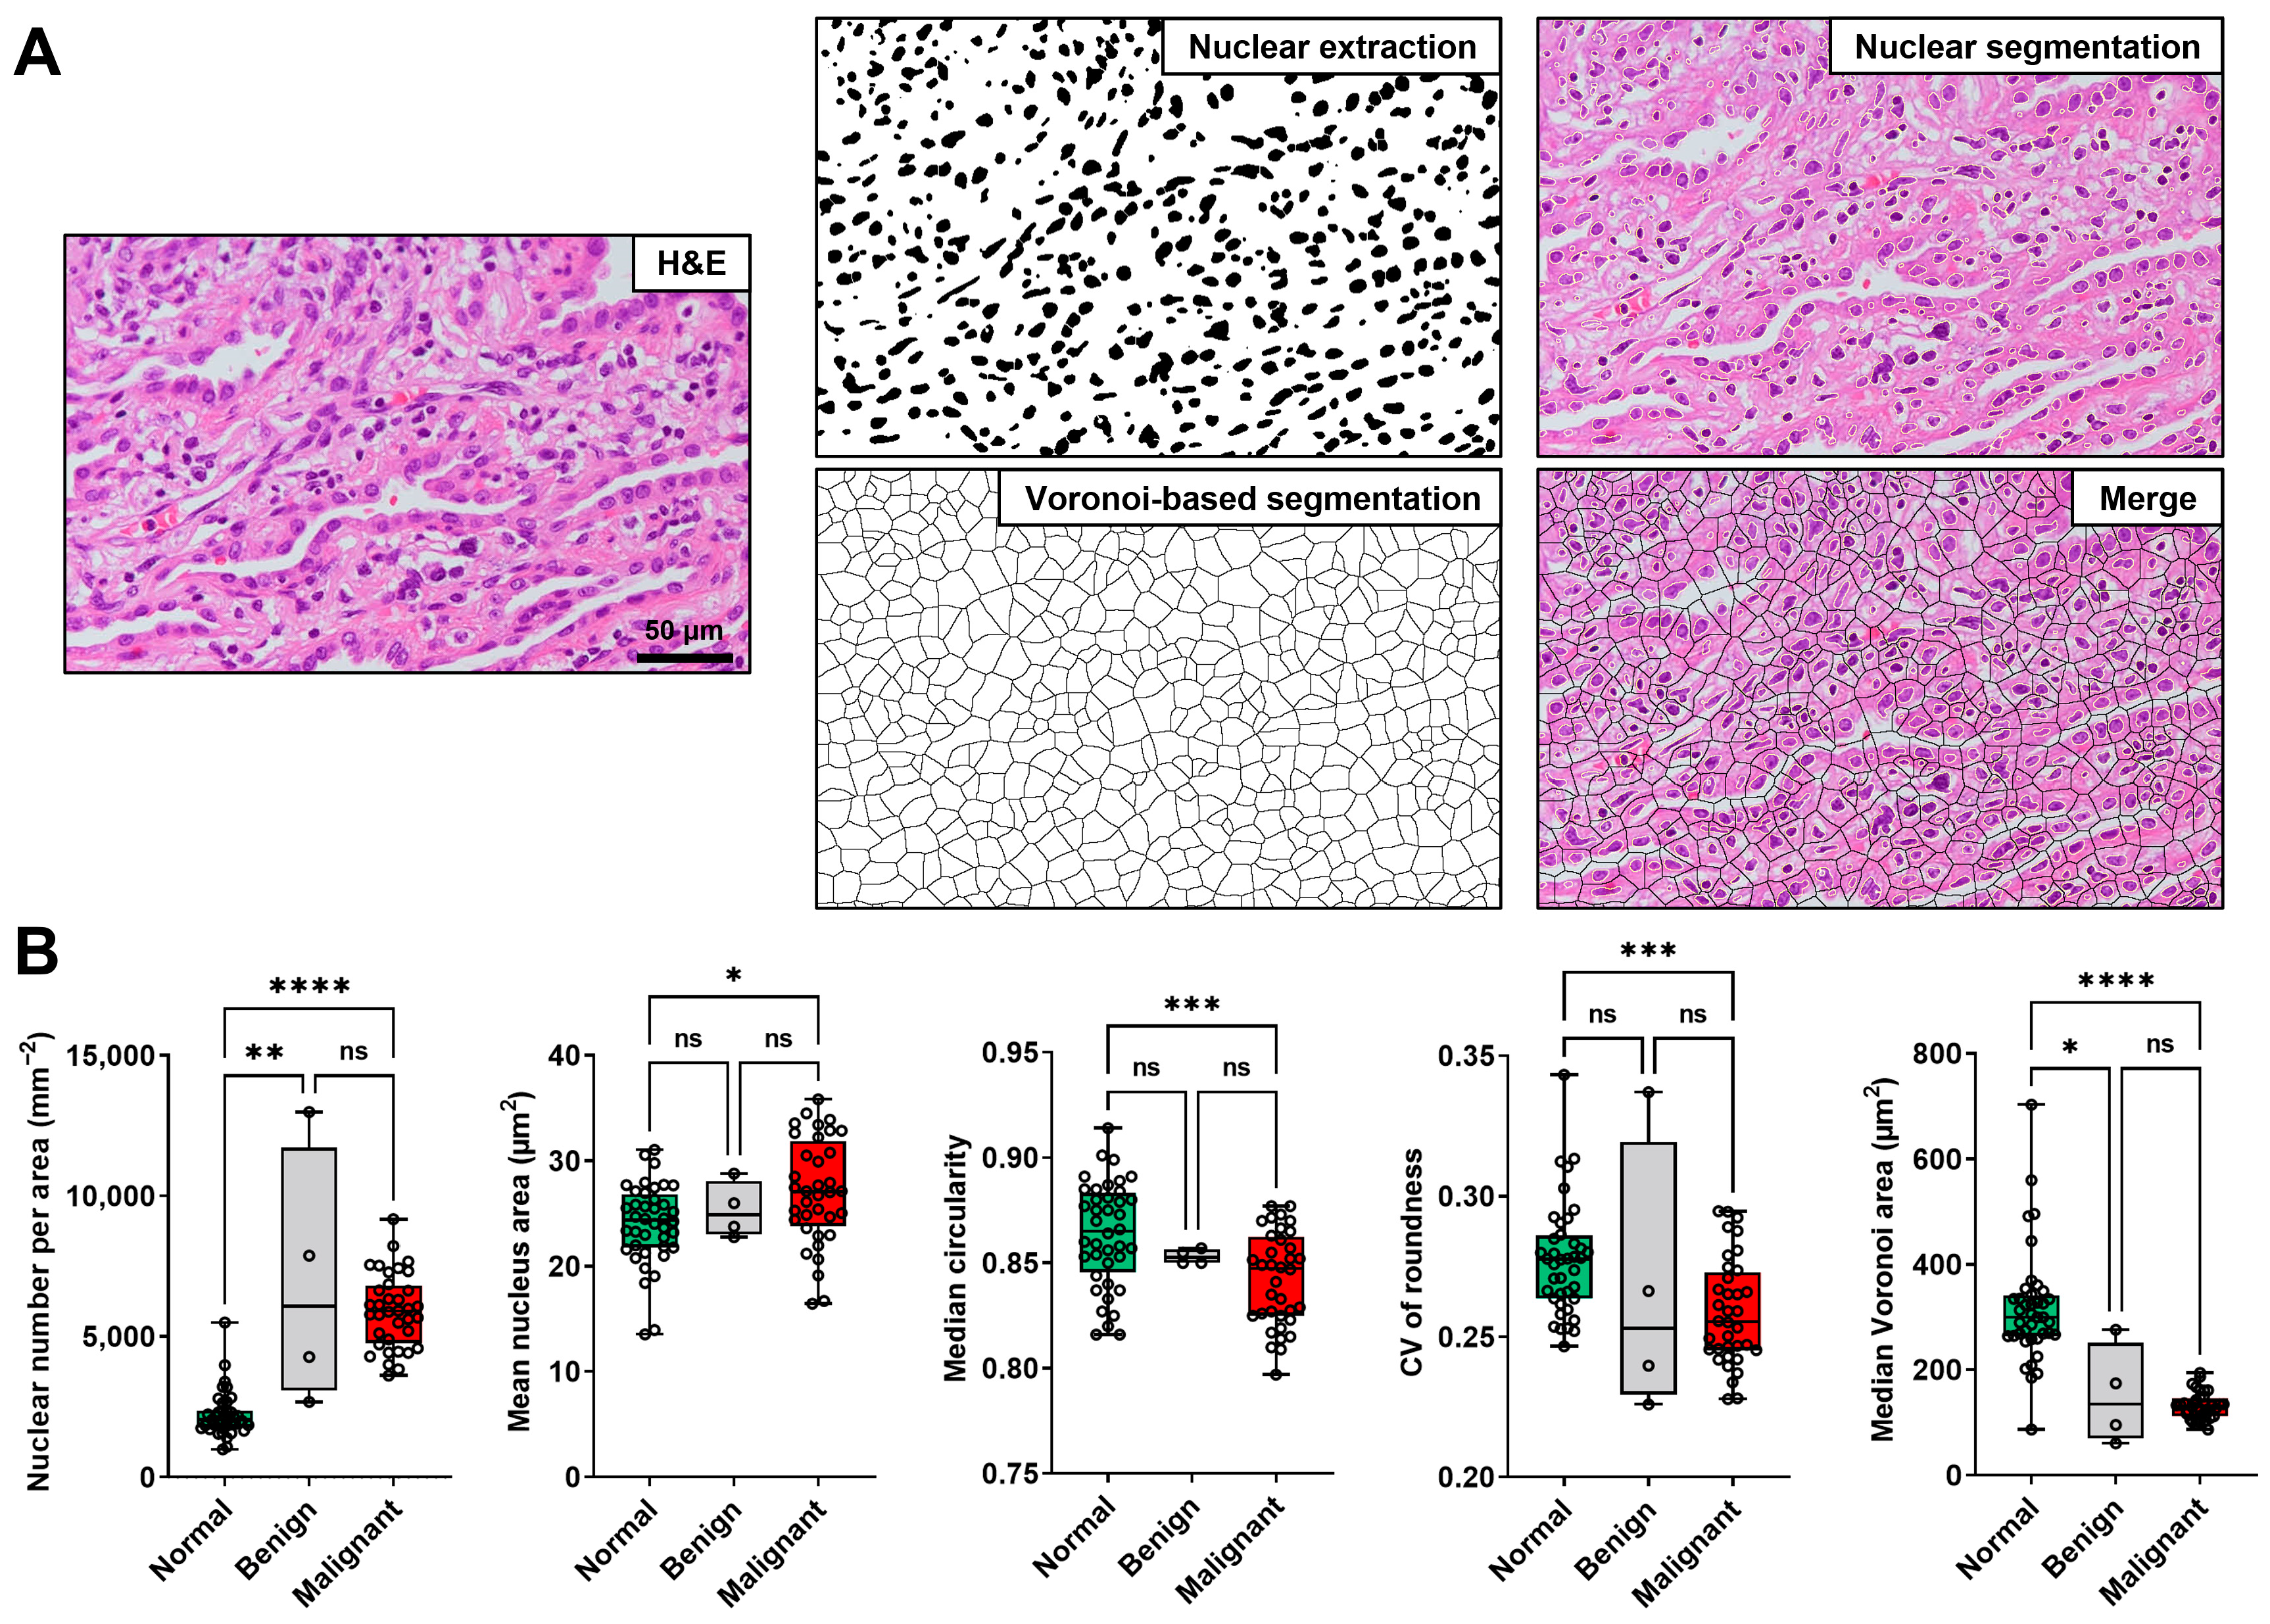
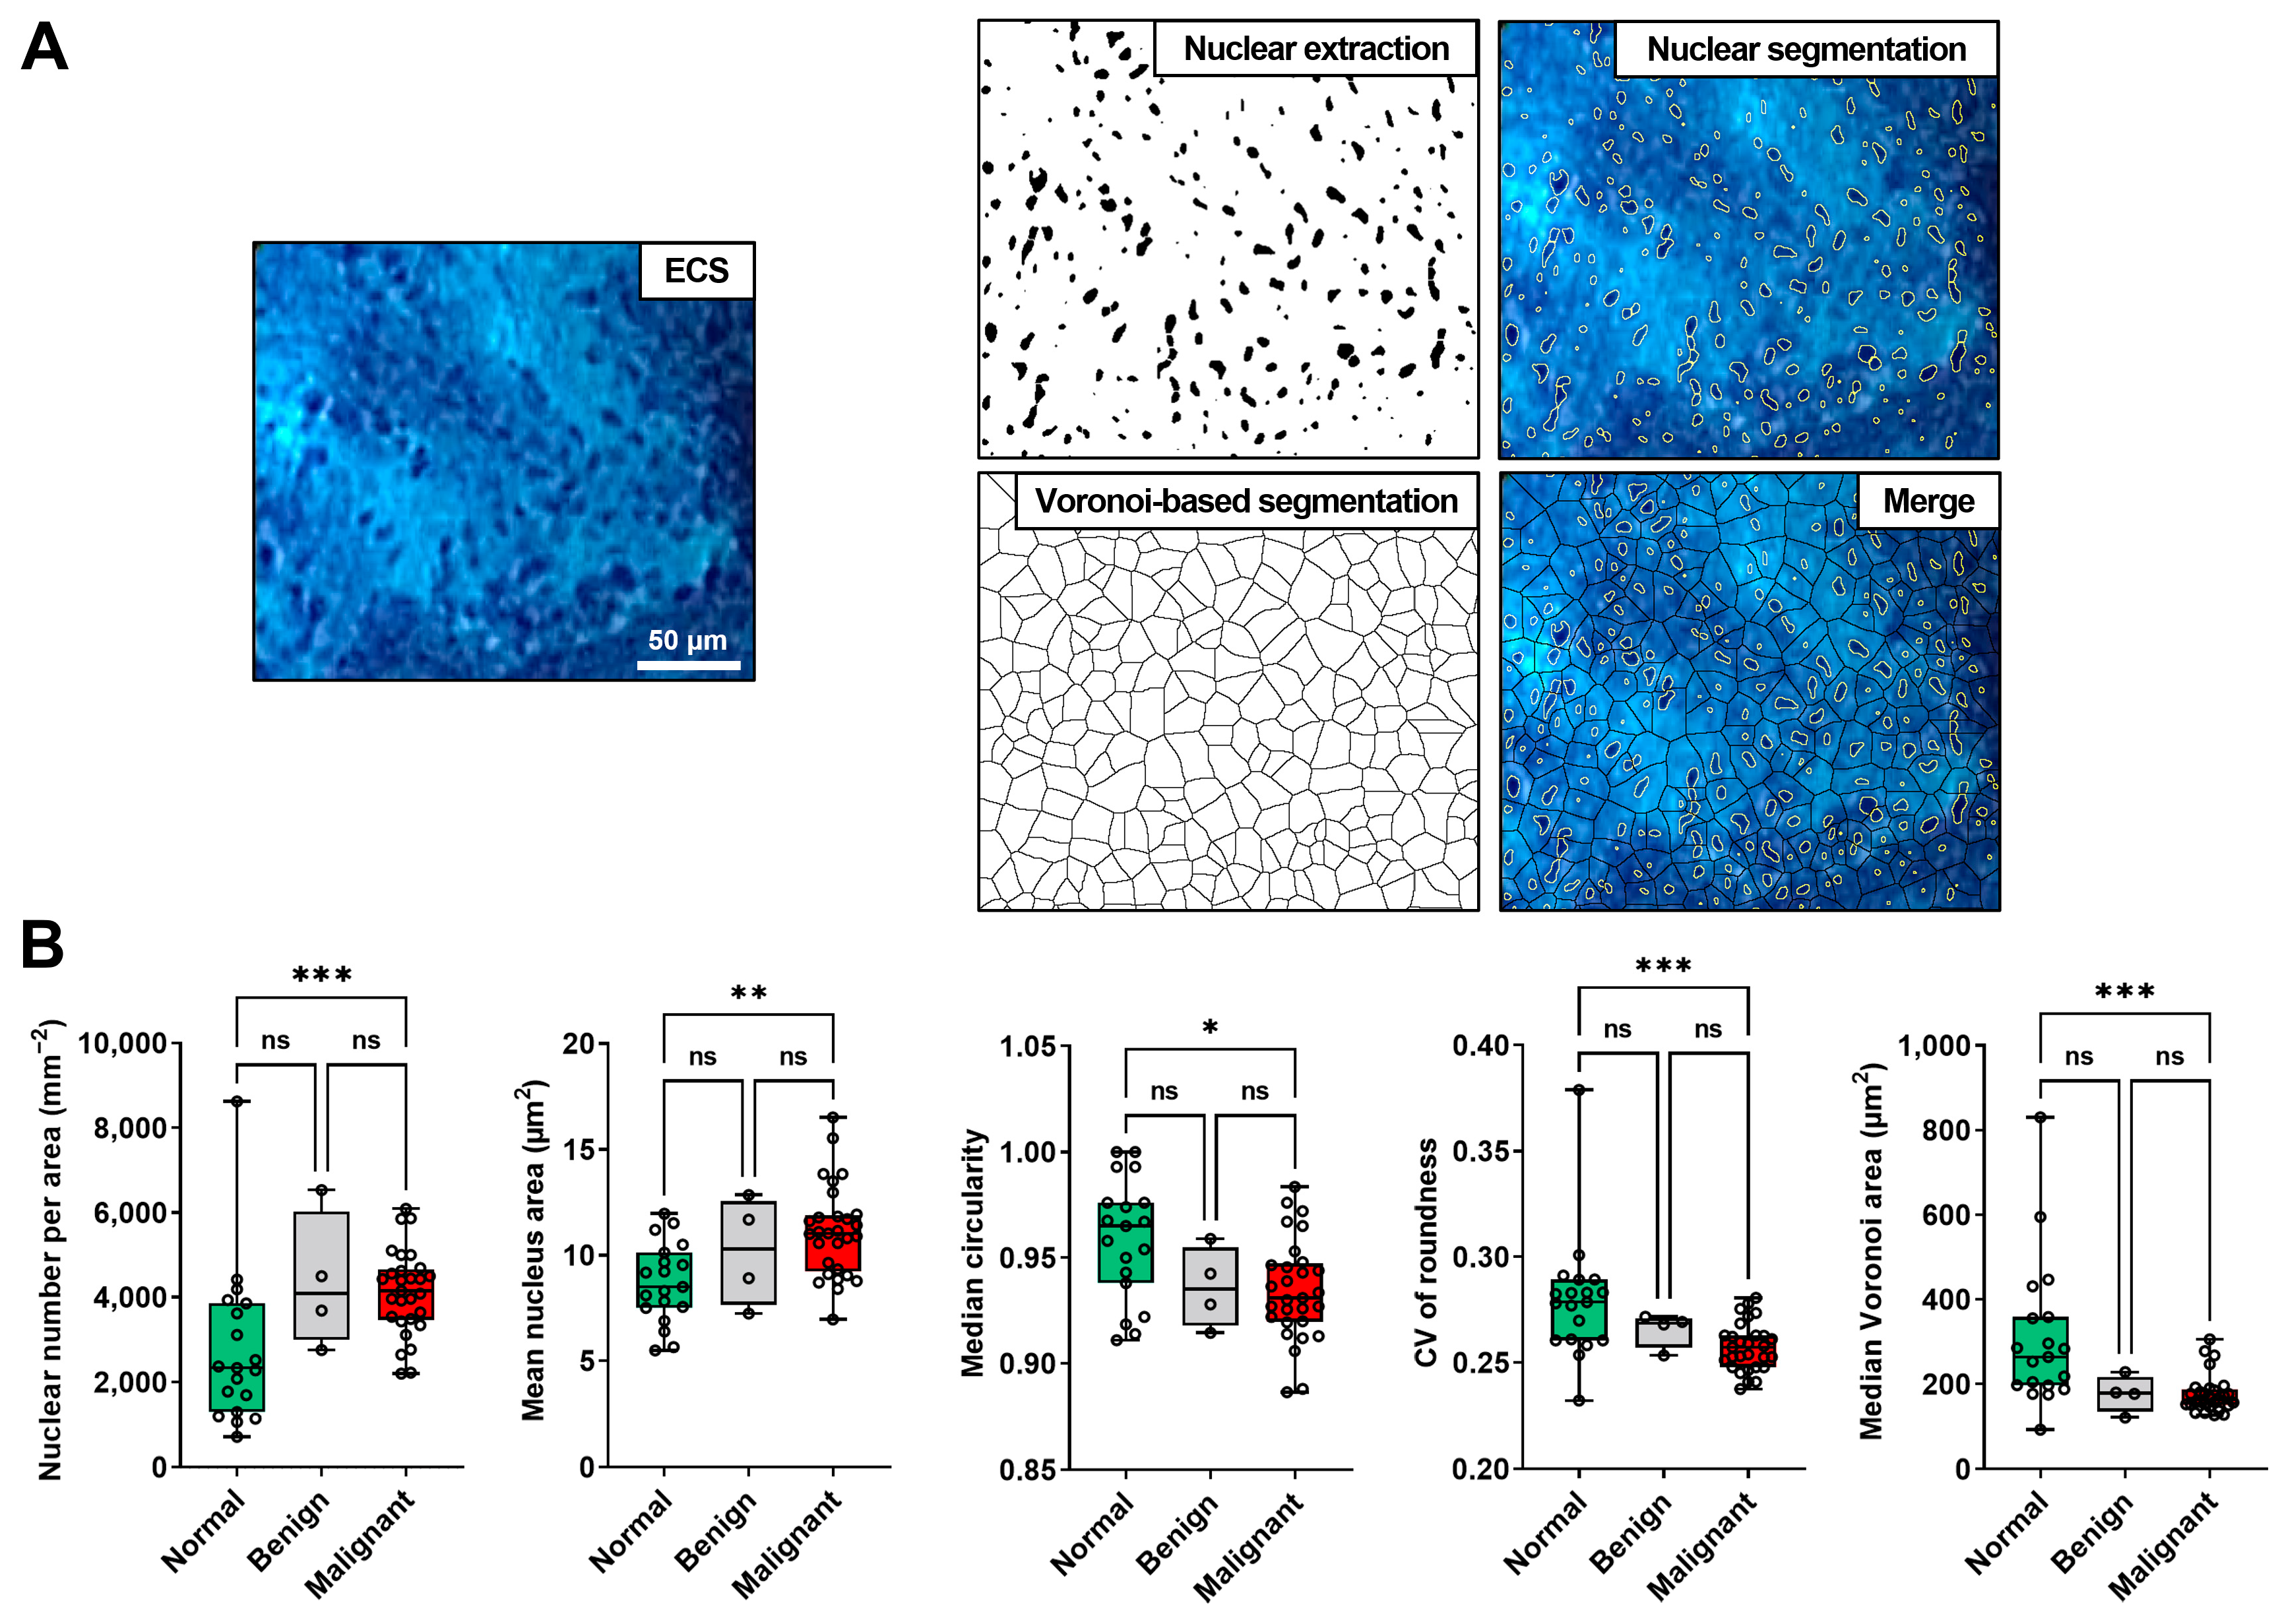
2.4.1. Nuclear Extraction
2.4.2. Quantification of the Nuclear Features
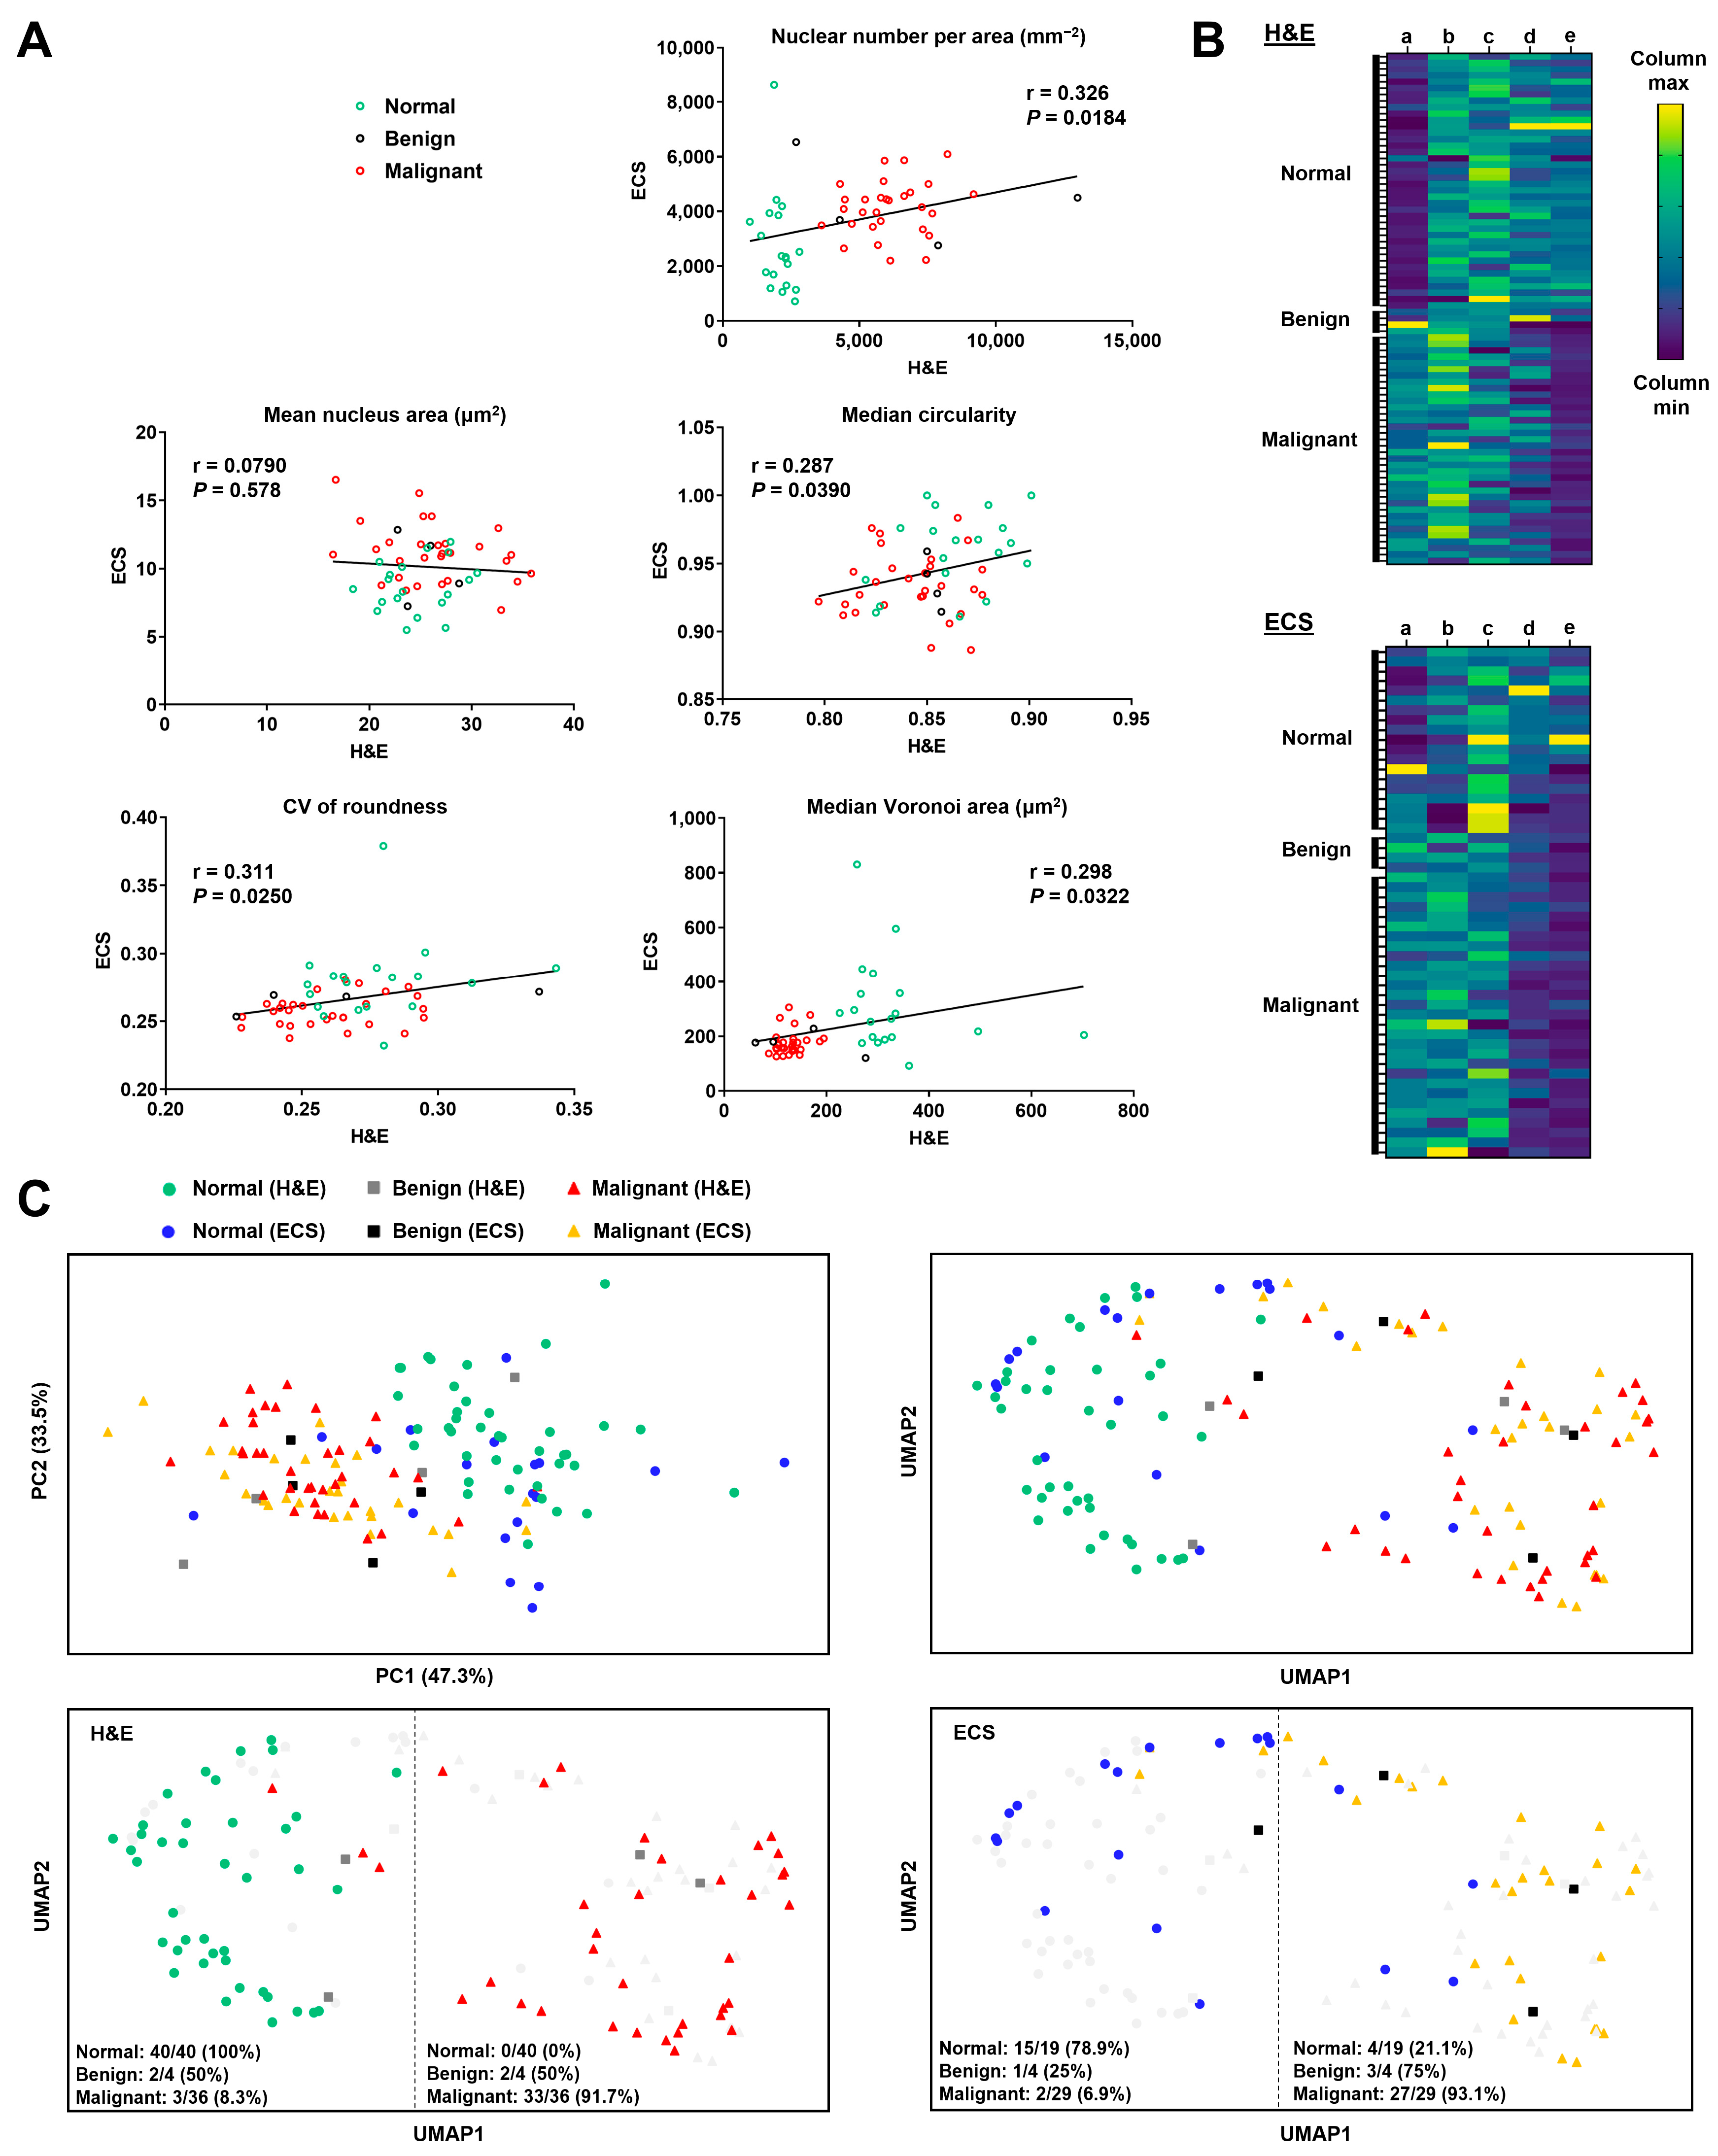
2.4.3. Two-Dimensional Projection of Five Nuclear Features
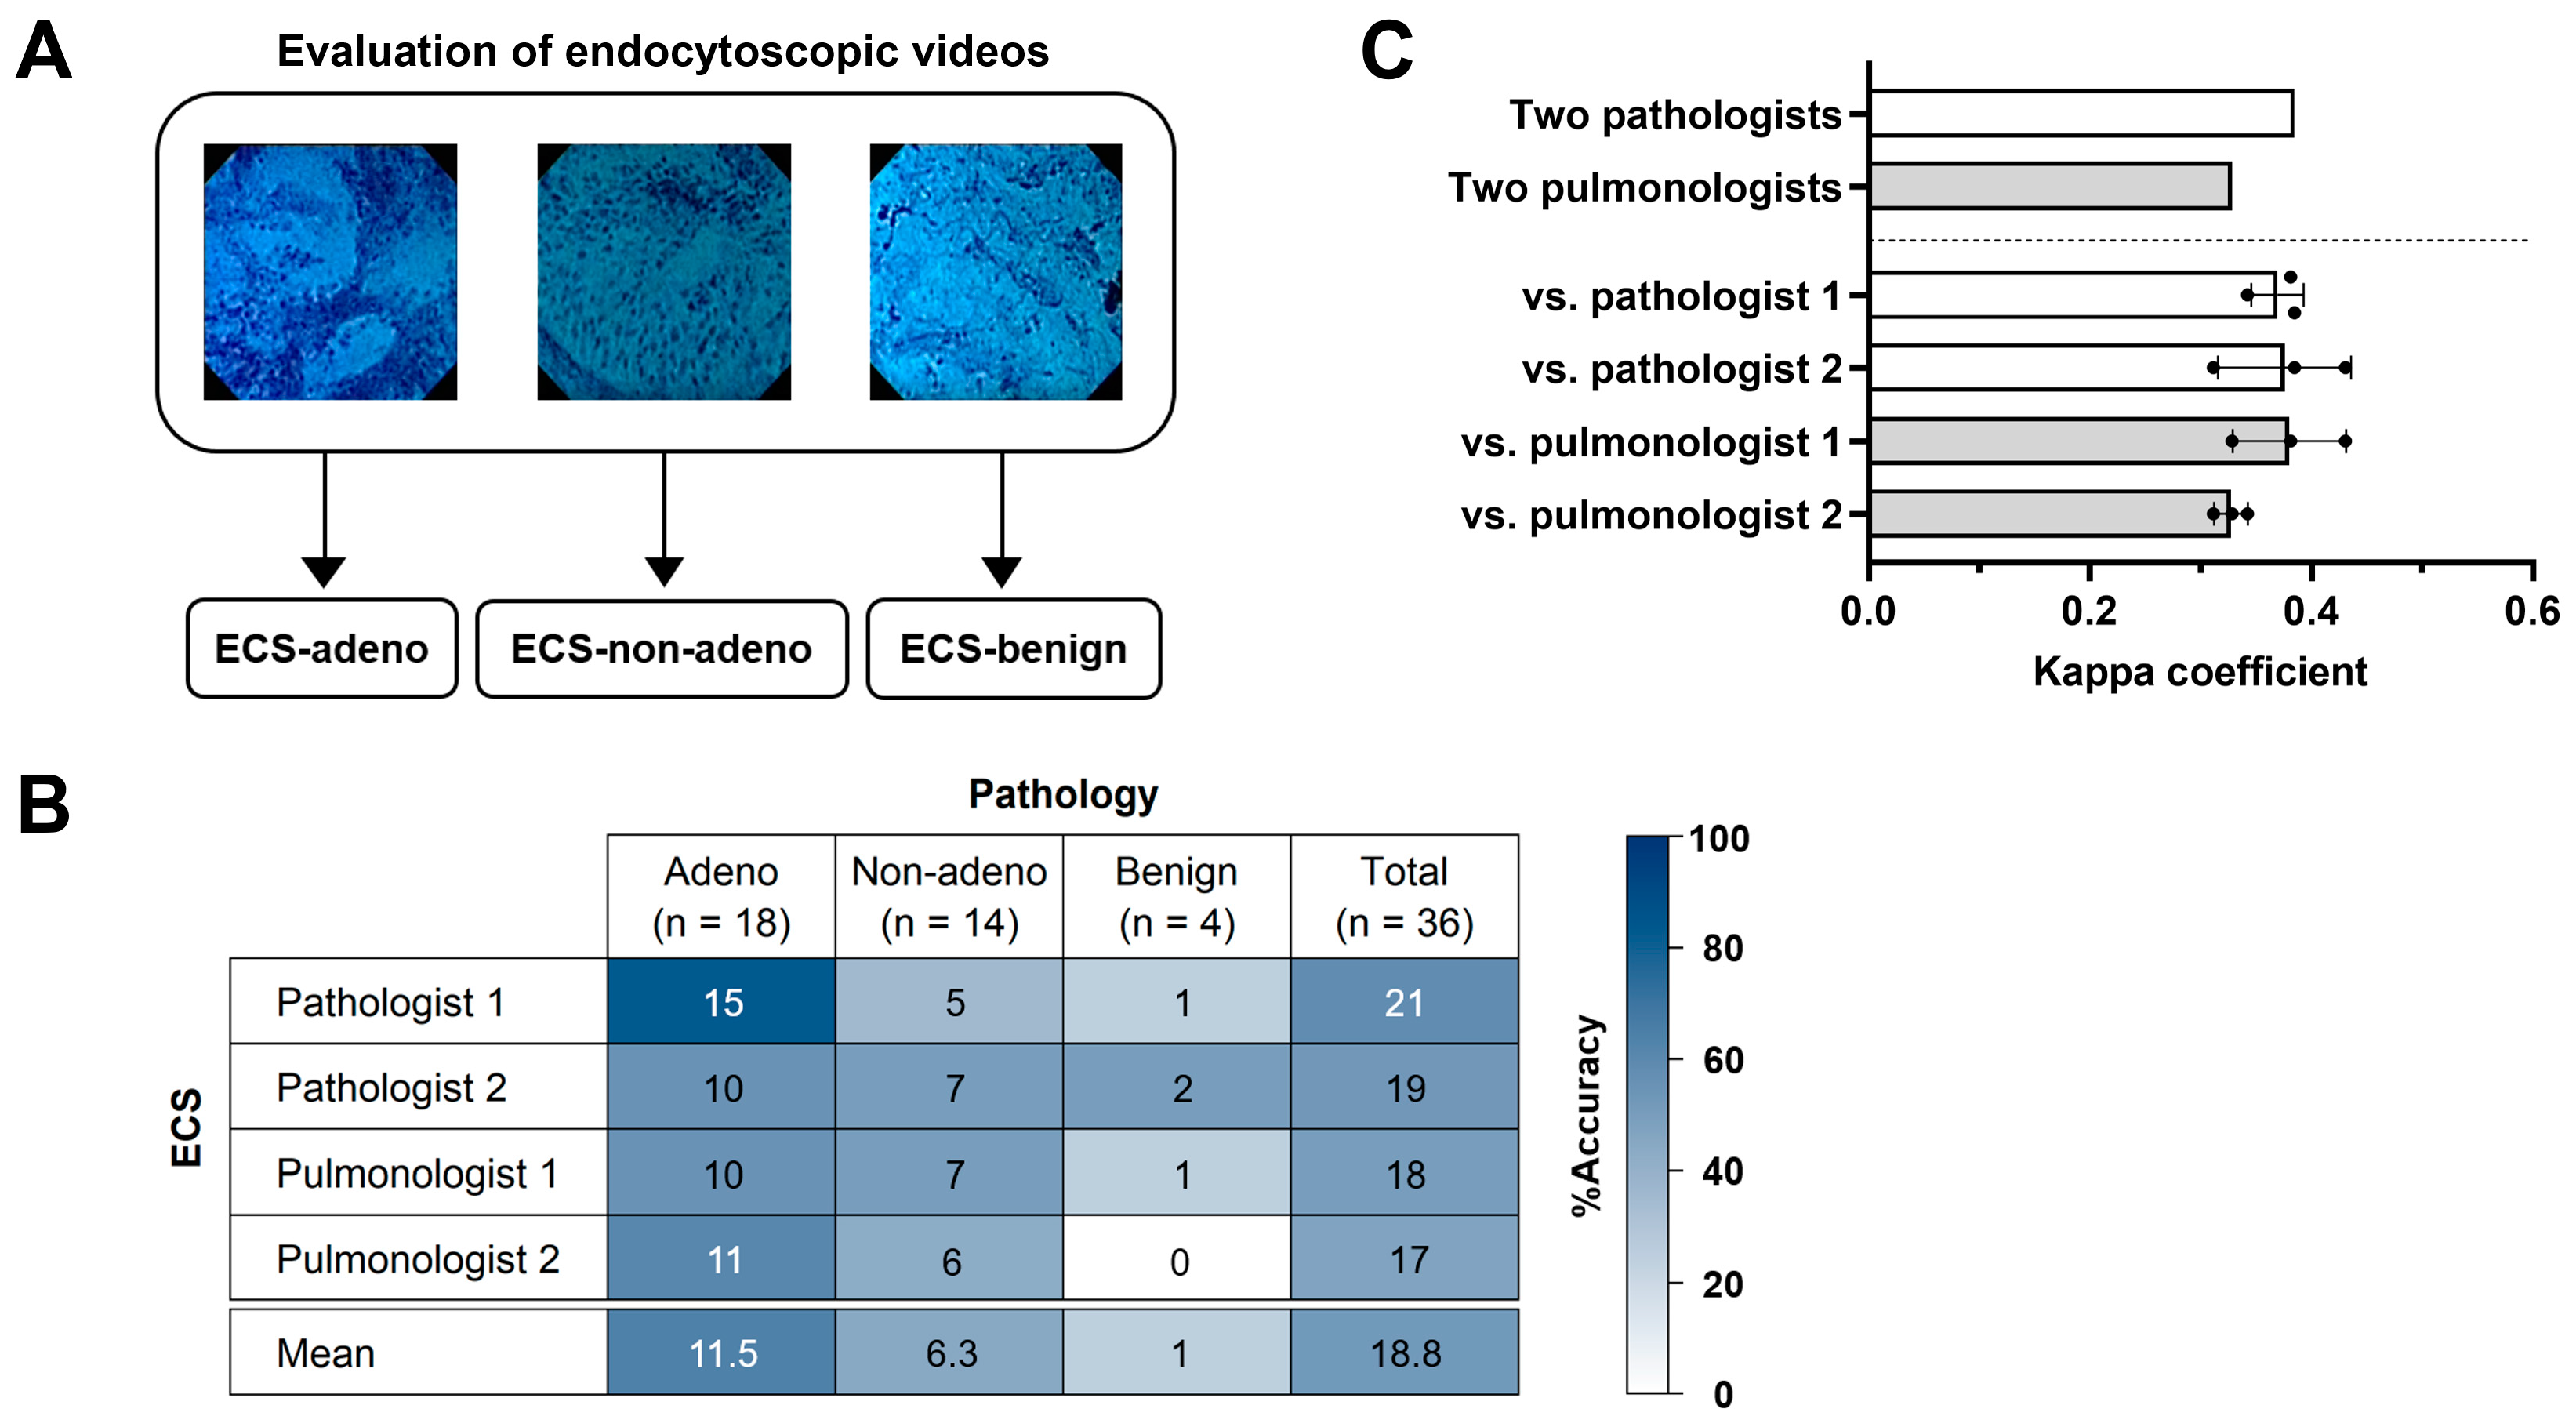
2.5. Endocytoscopic Observation and Inter-Observer Agreement
2.6. Statistical Analyses
3. Results
3.1. Cases and Their Diagnosis
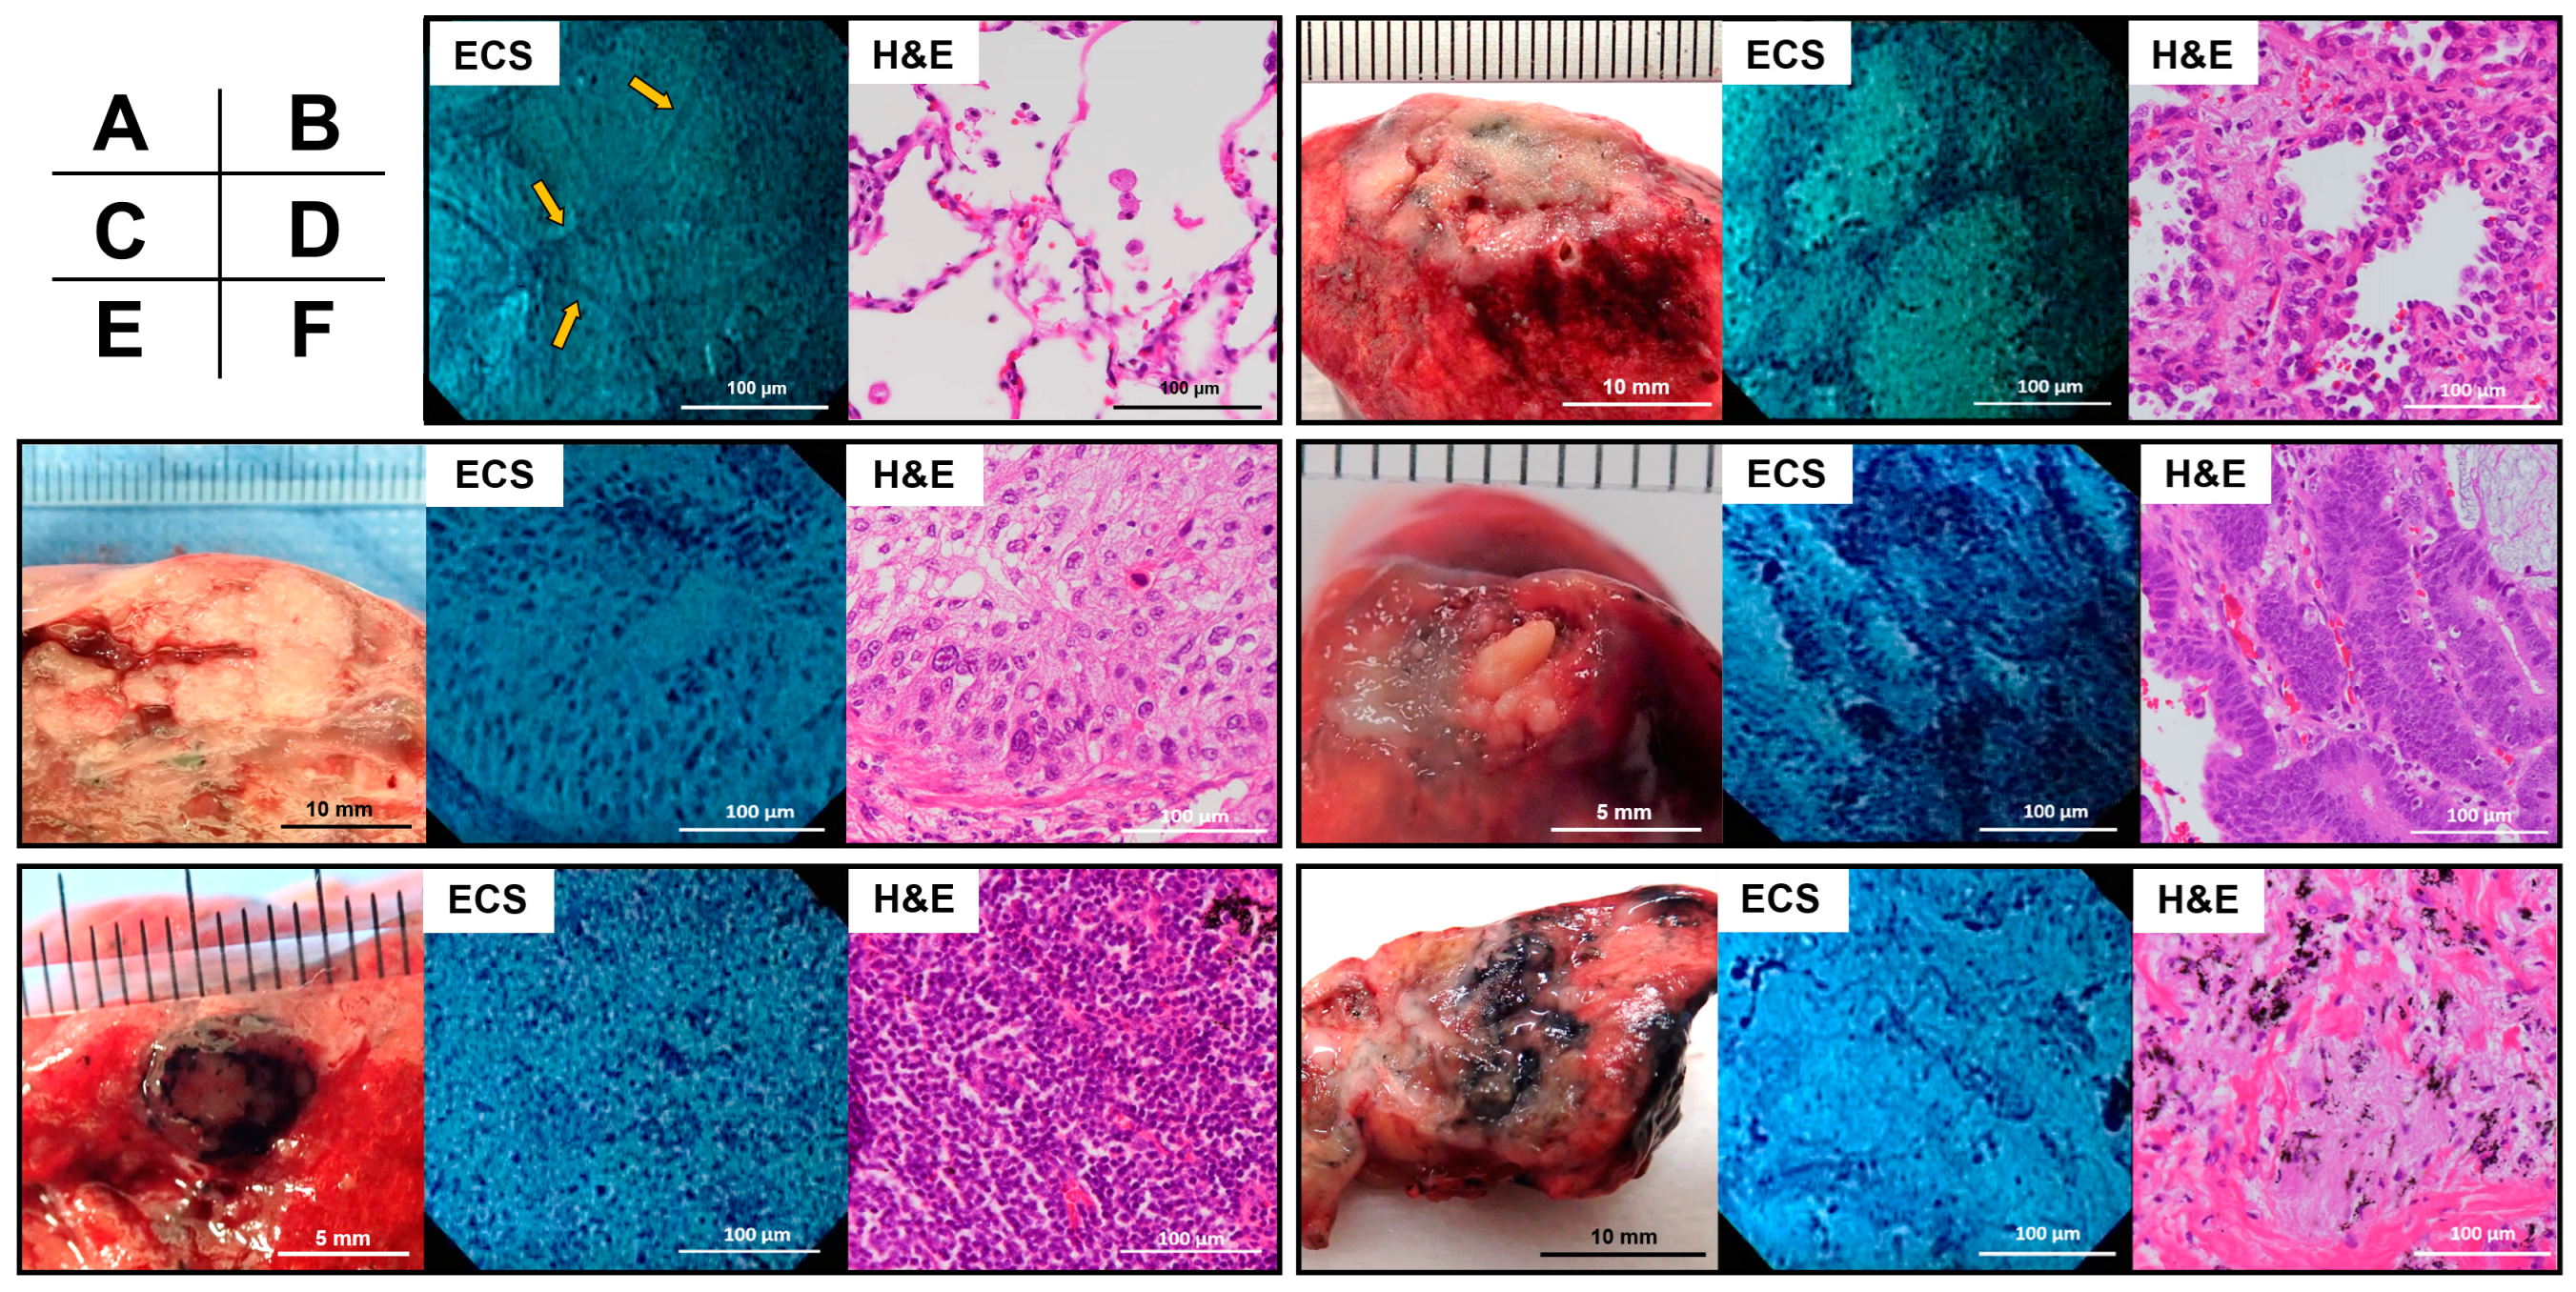
3.2. ECS and H&E Findings of Representatives
3.3. Comparison of the Nuclear Features of the Normal Lung, Benign, and Malignant Lesions
3.4. Comparisons of Nuclear Features between H&E-Stained and Endocytoscopic Images
3.5. Inter-Observer Agreement in the Endocytoscopic Image Evaluation
4. Discussion
Author Contributions
Funding
Institutional Review Board Statement
Informed Consent Statement
Data Availability Statement
Acknowledgments
Conflicts of Interest
References
- Herbst, R.S.; Morgensztern, D.; Boshoff, C. The biology and management of non-small cell lung cancer. Nature 2018, 553, 446–454. [Google Scholar] [CrossRef]
- Kris, M.G.; Johnson, B.E.; Berry, L.D.; Kwiatkowski, D.J.; Iafrate, A.J.; Wistuba, I.I.; Varella-Garcia, M.; Franklin, W.A.; Aronson, S.L.; Su, P.-F.; et al. Using multiplexed assays of oncogenic drivers in lung cancers to select targeted drugs. JAMA 2014, 311, 1998–2006. [Google Scholar] [CrossRef] [Green Version]
- Lynch, T.J.; Bell, D.W.; Sordella, R.; Gurubhagavatula, S.; Okimoto, R.A.; Brannigan, B.W.; Harris, P.L.; Haserlat, S.M.; Supko, J.G.; Haluska, F.G.; et al. Activating mutations in the epidermal growth factor receptor underlying responsiveness of non-small-cell lung cancer to gefitinib. N. Engl. J. Med. 2004, 350, 2129–2139. [Google Scholar] [CrossRef] [PubMed]
- Whitney, D.H.; Elashoff, M.R.; Porta-Smith, K.; Gower, A.C.; Vachani, A.; Ferguson, J.S.; Silvestri, G.A.; Brody, J.S.; Lenburg, M.E.; Spira, A. Derivation of a bronchial genomic classifier for lung cancer in a prospective study of patients undergoing diagnostic bronchoscopy. BMC Med. Genom. 2015, 8, 18. [Google Scholar] [CrossRef] [Green Version]
- Tsai, T.H.; Yang, C.Y.; Ho, C.C.; Liao, W.Y.; Jan, I.S.; Chen, K.Y.; Wang, J.Y.; Ruan, S.Y.; Yu, C.J.; Yang, J.C.H.; et al. Multi-gene analyses from waste brushing specimens for patients with peripheral lung cancer receiving EBUS-assisted bronchoscopy. Lung Cancer 2013, 82, 420–425. [Google Scholar] [CrossRef] [PubMed]
- Neumann, H.; Fuchs, F.S.; Vieth, M.; Atreya, R.; Siebler, J.; Kiesslich, R.; Neurath, M.F. Review article: In vivo imaging by endocytoscopy. Aliment. Pharmacol. Ther. 2011, 33, 1183–1193. [Google Scholar] [CrossRef] [PubMed]
- Mori, Y.; Kudo, S.; Ikehara, N.; Wakamura, K.; Wada, Y.; Kutsukawa, M.; Misawa, M.; Kudo, T.; Kobayashi, Y.; Miyachi, H.; et al. Comprehensive diagnostic ability of endocytoscopy compared with biopsy for colorectal neoplasms: A prospective randomized noninferiority trial. Endoscopy 2013, 45, 98–105. [Google Scholar] [CrossRef]
- Rotondano, G.; Bianco, M.A.; Salerno, R.; Meucci, C.; Prisco, A.; Garofano, M.L.; Sansone, S.; Cipolletta, L. Endocytoscopic classification of preneoplastic lesions in the colorectum. Int. J. Colorectal Dis. 2010, 25, 1111–1116. [Google Scholar] [CrossRef]
- Eberl, T.; Jechart, G.; Probst, A.; Golczyk, M.; Bittinger, M.; Scheubel, R.; Arnholdt, H.; Knuechel, R.; Messmann, H. Can an endocytoscope system (ECS) predict histology in neoplastic lesions? Endoscopy 2007, 39, 497–501. [Google Scholar] [CrossRef]
- Neumann, H.; Vieth, M.; Neurath, M.F.; Fuchs, F.S. In vivo diagnosis of small-cell lung cancer by endocytoscopy. J. Clin. Oncol. 2011, 29, e131–e132. [Google Scholar] [CrossRef]
- Shibuya, K.; Fujiwara, T.; Yasufuku, K.; Alaa, M.; Chiyo, M.; Nakajima, T.; Hoshino, H.; Hiroshima, K.; Nakatani, Y.; Yoshino, I. In vivo microscopic imaging of the bronchial mucosa using an endo-cytoscopy system. Lung Cancer 2011, 72, 184–190. [Google Scholar] [CrossRef] [PubMed]
- Shah, P.L.; Kemp, S.V.; Newton, R.C.; Elson, D.S.; Nicholson, A.G.; Yang, G.Z. Clinical correlation between real-time endocytoscopy, confocal endomicroscopy, and histopathology in the central airways. Respiration 2017, 93, 51–57. [Google Scholar] [CrossRef] [PubMed]
- Kitamura, Y.; Yamada, G.; Narita, Y.; Kameda, M.; Yamada, Y.; Kitada, J.; Ikeda, K.; Takahashi, H. Bronchoscopic observation of endobronchial tumor cells. J. Bronchol. Interv. Pulmonol. 2012, 19, 311–312. [Google Scholar] [CrossRef]
- Nosaka, S.; Kurimoto, N.; Morita, K. Endocytoscopy for confirmation of surgical margins of peripheral lung cancer. J. Bronchol. Interv. Pulmonol. 2017, 24, e29–e30. [Google Scholar] [CrossRef]
- Nosaka, S.; Kurimoto, N.; Morita, K.; Murayama, M. Endocytoscopy and narrow band imaging for superficial extension of squamous cell carcinoma. Ann. Thorac. Surg. 2014, 98, 1117. [Google Scholar] [CrossRef] [PubMed]
- McInnes, L.; Healy, J.; Melville, J. UMAP: Uniform manifold approximation and projection for dimension reduction. arXiv 2018, arXiv:1802.03426. [Google Scholar]
- Wang, X.; Janowczyk, A.; Zhou, Y.; Thawani, R.; Fu, P.; Schalper, K.; Velcheti, V.; Madabhushi, A. Prediction of recurrence in early stage non-small cell lung cancer using computer extracted nuclear features from digital H&E images. Sci. Rep. 2017, 7, 13543. [Google Scholar]
- Wolberg, W.H.; Street, W.N.; Heisey, D.M.; Mangasarian, O.L. Computer-derived nuclear features distinguish malignant from benign breast cytology. Hum. Pathol. 1995, 26, 792–796. [Google Scholar] [CrossRef]
- Olliver, J.R.; Wild, C.P.; Sahay, P.; Dexter, S.; Hardie, L.J. Chromoendoscopy with methylene blue and associated DNA damage in Barrett’s oesophagus. Lancet 2003, 362, 373–374. [Google Scholar] [CrossRef]
- Takemura, M.; Kurimoto, N.; Hoshikawa, M.; Maeno, T.; Hisada, T.; Kurabayashi, M.; Inoue, T.; Miyazawa, T.; Mineshita, M. Probe-based confocal laser endomicroscopy for rapid on-site evaluation of transbronchial biopsy specimens. Thorac. Cancer 2019, 10, 1441–1447. [Google Scholar] [CrossRef] [Green Version]
- Minami, H.; Inoue, H.; Yokoyama, A.; Ikeda, H.; Satodate, H.; Hamatani, S.; Haji, A.; Kudo, S. Recent advancement of observing living cells in the esophagus using CM double staining: Endocytoscopic atypia classification. Dis. Esophagus 2012, 25, 235–241. [Google Scholar] [CrossRef]
- Ichimasa, K.; Kudo, S.E.; Mori, Y.; Wakamura, K.; Ikehara, N.; Kutsukawa, M.; Takeda, K.; Misawa, M.; Kudo, T.; Miyachi, H.; et al. Double staining with crystal violet and methylene blue is appropriate for colonic endocytoscopy: An in vivo prospective pilot study. Dig. Endosc. 2014, 26, 403–408. [Google Scholar] [CrossRef]
- Mori, Y.; Kudo, S.E.; Wakamura, K.; Misawa, M.; Ogawa, Y.; Kutsukawa, M.; Kudo, T.; Hayashi, T.; Miyachi, H.; Ishida, F.; et al. Novel computer-aided diagnostic system for colorectal lesions by using endocytoscopy (with videos). Gastrointest. Endosc. 2015, 81, 621–629. [Google Scholar] [CrossRef] [PubMed] [Green Version]
- Yamamoto, Y.; Tsuzuki, T.; Akatsuka, J.; Ueki, M.; Morikawa, H.; Numata, Y.; Takahara, T.; Tsuyuki, T.; Tsutsumi, K.; Nakazawa, R.; et al. Automated acquisition of explainable knowledge from unannotated histopathology images. Nat. Commun. 2019, 10, 5642. [Google Scholar] [CrossRef] [PubMed] [Green Version]
- Serag, A.; Ion-Margineanu, A.; Qureshi, H.; McMillan, R.; Saint Martin, M.J.; Diamond, J.; O’Reilly, P.; Hamilton, P. Translational AI and deep learning in diagnostic pathology. Front. Med. 2019, 6, 185. [Google Scholar] [CrossRef] [PubMed] [Green Version]


Disclaimer/Publisher’s Note: The statements, opinions and data contained in all publications are solely those of the individual author(s) and contributor(s) and not of MDPI and/or the editor(s). MDPI and/or the editor(s) disclaim responsibility for any injury to people or property resulting from any ideas, methods, instructions or products referred to in the content. |
© 2023 by the authors. Licensee MDPI, Basel, Switzerland. This article is an open access article distributed under the terms and conditions of the Creative Commons Attribution (CC BY) license (https://creativecommons.org/licenses/by/4.0/).
Share and Cite
Kobayashi, M.; Kurimoto, N.; Tanino, R.; Shiratsuki, Y.; Okuno, T.; Nakao, M.; Hotta, T.; Tsubata, Y.; Nagasaki, M.; Nishisaka, T.; et al. Comparison of Ultra-Magnifying Endocytoscopic and Hematoxylin-Eosin-Stained Images of Lung Specimens. Diagnostics 2023, 13, 1003. https://doi.org/10.3390/diagnostics13051003
Kobayashi M, Kurimoto N, Tanino R, Shiratsuki Y, Okuno T, Nakao M, Hotta T, Tsubata Y, Nagasaki M, Nishisaka T, et al. Comparison of Ultra-Magnifying Endocytoscopic and Hematoxylin-Eosin-Stained Images of Lung Specimens. Diagnostics. 2023; 13(5):1003. https://doi.org/10.3390/diagnostics13051003
Chicago/Turabian StyleKobayashi, Misato, Noriaki Kurimoto, Ryosuke Tanino, Yohei Shiratsuki, Takae Okuno, Mika Nakao, Takamasa Hotta, Yukari Tsubata, Makoto Nagasaki, Takashi Nishisaka, and et al. 2023. "Comparison of Ultra-Magnifying Endocytoscopic and Hematoxylin-Eosin-Stained Images of Lung Specimens" Diagnostics 13, no. 5: 1003. https://doi.org/10.3390/diagnostics13051003