
Local-Ternary-Pattern-Based Associated Histogram Equalization Technique for Cervical Cancer Detection
 , , and
Abstract
:1. Introduction
2. Related Works
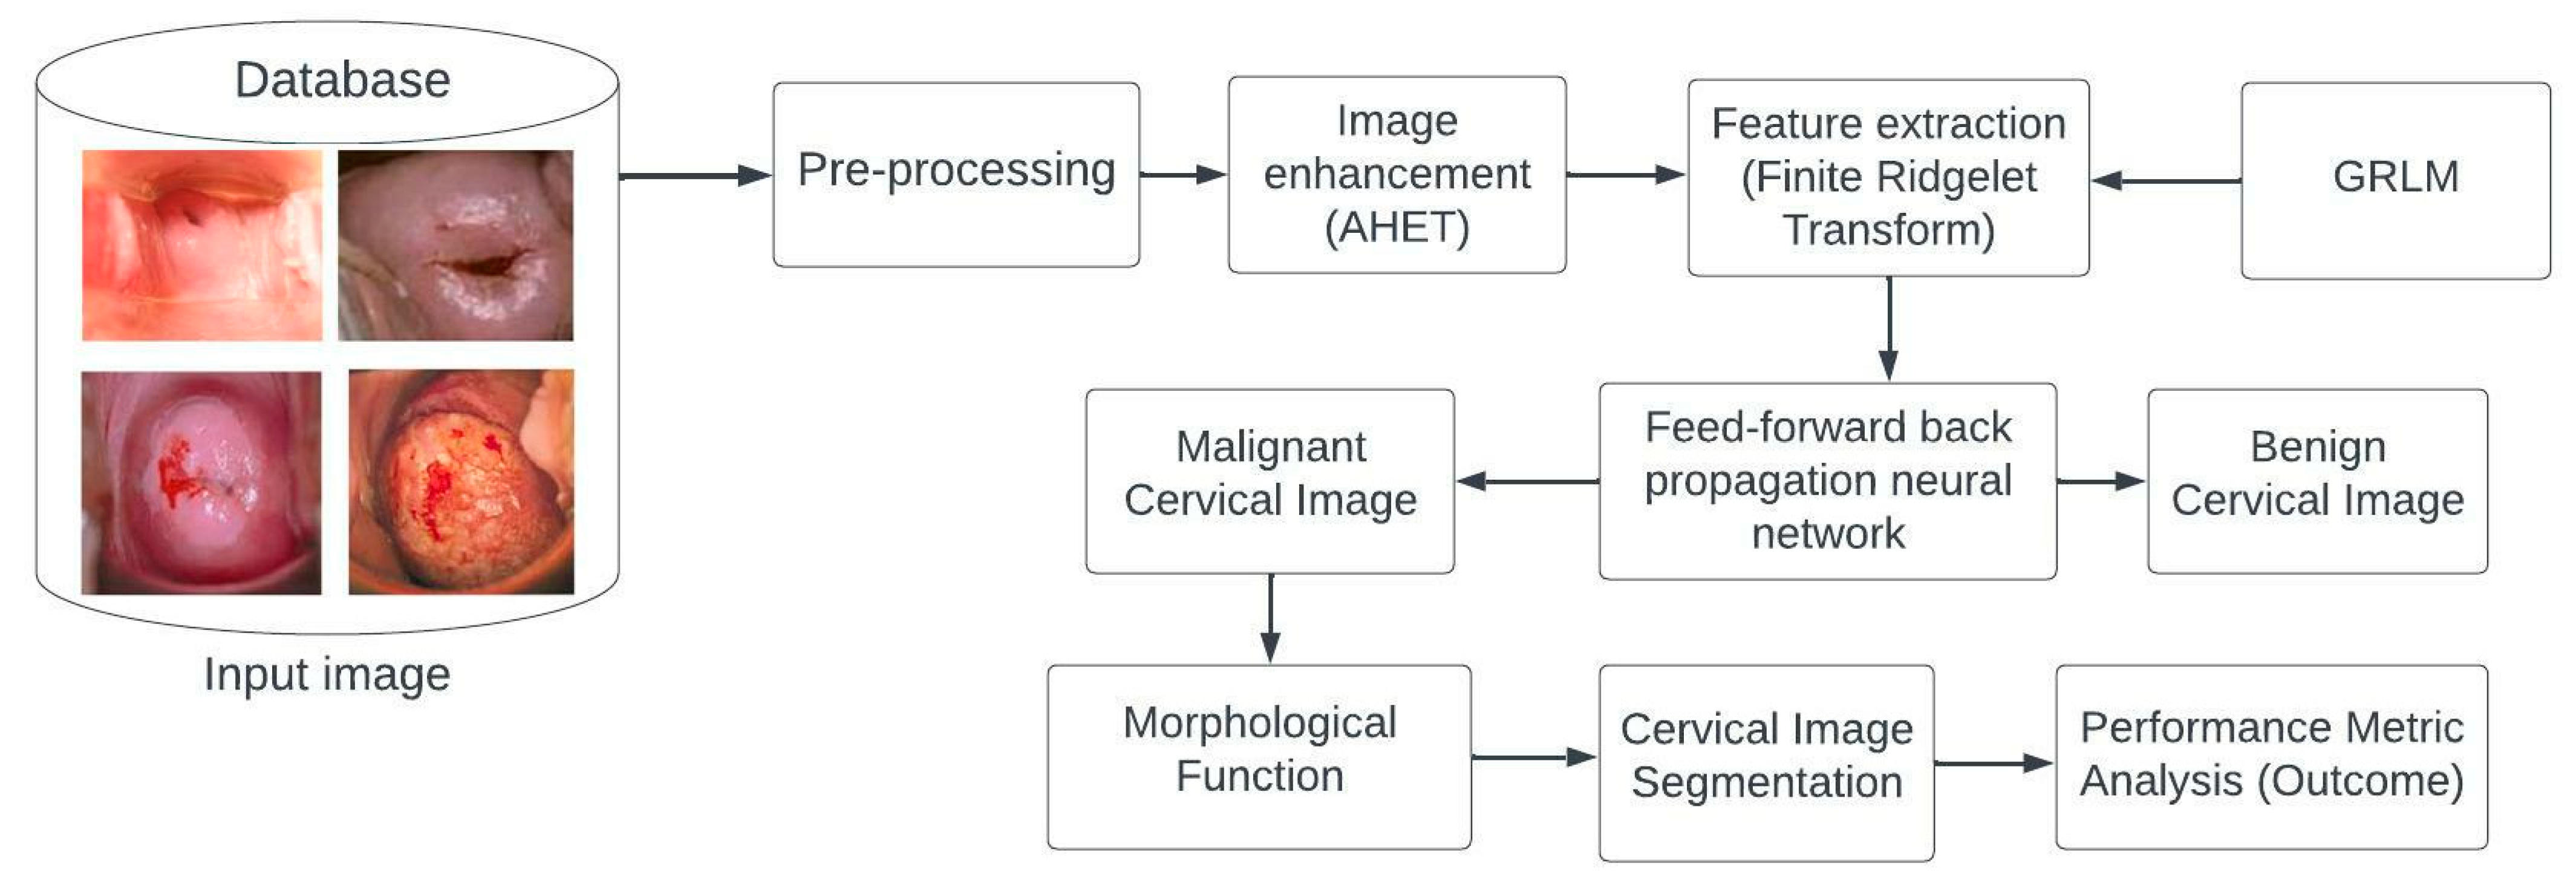
3. Proposed System
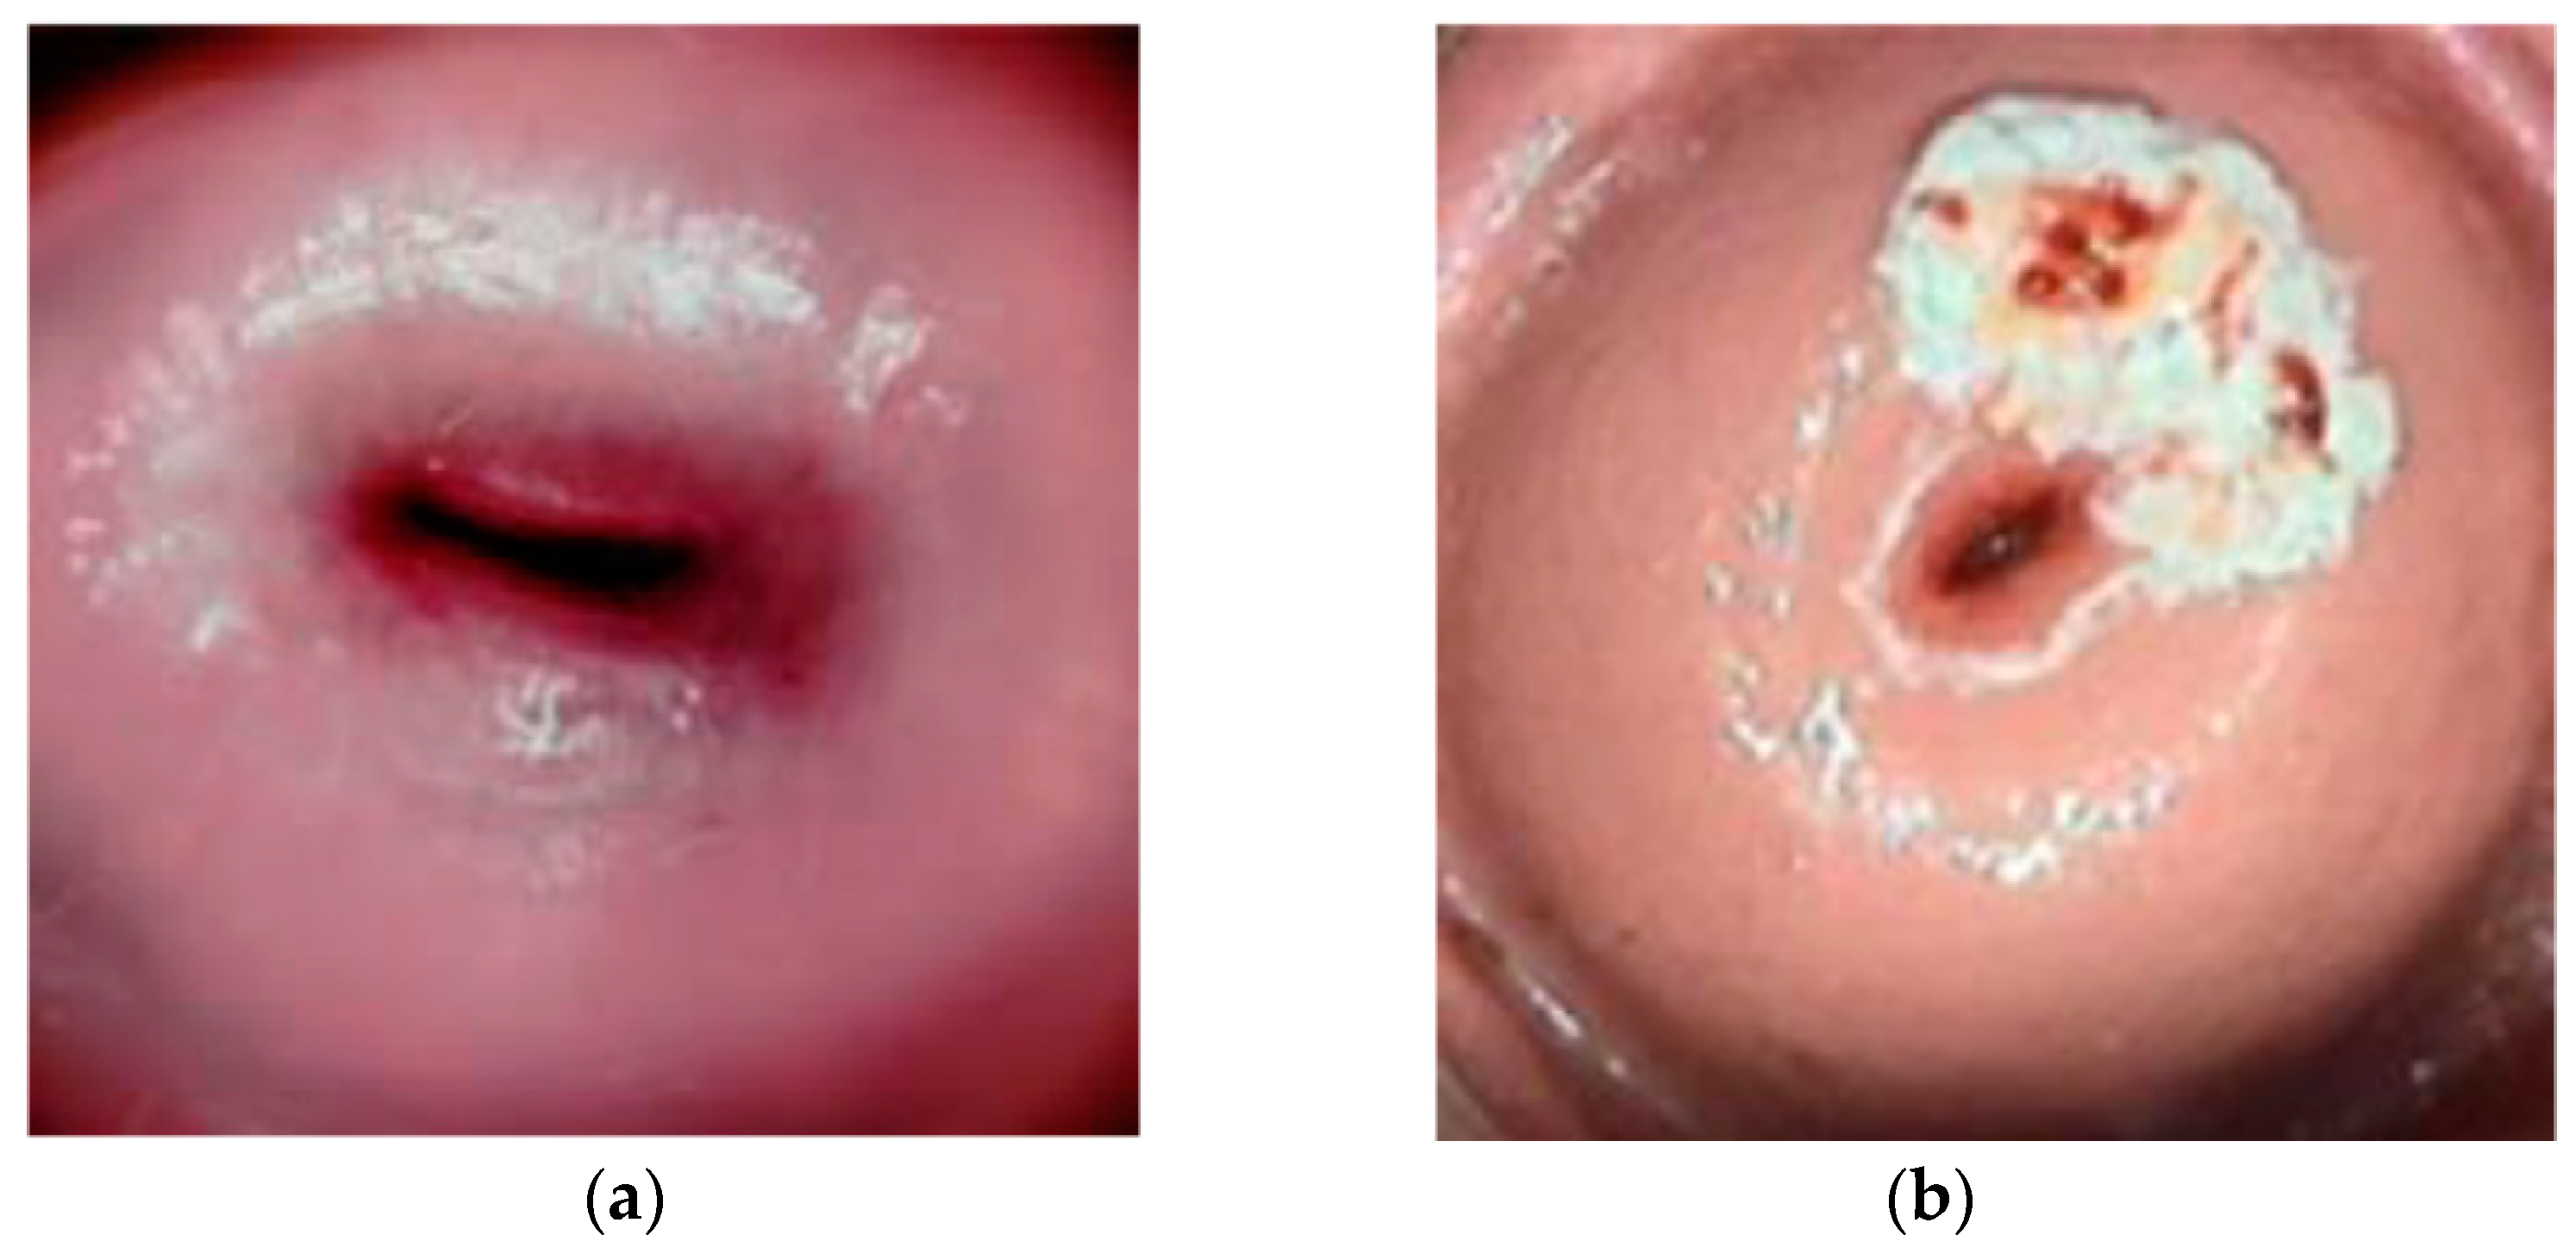
3.1. Materials
3.2. Methods
3.2.1. Associated Histogram Equalization Technique
3.2.2. Finite Ridgelet Transform
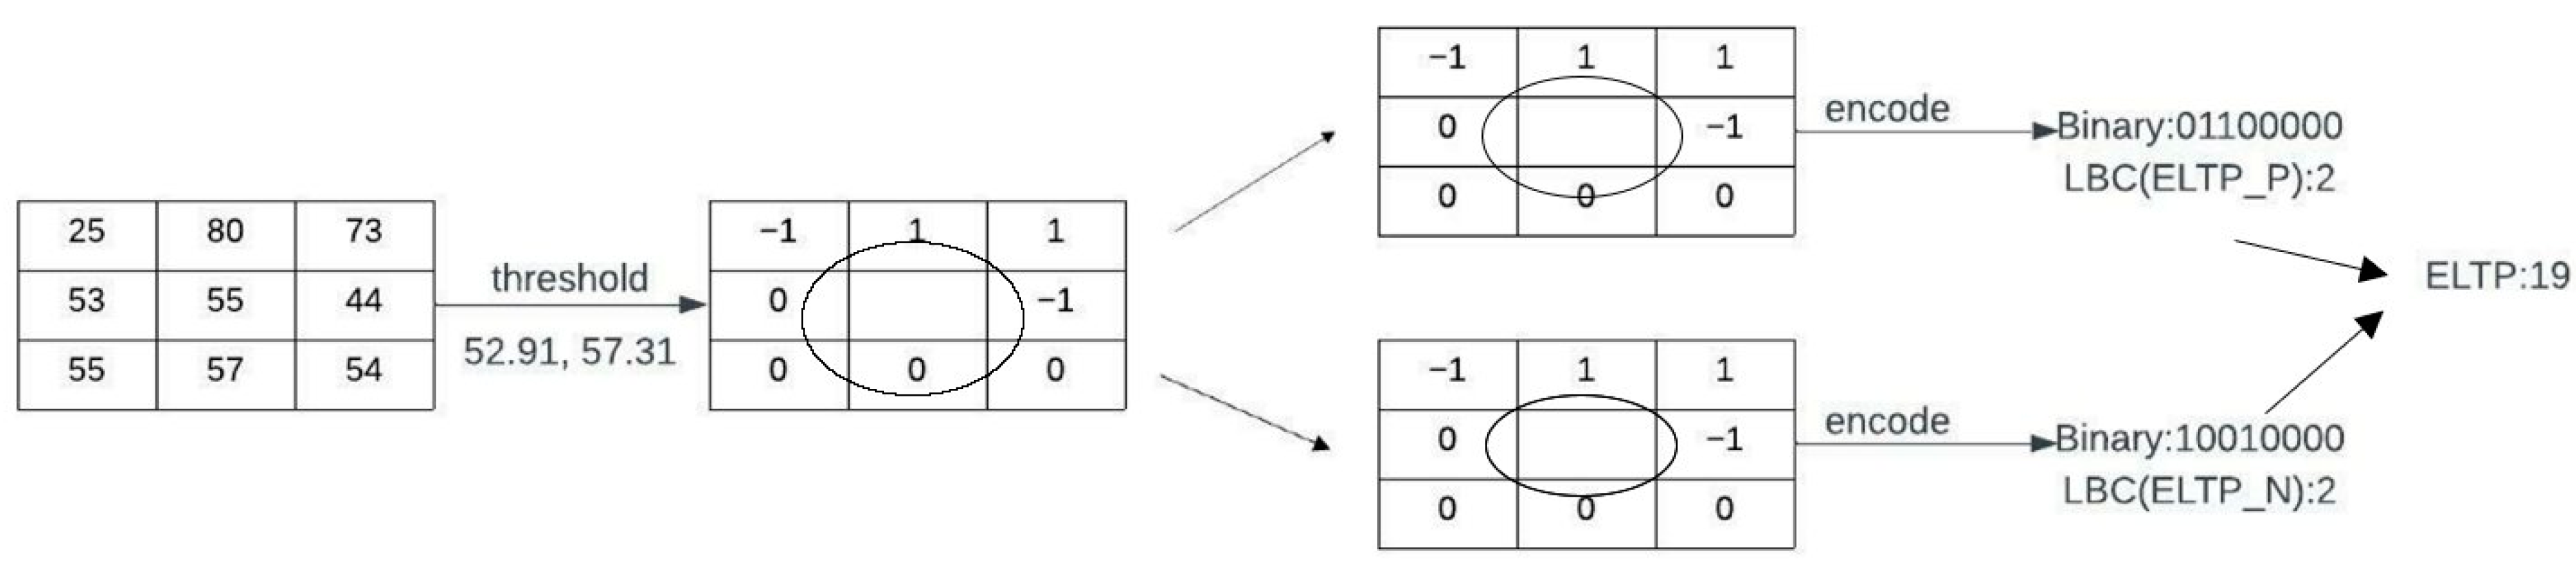
3.2.3. Enhanced Local Ternary Pattern (ELTP)
3.2.4. Gray-Level Run-Length Matrices
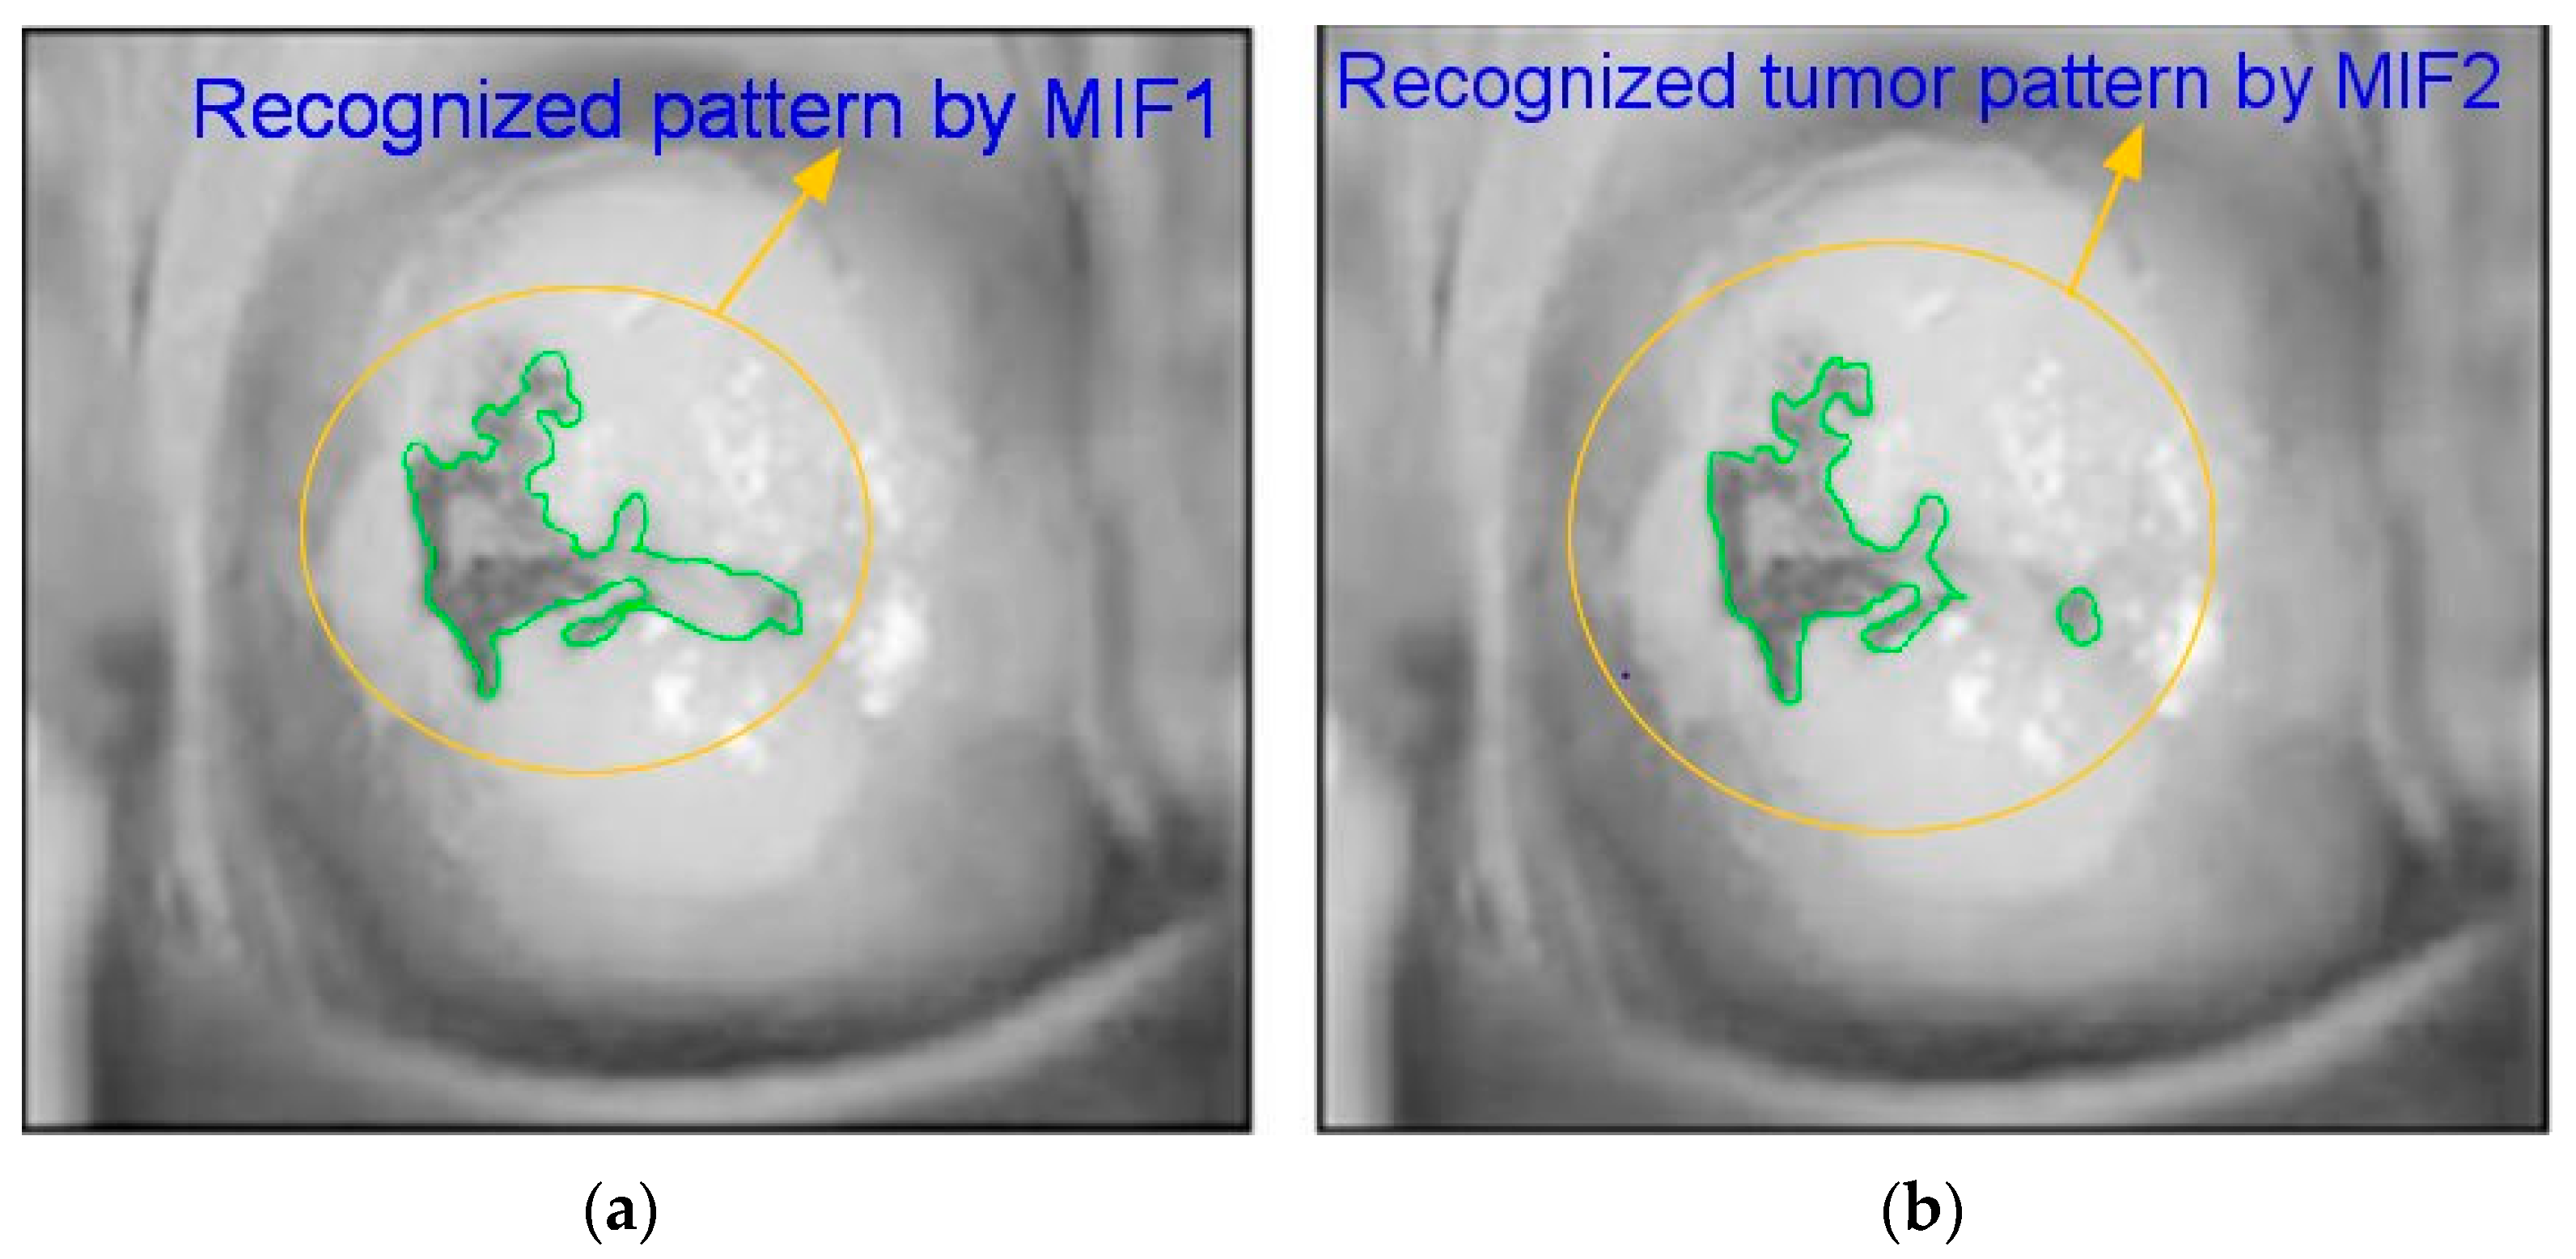
3.2.5. Moment Invariant Features (MIF)
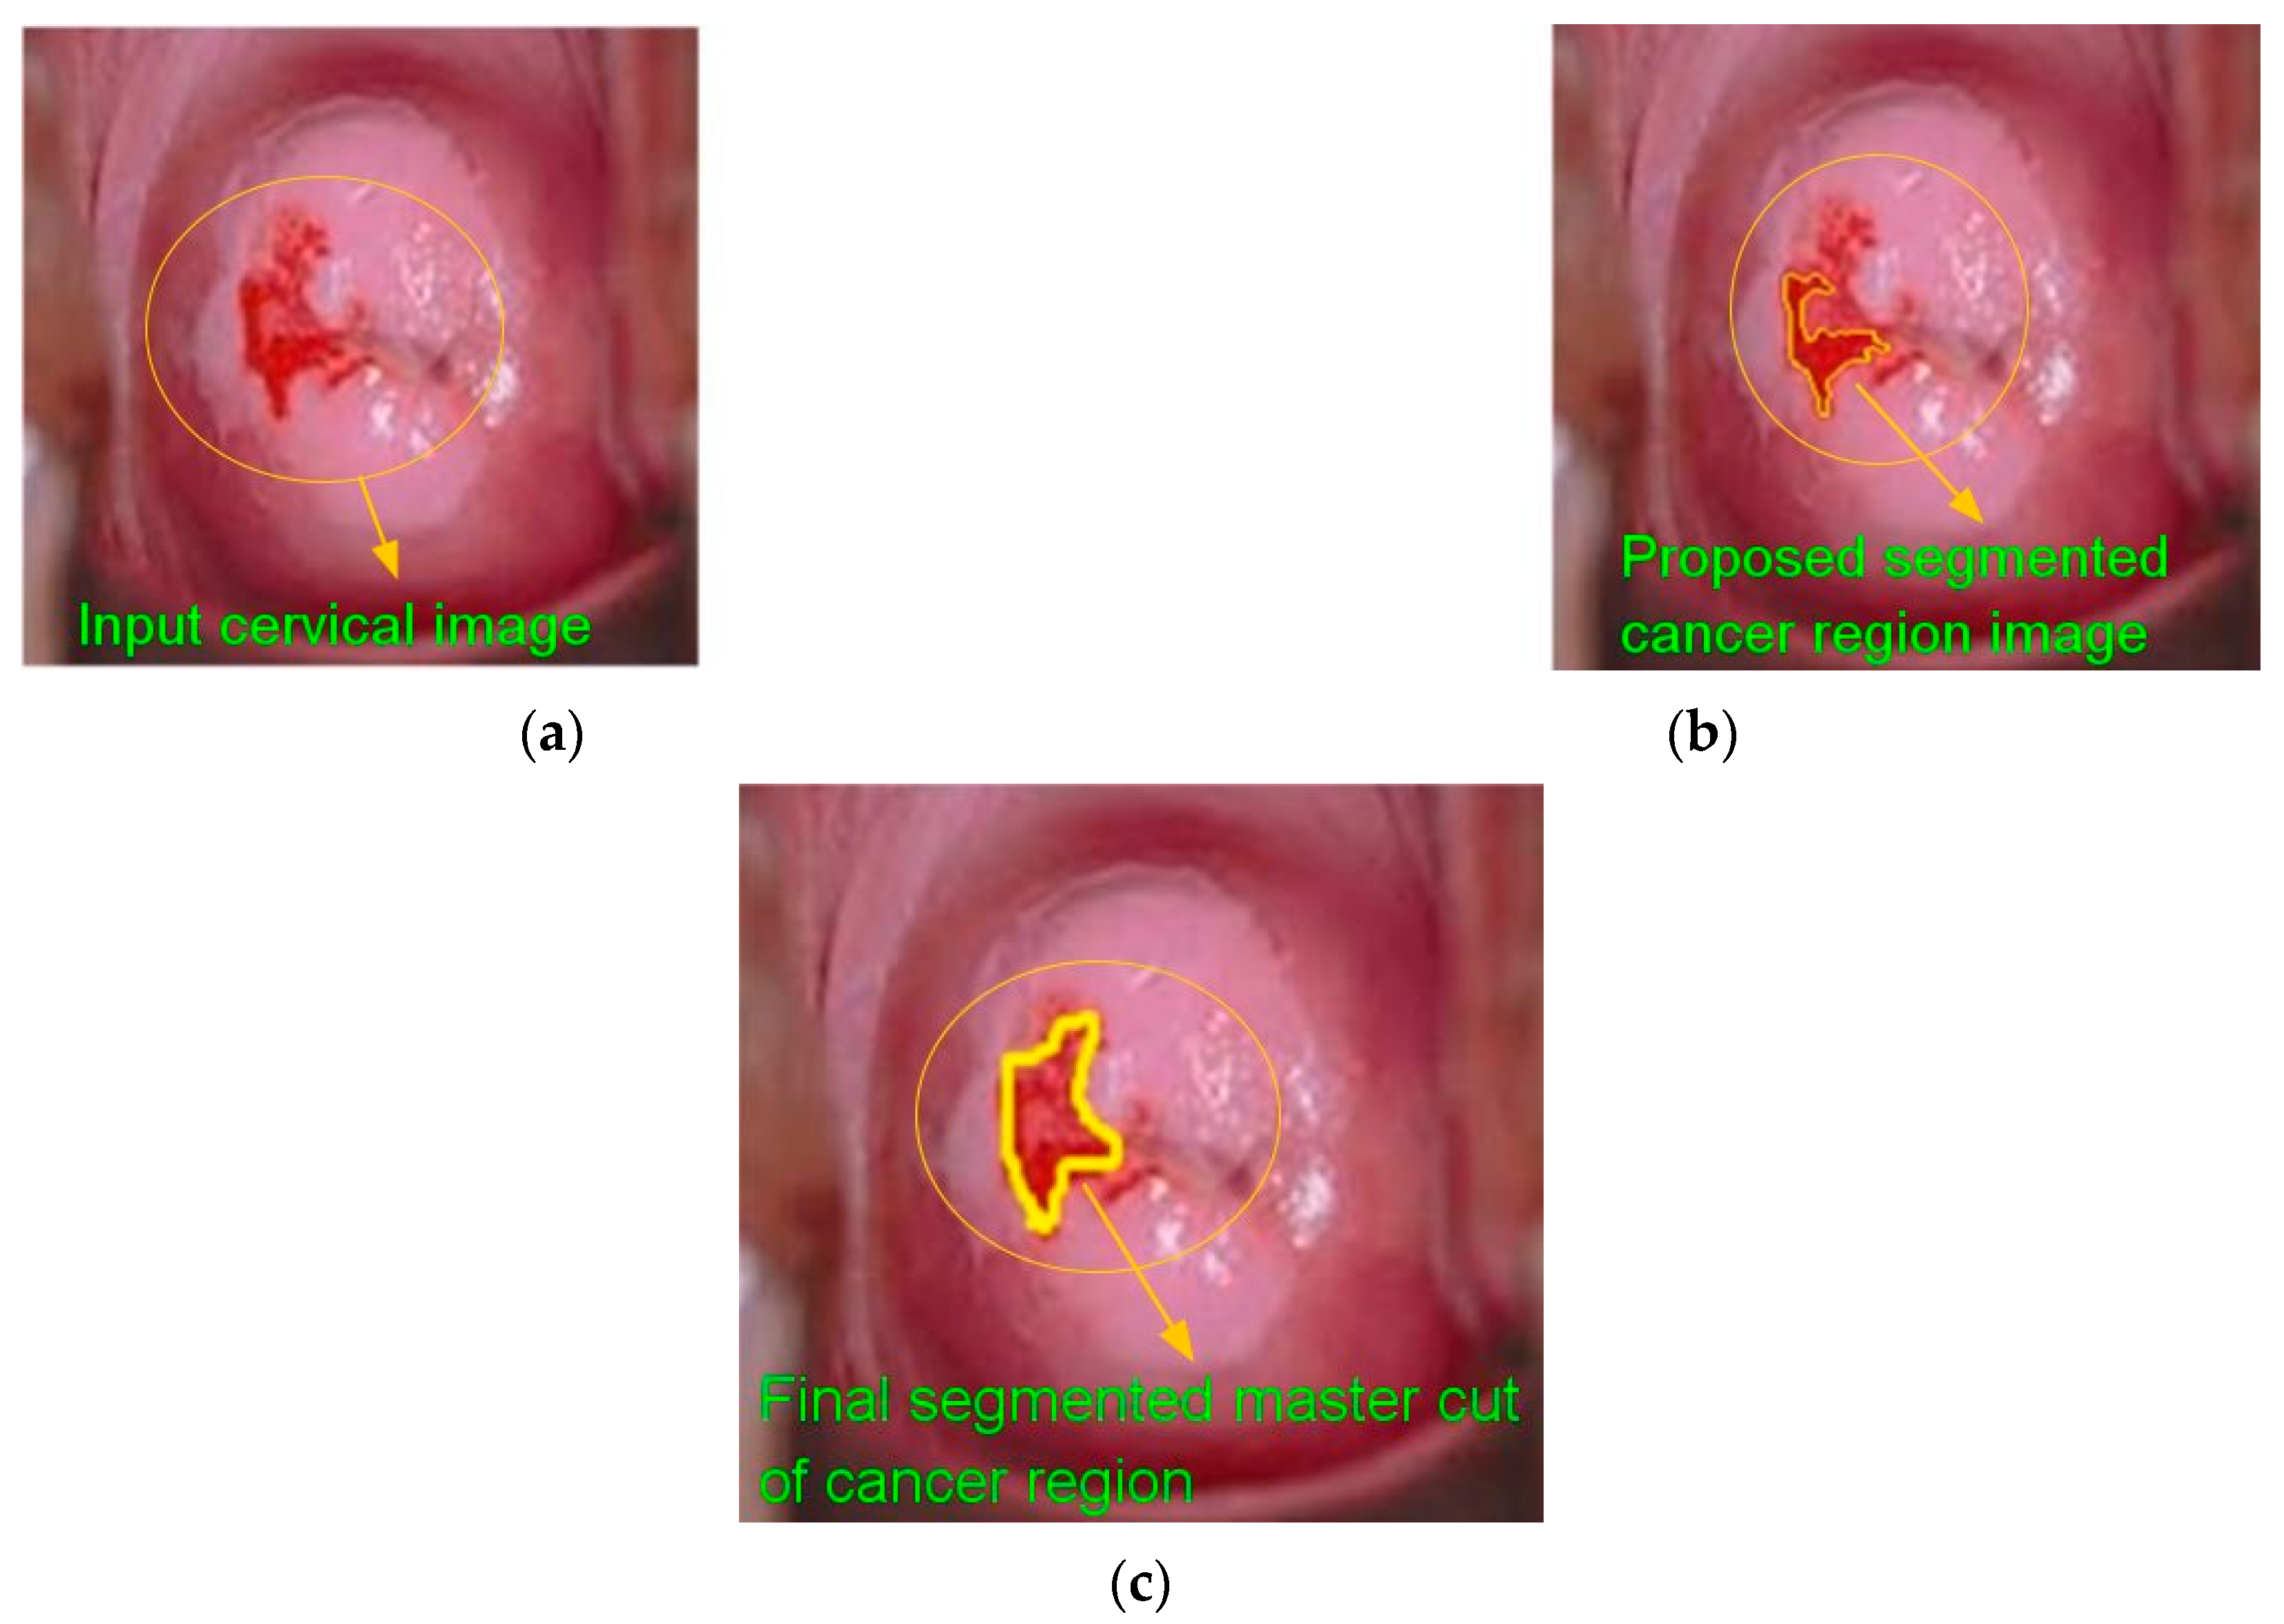
3.2.6. Morphological Function
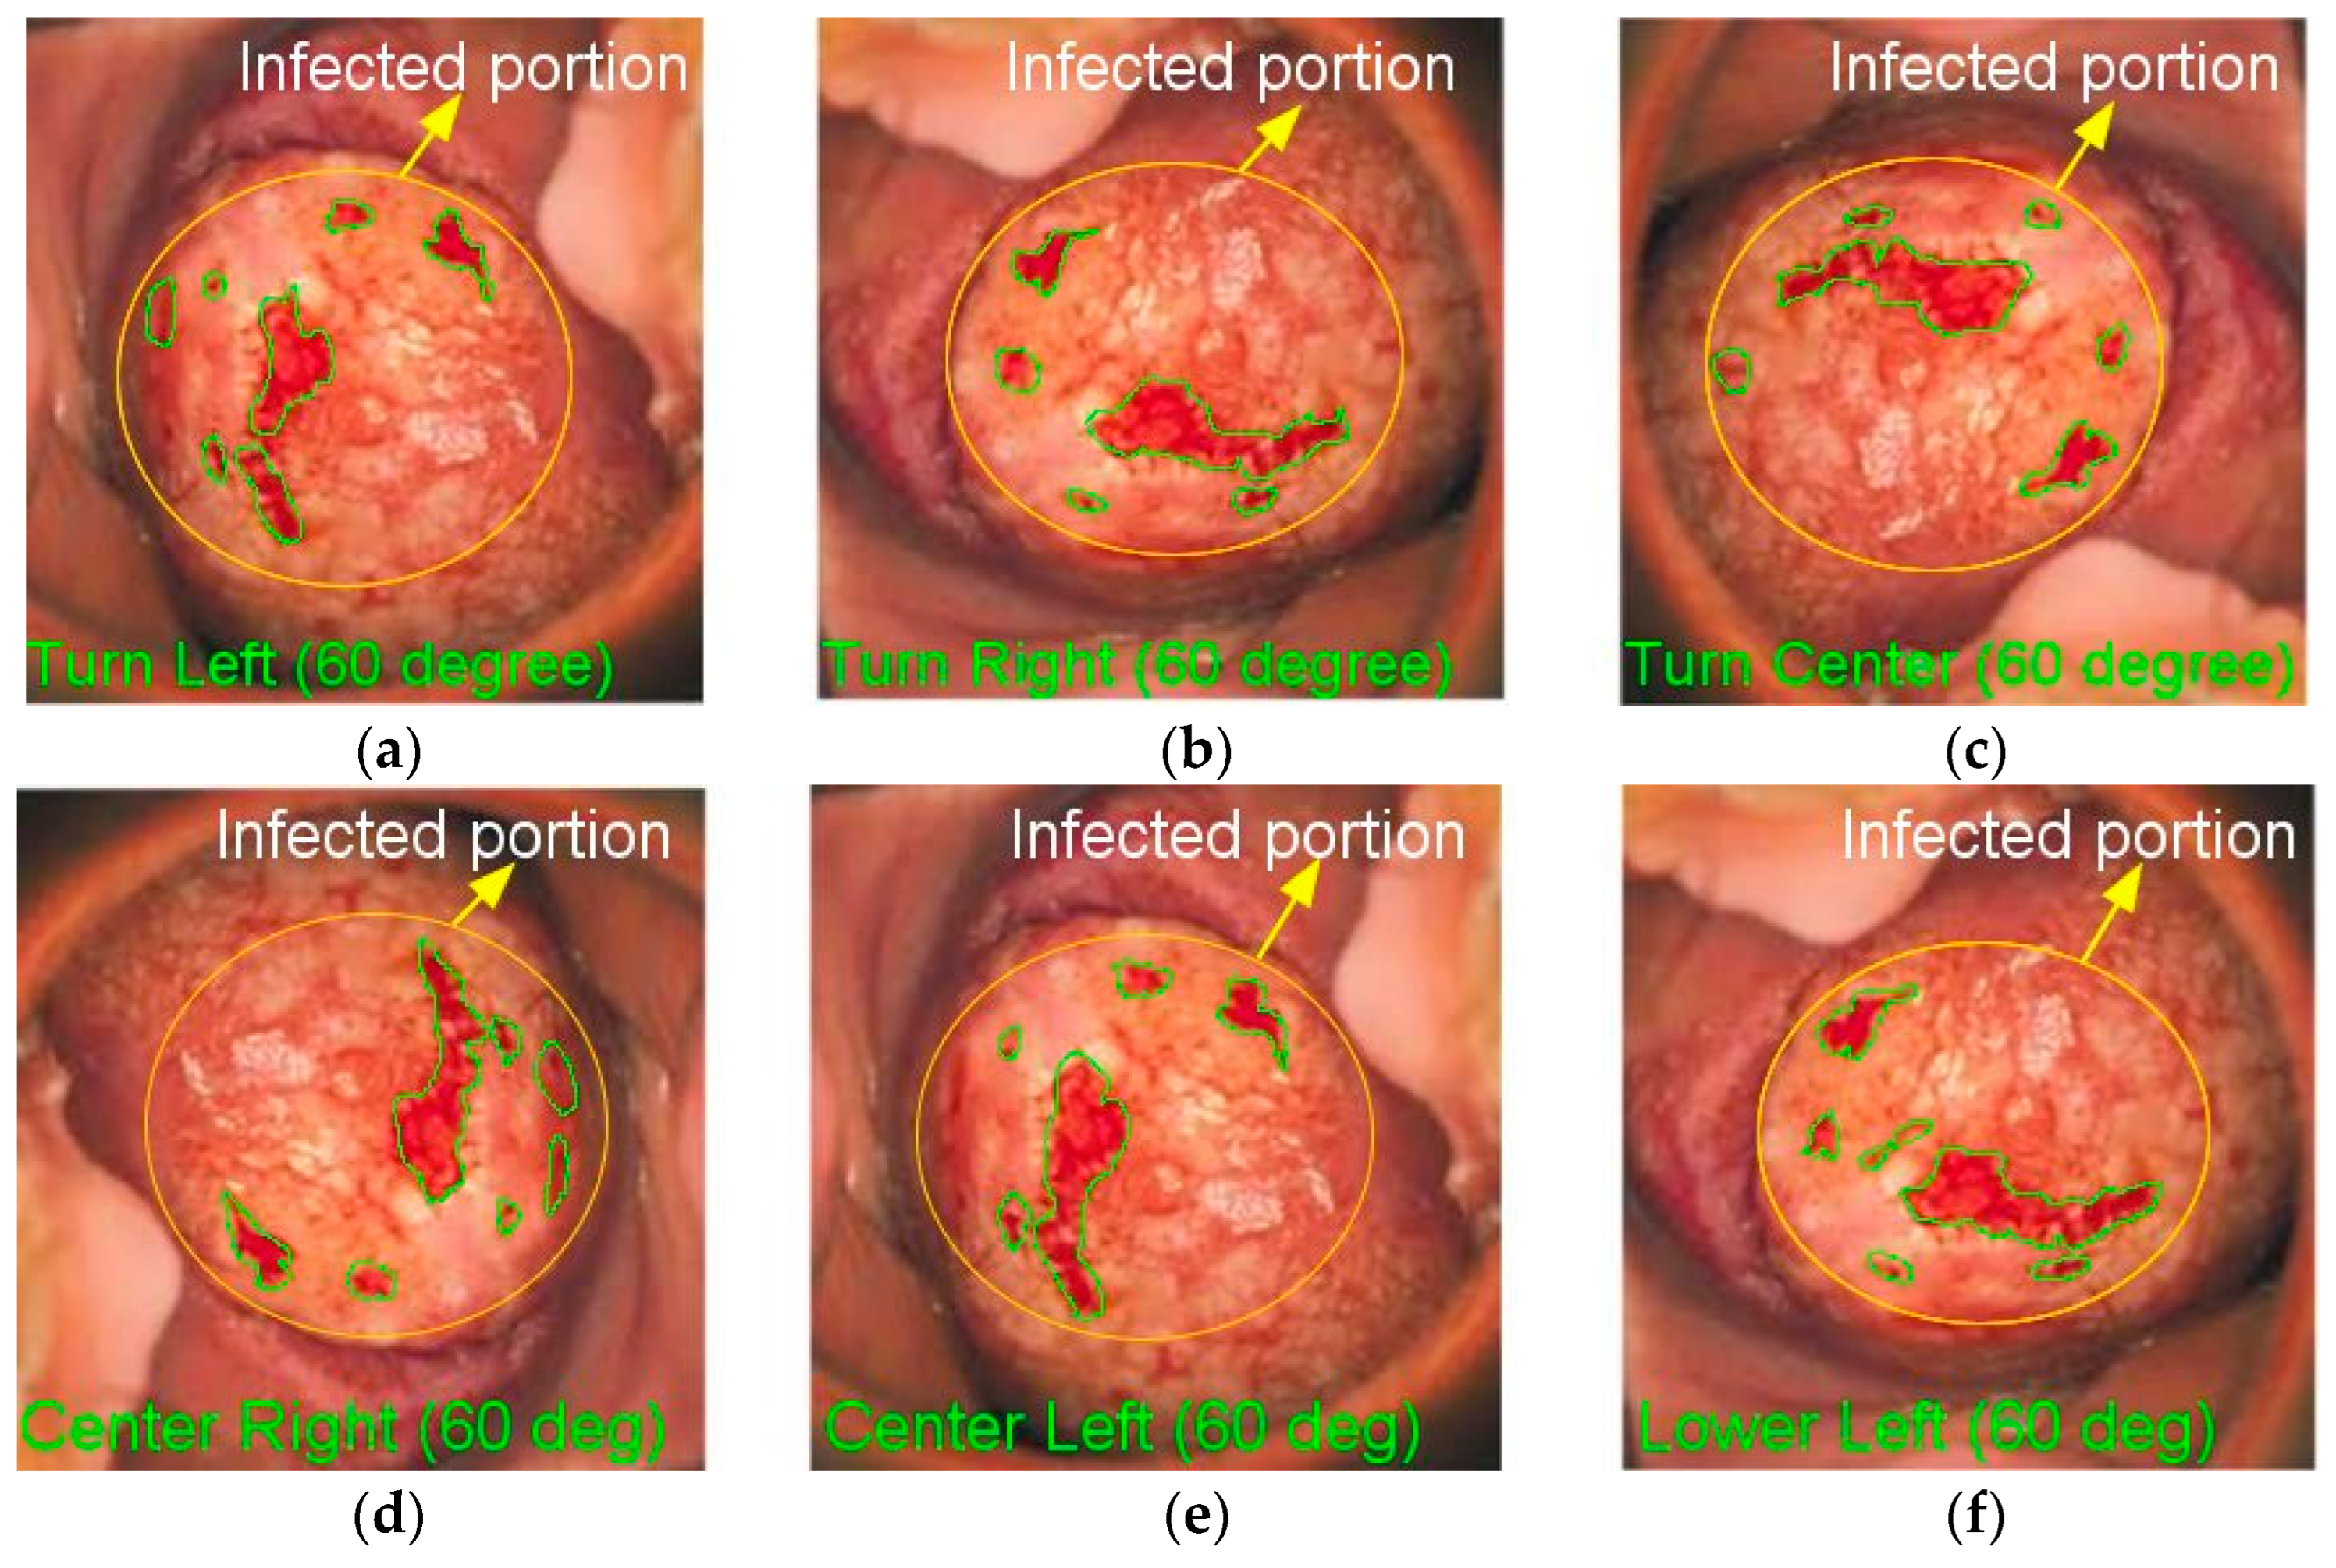
4. Results and Discussion
5. Conclusions
Author Contributions
Funding
Institutional Review Board Statement
Informed Consent Statement
Data Availability Statement
Conflicts of Interest
References
- Park, Y.R.; Kim, Y.J.; Ju, W.; Nam, K.; Kim, S.; Kim, K.G. Comparison of machine and deep learning for the classification of cervical cancer based on cervicography images. Sci. Rep. 2021, 11, 16143. [Google Scholar] [CrossRef] [PubMed]
- Chang, C.C.; Cheng, S.L.; Lu, C.J.; Liao, K.H. Prediction of recurrence in patients with cervical cancer using MARS and classification. Int. J. Mach. Learn. Comput. 2013, 3, 75–78. [Google Scholar] [CrossRef]
- Chu, R. Risk stratification of early-stage cervical cancer with intermediate-risk factors: Model development and validation based on machine learning algorithm. Oncologist 2021, 26, 13956. [Google Scholar] [CrossRef] [PubMed]
- Saravanan, S.; Kumar, V.V.; Sarveshwaran, V.; Indirajithu, A.; Elangovan, D.; Allayear, S.M. Computational and Mathematical Methods in Medicine Glioma Brain Tumor Detection and Classification Using Convolutional Neural Network. Comput. Math. Methods Med. 2022, 22, 4380901. [Google Scholar] [CrossRef] [PubMed]
- Kruczkowski, M.; Drabik-Kruczkowska, A.; Marciniak, A.; Tarczewska, M.; Kosowska, M.; Szczerska, M. Predictions of cervical cancer identification by photonic method combined with machine learning. Sci. Rep. 2022, 12, 3762. [Google Scholar] [CrossRef] [PubMed]
- Charoenkwan, P.; Shoombuatong, W.; Nantasupha, C.; Muangmool, T.; Suprasert, P.; Charoenkwan, K. IPMI: Machine learning-aided identification of parametrial invasion in women with early-stage cervical cancer. Diagnostics 2021, 11, 1454. [Google Scholar] [CrossRef]
- Saravanan, S.; Thirumurugan, P. Performance analysis of glioma brain tumor segmentation using Ridgelet transform and co-active adaptive neuro fuzzy expert system methodology. J. Med. Imaging Health Inform. 2020, 10, 2642–2648. [Google Scholar] [CrossRef]
- Lilhore, U.K.; Poongodi, M.; Kaur, A.; Simaiya, S.; Algarni, A.D.; Elmannai, H.; Vijayakumar, V.; Tunze, G.B.; Hamdi, M. Hybrid Model for Detection of Cervical Cancer Using Causal Analysis and Machine Learning Techniques. Comput. Math. Methods Med. 2022, 22, 4688327. [Google Scholar] [CrossRef]
- Abadi, D.; Departnment, U.; Wustqa, N.; Nurhayadi. Diagnosis of brain cancer using radial basis function neural network with singular value decomposition method. Int. J. Mach. Learn. Comput. 2019, 9, 527–532. [Google Scholar] [CrossRef]
- Ghoneim, A.; Muhammad, G.; Hossain, M.S. Cervical cancer classification using convolutional neural networks and extreme learning machines. Future Gener. Comput. Syst. 2020, 102, 643–649. [Google Scholar] [CrossRef]
- Gupta, L.; Edelen, A.; Neveu, N.; Mishra, A.; Mayes, C.; Kim, Y.K. Improving surrogate model accuracy for the LCLS-II injector frontend using convolutional neural networks and transfer learning. Mach. Learn. Sci. Technol. 2021, 2, 1245–1265. [Google Scholar] [CrossRef]
- Novitasari, D.C.R.; Asyhar, A.H.; Thohir, M. Cervical Cancer Identification Based Texture Analysis Using GLCM-KELM on Colposcopy Data. In Proceedings of the International Conference on Artificial Intelligence in Information and Communication, Fukuoka, Japan, 19–21 February 2020; pp. 409–414. [Google Scholar]
- Fei, D.Y.; Almasiri, O.; Rafig, A. Skin cancer detection using support vector machine learning classification based on particle swarm optimization capabilities. Trans. Mach. Learn. Artif. Intell. 2020, 8, 1–13. [Google Scholar] [CrossRef]
- Kapil, S.; Lilhore, U.K.; Agarwal, N. An improved data reduction technique based on KNN & NB with hybrid selection method for effective software bugs triage. Int. J. Sci. Res. Comput. Sci. Eng. Inf. Technol. 2018, 3, 633–639. [Google Scholar]
- Kaushik, M.; Joshi, R.C.; Kushwah, A.S.; Gupta, M.K.; Banerjee, M.; Burget, R.; Dutta, M.K. Cytokine gene variants and socio-demographic characteristics as predictors of cervical cancer: A machine learning approach. Comput. Biol. Med. 2021, 134, 104559. [Google Scholar] [CrossRef] [PubMed]
- Roy, S.; Meena, T.; Lim, S.J. Demystifying Supervised Learning in Healthcare 4.0: A New Reality of Transforming Diagnostic Medicine. Diagnostics 2022, 12, 2549. [Google Scholar] [CrossRef]
- Kaur, K.; Mann, S. A novel framework for cloud-based bone age assessment integration system: Review and analysis. Int. J. Comput. Eng. Res. 2017, 7, 6. [Google Scholar]
- Roy, S.; Shoghi, K.I. Computer-Aided Tumor Segmentation from T2-Weighted MR Images of Patient-Derived Tumor Xenografts. Image Anal. Recognit. 2019, 11663, 159–171. [Google Scholar]
- Iwendi, C.; Khan, S.; Anajemba, J.H.; Bashir, A.K.; Noor, F. Realizing an efficient IoMT-assisted patient diet recommendation system through machine learning model. IEEE Access 2020, 8, 28462–28474. [Google Scholar] [CrossRef]
- Srivastava, V.; Kumar, D.; Roy, S. A median based quadrilateral local quantized ternary pattern technique for the classification of dermatoscopic images of skin cancer. Comput. Electr. Eng. 2022, 102, 108259. [Google Scholar] [CrossRef]
- Dhanamjayulu, C.; Nizhal, U.N.; Maddikunta, P.K.R.; Gadekallu, T.R.; Iwendi, C. Identification of malnutrition and prediction of BMI from facial images using real-time image processing and machine learning. IET Image Process 2021, 16, 647–658. [Google Scholar]
- Iwendi, C. Sanitization: A semantic privacy-preserving framework for unstructured medical datasets. J. Comput. Commun. 2020, 161, 160–171. [Google Scholar] [CrossRef]
- Abbas, S.; Jalil, Z.; Javed, A.R.; Batool, I.; Khan, M.Z.; Noorwali, A.; Gadekallu, T.R.; Akbar, A. BCD-WERT: A novel approach for breast cancer detection using whale optimization-based efficient features and extremely randomized tree algorithm. PeerJ Comput. Sci. 2021, 7, e390. [Google Scholar] [CrossRef] [PubMed]
- Simaiya, S.; Lilhore, U.K.; Prasad, D.; Verma, D.K. MRI brain tumor detection & image segmentation by hybrid hierarchical K-means clustering with FCM based machine learning model. Ann. Rom. Soc. Cell Biol. 2021, 25, 88–94. [Google Scholar]
- Sahu, M.; Padhy, N.; Gantayat, S.S.; Sahu, A.K. Local binary pattern-based reversible data hiding. CAAI Trans. Intell. Technol. 2022, 7, 695–709. [Google Scholar] [CrossRef]
- International Agency for Research on Cancer. Available online: https://screening.iarc.fr/cervicalimagebank.php (accessed on 7 October 2022).


| Author Name | Technique | Obtained |
|---|---|---|
| Ghoneim et al. (2020) [10] | ELM-, multi-layer perceptron (MLP)- and autoencoder (AE)-based classifiers | Using the Herlev database, the proposed system with the ELM-based classifier achieved 98.7% accuracy in the 2-class problem and 97.2% accuracy in the 7-class problem |
| Dian Candra Rini Novitasari et al. (2020) [12] | Texture information, pixel neighbor information, gray-level co-occurrence matrix and kernel extreme learning machine | Linear kernel resulted in an error of 78.5%, polynomial kernel an error of 87.5% and the best accuracy of 95% was achieved using a gaussian kernel with the best neighborhood angle of 45° |
| Fei et al. (2020) [13] | Support vector machine, particle swarm optimization | Segmentation was robust because the local extracted features from ROI were acceptable. This technique provides high accuracy to support assisting clinicians in classifying skin lesion images into relevant diagnostic categories |
| Kaushik et al. (2021) [15] | Five-fold cross-validation, logistic regression | Highest average accuracy of 82.25% and highest average F1-score of 82.58% |
| Sudipta Roy et al. (2022) [10] | Supervised machine learning | Effectiveness and potential for innovation of disease diagnosis, personalized medicine, clinical trials, non-invasive image analysis, drug discovery |
| Sudipta Roy et al. (2019) [16] | Patient-derived tumor xenografts, fast k-means, morphology | Segmentation results obtained from six metrics were Jaccard score (>80%), Dice score (>85%), F-score (>85%), G-mean (>90%), volume similarity matrix (>95%) |
| Varun Srivastava et al. (2022) [20] | Median-based local ternary pattern | The proposed technique, the average recall value, average precision and average accuracy were found to be 75.20%, 95.44%, and 96% respectively |
| Abbas et al. (2021) [23] | Extremely randomized tree and whale optimization algorithm | BCD-WERT outperformed all with the highest accuracy rate of 99.30% followed by SVM achieving 98.60% accuracy |
| Simaiya et al. (2021) [24] | Hierarchical k-means clustering with fuzzy c and Super-Rule-Tree | Plus-Rule-Tree to face the issue of misplaced patterns. Proposed method had accuracy of 88.9%, and existing k-means clustering method showed accuracy of 85.4% |
| Metric Parameters | Estimated Values (%) |
|---|---|
| Sensitivity | 92.17 |
| Specificity | 98.92 |
| Accuracy | 97.11 |
| Positive Prediction Value | 98.88 |
| Negative Prediction Value | 91.91 |
| Positive Likelihood Ratio | 141.02 |
| Negative Likelihood Ratio | 0.0878 |
| Precision Rate | 98.13 |
| False Positive | 97.15 |
| False Negative | 90.89 |
| Indexed Features | Accuracy (%) |
|---|---|
| GLRLM | 92.87 |
| GLRLM+FRT | 93.92 |
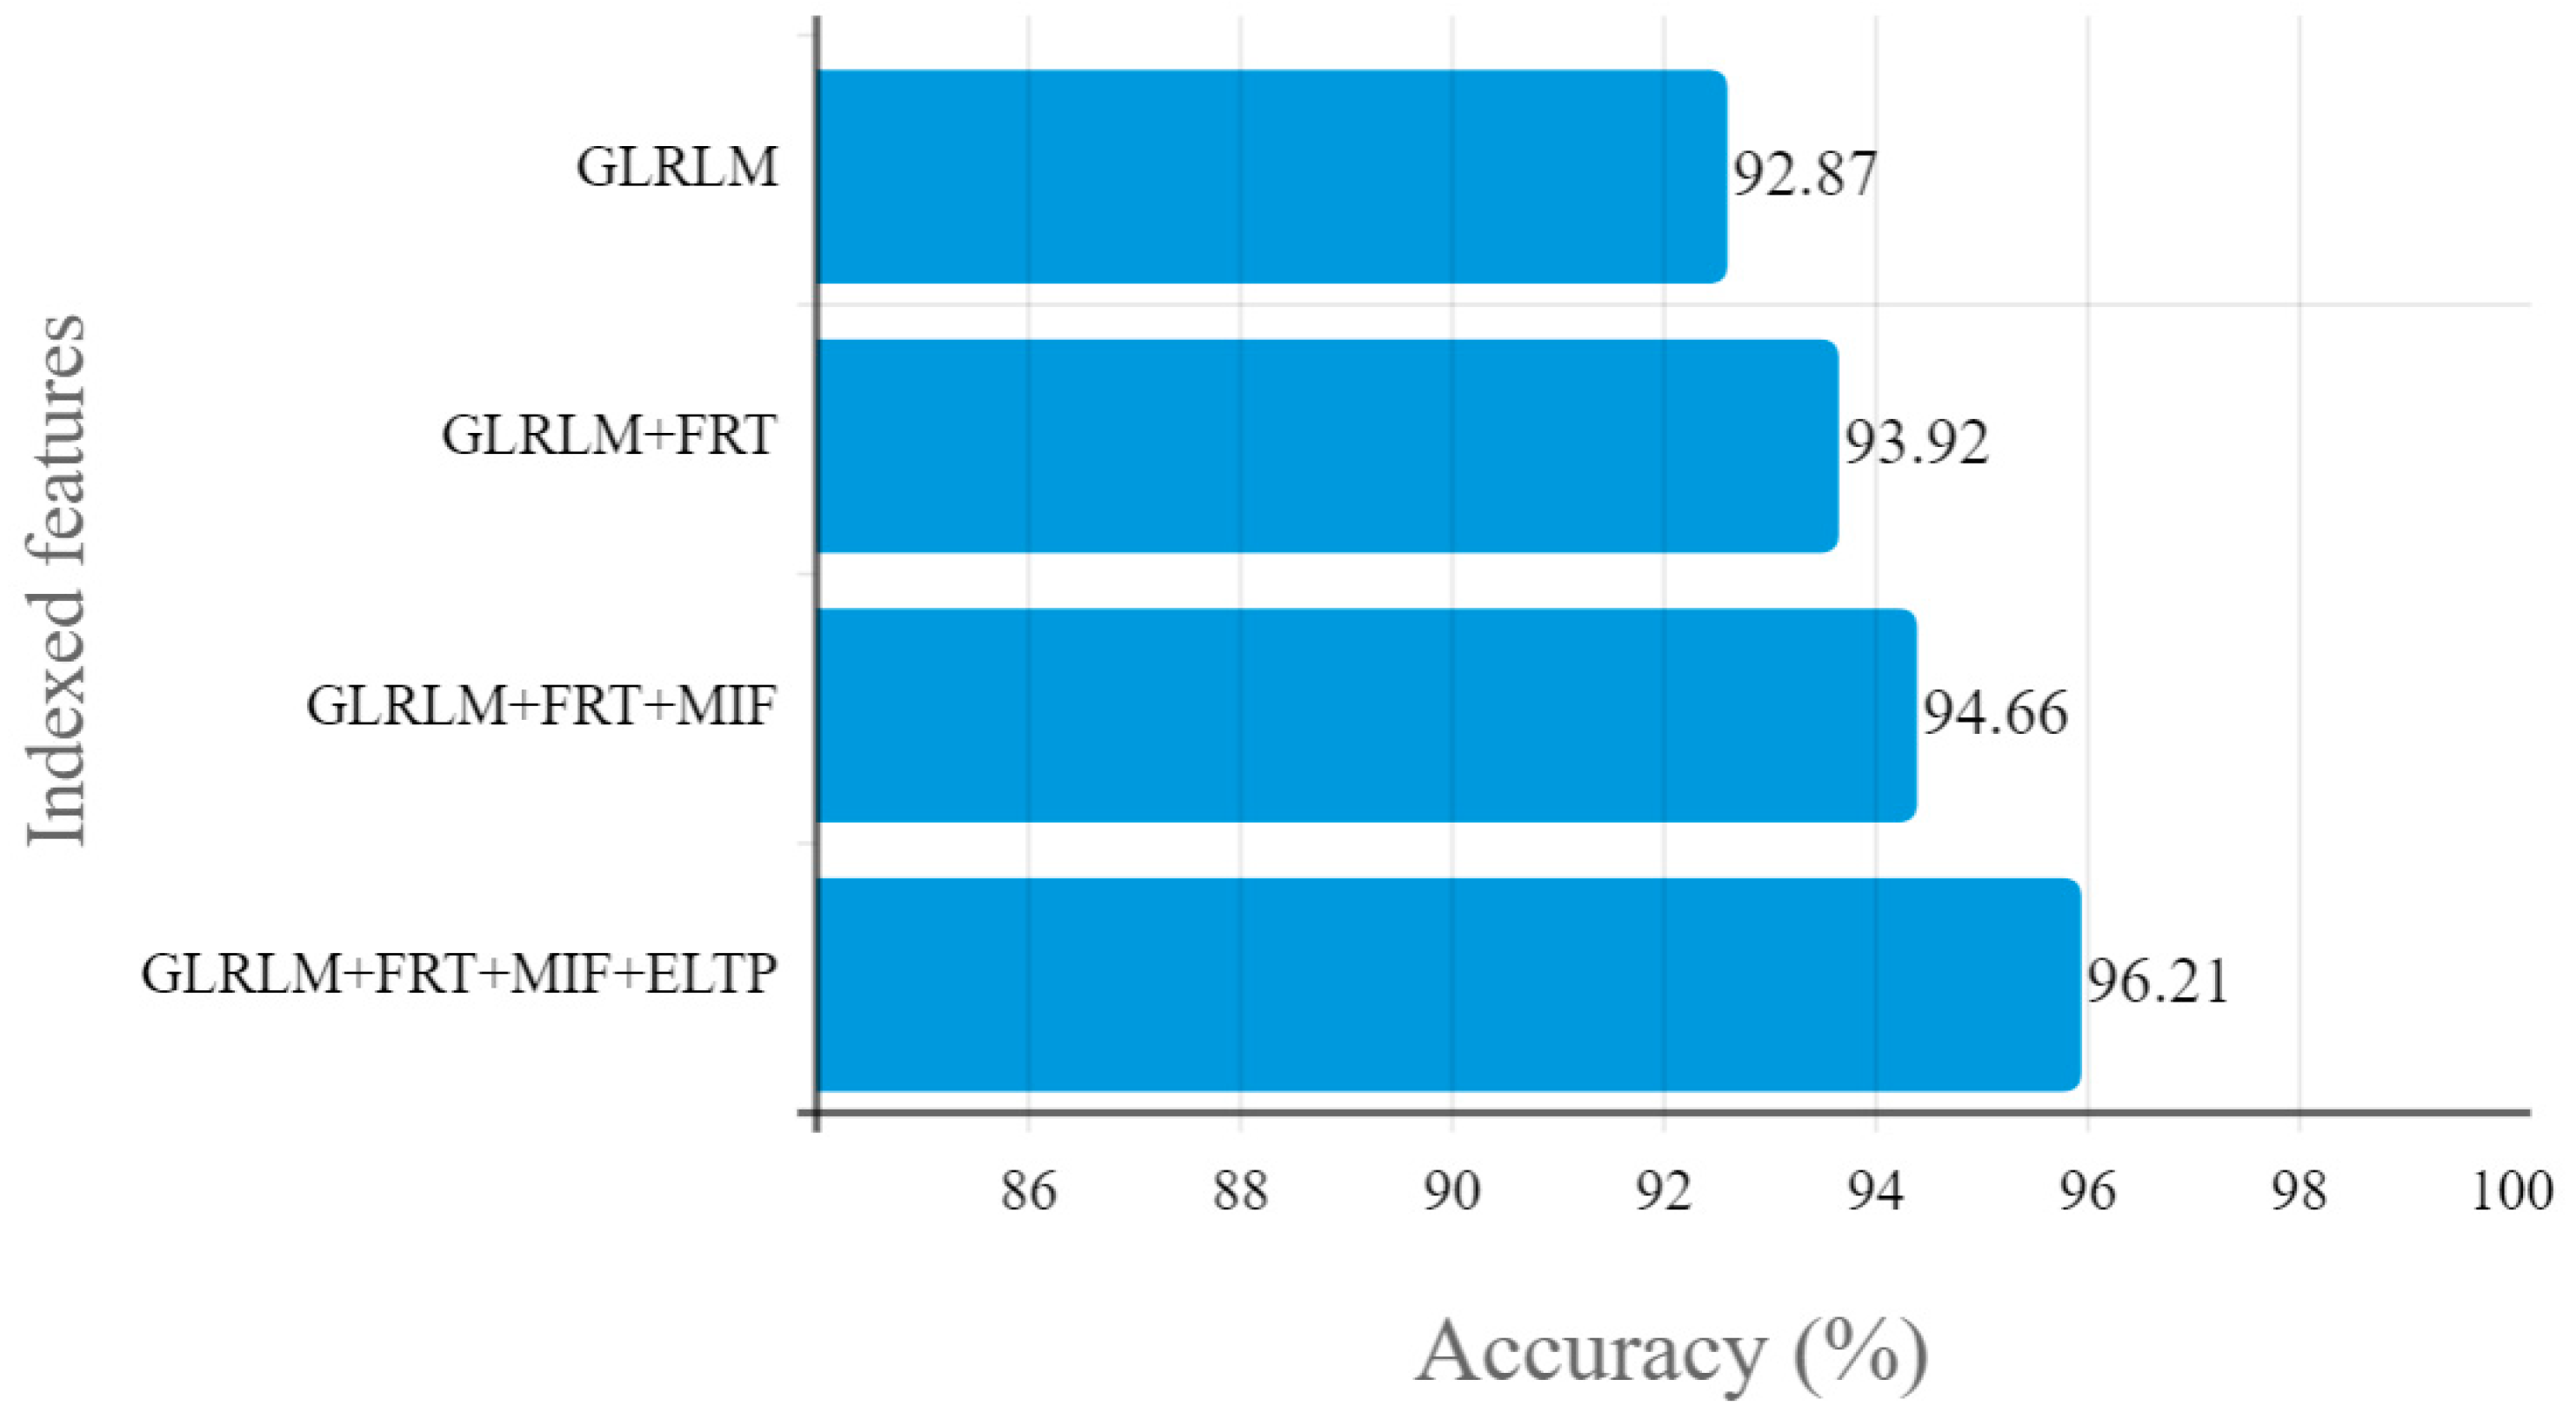
| GLRLM+FRT+MIF | 94.66 |
| GLRLM+FRT+MIF+ELTP | 96.21 |
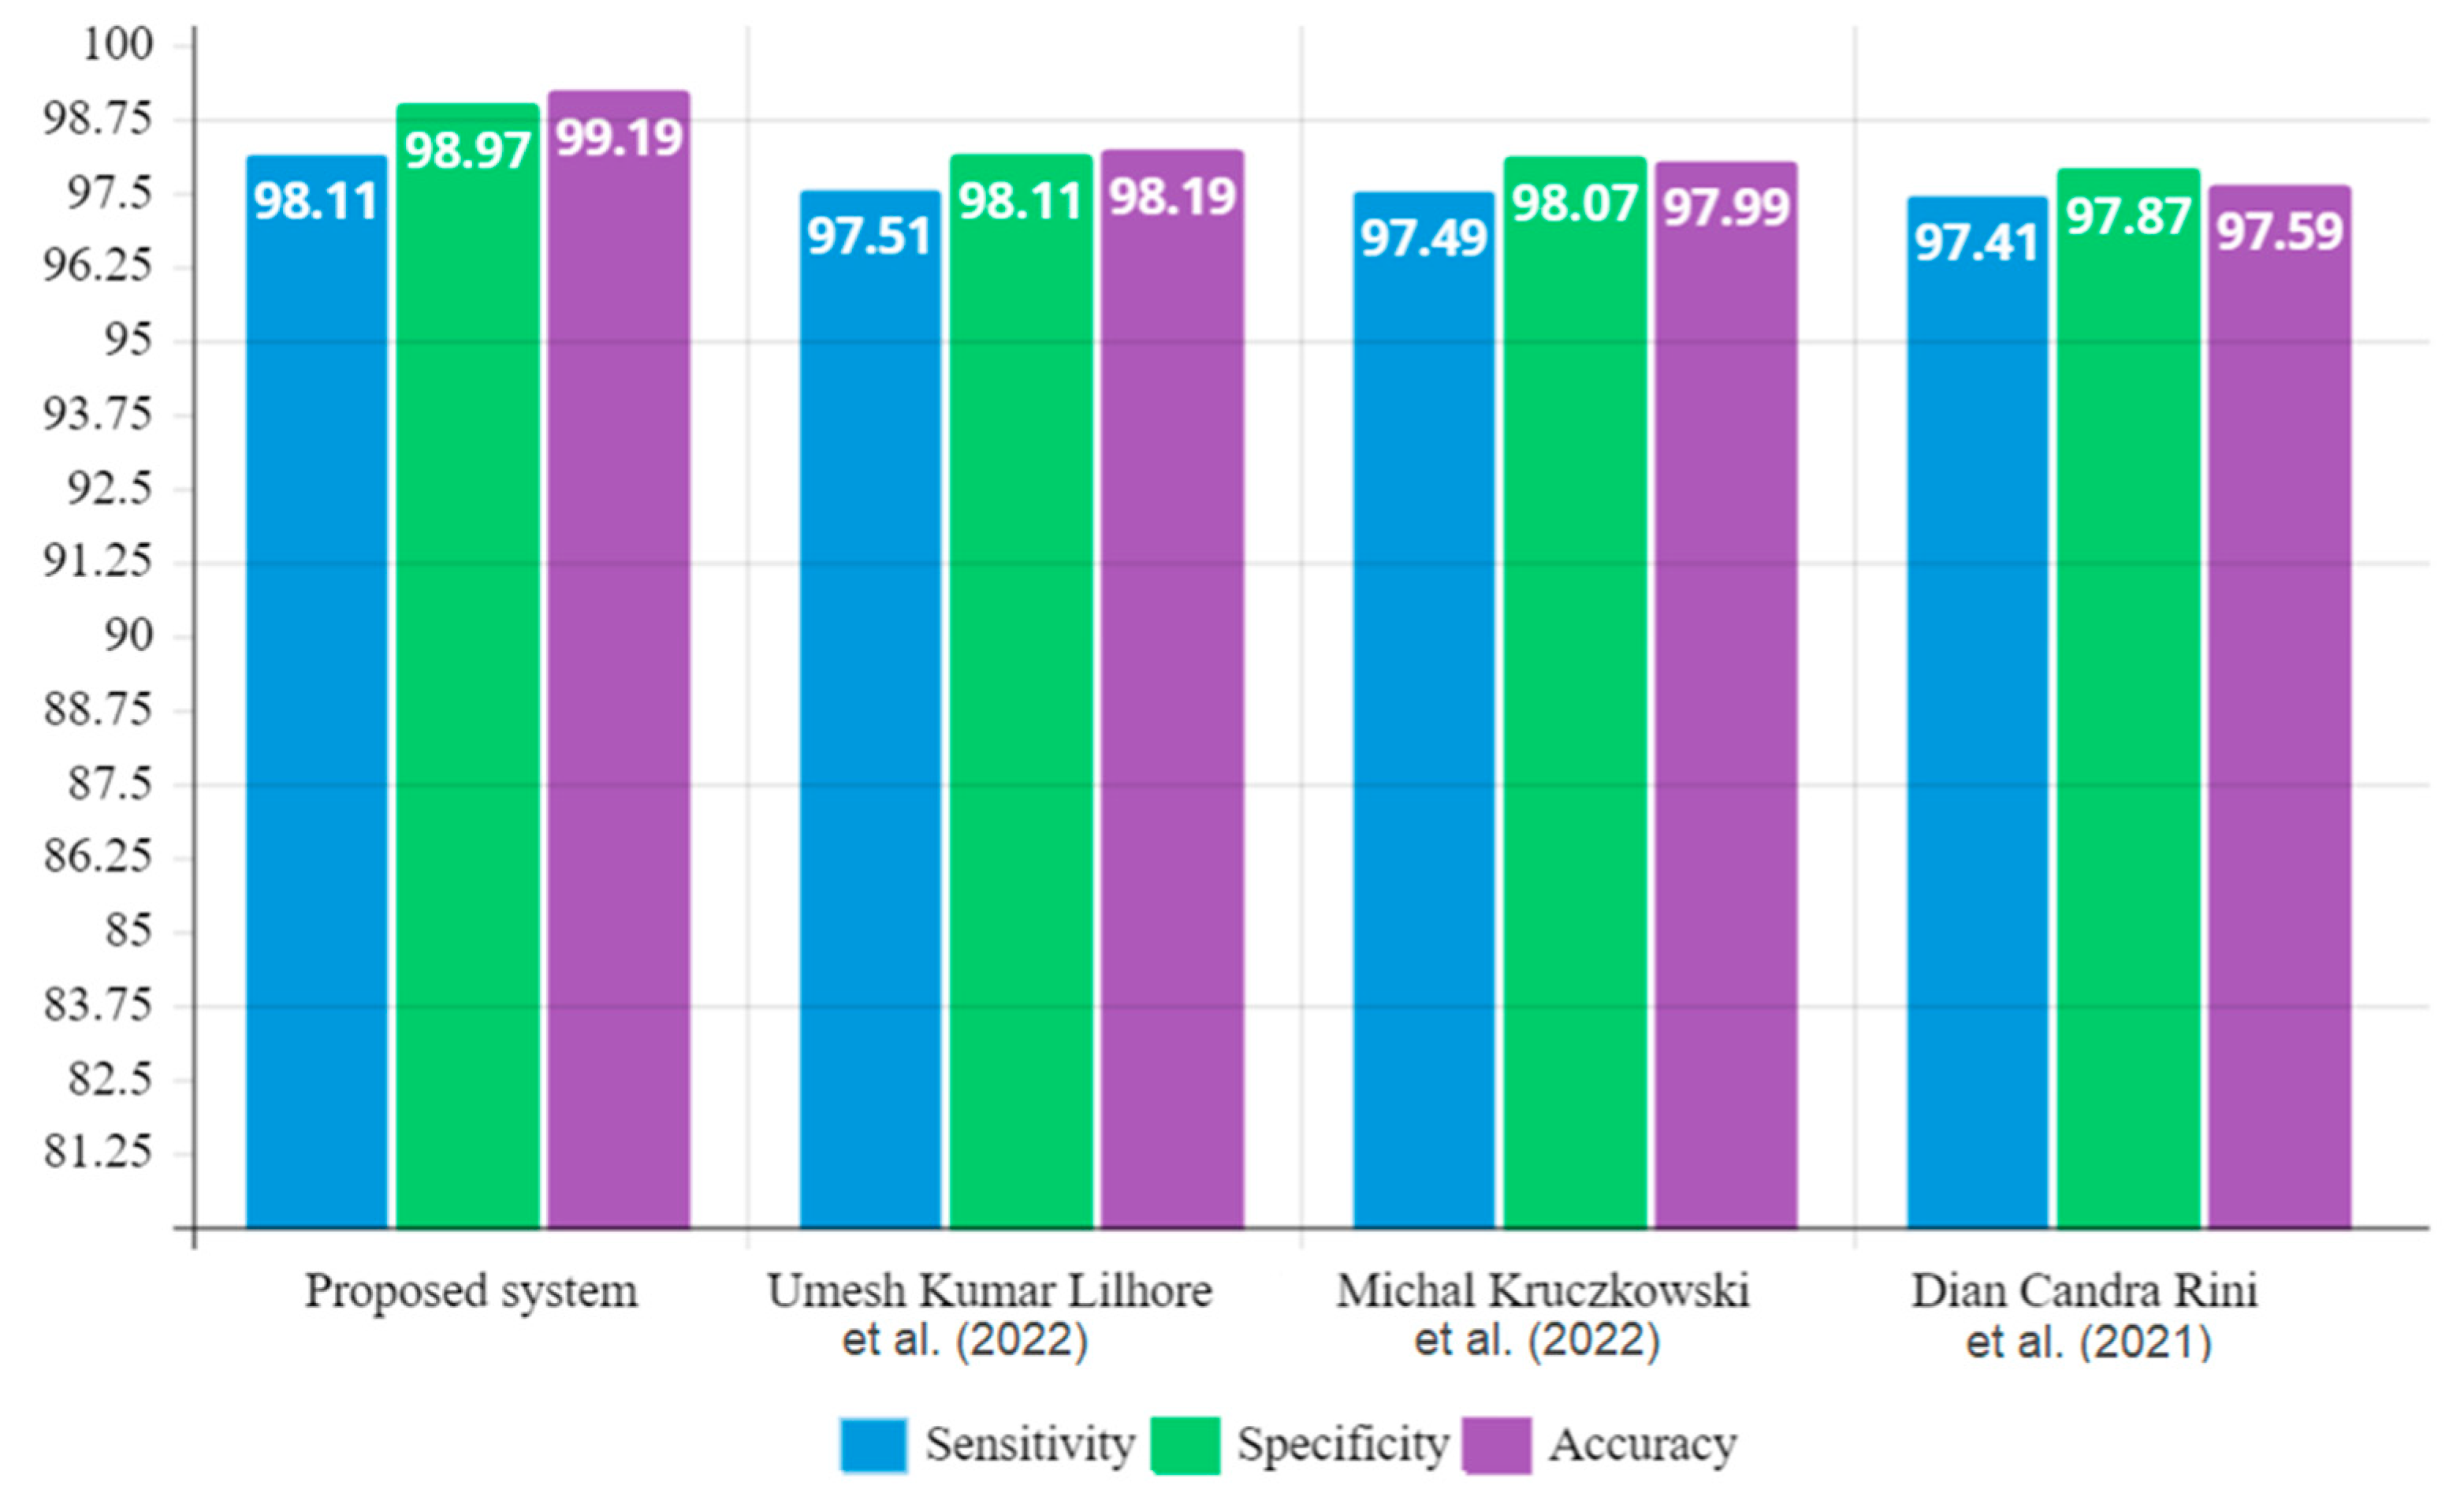
| Technique/Method | Parameters | ||
|---|---|---|---|
| Sensitivity (%) | Specificity (%) | Accuracy (%) | |
| Proposed system | 98.11 | 98.97 | 99.19 |
| Umesh Kumar Lilhore et al. (2021) [24] | 97.51 | 98.11 | 98.19 |
| Michał Kruczkowski et al. (2022) [5] | 97.49 | 98.07 | 97.99 |
| Dian Candra Rini Novitasari et al. (2020) [12] | 97.41 | 97.87 | 97.59 |
Disclaimer/Publisher’s Note: The statements, opinions and data contained in all publications are solely those of the individual author(s) and contributor(s) and not of MDPI and/or the editor(s). MDPI and/or the editor(s) disclaim responsibility for any injury to people or property resulting from any ideas, methods, instructions or products referred to in the content. |
© 2023 by the authors. Licensee MDPI, Basel, Switzerland. This article is an open access article distributed under the terms and conditions of the Creative Commons Attribution (CC BY) license (https://creativecommons.org/licenses/by/4.0/).
Share and Cite
Srinivasan, S.; Raju, A.B.K.; Mathivanan, S.K.; Jayagopal, P.; Babu, J.C.; Sahu, A.K. Local-Ternary-Pattern-Based Associated Histogram Equalization Technique for Cervical Cancer Detection. Diagnostics 2023, 13, 548. https://doi.org/10.3390/diagnostics13030548
Srinivasan S, Raju ABK, Mathivanan SK, Jayagopal P, Babu JC, Sahu AK. Local-Ternary-Pattern-Based Associated Histogram Equalization Technique for Cervical Cancer Detection. Diagnostics. 2023; 13(3):548. https://doi.org/10.3390/diagnostics13030548
Chicago/Turabian StyleSrinivasan, Saravanan, Aravind Britto Karuppanan Raju, Sandeep Kumar Mathivanan, Prabhu Jayagopal, Jyothi Chinna Babu, and Aditya Kumar Sahu. 2023. "Local-Ternary-Pattern-Based Associated Histogram Equalization Technique for Cervical Cancer Detection" Diagnostics 13, no. 3: 548. https://doi.org/10.3390/diagnostics13030548