
Respiratory Diaphragm Motion-Based Asynchronization and Limitation Evaluation on Chronic Obstructive Pulmonary Disease
 , ,
, ,
Abstract
:1. Introduction
- Using a thoracic MRI series for a relatively long time, a novel multiple-respiration-cycle-based method is developed to reliably evaluate diaphragm motion.
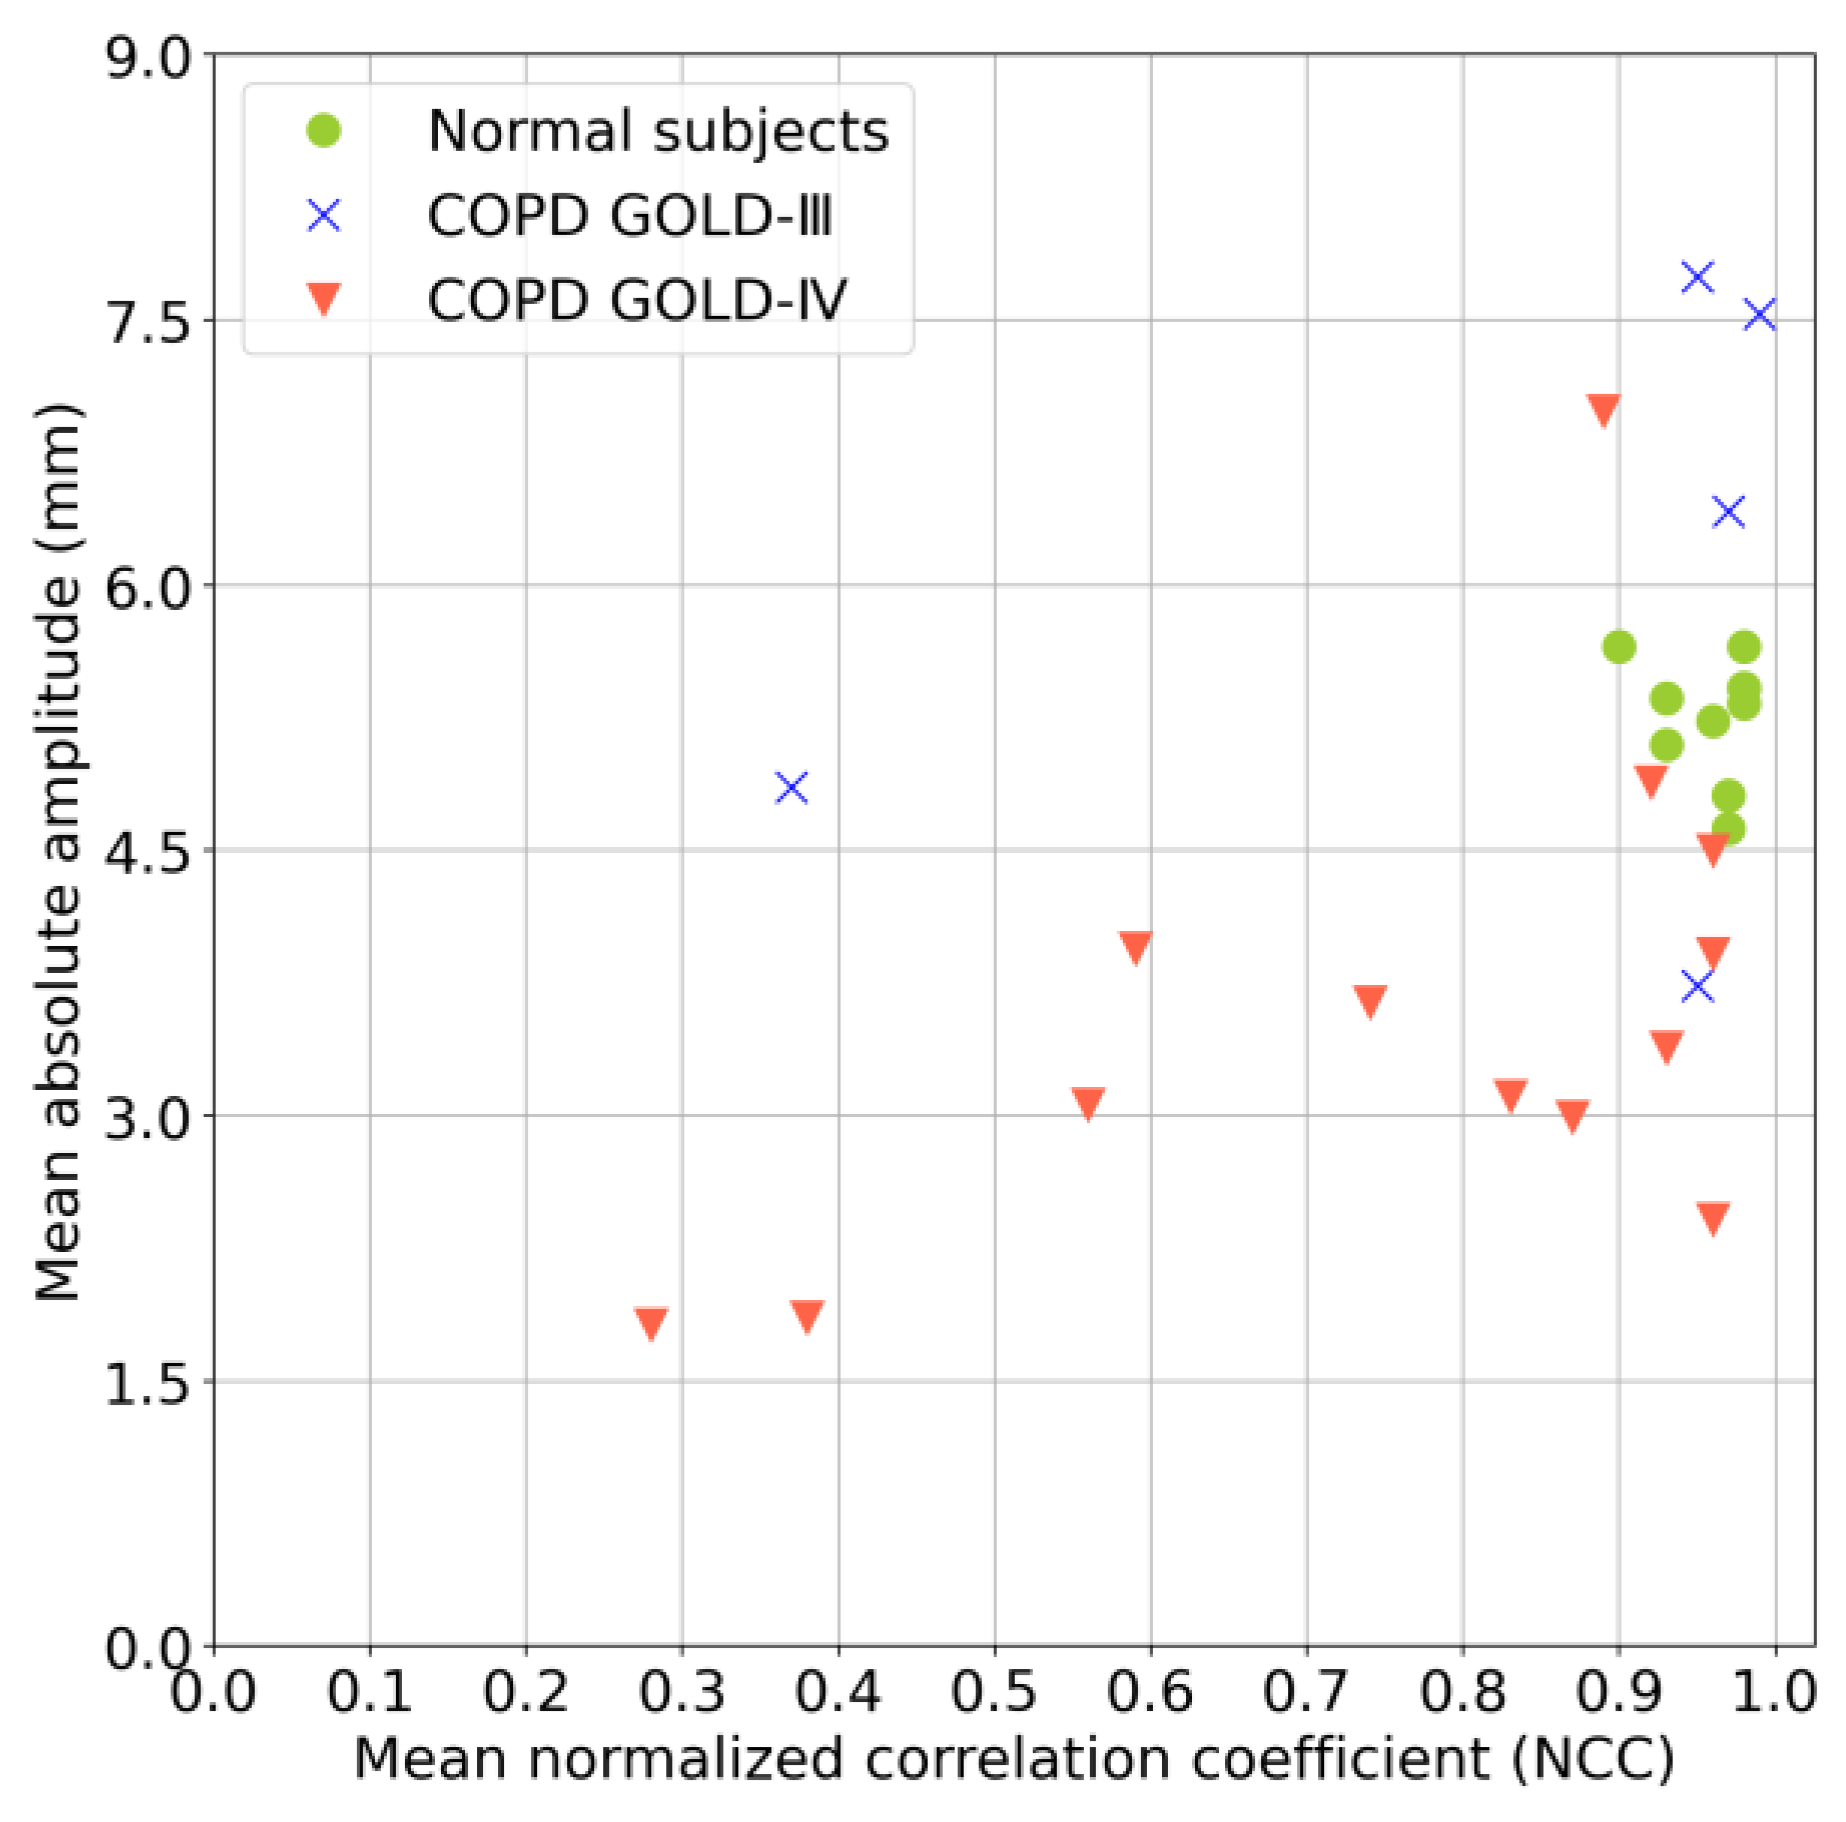
- To investigate motion asynchronization and the limitation of diaphragmatic motion of patients with COPD, two new evaluation metrics are utilized: NCC and absolute amplitude.
2. Materials and Methods
2.1. Materials
2.1.1. Participants
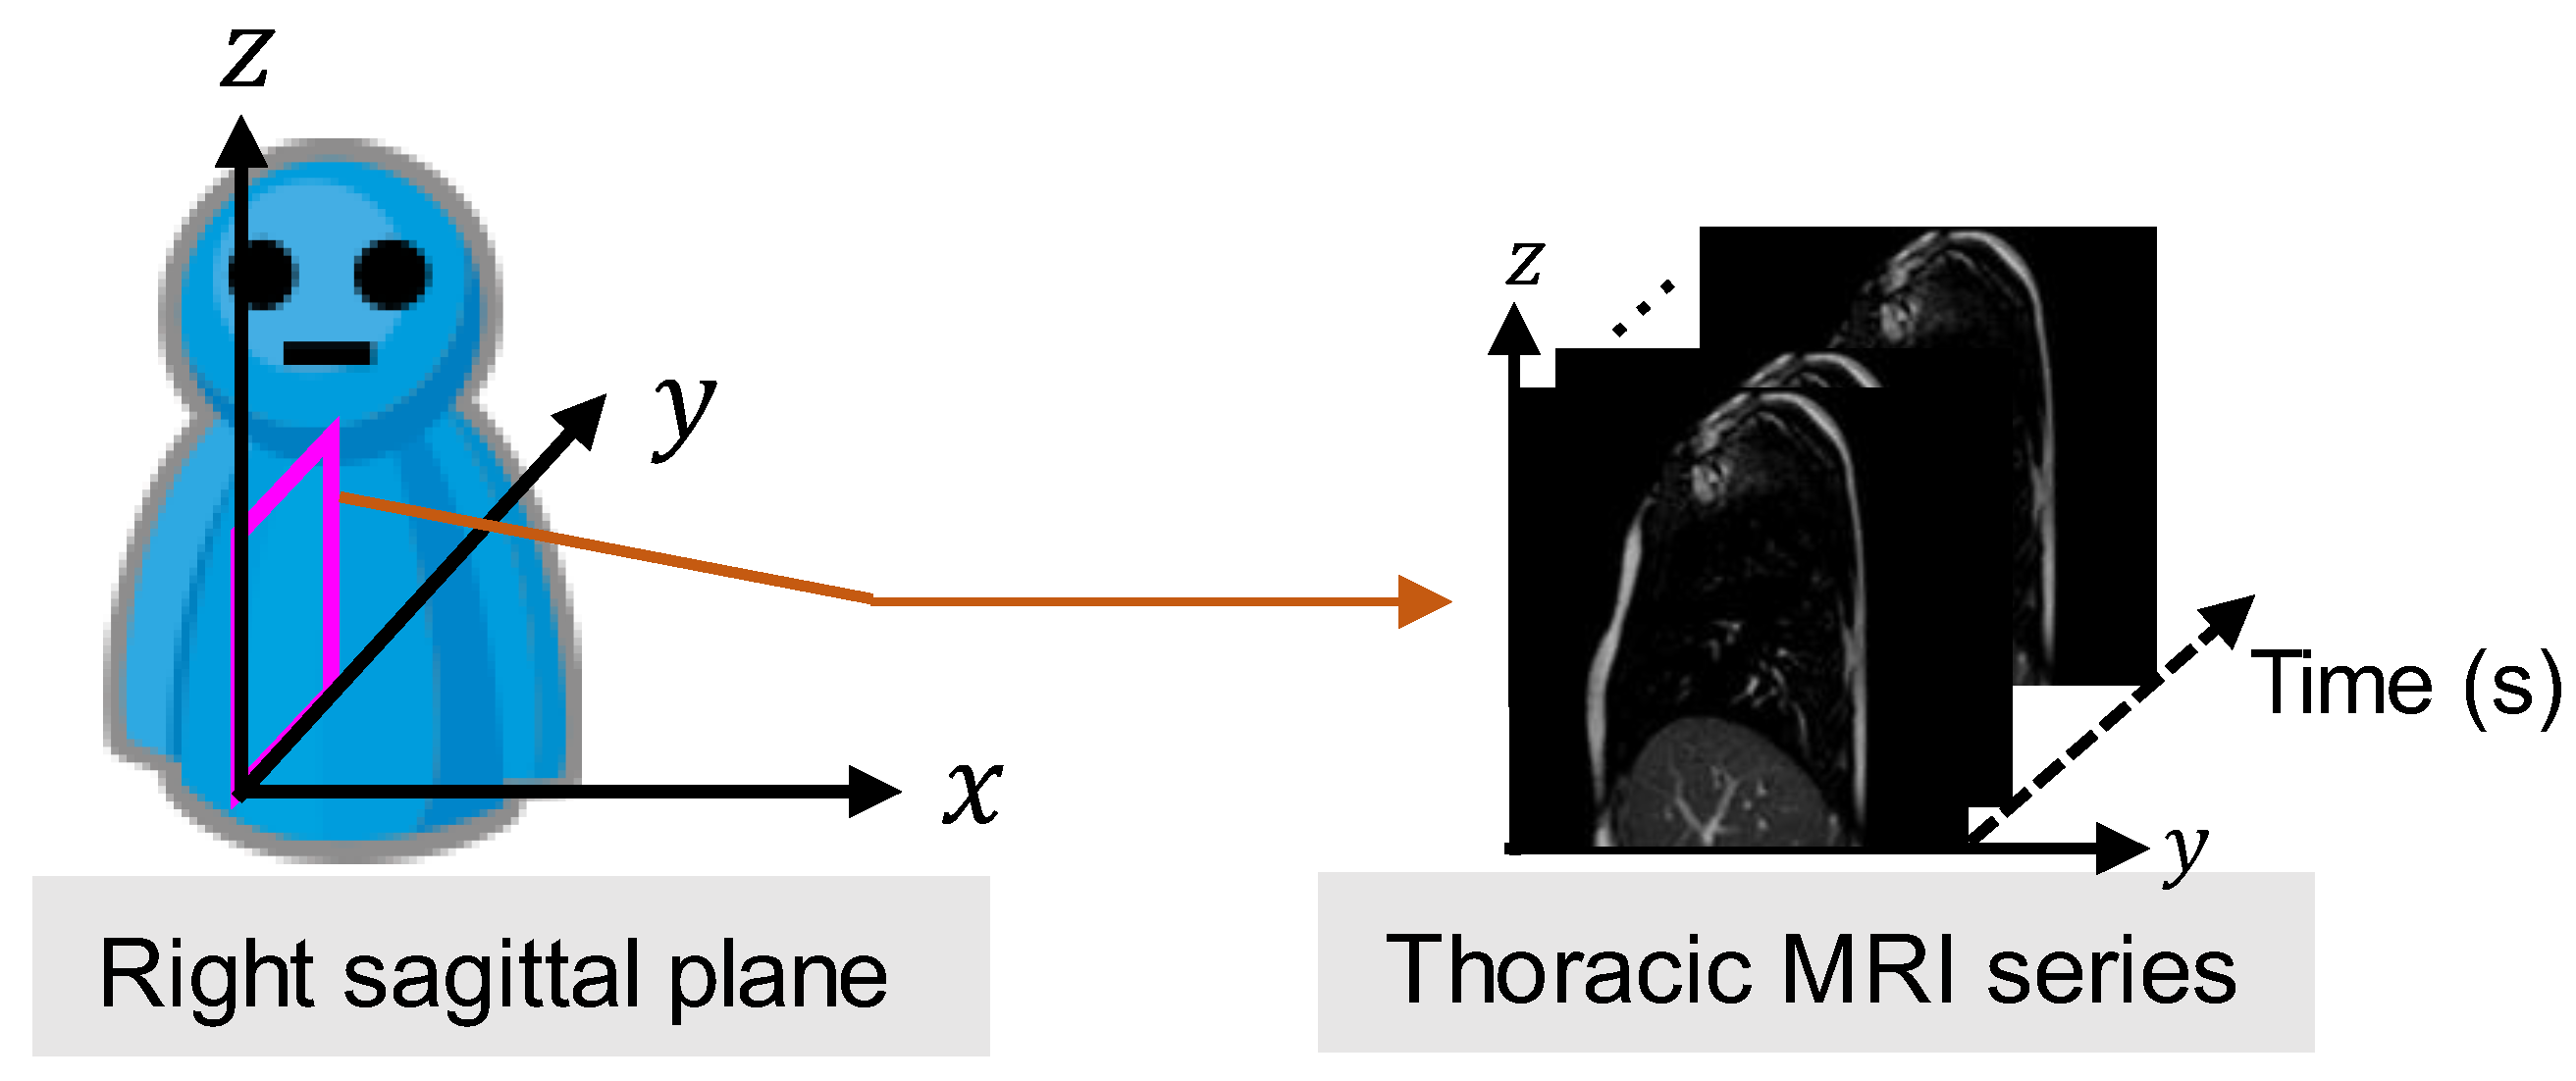
2.1.2. MRI
2.2. Method
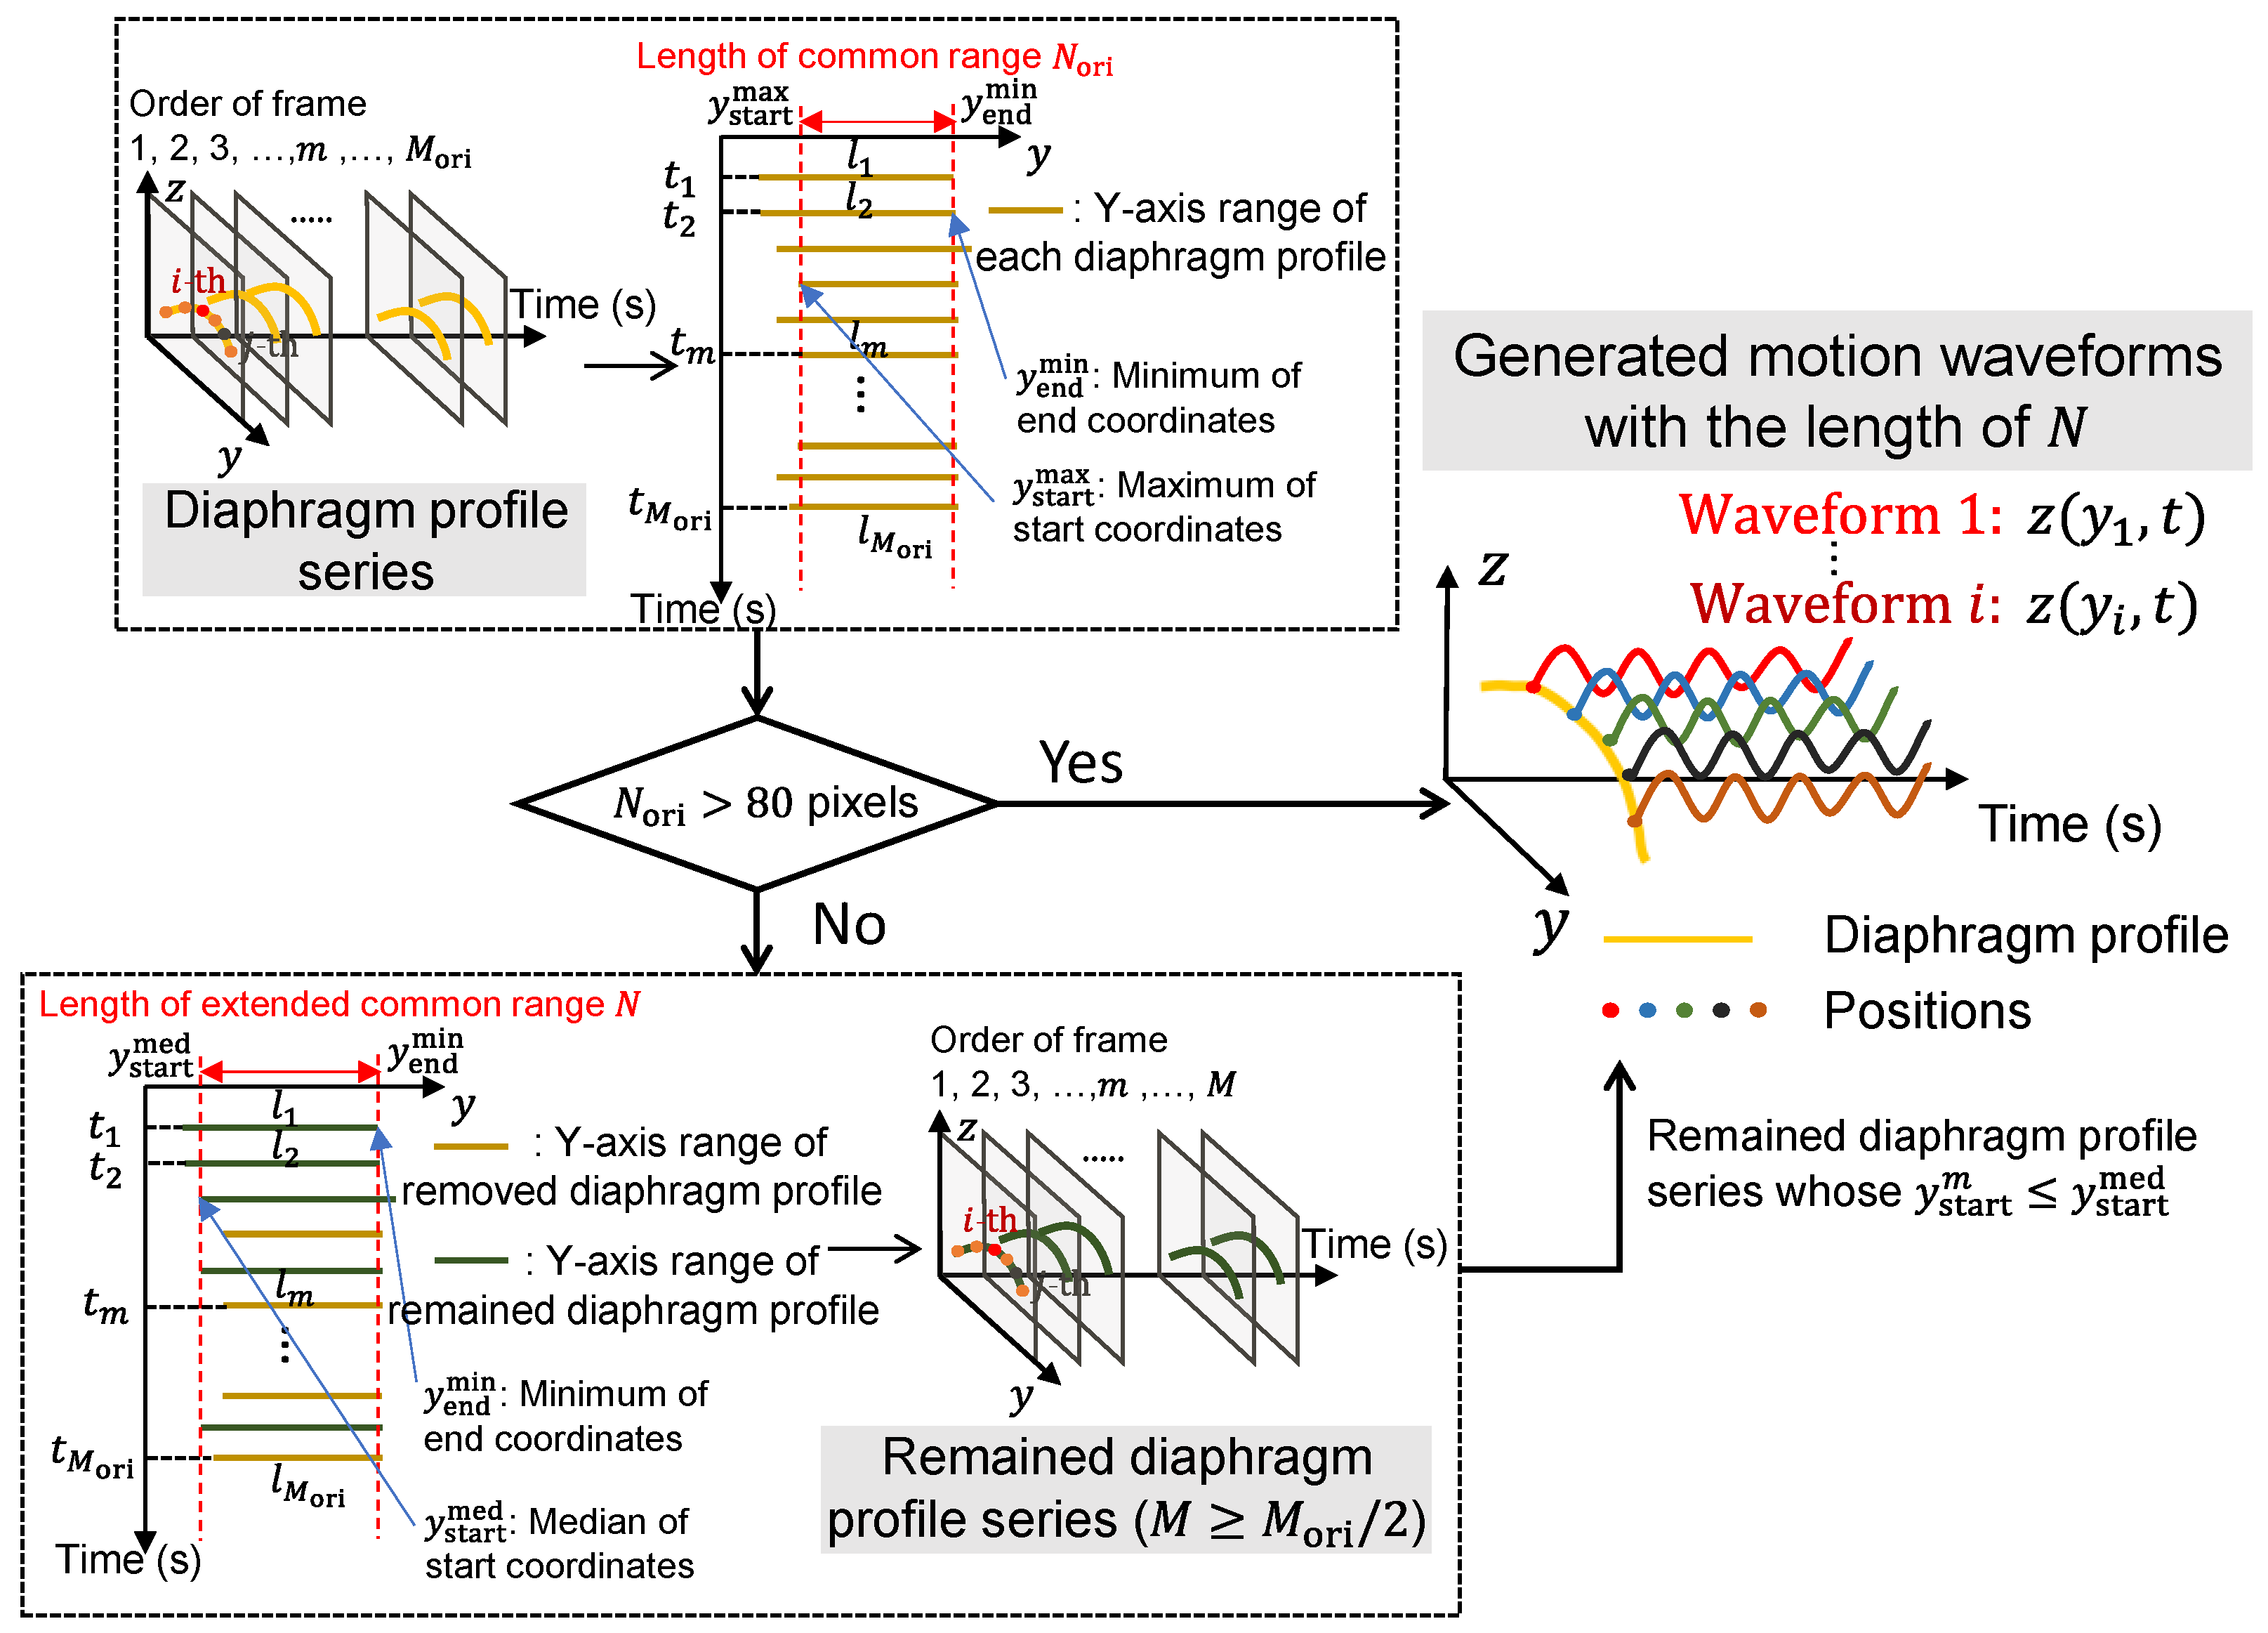
- As a pre-processing step, the trained field segmentation model of U-net [24] is used to extract the diaphragm profile series from the captured thoracic sagittal MRI series, and the time-varying vertical motion waveforms of the height for each position on the diaphragm profile were naturally generated.
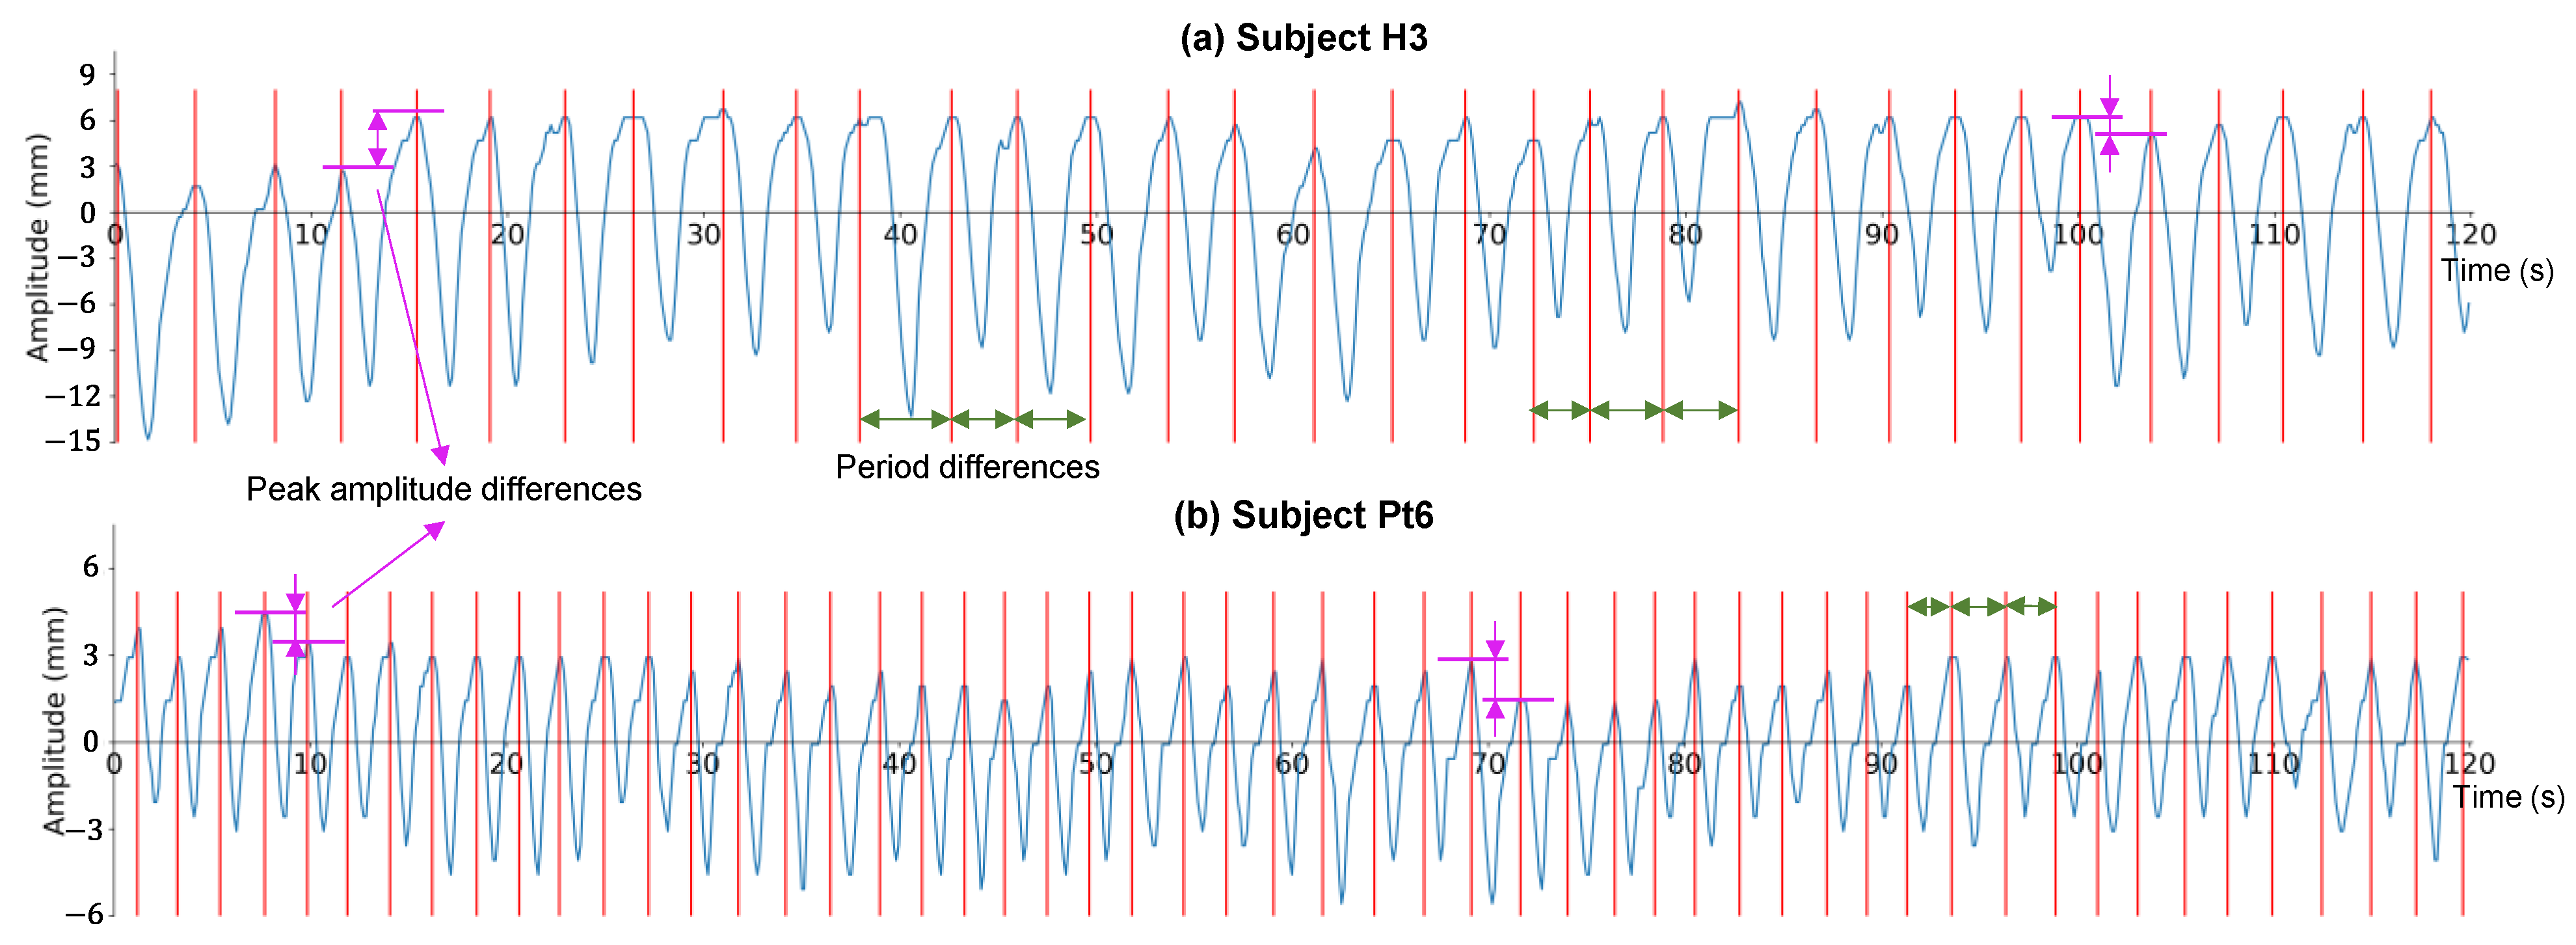
- The differences in the period and peak amplitude of the respiration cycles are verified for each subject by the motion waveforms, which motivates us to measure and evaluate diaphragm motion with multiple cycles.
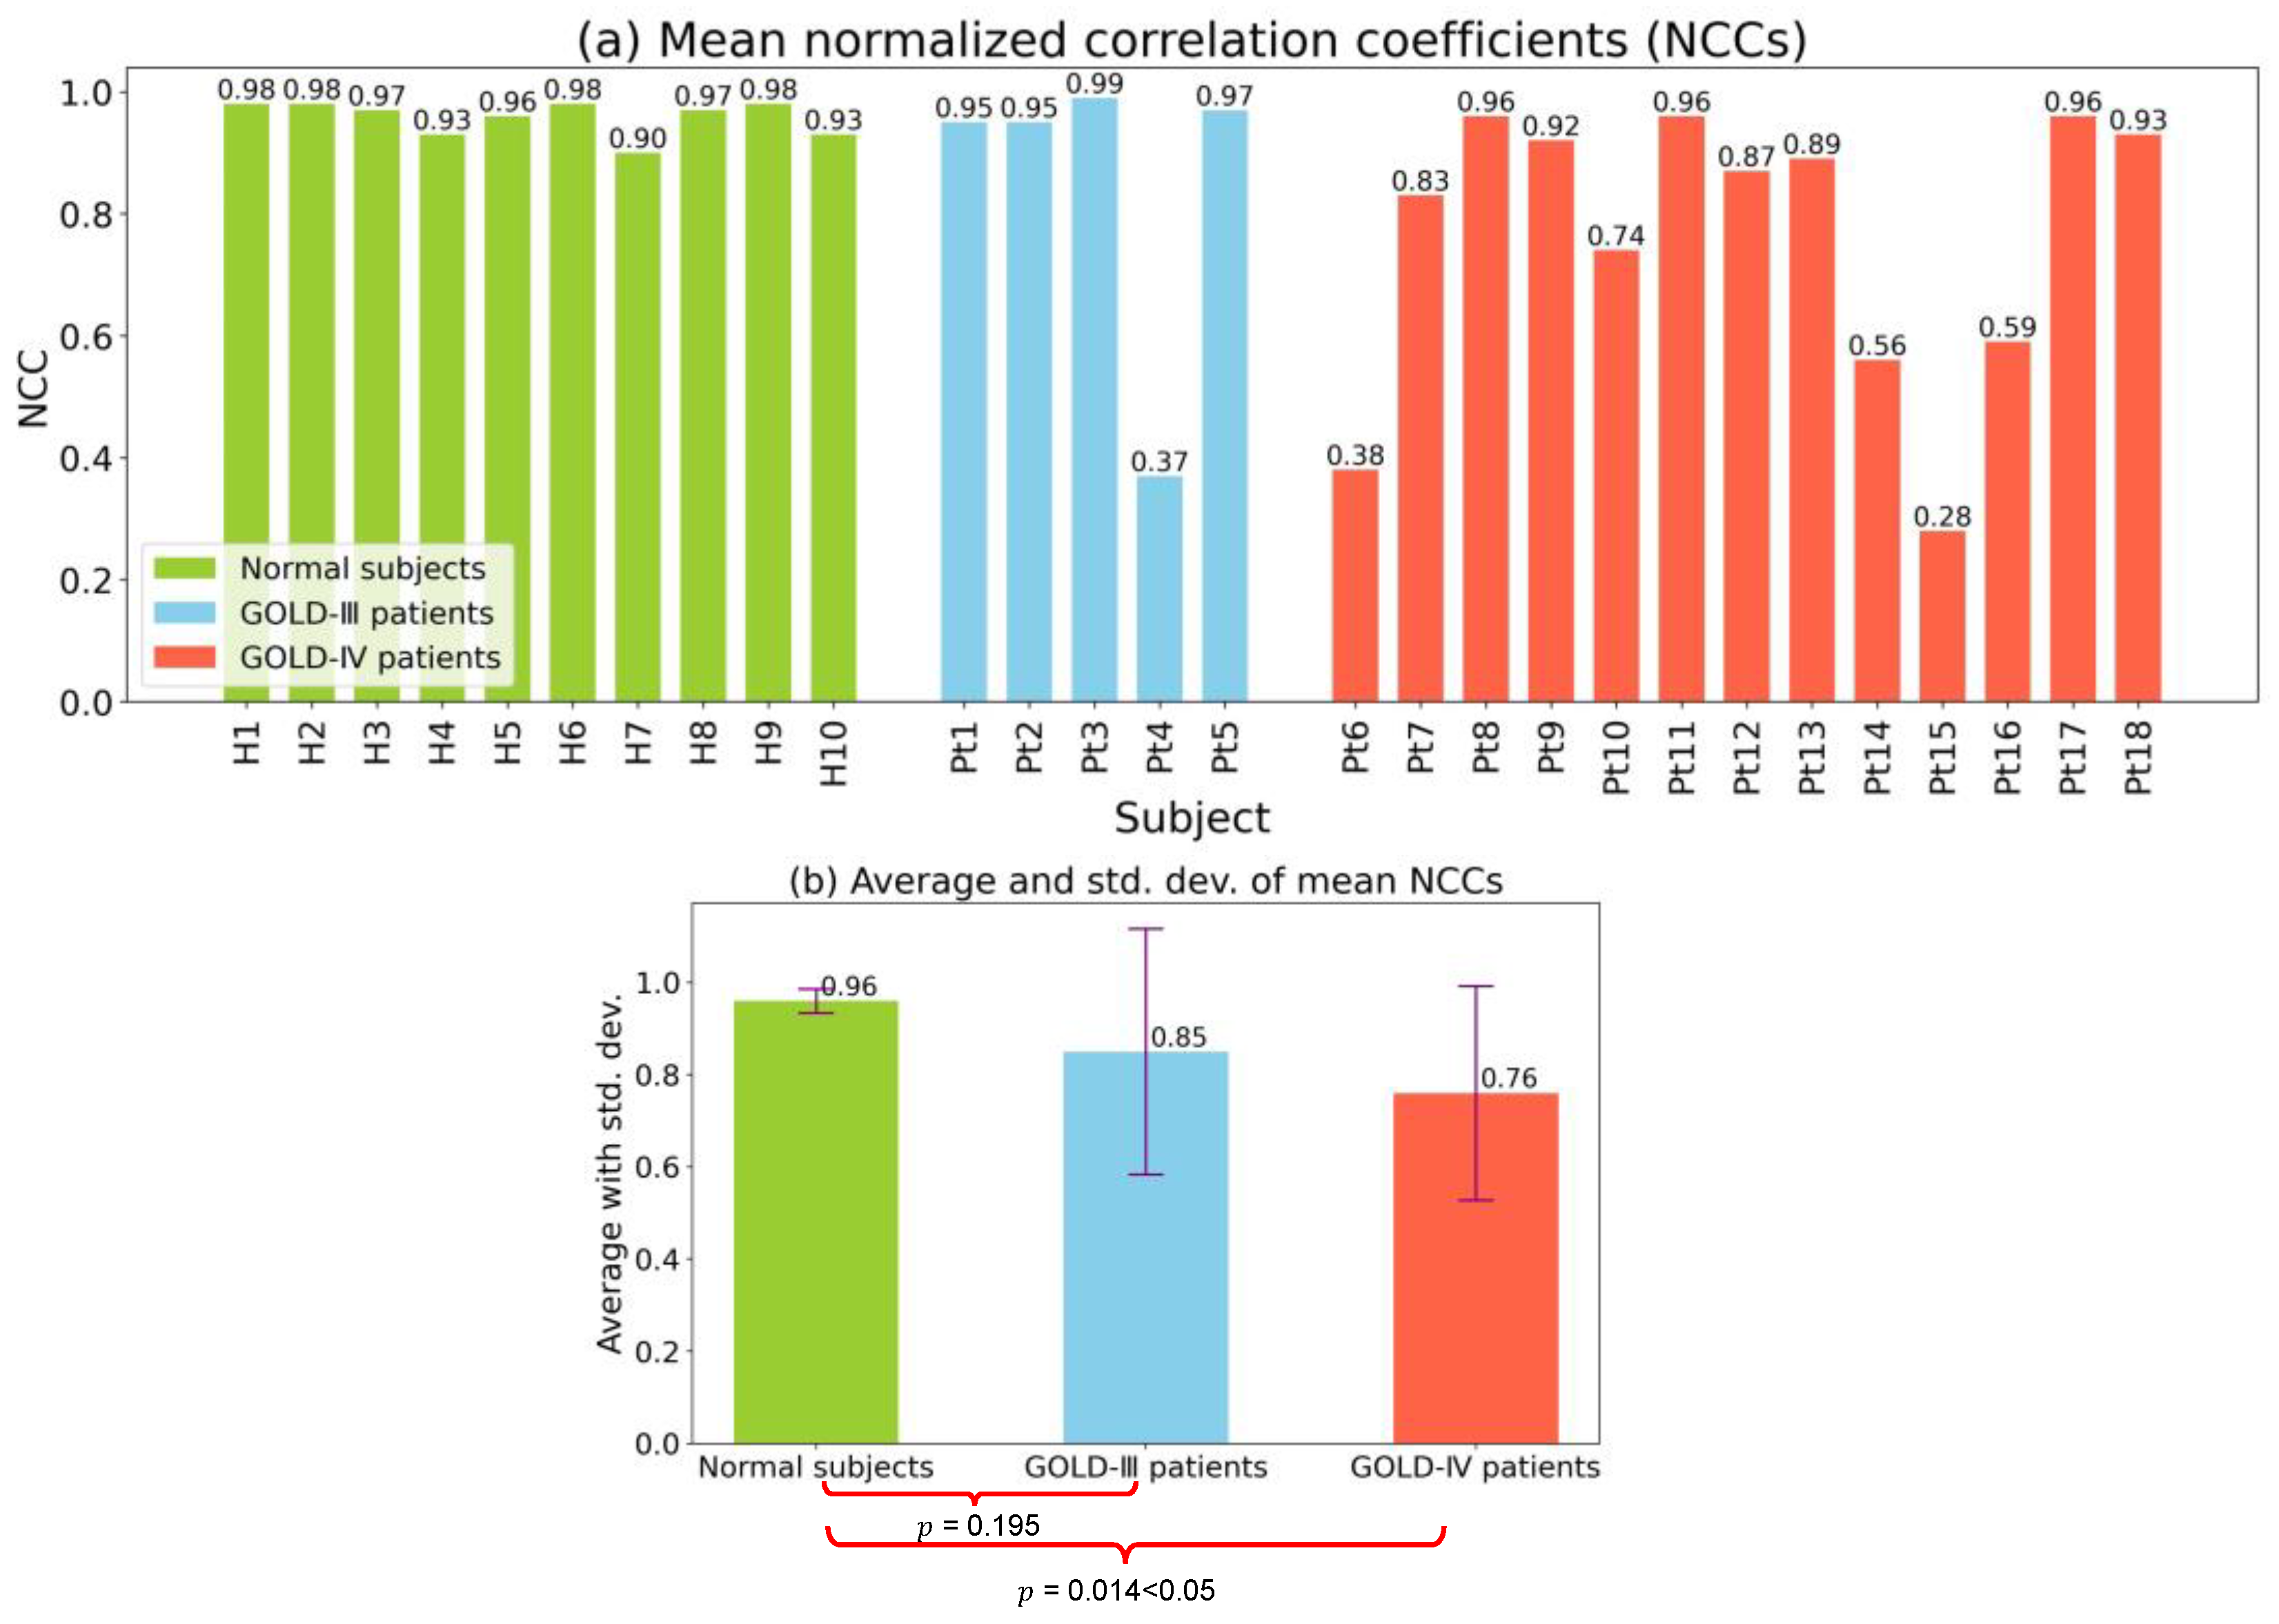
- Considering multiple respiration cycles, the asynchronization of diaphragm motion is evaluated by calculating the mean NCC value among all motion waveforms.
- In addition, considering multiple respiration cycles, the limitation of diaphragm motion is evaluated by calculating the mean absolute amplitude of the partial motion waveforms.
2.2.1. Diaphragm Profile Extraction
2.2.2. Respiration Cycle Difference Verification
2.2.3. Motion Asynchronization Evaluation
2.2.4. Motion Limitation Evaluation
3. Experimental Results
3.1. Characteristics of Enrolled Participants
3.2. Verification of Respiration Cycle Differences
3.3. Evaluations of Respiratory Diaphragm Motion
3.3.1. Motion Asynchronization Evaluation
3.3.2. Motion Limitation Evaluation
3.3.3. Multivariate Analysis
4. Discussion
4.1. Verification of Respiration Cycle Differences
4.2. Regional Diaphragm Asynchronization Motion Corresponding to the NCC Map
4.3. Limitation
5. Conclusions and Future Work
Author Contributions
Funding
Institutional Review Board Statement
Informed Consent Statement
Data Availability Statement
Conflicts of Interest
References
- Barnes, P.J.; Shapiro, S.D.; Pauwels, R.A. Chronic obstructive pulmonary disease: Molecular and cellularmechanisms. Eur. Respir. J. 2003, 22, 672–688. [Google Scholar] [CrossRef]
- Postma, D.; Bush, A.; van den Berge, M. Risk factors and early origins of chronic obstructive pulmonary disease. Lancet 2015, 385, 899–909. [Google Scholar] [CrossRef]
- Tuder, R.M.; Irina, P. Pathogenesis of chronic obstructive pulmonary disease. J. Clin. Investig. 2012, 122, 2749–2755. [Google Scholar] [CrossRef] [PubMed]
- Jolley, C.J.; Moxham, J.A. Physiological model of patient-reported breathlessness during daily activities in COPD. Eur. Respir. Rev. 2009, 18, 66–79. [Google Scholar] [CrossRef] [PubMed]
- Vorrink, S.N.; Kort, H.S.; Troosters, T.; Lammers, J.W. Level of daily physical activity in individuals with COPD compared with healthy controls. Respir. Res. 2011, 12, 33. [Google Scholar] [CrossRef]
- Albarrati, A.M.; Gale, N.S.; Munnery, M.M.; Cockcroft, J.R.; Shale, D.J. Daily physical activity and related risk factors in COPD. BMC Pulm. Med. 2020, 20, 60. [Google Scholar] [CrossRef] [PubMed]
- Ranu, H.; Wilde, M.; Madden, B. Pulmonary function tests. Ulst. Med. J. 2011, 80, 84. [Google Scholar]
- Kakavas, S.; Kotsiou, O.S.; Perlikos, F.; Mermiri, M.; Mavrovounis, G.; Gourgoulianis, K.; Pantazopoulos, I. Pulmonary function testing in COPD: Looking beyond the curtain of FEV1. NPJ Prim. Care Respir. Med. 2021, 31, 23. [Google Scholar] [CrossRef]
- Enright, P.L.; Lebowitz, M.D.; Cockroft, D.W. Physiologic measures: Pulmonary function tests. Am. J. Respir. Crit. Care Med. 1994, 149, S9–S20. [Google Scholar] [CrossRef] [PubMed]
- Swanney, M.P.; Ruppel, G.; Enright, P.L.; Pedersen, O.F.; Crapo, R.O.; Miller, M.R.; Jensen, R.L.; Falaschetti, E.; Schouten, J.P.; Hankinson, J.L.; et al. Using the lower limit of normal for the FEV1/FVC ratio reduces the misclassification of airway obstruction. Thorax 2008, 63, 1046–1051. [Google Scholar] [CrossRef]
- Burney, P.G.J.; Hooper, R. Forced vital capacity, airway obstruction and survival in a general population sample from the USA. Thorax 2011, 66, 49–54. [Google Scholar] [CrossRef] [PubMed]
- Coste, F.; Benlala, I.; Dournes, G.; Girodet, P.O.; Laurent, F.; Berger, P. Assessing pulmonary hypertension in COPD. Is there a role for computed tomography? Int. J. Chron. Obstruct. Pulmon. Dis. 2019, 14, 2065–2079. [Google Scholar] [CrossRef] [PubMed]
- Ley-Zaporozhan, J.; Ley, S.; Kauczor, H.U. Morphological and functional imaging in COPD with CT and MRI: Present and future. Eur. Radiol. 2008, 18, 510–521. [Google Scholar] [CrossRef] [PubMed]
- Semelka, R.C.; Armao, D.M.; Elias, J.; Huda, W. Imaging strategies to reduce the risk of radiation in CT studies, including selective substitution with MRI. J. Magn. Reson. Imaging 2007, 25, 900–909. [Google Scholar] [CrossRef] [PubMed]
- Chun, E.M.; Han, S.J.; Modi, H.N. Analysis of diaphragmatic movement before and after pulmonary rehabilitation using fluoroscopy imaging in patients with COPD. Int. J. Chron. Obstruct. Pulmon. Dis. 2015, 10, 193–199. [Google Scholar] [CrossRef]
- Hida, T.; Yamada, Y.; Ueyama, M.; Araki, T.; Nishino, M.; Kurosaki, A.; Jinzaki, M.; Honda, H.; Hatabu, H.; Kudoh, S. Decreased and slower diaphragmatic motion during forced breathing in severe COPD patients: Time-resolved quantitative analysis using dynamic chest radiography with a flat panel detector system. Eur. J. Radiol. 2019, 112, 28–36. [Google Scholar] [CrossRef]
- Yamashiro, T.; Moriya, H.; Matsuoka, S.; Nagatani, Y.; Tsubakimoto, M.; Tsuchiya, N.; Murayama, S. Asynchrony in respiratory movements between the pulmonary lobes in patients with COPD: Continuous measurement of lung density by 4-dimensional dynamic-ventilation CT. Int. J. Chron. Obstruct. Pulmon. Dis. 2017, 12, 2101–2109. [Google Scholar] [CrossRef]
- Suga, K.; Tsukuda, T.; Awaya, H.; Takano, K.; Koike, S.; Matsunaga, N.; Sugi, K.; Esato, K. Impaired respiratory mechanics in pulmonary emphysema: Evaluation with dynamic breathing MRI. J. Magn. Reson. Imaging 1999, 10, 510–520. [Google Scholar] [CrossRef]
- Sato, H.; Kawata, N.; Shimada, A.; Iwao, Y.; Ye, C.; Masuda, Y.; Haneishi, H.; Tatsumi, K.; Suzuki, T. Semiautomatic assessment of respiratory dynamics using cine MRI in chronic obstructive pulmonary disease. Eur. J. Radiol. Open 2022, 9, 100442. [Google Scholar] [CrossRef]
- Mascalchi, M.; Camiciottoli, G.; Diciotti, S. Lung densitometry: Why, how and when. J. Thorac. Dis. 2017, 9, 3319. [Google Scholar] [CrossRef]
- MacQueen, J. 1967 Classification and analysis of multivariate observations. In Proceedings of the Fifth Berkeley Symposium on Mathematical Statistics and Probability: Held at the Statistical Laboratory, University of California, 21 June–18 July 1965 and 27 December 1965–7 January 1966; University of California Press: Berkeley, CA, USA, 1967; Volume 1, pp. 281–297. [Google Scholar]
- Minaee, S.; Boykov, Y.; Porikli, F.; Plaza, A.; Kehtarnavaz, N.; Terzopoulos, D. Image segmentation using deep learning: A survey. IEEE Trans. Pattern Anal. Mach. Intell. 2021, 44, 3523–3542. [Google Scholar] [CrossRef]
- Hesamian, M.H.; Jia, W.; He, X.; Kennedy, P. Deep learning techniques for medical image segmentation: Achievements and challenges. J. Digit. Imaging 2019, 32, 582–596. [Google Scholar] [CrossRef]
- Ronneberger, O.; Fischer, P.; Brox, T. U-net: Convolutional networks for biomedical image segmentation. In Proceedings of the Medical Image Computing and Computer-Assisted Intervention–MICCAI 2015: 18th International Conference, Munich, Germany, 5–9 October 2015; Springer: Munich, Germany, 2015; Volume 18, pp. 234–241. [Google Scholar]
- Siddique, N.; Paheding, S.; Elkin, C.P.; Devabhaktuni, V. U-net and its variants for medical image segmentation: A review of theory and applications. IEEE Access 2021, 9, 82031–82057. [Google Scholar] [CrossRef]
- Du, G.; Cao, X.; Liang, J.; Chen, X.; Zhan, Y. Medical image segmentation based on u-net: A review. J. Imaging Sci. Technol. 2020, 64, 020508-1–020508-12. [Google Scholar] [CrossRef]
- Cohen, I.; Huang, Y.; Chen, J.; Benesty, J.; Benesty, J.; Chen, J.; Huang, Y.; Cohen, I. Pearson correlation coefficient. In Noise Reduction in Speech Processing; Springer: Berlin/Heidelberg, Germany, 2009; pp. 1–4. [Google Scholar]
- Kanko, R.M.; Laende, E.K.; Strutzenberger, G.; Brown, M.; Selbie, W.S.; DePaul, V.; Scott, S.H.; Deluzio, K.J. Assessment of spatiotemporal gait parameters using a deep learning algorithm-based markerless motion capture system. J. Biomech. 2021, 122, 110414. [Google Scholar] [CrossRef]
- Shimada, A.; Kawata, N.; Sato, H.; Ikari, J.; Suzuki, E.; Anazawa, R.; Suzuki, M.; Masuda, Y.; Haneishi, H.; Tatsumi, K. Dynamic quantitative magnetic resonance imaging assessment of areas of the lung during free-breathing of patients with chronic obstructive pulmonary disease. Acad. Radiol. 2022, 29, S215–S225. [Google Scholar] [CrossRef] [PubMed]
- Han, M.K.; Agusti, A.; Celli, B.R.; Criner, G.J.; Halpin, D.M.; Roche, N.; Papi, A.; Stockley, R.A.; Wedzicha, J.; Vogelmeier, C.F. From GOLD 0 to pre-COPD. Am. J. Respir. Crit. Care Med. 2021, 203, 414–423. [Google Scholar] [CrossRef]
- Pandey, A.K.; Verma, A.K.; Singh, A.; Kant, S.; Dixit, R.K.; Chaudhary, S.C.; Bajpai, J.; Prakash, V.; Verma, U.P.; Pandey, A.K.; et al. The relationship between clinical phenotypes and Global Initiative for Chronic Obstructive Lung Disease (GOLD) stages/groups in patients with chronic obstructive pulmonary disease. Cureus 2022, 14, e32116. [Google Scholar] [CrossRef] [PubMed]
- Sharp, J.T.; Danon, J.; Druz, W.S.; Goldberg, N.B.; Fishman, H.; Machnach, W. Respiratory muscle function in patients with chronic obstructive pulmonary disease: Its relationship to disability and to respiratory therapy. Am. Rev. Respir. Dis. 1974, 110, 154–167. [Google Scholar]
- Bachasson, D.; Wuyam, B.; Pepin, J.L.; Tamisier, R.; Levy, P.; Verges, S. Quadriceps and respiratory muscle fatigue following high-intensity cycling in COPD patients. PLoS ONE 2013, 8, e83432. [Google Scholar] [CrossRef]
- Kantarci, F.; Mihmanli, I.; Demirel, M.K.; Harmanci, K.; Akman, C.; Aydogan, F.; Mihmanli, A.; Uysal, O. Normal diaphragmatic motion and the effects of body composition: Determination with M-mode sonography. J. Ultrasound Med. 2004, 23, 255–260. [Google Scholar] [CrossRef] [PubMed]
- Jain, S.; Nair, G.; Nuchin, A.; Uppe, A. Study of the diaphragm in chronic obstructive pulmonary disease using ultrasonography. Lung India 2019, 36, 299. [Google Scholar] [PubMed]


| Parameter | Specification |
|---|---|
| Repetition time | 1.84 mms |
| Echo time | 0.71 MS |
| Flip angle | 45° |
| Image size | 256 × 256 pixel |
| Field of view | 384 × 384 mm |
| Resolution | 1.5 mm/pixel |
| Slice thickness | 13.5 mm |
| Frame rate | 8.33 f/s |
| Measurement time for each subject | More than 2 min |
| No. of frames for each subject | 1200 |
| Parameter | = 10) | = 18) | p-Value |
|---|---|---|---|
| Age (year) | * | ||
| Male sex (%) | 10 (100) | 16 (89) | |
| BMI (kg/m2) | |||
| Pack-years | 0 | * | |
| GOLD grade (I/II/III/IV) | N. A | 0 (0%)/0 (0%)/5 (27.8%)/13 (72.2%) | |
| Pulmonary Function Tests (PFTs) | |||
| FVC% predicted (%) | * | ||
| FEV1 (L) | * | ||
| FEV1% predicted (%) | * | ||
| FEV1/FVC (%) | * | ||
| FRC% predicted (%) | |||
| RV% predicted (%) | * | ||
| RV/TLC (%) | * | ||
| YHXSYXDLco/VA% predicted (%) | * | ||
Disclaimer/Publisher’s Note: The statements, opinions and data contained in all publications are solely those of the individual author(s) and contributor(s) and not of MDPI and/or the editor(s). MDPI and/or the editor(s) disclaim responsibility for any injury to people or property resulting from any ideas, methods, instructions or products referred to in the content. |
© 2023 by the authors. Licensee MDPI, Basel, Switzerland. This article is an open access article distributed under the terms and conditions of the Creative Commons Attribution (CC BY) license (https://creativecommons.org/licenses/by/4.0/).
Share and Cite
Zhou, X.; Ye, C.; Iwao, Y.; Okamoto, T.; Kawata, N.; Shimada, A.; Haneishi, H. Respiratory Diaphragm Motion-Based Asynchronization and Limitation Evaluation on Chronic Obstructive Pulmonary Disease. Diagnostics 2023, 13, 3261. https://doi.org/10.3390/diagnostics13203261
Zhou X, Ye C, Iwao Y, Okamoto T, Kawata N, Shimada A, Haneishi H. Respiratory Diaphragm Motion-Based Asynchronization and Limitation Evaluation on Chronic Obstructive Pulmonary Disease. Diagnostics. 2023; 13(20):3261. https://doi.org/10.3390/diagnostics13203261
Chicago/Turabian StyleZhou, Xingyu, Chen Ye, Yuma Iwao, Takayuki Okamoto, Naoko Kawata, Ayako Shimada, and Hideaki Haneishi. 2023. "Respiratory Diaphragm Motion-Based Asynchronization and Limitation Evaluation on Chronic Obstructive Pulmonary Disease" Diagnostics 13, no. 20: 3261. https://doi.org/10.3390/diagnostics13203261