Article

High-Frequency (30 MHz–6 GHz) Breast Tissue Characterization Stabilized by Suction Force for Intraoperative Tumor Margin Assessment

by
Hadi Mokhtari Dowlatabad
1,†,
Amir Mamdouh
1,†,
Narges Yousefpour
1,
Reihane Mahdavi
1,
Ashkan Zandi
1,
Parisa Hoseinpour
2,
Seyed Mohammad Sadegh Moosavi-Kiasari
1,
Fereshte Abbasvandi
3,
Yasin Kordehlachin
1,
Mohammad Parniani
4,
Karim Mohammadpour-Aghdam
5,
Pooya Faranoush
1,6,
Mohammad Reza Foroughi-Gilvaee
1,6 and
Mohammad Abdolahad
1,7,*
1
Nano Bioelectronics Devices Lab, Cancer Electronics Research Group, School of Electrical and Computer Engineering, Faculty of Engineering, University of Tehran, Tehran 14399-57131, Iran
2
Department of Pathology, Breast Cancer Research Center, Motamed Cancer Institute, ACECR, Tehran 15179-64311, Iran
3
ATMP Department, Breast Cancer Research Center, Motamed Cancer Institute, ACECR, Tehran 15179-64311, Iran
4
Pathology Department, Breast Cancer Research Center, Motamed Cancer Institute, ACECR, Tehran 15179-64311, Iran
5
Center of Excellence for Applied Electromagnetic Systems, University of Tehran, Tehran 14399-57131, Iran
6
Pediatric Growth and Development Research Center, Institute of Endocrinology and Metabolism, Iran University of Medical Sciences, Tehran 14496-14535, Iran
7
Cancer Electronics Research Center, Tehran University of Medical Sciences, Tehran 14197-33141, Iran
*
Author to whom correspondence should be addressed.
These authors contributed equally to this work.
Diagnostics 2023, 13(2), 179; https://doi.org/10.3390/diagnostics13020179
Submission received: 14 November 2022 / Revised: 28 December 2022 / Accepted: 31 December 2022 / Published: 4 January 2023
(This article belongs to the Special Issue Cancer Diagnostic Probe)

Abstract

:
A gigahertz (GHz) range antenna formed by a coaxial probe has been applied for sensing cancerous breast lesions in the scanning platform with the assistance of a suction tube. The sensor structure was a planar central layer and a metallic sheath of size of 3 cm2 connected to a network analyzer (keySight FieldFox N9918A) with operational bandwidth up to 26.5 GHz. Cancer tumor cells have significantly higher water content (as a dipolar molecule) than normal breast cells, changing their polarization responses and dielectric losses to incoming GHz-based stimulation. Principal component analysis named S11, related to the dispersion ratio of the input signal, is used as a parameter to identify malignant tumor cells in a mouse model (in vivo) and tumor specimens of breast cancer patients (in vitro) (both central and marginal parts). The results showed that S11 values in the frequency range from 5 to 6 GHz were significantly higher in cancer-involved breast lesions. Histopathological analysis was the gold standard for achieving the S11 calibration to distinguish normal from cancerous lesions. Our calibration on tumor specimens presented 82% positive predictive value (PPV), 100% negative predictive value (NPV), and 86% accuracy. Our goal is to apply this system as an in vivo non-invasive tumor margin scanner after further investigations in the future.

1. Introduction

The increased incidence of cancer is a subject of significant concern worldwide. Despite several technological advances in real-time presurgical and intraoperative cancer detection methods, there are still many discrepancies, with final permanent pathology results as the gold standard [1,2].
Intraoperative frozen pathology is the typical analysis for obtaining free tumor margins and decreasing the recurrence rate in cancer patients [3], but it does not meet all surgeons’ needs. Incomplete fixation of adipose cells existing in dissected breast tumor margins is a crucial pitfall in the accuracy of frozen pathology in breast cancer surgeries [4], so at least 20–30% misdiagnosis in breast tumor margins was reported in the literature [5,6]. Thus, several types of research have been conducted to fill the gap and invent precise intraoperative complementary devices [7,8]. One of the most attractive methods for cancer detection has been based on tissue dielectric properties [9]. Characteristics of this approach include real-time responses [10], precise diagnoses [11], compatibility with tissue pathophysiological status, and non-invasive detection techniques [12].
The response of biological tissues to high-frequency electromagnetic stimulation that leads to different polarization effects (electronic, atomic, dipolar, and interfacial) could be characterized by their conductivity ( σ ) and permittivity ( ε ) [13]. It strongly depends on the stimulation frequency due to different electrical currents passing through the tissue’s structure. Most of the electrical current at low frequencies passes through the extracellular matrix due to the α dispersion region, while it is capacitively coupled to the bilayer lipid cell membrane and intracellular elements in medium frequencies ( β dispersion region) [14]. In the γ dispersion region (frequency > 1 GHz), all the current passes through the cell, the electrical response is strongly affected by the depolarization resonance of water molecules in the cells, and the dielectric properties of tissue at frequencies above 1 GHz reflect the dielectric relaxation of tissue water [15].
This research is focused on the characterization of breast tumors for margin evaluation purposes based on GHz spectroscopy of tissue. Due to the correlation between scattering parameters and dielectric properties, measuring scattering parameters is one of the ways to obtain dielectric properties [16]. The concept of scattering parameters is based on the transmitted power and reflected wave. S11 is an important parameter of our characterization, as the biological tissues are not one port transmission line [17]. It is known that the intracellular water content of cancer cells is much more than in normal cells [18]. Hence, S11, as the reflection wave parameter of GHz stimulation, may be different between normal and cancer tissues. Previous in vitro GHz detection systems on some human organs, such as the breast [19,20,21,22], colon [23,24], and liver [25,26] used standing probes, none of which were calibrated with permanent pathology. Furthermore, they were not applied for assessment of the intraoperative frozen section. Moreover, they used small sample sizes without functionalization and calibration of the technique.
The penetration depth of GHz fields into biological tissues is about 1 mm, which is compatible with the depth required to be investigated in the frozen-section pathology of margins [27]. Also, an important parameter affecting such observation is the quality of the contact surface between the GHz probe and the tissue [28].
Here, a GHz system based on a coaxial probe embedded in a customized Foley catheter and connected to a suction system was developed to evaluate the S11 difference between normal and cancer tissues in a mouse model and human in vitro breast specimens (n = 127). The main study was performed on breast tumor margins, but we used small samples from all types of breast tissue for GHz characterization and calibration. Suction was applied not only to stablize the probe/tissue contact interface but also to deplete the additive water of the tissue (such as non-intra-coastal water, which may perturb the GHz response). The reflection index of the wave recorded by the same stimulating probe was drastically affected with respect to its interaction with cancer cells due to their higher dipole resonance. A pathologically calibrated scoring was proposed as a cut-off value to distinguish between normal and malignant lesions with a feature size of about 50 mm2. This system may be helpful in real-time tumor margin scanning in surgical procedures.

2. Materials and Methods

2.1. Measurement and Data Processing

The network analyzer (GHz wave generation) and detection system (KeySight FieldFox N9918A) used in this study is a 0–26.5 GHz frequency spectroscopic actuator/detector (Figure 1a). It consists of a hand-held, flexible, open-ended coaxial cable (Semi-Flexible Cable 670-086 SXE) for actuating and sensing (Figure 1b,c). The coaxial cable was embedded in the center of a Foley catheter as a tube to apply the suction force (Figure 1d,e) to obtain the best physical contact between the probe (copper cladding) and tissue.
GHz electromagnetic waves are transmitted to the tissue through the coaxial probe’s tip at frequencies ranging from 0.1 to 6 GHz. These frequencies were selected based on the best distinctive water molecular dipole resonance response at high frequencies. The stimulation induces no destructive or ionizing damage to the tissues. The intensity of the wave transmitted across the probe’s opening is neglectable. The stimulation voltage of the probe is about 0.1 Volts which would not ionize the interacted tissue. The power reaching the tissue is less than 0.1 mW per square mm. The time interval of each signal transmission and response received due to the reflected signal is about 3 ms. The radius of the copper cladding end of the sensor cable is 0.4 mm.

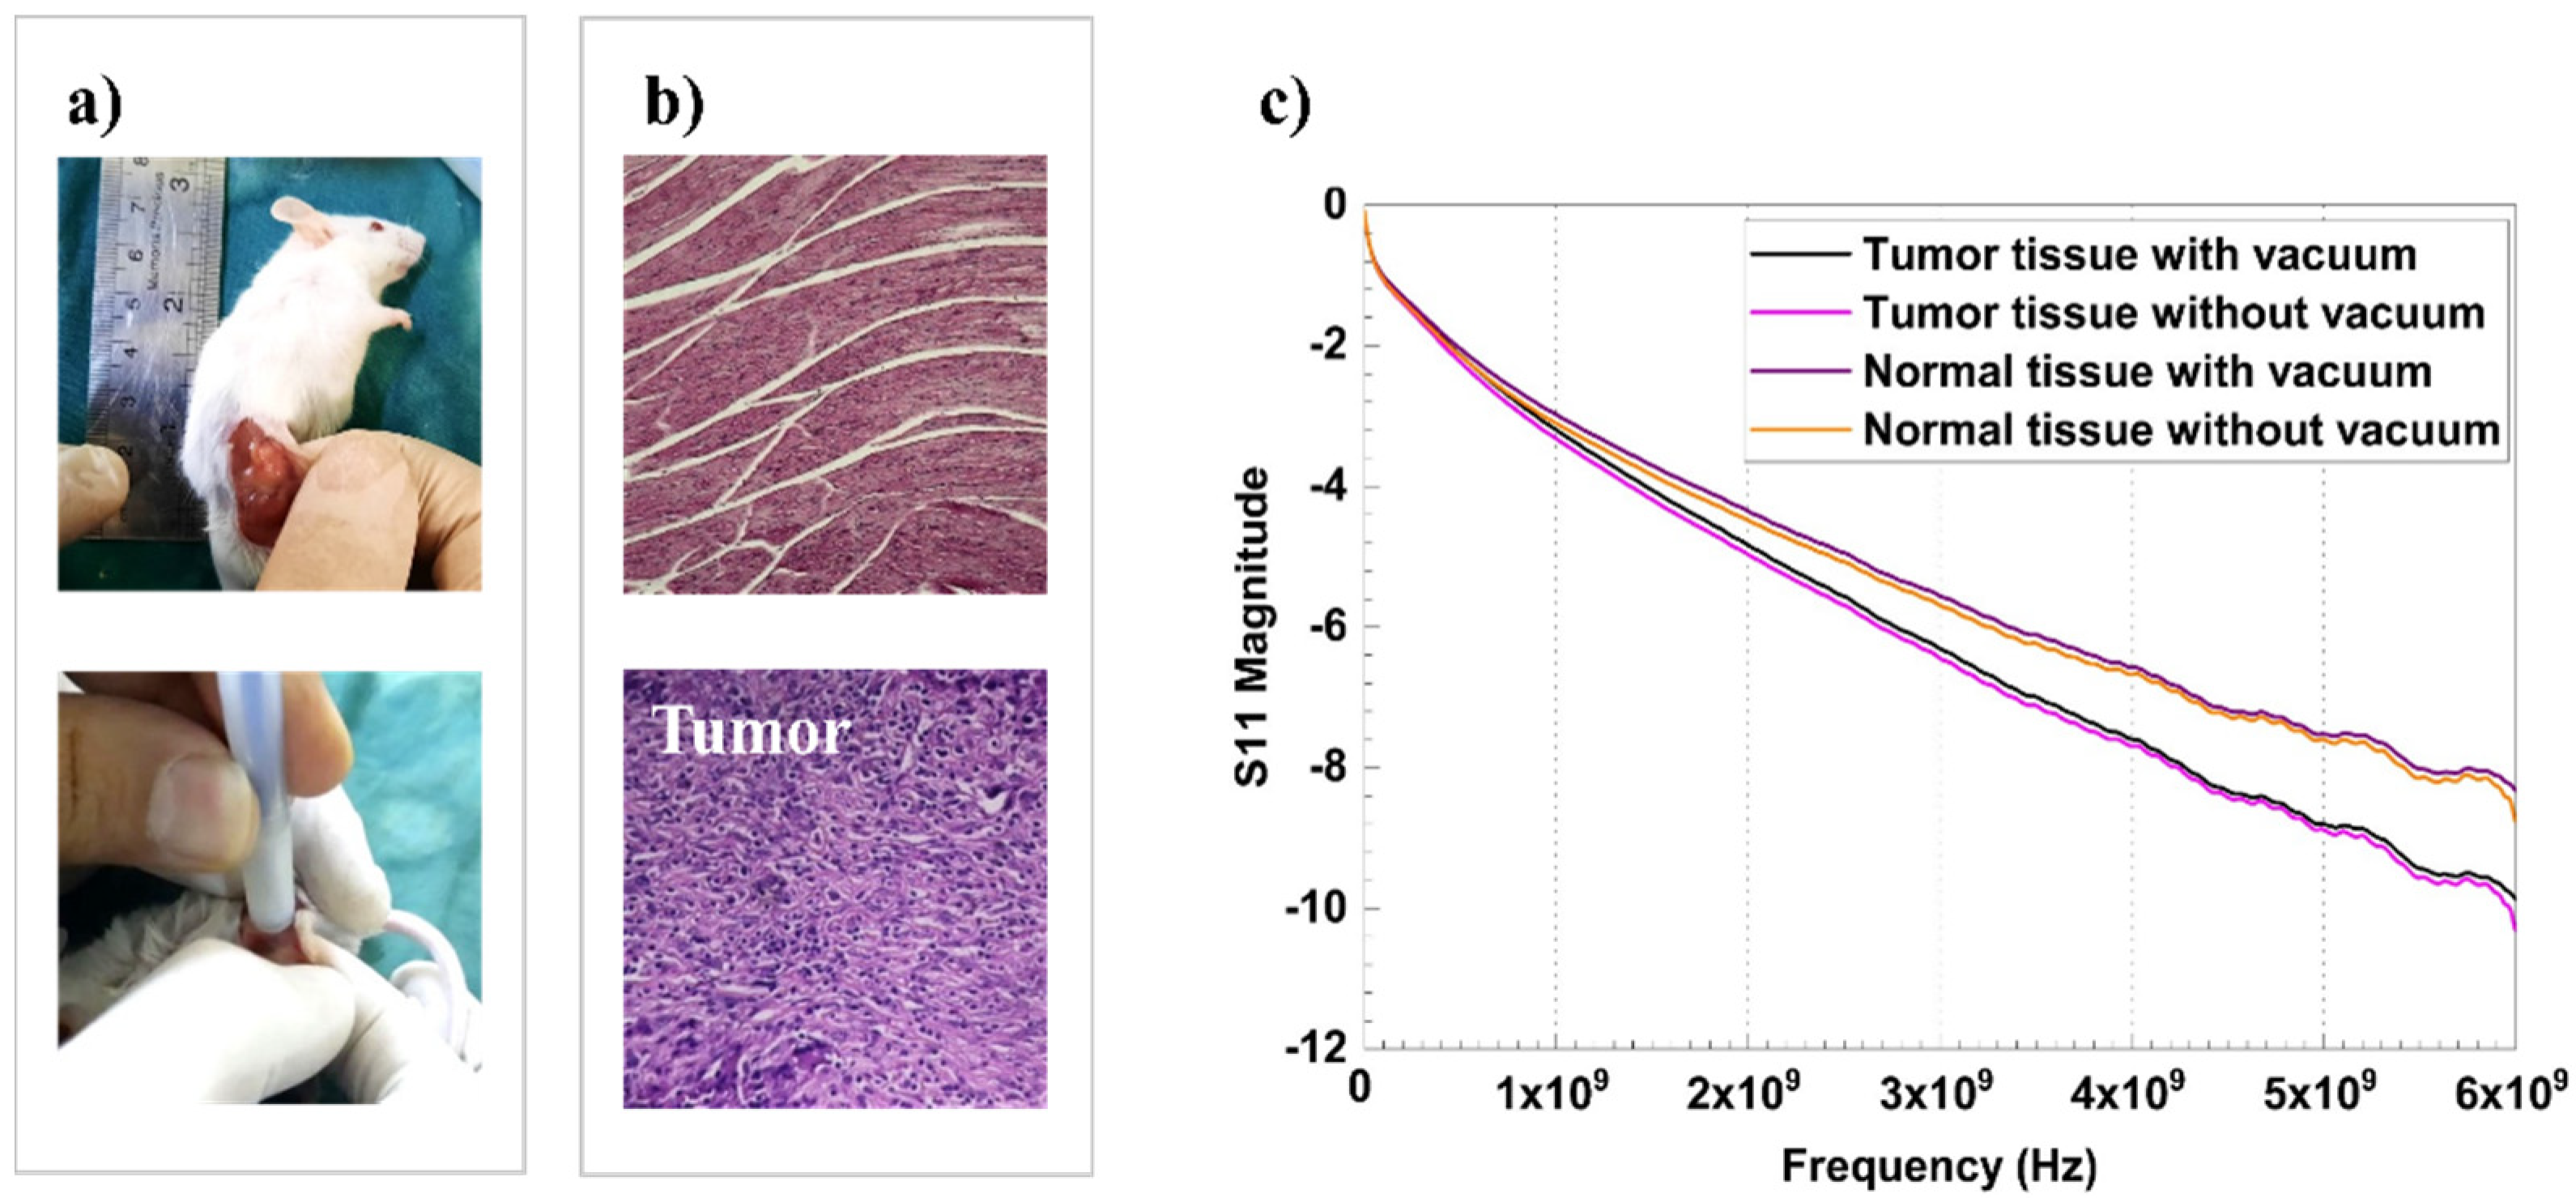
2.2. Mouse and Model Test

The 4T1 cell line was injected subcutaneously into the mice models. After 10 days (when the tumors were formed as a massive specimen with about 5 to 10 mm diameter), the outer layer of the tumor was shaved, and the tumor with the fresh surface was chosen for GHz measurement in vivo. In this regard, the coaxial probe was connected to the tumor surface by applying suction force. Five subsequential measurements were carried out on each tumor. Moreover, a normal superficial lesion in each mouse was shaved, and the probe tested on the fresh surface. The suction tube covering the probe enabled uniformly firm and reproducible contact with the tissue surface. Measurements were carried out in frequencies ranging from 1 to 6 GHz.
Each sampling took less than 1 s. The tested location was immediately dissected to prevent from mislocating the recorded region. When a recorded tissue was dissected, it was fixed in 10% formalin solution (24–48 h) and prepared for H&E staining, followed by pathological evaluations. The histopathological analysis was just conducted on the tissue interface with the sensing probe without further sectioning, so the external face of the tested specimen was chosen for histological examination. Due to this trend, the sampling locations remain registered in each analysis. The suction force kept the lesion stable during the sampling and marked during the dissection for pathological processing. We estimated that the mislocation between the exact measured site and the analyzed tissue sample was about 0 mm. The data of mouse samples from both normal and tumoral surfaces were collected and plotted to evaluate any probable calibration and meaningful difference between these two lesions.

2.3. GHz Response Classification in Breast Tissue Samples

After performing the standard protocols in the intraoperative frozen-section pathology and before transferring dissected tumor tissue to the formalin reservoir, measurements were taken by applying the suction to the tissue selected by the pathologist. Then the exact recorded tissues were dissected via punch biopsy and prepared for histopathological evaluation by pathologists. The central area of the specimen with a radius of 0.5 mm was the main area for histological analysis. This step obtained calibration data for benign, malignant, and fatty breast tissues.
In the next step, the probe was used for scanning a piece of tumor margin by multiple measurements from different places of the tumor margin. The location of each test was determined carefully. For correct coincidence between S11 and pathological data, the samples were flattened out after measurement in 10% formalin solution by putting a 200 gr weight on it for 10–15 min. This method prevents any tissue reshaping and helps to improve the quality of pathological evaluations and data analysis.

2.4. Statistical Analysis

Asymptotic significance or p-value of the Chi-square with a confidence interval of 95% was calculated to assess the significance of the differences between the S11 magnitude and the histopathological status of tumor margins, which determines the statistical significance of the relationship. Receiver Operating Characteristic curve (ROC) analysis was used to calculate the Area Under the Curve (AUC). These two kinds of statistical analysis were widely used by our and other groups to achieve meaningful correlated results between an electrical sensing approach and gold-standard biological results such as histopathology [29,30,31]. However, other statistical methods, such as ANOVA [32,33], could be applied as an accurate method to improve the results of statistical analyses, which will be used in the next trials of this research in future. A cut-off value for S11 magnitude as the GHz parameter was extracted in small samples. All statistical analyses were performed using commercially available software (IBM SPSS Statistics for Windows version 26).

2.5. Ethics

All research procedures and reporting were performed according to the Code of Ethics of the World Medical Association (Declaration of Helsinki), ethical principles, national norms, and standards for conducting Medical Research in Iran. All of the human tests were performed under the license of the Ethics Committee of Tehran University of Medical. Institutional review board (IRB) or research ethics committee (REC) approval is IR.TUMS.VCR.REC.1397.532. Patient information and data were kept confidential and secure at all times.
This study was eligible for a waiver of consent because it has no intervention in the pathological processes. No harm is posed to study participants and no diagnostics are interrupted. Absence of harm is defined as the probability and magnitude of damage or discomfort not greater than ordinarily encountered during the performance of routine pathopsychological tests, with no effect on the course of disease management.

3. Results

Figure 2 presents the results of GHz spectroscopy on normal and tumor regions of the mouse model (Figure 2a) that had been tumorized by TNBC 4T1 cell injection. The results revealed a drastic difference between healthy and cancerous tissues, presenting −7 dB as the cut-off value for the differential diagnosis (Figure 2c). Normal mouse tissue presents fibrotic connective tissues, while cancerous mouse tissue presents a hypercellular region and high nucleus-to-cytoplasm size ratio in H&E assays (Figure 2b). No electrical shock occurred on the mouse during the analysis. Device measurements were non-destructive and had no destructive effect on the specimens for the histopathological procedure.
Subsequently, the work was spread out to human breast cancer patients. Obtaining calibration data for fatty, normal, and malignant breast tissues in an ex vivo measurement setup was the first attempt in this step. GHz spectroscopy was conducted on 127 tiny margin samples selected by the pathologist from 19 recruited patients (16 invasive ductal and 3 invasive lobular carcinomas, 15 adjuvant and 4 neuadjuvant patients) after doing all standard procedures of frozen pathology (including touch imprint, sample preparation, tissue sectioning, Hematoxyline/Eosin Staining, etc.). Then, H&E assays were made from tested margins, and sent for microscopy and final histopathological diagnosis as the gold standard. Also, nine immunohistochemistry analyses (IHC) were performed in challenging samples. Two S11 magnitude measurements were carried out for each sample, and the mean value was reported in the manuscript data. A distinctive pattern was observed in the S11 magnitude diagram by averaging all data of three categories (fatty, benign, and malignant breast tissues) (Figure 3a). For a precise selection of the most sensitive frequency to extract the data, the differences of each category versus malignant breast tissue were calculated (Figure 3b). The difference in each couple categories (fatty vs. cancerous tissue, benign vs. cancerous tissue) obviously increases by increment in the frequency. The most significant difference occurred in about 5 to 6 GHz. Thus, the S11 magnitude in f = 6 GHz was selected to be extracted from each measurement set as the classification parameter. The mean of S11 magnitude in 6 GHz of all healthy breast tissues is about 20% higher than in malignant tissues.
Furthermore, measurement results were unchanged up to 30 min after tissue dissection (Figure 3c), and the validation may have been missed by decreasing the water content.
For finding the most precise cut-offs of S11 magnitude for tissue characterization, five different border values of −6.75 dB, −7 dB, −7.25 dB, −7.5 dB, and −7.75 dB were selected, and the ROC curve was calculated (Figure 3d). The most Area Under the Curve (AUC) equal to 0.87 belongs to −7.25 dB as the S11 magnitude cut-off value (Table 1).
PPV, NPV, accuracy, and AUC calculated for each cut-off are reported in Table 1. As illustrated in Table 1, the best sensitivity and specificity (94% and 83%) were achieved at −7.25 dB as the cut-off classification value with a p-value < 0.001.
In the last step of this work, margin evaluation by GHz spectroscopy was carried out. Measurements of 86 in vitro breast samples from 22 patients (15 invasive ductal and 7 invasive lobular carcinomas, 15 adjuvant and seven neoadjuvant cases) were conducted within the proposed method. After doing all standard procedures of frozen pathology, margin samples with average dimensions of 20 × 30 mm2 were selected by the pathologist for GHz spectroscopy (Figure 4a). Each tissue sample was scanned in a mesh-like pattern with the coaxial cable, and S11 magnitude measurement and recording took place in distance intervals of 5 mm. The average number of measures for each margin sample was about 15.
Then, H&E assays were made from tested margins, and sent for microscopy imaging and final histopathological diagnosis as the gold standard. Furthermore, 11 IHC analyses were performed in challenging samples.
The GHz probe was also applied in in vitro breast tumor margin evaluations. In this regard, mesh patterns were assumed for the margin with a feature size of 5 mm2. Hence, about 15 points were recorded by the probe in each margin. Recorded data resulted in diagnostic scoring based on our suggested calibration. Then, the H&E image of the margin was taken and evaluated by a pathologist. Matching the GHz probe scores and H&E diagnosis of mesh patterns (Figure 4a,b) showed more than 85% accuracy in margin scoring by the probe.

4. Discussion

GHz range EM waves have been demonstrated as effective detection elements in interaction with biological tissue surfaces due to the state and concentration of their electrolyte and water molecules [34].
Tumor tissues are reported to have significantly higher water and sodium content than normal tissues, which is the reason behind their variations with respect to dielectric properties [26,35]. Understanding tumor detection mechanism in GHz ranges requires careful analysis of their cellular structure, protein content, and water distribution differences from normal ones. Rapid growth and proliferation of cancer cells lead to overall increased expression of proteins (including membrane proteins), in contrast to normal cells [36]. It is also known that proteins acquire more surface charges in malignant tumors [24,37]. Proteins have both hydrophilic and hydrophobic components that may react to dipolar molecules [38]. Proteins expressed on the cell membrane surface attract more water molecules as a dominant component in the cellular medium to form “bound water” [24,37,39]. These dipoles can be oriented by an oscillating electric field in frequencies less than 20 GHz (the resonance frequency of the free water molecule is 25 GHz). Thus, bound water accounts for increased electromagnetic energy absorption and cell response in GHz frequencies lower than 20 GHz (e.g., 6 GHz) [37]. In other words, higher content of expressed membrane proteins and bound water in cancer cells may play a crucial role in distinct responses between normal and tumoral regions in the frequency range of our study [18,24,37,39] (Figure 5). In terms of electromagnetic wave dispersion language, wave parameters could be quantified to describe the interaction between wave and matter [40]. The presence of a higher amount of bound water molecules in cancer lesions may change the wave scattering parameters; it could be assumed as a diagnostic indicator to distinguish between normal and cancer tissue surfaces. Scattering parameters also define the input/output relationships between ports in an electrical system (Figure 5). In a two-port device (used in this research as a sensing element (Figure 1d)), if a1 wave was transmitted from port1, a2 was transmitted from port2, b1 was returned to port1, and b2 was returned to port2 (Figure 5a), we can define S11, the main sensing parameter, as:
S 11 = b 1 a 1 | a 2 = 0 = Z i n ( R O ) R O Z i n ( R O ) + R O
In which Zin is entrance impedance, and R0 is transmission line resistance. After recording S11 signals from, on average, 15 points of 86 normal and cancerous tissues, we observed that 83% of the recorded data were specifically in the range of proposed calibration for neoplastic, and normal lesions had been confirmed by histopathology (Table 1). Due to our recorded calibration, the S11 between −7.25 dB and −9.5 dB (in the frequency range of 6 GHz) are in correlation with the amount of bound water molecules found in neoplastic tissue surface while the S11 values between −4.5 dB and −7.25 dB are equal to the resonance response of water molecules of non-neoplastic tissue surfaces. This system has the ability to scan all over the tissue surface without any invasive measurement. Hence, it could be used both in vitro and in vivo for margin assesment if the sensitivity and specificity maintain their acceptable range after subsequent investigations and trials.
More studies on H&E assays of these samples revealed that some relationships may exist between hyalinized fibrotic breast tissues, reduced S11 magnitude parameters, and the intercoastal water content of the tissue (apart from bound intracellular water content) [41]. It is reported that fibrotic hyalinized breast tissue has a high water content compared to normal and fatty breast tissues [41]. This phenomenon may be a limitation in GHz-based spectroscopy of neoadjuvant (post-chemotherapeutic) breast tissue diagnosis because hyalinized benign tissues may show a response similar to high-risk lesions. However, in non-neoadjuvant cases, this spectorscopy could be a promising complementary diagnostic tool with fast scanning and the least invasive abilities.

5. Conclusions

In summary, a GHz probe with coaxial cable and suction force was applied for a distinction between normal and cancerous lesions in mouse model in vivo and human breast tumor margins in vitro. S11, the reflection dispersion parameter of each recorded specimen in frequencies ranging from 0.1 to 6 GHz was extracted and categorized by their histological analyses. We know that the tissues in the GHz range’s permittivity, conductivity, and dielectric properties are correlated with the S11 parameter.
The coaxial sensing probe has a diameter of 0.5 mm. With the assistance of suction force, such a small probe facilitated the desired contact between the sensor and the resected tissue surface. Thus, by attachment of the probe to the tissue surface, the response signal was recorded in less than 10 s. Using the experimentally achieved cut-off results showed that the S11 between −4.5 dB and −7.25 dB are the responses of normal tissue surfaces to incoming GHz wave while the S11 between −7.25 dB and −9.5 dB are for cancerous tissue surface of breast samples.
More than 60 breast samples were tested by the probe, among which 30 samples were malignant, and others were normal or benign lesions. GHz probe calibration scoring was correctly matched with 49 of the samples. We achieved a scanning pattern of the tissue surface with the assistance of the probe, which was rechecked by histopathological evaluation.
Due to calibrated results by histopathological gold standards, the GHz probe showed a sensitivity and specificity of 94.7% and 83.1% in evaluating breast tumor margins, respectively.
Furthermore, the flexibility of this real-time probe helps us to use it easily in the pathology room and during surgery without any requirement for a standing probe or complicated setup.

Author Contributions

M.A.: Supervision, Project administration, Methodology, Writing—Original Draft, Resources, Data Curation, Validation. H.M.D.: Methodology, Software, Validation, Formal Analysis, Investigation, Data Curation, Writing—Review & Editing, Visualization. A.M.: Methodology, Software, Validation, Formal analysis, Investigation, Data Curation, Visualization. N.Y.: Validation, Formal analysis, Investigation, Resources, Data Curation, Visualization. R.M.: Methodology, Validation, Formal analysis, Investigation, Data Curation, Writing—Review & Editing, Visualization. A.Z.: Methodology, Investigation, Formal Analysis, Data Curation, Visualization. P.H.: Validation, Investigation. S.M.S.M.-K.: Investigation, Data Curation, Visualization. F.A.: Resources, Data Curation, Investigation, Validation. Y.K.: Investigation, Data Curation, Visualization. M.P.: Validation, Investigation. K.M.-A.: Resources, P.F.: Investigation, Resources. M.R.F.-G.: Investigation, Resources. All authors have read and agreed to the published version of the manuscript.

Funding

This research received no external funding.

Institutional Review Board Statement

The study was conducted in accordance with the Declaration of Helsinki, and approved by the Institutional Review Board (or Ethics Committee) of Tehran University of Medical Sciences (IR.TUMS.VCR.REC.1397.532).

Informed Consent Statement

Patient consent was waived because it has no intervention in the pathological processes. No harm is posed to study participants and no diagnostics are interrupted. Absence of harm is defined as the probability and magnitude of damage or discomfort not greater than ordinarily encountered during the performance of routine pathopsychological tests, with no effect on the course of disease management.

Data Availability Statement

The data presented in this study are available on request from the corresponding author. The data are not publicly available due to their containing information that could compromise the privacy of research participants.

Conflicts of Interest

All the authors declare that they have no known competing financial interests or personal relationships that could have influenced the work reported in this paper.

References

  1. Maloney, B.W.; McClatchy, D.M.; Pogue, B.W.; Paulsen, K.D.; Wells, W.A.; Barth, R.J. Review of Methods for Intraoperative Margin Detection for Breast Conserving Surgery. J. Biomed. Opt. 2018, 23, 100901. [Google Scholar] [CrossRef]
  2. Tummers, Q.R.J.G.; Verbeek, F.P.R.; Schaafsma, B.E.; Boonstra, M.C.; Van Der Vorst, J.R.; Liefers, G.J.; Van De Velde, C.J.H.; Frangioni, J.V.; Vahrmeijer, A.L. Real-Time Intraoperative Detection of Breast Cancer Using near-Infrared Fluorescence Imaging and Methylene Blue. Eur. J. Surg. Oncol. 2014, 40, 850–858. [Google Scholar] [CrossRef] [PubMed] [Green Version]
  3. Jaafar, H. Intra-Operative Frozen Section Consultation: Concepts, Applications and Limitations. Malays. J. Med. Sci. 2006, 13, 4–12. [Google Scholar]
  4. Taxy, J.B. Frozen Section and the Surgical Pathologist a Point of View. Arch. Pathol. Lab. Med. 2009, 133, 1135–1138. [Google Scholar] [CrossRef] [PubMed]
  5. Du, Z.; Wan, H.; Chen, Y.; Pu, Y.; Wang, X. Bioimpedance Spectroscopy Can Precisely Discriminate Human Breast Carcinoma from Benign Tumors. Medicine 2017, 96, e5970. [Google Scholar] [CrossRef]
  6. Namdar, Z.M.; Omidifar, N.; Arasteh, P.; Akrami, M.; Tahmasebi, S.; Nobandegani, A.S.; Sedighi, S.; Zangouri, V.; Talei, A. How Accurate Is Frozen Section Pathology Compared to Permanent Pathology in Detecting Involved Margins and Lymph Nodes in Breast Cancer? World J. Surg. Oncol. 2021, 19, 261. [Google Scholar] [CrossRef] [PubMed]
  7. Miripour, Z.S.; Abbasvandi, F.; Aghaee, P.; Shojaeian, F.; Faramarzpour, M.; Mohaghegh, P.; Hoseinpour, P.; Namdar, N.; Amiri, M.H.; Ghafari, H.; et al. Human Study on Cancer Diagnostic Probe (CDP) for Real-Time Excising of Breast Positive Cavity Side Margins Based on Tracing Hypoxia Glycolysis; Checking Diagnostic Accuracy in Non-Neoadjuvant Cases. Cancer Med. 2022, 11, 1630–1645. [Google Scholar] [CrossRef]
  8. Baghani, H.R.; Robatjazi, M.; Mahdavi, S.R.; Nafissi, N.; Akbari, M.E. Breast Intraoperative Electron Radiotherapy: Image-Based Setup Verification and in-Vivo Dosimetry. Phys. Med. 2019, 60, 37–43. [Google Scholar] [CrossRef]
  9. O’Halloran, M.; Conceicao, R.C.; Byrne, D.; Glavin, M.E.J. FDTD Modeling of the Breast: A Review. Prog. Electromagn. Res. B 2009, 18, 1–24. [Google Scholar] [CrossRef] [Green Version]
  10. Lazebnik, M.; Popovic, D.; McCartney, L.; Watkins, C.B.; Lindstrom, M.J.; Harter, J.; Sewall, S.; Ogilvie, T.; Magliocco, A.; Breslin, T.M.; et al. A Large-Scale Study of the Ultrawideband Microwave Dielectric Properties of Normal, Benign and Malignant Breast Tissues Obtained from Cancer Surgeries. Phys. Med. Biol. 2007, 52, 6093–6115. [Google Scholar] [CrossRef]
  11. Lazebnik, M.; Okoniewski, M.; Booske, J.H.; Hagness, S.C. Highly Accurate Debye Models for Normal and Malignant Breast Tissue Dielectric Properties at Microwave Frequencies. IEEE Microw. Wirel. Compon. Lett. 2007, 17, 822–824. [Google Scholar] [CrossRef]
  12. Cheng, Y.; Fu, M. Dielectric Properties for Non-Invasive Detection of Normal, Benign, and Malignant Breast Tissues Using Microwave Theories. Thorac. Cancer 2018, 9, 459–465. [Google Scholar] [CrossRef]
  13. Shamoon, D.; Lasquellec, S.; Brosseau, C. Perspective: Towards Understanding the Multiscale Description of Cells and Tissues by Electromechanobiology. J. Appl. Phys. 2018, 123, 240902. [Google Scholar] [CrossRef]
  14. Abdolahad, M.; Shashaani, H.; Janmaleki, M.; Mohajerzadeh, S. Silicon Nanograss Based Impedance Biosensor for Label Free Detection of Rare Metastatic Cells among Primary Cancerous Colon Cells, Suitable for More Accurate Cancer Staging. Biosens. Bioelectron. 2014, 59, 151–159. [Google Scholar] [CrossRef] [PubMed]
  15. Dean, D.A.; Ramanathan, T.; Machado, D.; Sundararajan, R. Electrical Impedance Spectroscopy Study of Biological Tissues. J. Electrostat. 2008, 66, 165–177. [Google Scholar] [CrossRef] [PubMed] [Green Version]
  16. Dos Anjos, I.F.; Barbin, S.E. Measurement of the Dielectric Properties of Micaceous Minerals Using Scattering Parameters. In Proceedings of the Progress in Electromagnetics Research Symposium, Prague, Czech Republic, 6–9 July 2015; pp. 2195–2198. [Google Scholar]
  17. John, C. Scattering Parameters: Concept, Theory, and Applications; Course Notes; University of Southern California: Los Angeles, CA, USA, 2009. [Google Scholar]
  18. Schepps, J.L.; Foster, K.R. The UHF and Microwave Dielectric Properties of Normal and Tumour Tissues: Variation in Dielectric Properties with Tissue Water Content. Phys. Med. Biol. 1980, 25, 1149–1159. [Google Scholar] [CrossRef]
  19. Hussein, M.; Awwad, F.; Jithin, D.; El Hasasna, H.; Athamneh, K.; Iratni, R. Breast Cancer Cells Exhibits Specific Dielectric Signature in Vitro Using the Open-Ended Coaxial Probe Technique from 200 MHz to 13.6 GHz. Sci. Rep. 2019, 9, 4681. [Google Scholar] [CrossRef] [Green Version]
  20. Martellosio, A.; Bellomi, M.; Pasian, M.; Bozzi, M.; Perregrini, L.; Mazzanti, A.; Svelto, F.; Summers, P.E.; Renne, G.; Preda, L. Dielectric Properties Characterization from 0.5 to 50 GHz of Breast Cancer Tissues. IEEE Trans. Microw. Theory Tech. 2017, 65, 998–1011. [Google Scholar] [CrossRef]
  21. Kumar, N.N.; Srikanth, B.; Gurung, S.B.; Manu, S.; Gowthami, G.; Ali, T.; Pathan, S. A Slotted UWB Monopole Antenna with Truncated Ground Plane for Breast Cancer Detection. Alex. Eng. J. 2020, 59, 3767–3780. [Google Scholar] [CrossRef]
  22. Mahmud, M.Z.; Islam, M.T.; Misran, N.; Kibria, S.; Samsuzzaman, M. Microwave Imaging for Breast Tumor Detection Using Uniplanar AMC Based CPW-Fed Microstrip Antenna. IEEE Access 2018, 6, 44763–44775. [Google Scholar] [CrossRef]
  23. O’Rourke, A.P.; Lazebnik, M.; Bertram, J.M.; Converse, M.C.; Hagness, S.C.; Webster, J.G.; Mahvi, D.M. Dielectric Properties of Human Normal, Malignant and Cirrhotic Liver Tissue: In Vivo and Ex Vivo Measurements from 0.5 to 20 GHz Using a Precision Open-Ended Coaxial Probe. Phys. Med. Biol. 2007, 52, 4707–4719. [Google Scholar] [CrossRef] [PubMed]
  24. Fornes-Leal, A.; Garcia-Pardo, C.; Frasson, M.; Beltrán, V.P.; Cardona, N. Dielectric Characterization of Healthy and Malignant Colon Tissues in the 0.5–18 GHz Frequency Band. Phys. Med. Biol. 2016, 61, 7334–7346. [Google Scholar] [CrossRef] [PubMed]
  25. Guardiola, M.; Buitrago, S.; Fernández-Esparrach, G.; O’Callaghan, J.M.; Romeu, J.; Cuatrecasas, M.; Córdova, H.; Ángel González Ballester, M.; Camara, O. Dielectric Properties of Colon Polyps, Cancer, and Normal Mucosa: Ex Vivo Measurements from 0.5 to 20 GHz. Med. Phys. 2018, 45, 3768–3782. [Google Scholar] [CrossRef] [PubMed] [Green Version]
  26. Reimann, C.H.N.; Bazrafshan, B.; Hubner, F.; Schmidt, S.; Schuler, M.; Panahi, B.; Kaltenbach, B.; Polkowski, C.; Vogl, T.J.; Jakoby, R. Dielectric Contrast between Normal and Tumor Ex-Vivo Human Liver Tissue. IEEE Access 2019, 7, 164113–164119. [Google Scholar] [CrossRef]
  27. Search, H.; Journals, C.; Contact, A.; Iopscience, M.; Address, I.P. RF Magnetic Field Penetration, Phase Shift and Power for NMR Dissipation in Biological Tissue: Implications Imaging. Phys. Med. Biol. 1978, 23, 630. [Google Scholar]
  28. Gu, D.; Jargon, J.A.; Ryan, M.J.; Hubrechsen, A. Influence of Noise on Scattering-Parameter Measurements. IEEE Trans. Microw. Theory Tech. 2020, 68, 4925–4939. [Google Scholar] [CrossRef]
  29. Miripour, Z.S.; Abbasvandi, F.; Aghaee, P.; NajafiKhoshnoo, S.; Faramarzpour, M.; Mohaghegh, P.; Hoseinpour, P.; Namdar, N.; Amiri, M.H.; Ghafari, H.; et al. Electrochemical tracing of hypoxia glycolysis by carbon nanotube sensors, a new hallmark for intraoperative detection of suspicious margins to breast neoplasia. Bioeng. Transl. Med. 2022, 7, e10236. [Google Scholar] [CrossRef]
  30. Mahdavi, R.; Yousefpour, N.; Abbasvandi, F.; Ataee, H.; Hoseinpour, P.; Akbari, M.E.; Parniani, M.; Delshad, B.; Avatefi, M.; Nourinejad, Z.; et al. Intraoperative pathologically-calibrated diagnosis of lymph nodes involved by breast cancer cells based on electrical impedance spectroscopy; a prospective diagnostic human model study. Int. J. Surg. 2021, 96, 106166. [Google Scholar] [CrossRef]
  31. Mahdavi, M.; Amouzegar, A.; Mehran, L.; Madreseh, E.; Tohidi, M.; Azizi, F. Investigating the prevalence of primary thyroid dysfunction in obese and overweight individuals: Tehran thyroid study. BMC Endocr. Disord. 2021, 21, 89. [Google Scholar] [CrossRef]
  32. Shinde, G.; Desai, P.; Shelke, S.; Patel, R.; Bangale, G.; Kulkarni, D. Mometasone furoate-loaded aspasomal gel for topical treatment of psoriasis: Formulation, optimization, in vitro and in vivo performance. J. Dermatol. Treat. 2020, 33, 885–896. [Google Scholar] [CrossRef]
  33. Shinde, G.; Shiyani, S.; Shelke, S.; Chouthe, R.; Kulkarni, D.; Marvaniya, K. Enhanced brain targeting efficiency using 5-FU (fluorouracil) lipid–drug conjugated nanoparticles in brain cancer therapy. Prog. Biomater. 2020, 9, 259–275. [Google Scholar] [CrossRef] [PubMed]
  34. Mehrotra, P.; Chatterjee, B.; Sen, S. EM-wave biosensors: A review of RF, microwave, mm-wave and optical sensing. Sensors 2019, 19, 1013. [Google Scholar] [CrossRef]
  35. Egot-Lemaire, S.; Pijanka, J.; Sulé-Suso, J.; Semenov, S. Dielectric Spectroscopy of Normal and Malignant Human Lung Cells at Ultra-High Frequencies. Phys. Med. Biol. 2009, 54, 2341–2357. [Google Scholar] [CrossRef] [PubMed]
  36. Geiger, T.; Cox, J.; Mann, M. Proteomic Changes Resulting from Gene Copy Number Variations in Cancer Cells. PLoS Genet. 2010, 6, e1001090. [Google Scholar] [CrossRef] [PubMed]
  37. Bellorofonte, C.; Vedruccio, C.; Tombolini, P.; Ruoppolo, M.; Tubaro, A. Non-Invasive Detection of Prostate Cancer by Electromagnetic Interaction. Eur. Urol. 2005, 47, 29–37. [Google Scholar] [CrossRef]
  38. Mccune, J.A.; Scherman, O.A. Cucurbit [n] Urils, 2nd ed.; Elsevier: Amsterdam, The Netherlands, 2017; Volume 1, ISBN 9780124095472. [Google Scholar]
  39. Bah, M.; Hong, J.; Jamro, D. Study of Breast Tissues Dielectric Properties in UWB Range for Microwave Breast Cancer Imaging. Proc. Int. Conf. Comput. Inf. Syst. Ind. Appl. 2015, 18, 473–475. [Google Scholar]
  40. Romanenko, S.; Begley, R.; Harvey, A.R.; Hool, L.; Wallace, V.P. The interaction between electromagnetic fields at megahertz, gigahertz and terahertz frequencies with cells, tissues and organisms: Risks and potential. J. R. Soc. Interface 2017, 14, 20170585. [Google Scholar] [CrossRef] [Green Version]
  41. Boyd, N.F.; Martin, L.J.; Bronskill, M.; Yaffe, M.J.; Duric, N.; Minkin, S. Breast Tissue Composition and Susceptibility to Breast Cancer. J. Natl. Cancer Inst. 2010, 102, 1224–1237. [Google Scholar] [CrossRef]
Figure 1. GHz measurement system. (a) The used network analyzer (KeySight FieldFox N9918A). (b) The open-ended coaxial cable (Semi-Flexible Cable 670-086 SXE). (c) Magnified view of the coaxial cable. (d) A Foley catheter modified for applying suction thoroughly. (e) Suction pump.
Diagnostics 13 00179 g001
Figure 2. GHz measurement on a mouse model. (a) Tumor tissue and applying the GHz probe on it. (b) Normal mouse tissue with H&E assay representing the fibrotic connective tissue and cancerous mouse tissue with H&E assay representing a hypercellular region and high nucleus-to-cytoplasm size ratio. (c) Frequency-dependent behaviour of S11 parameter for normal and cancerous tissues with or without applying suction force.
Diagnostics 13 00179 g002
Figure 3. (a) mean values of S11 magnitude in three categories of fatty, benign, and malignant breast tissues. (b) Differences of each category versus tumor spectrum. (c) Variation of measured S11 by the time after dissection with magnification. (d) The ROC curve for different cut-offs.
Diagnostics 13 00179 g003
Figure 4. GHz spectroscopy on human tumor margins. (a) H&E assay of a measured margin sample, 2.7 × 2.7 cm. (b) S11 magnitude measurements on the selected margin in 18 points. Pathologically negative and positive points are represented in green and red, respectively. The obtained pattern is completely matched with the H&E assay.
Diagnostics 13 00179 g004
Figure 5. (a) Schematic view of an electrical network with two ports in a high-frequency region to describe scattering parameter, S11. (b) Schematic view of protein content and water distribution of a normal cell, which results in an increased S11 parameter in normal tissue due to less resonant membrane-bound waters associated with decreased expression of membrane proteins. (c) Schematic view of protein content and water distribution of a cancer cell, which results in a decreased S11 parameter in cancerous tissue due to more resonant membrane-bound waters associated with increased expression of membrane proteins.
Diagnostics 13 00179 g005
Table 1. Defining a cut-off value for samples.
Cut-OffAUCp-ValueSensitivitySpecificityAccuracy
Cut-off = −6.75 dB0.7430.00002%94.3%54.3%65.3
Cut-off = −7 dB0.7760.000001%94.3%60.8%70
Cut-off = −7.25 dB0.8740.0000000001%94.7%83.1%86.6
Cut-off = −7.5 dB0.7590.000006%71.4%80.4%77.9
Cut-off = −7.75 dB0.6200.03%37.1%86.9%73.2
Disclaimer/Publisher’s Note: The statements, opinions and data contained in all publications are solely those of the individual author(s) and contributor(s) and not of MDPI and/or the editor(s). MDPI and/or the editor(s) disclaim responsibility for any injury to people or property resulting from any ideas, methods, instructions or products referred to in the content.

