
Electrocardiographic Characteristics, Identification, and Management of Frequent Premature Ventricular Contractions

 ,
,  , , ,
, , ,
Abstract
:1. Epidemiology
2. Natural History
3. Prognosis
4. Arrhythmia Mechanism and Substrate
5. PVC-Induced Myocardial Dysfunction
6. Prevalence of Outflow Tract Ventricular Arrhythmias
7. Electrocardiographic Patterns of RVOT Sites
8. Electrocardiographic Patterns of Pulmonary Valve Sites
9. Electrocardiographic Patterns of LVOT Sites
10. Electrocardiographic Patterns of LV Summit
11. ECG Prediction Algorithms
11.1. Classic ECG Algorithms (Table 1 and Table 2)
11.1.1. Earliest Onset in V2 and Time to the First QRS Peak/Nadir in Leads V2 and III
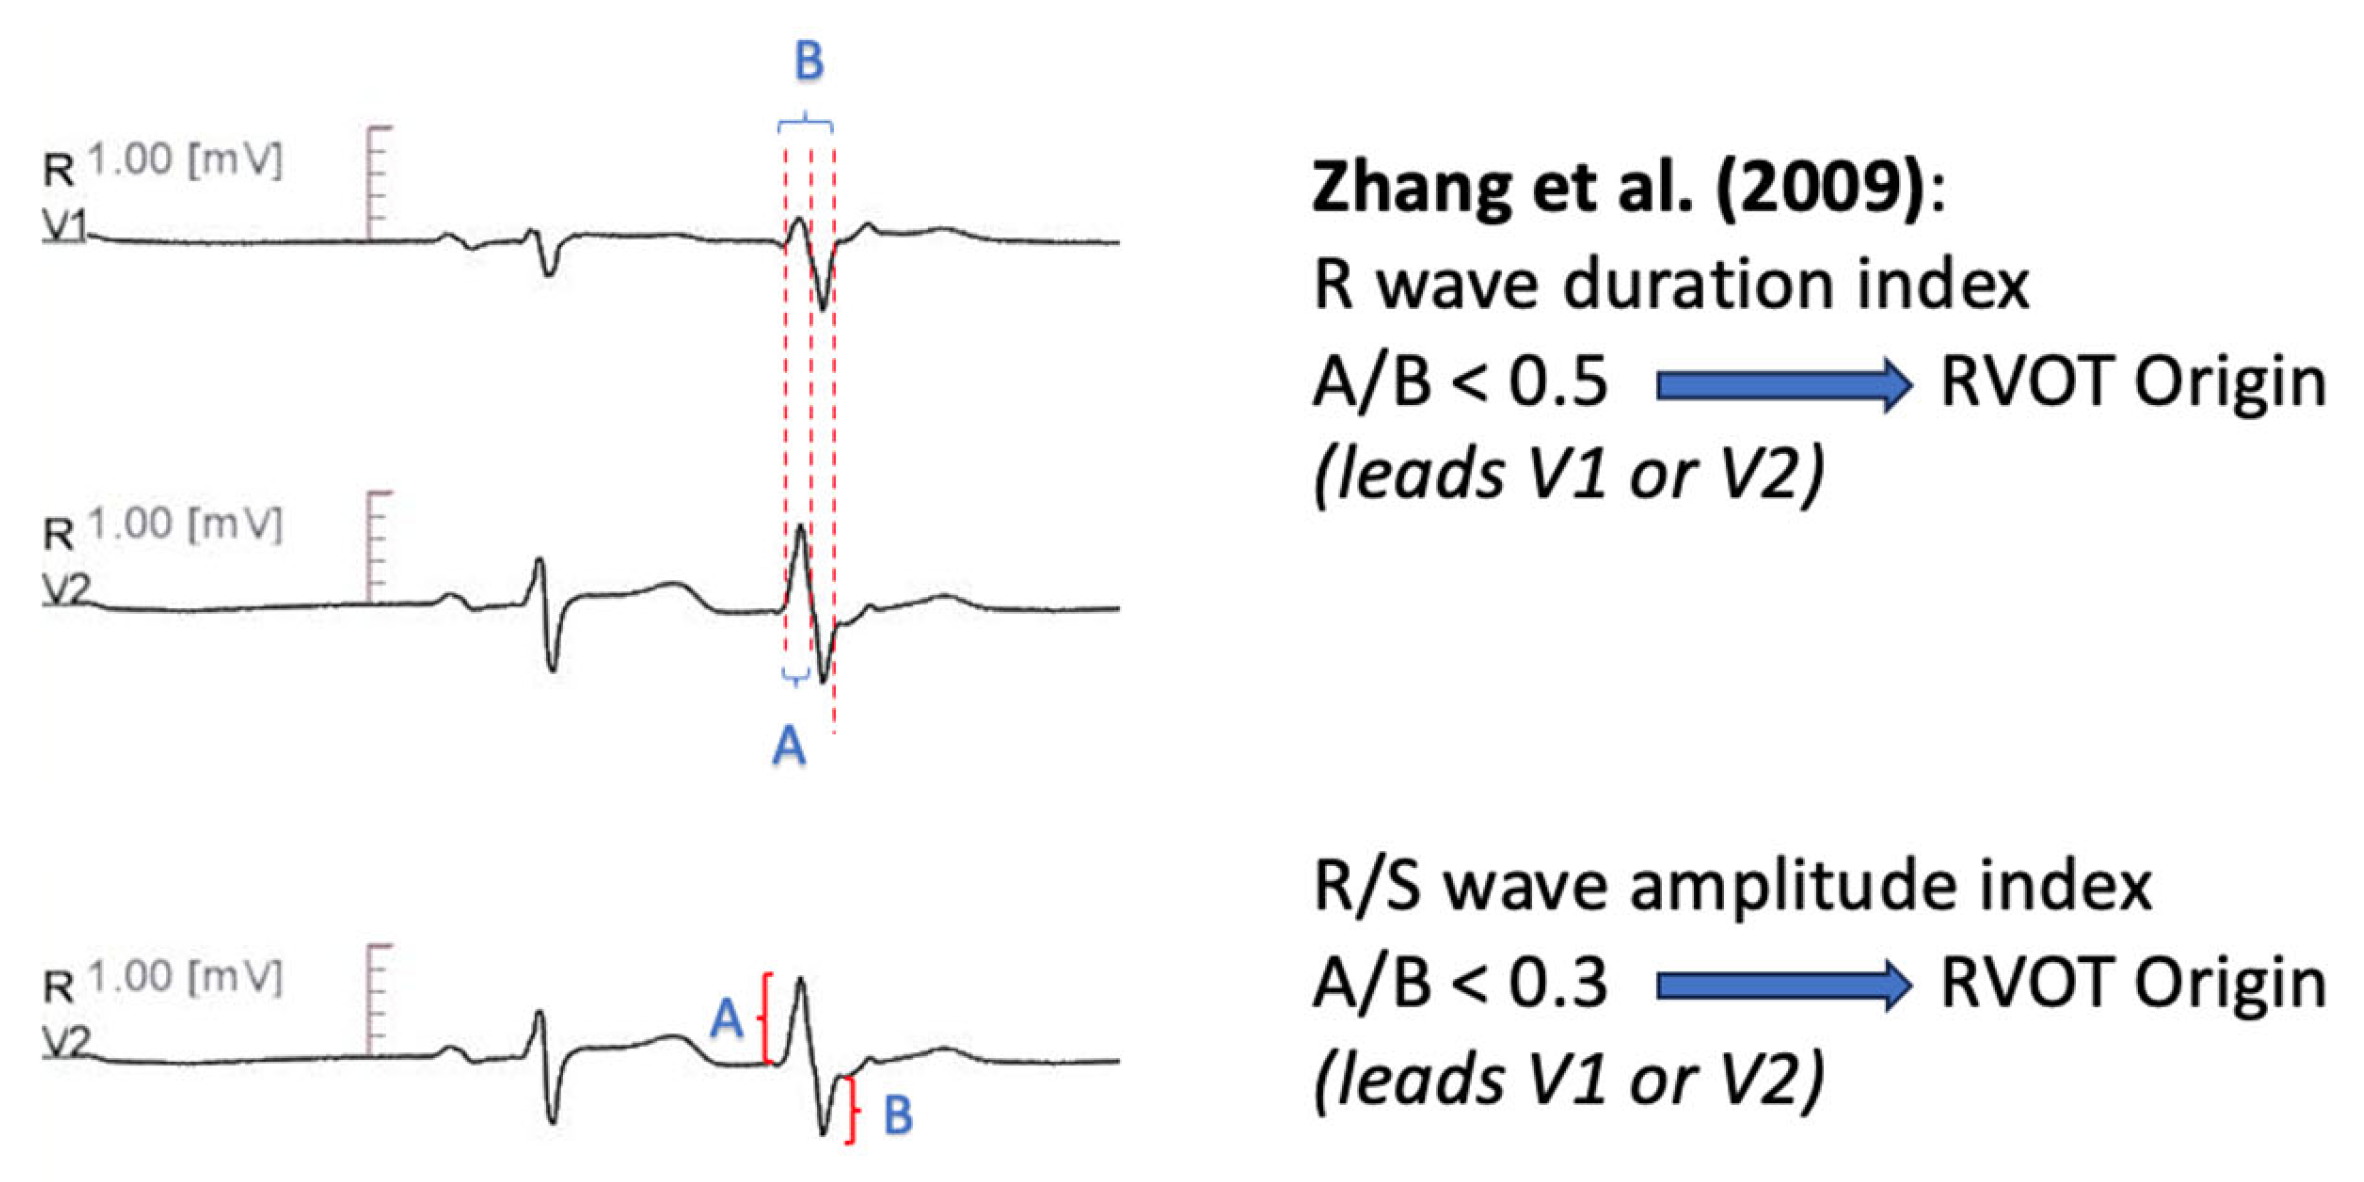
11.1.2. R Wave Duration Index-R/S Amplitude Index
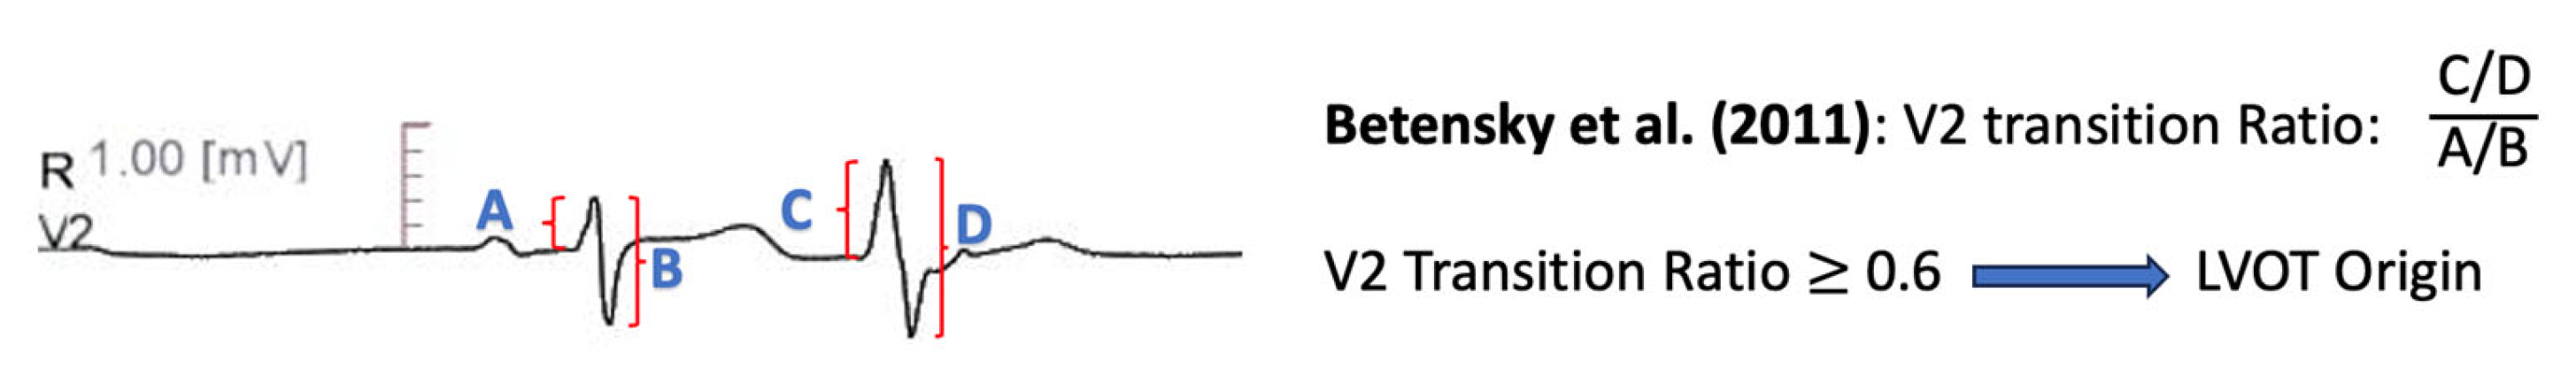
11.1.3. V2 Transition Ratio
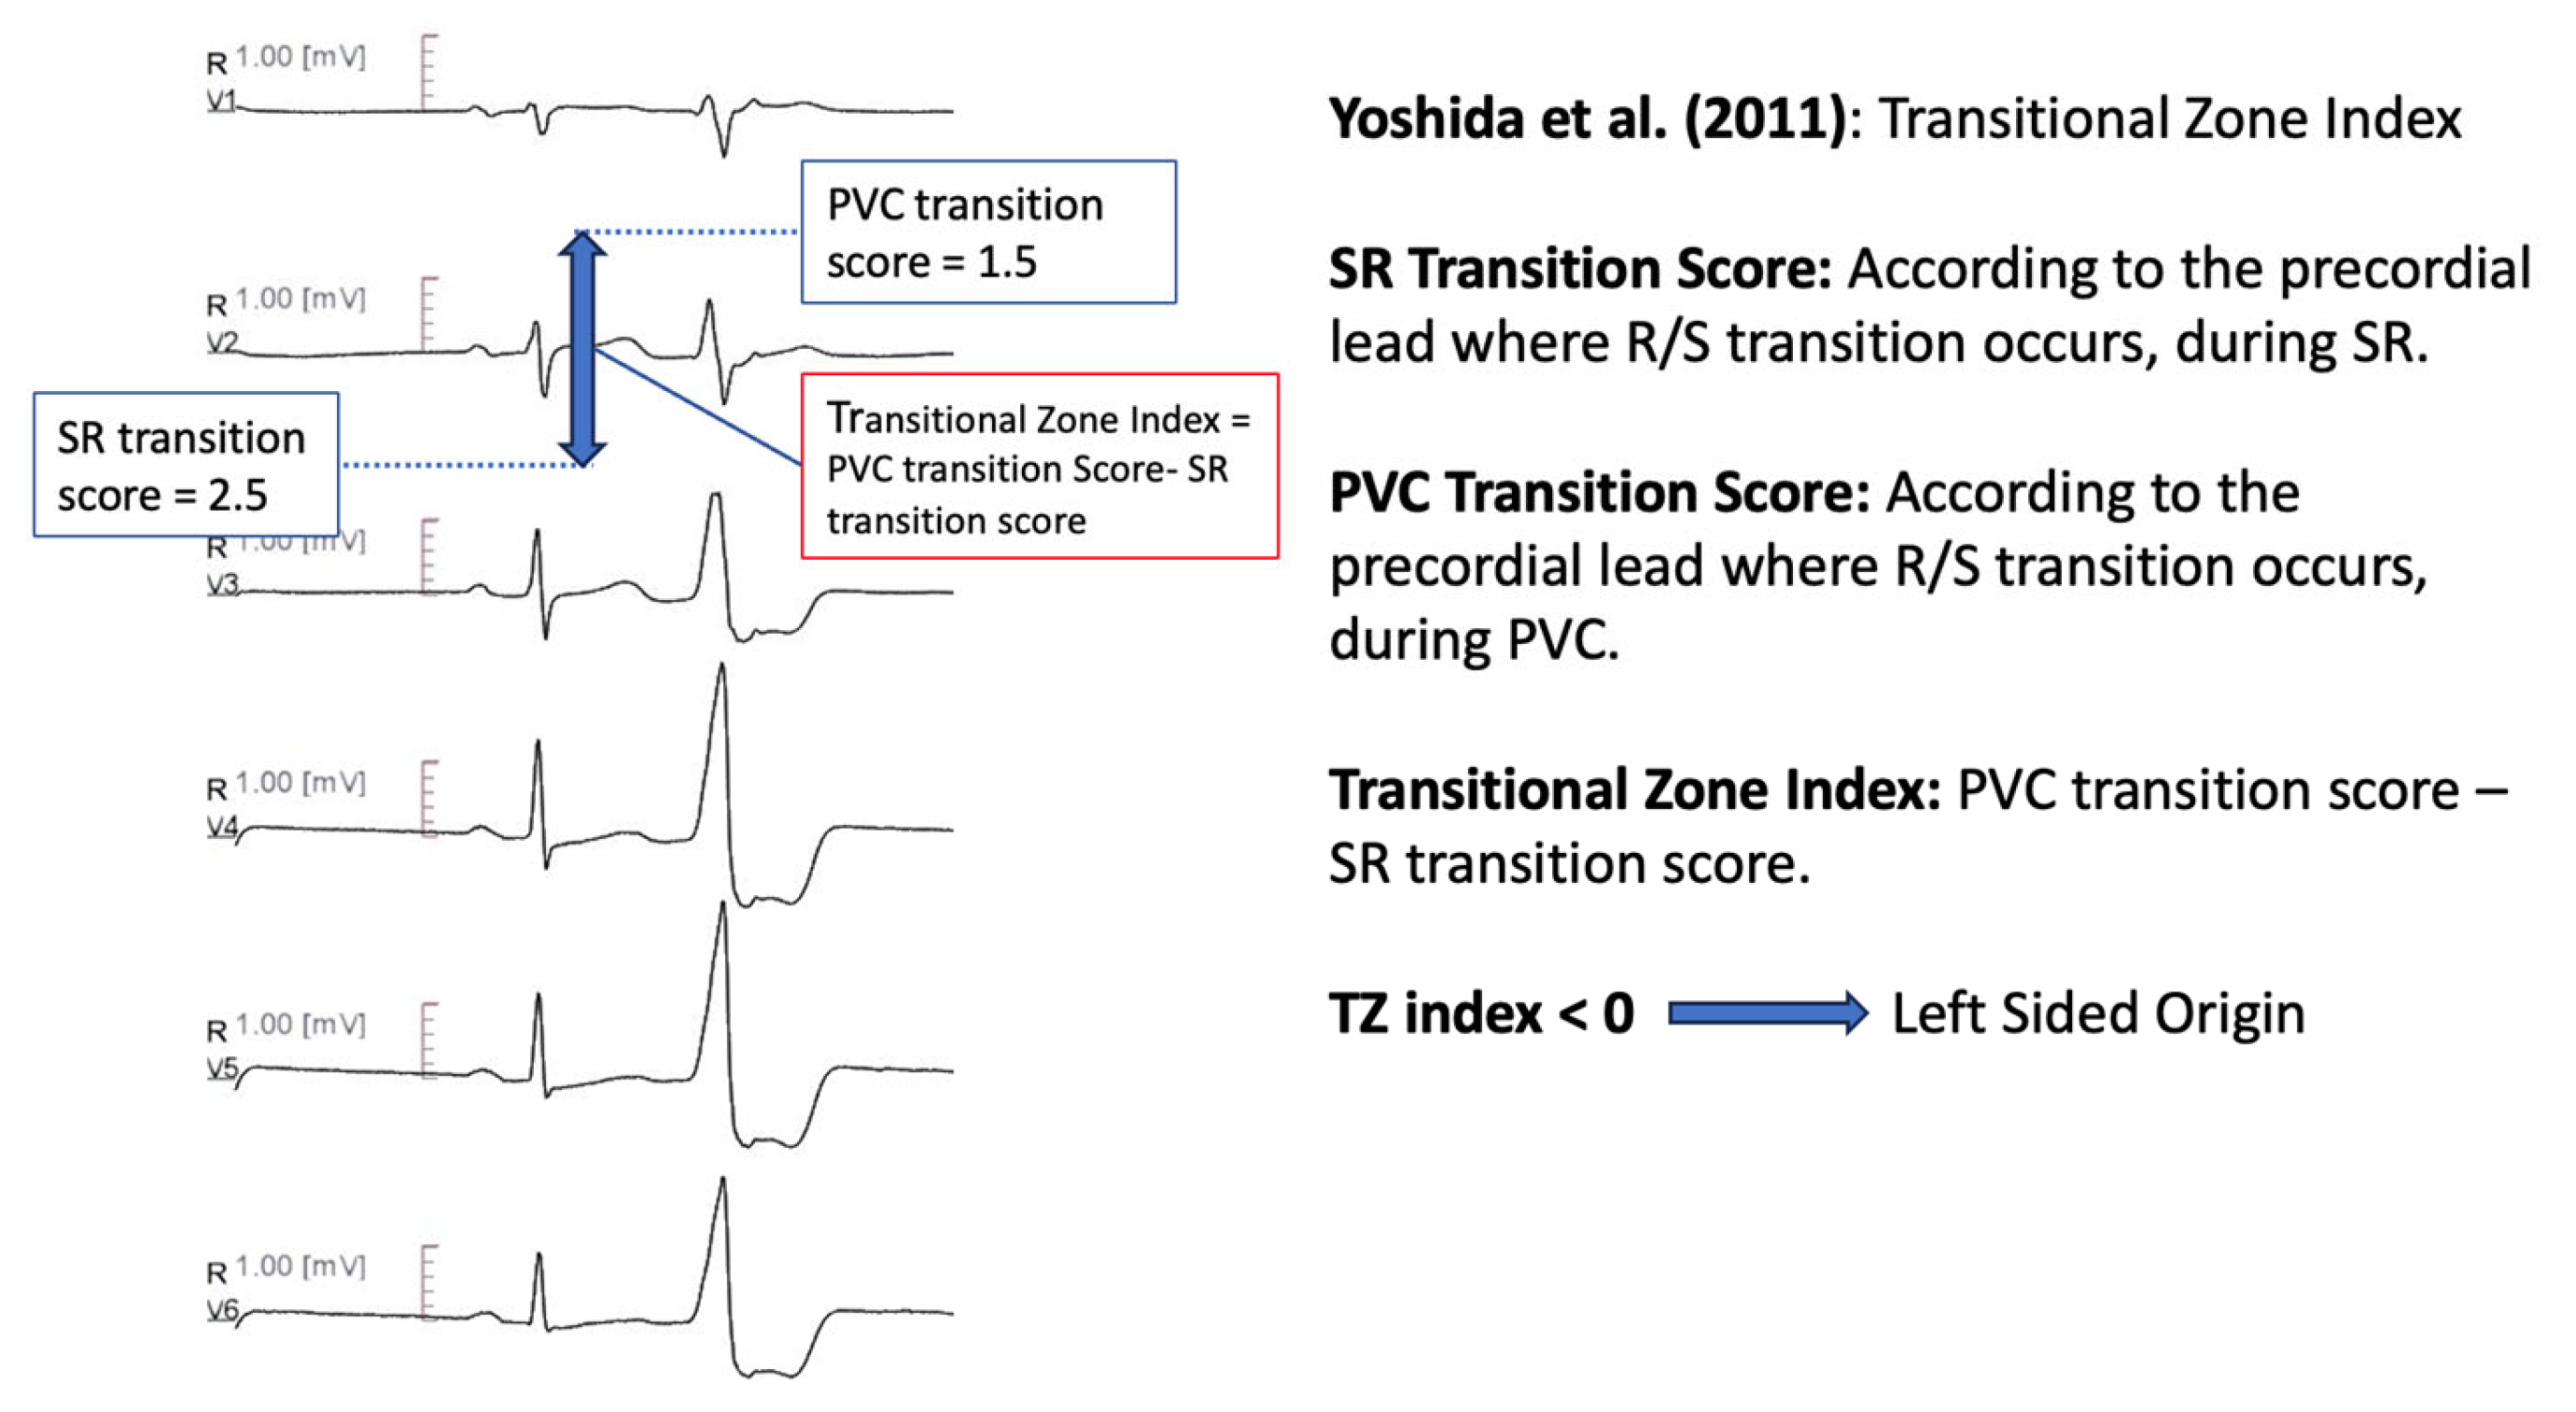
11.1.4. Transitional Zone Index
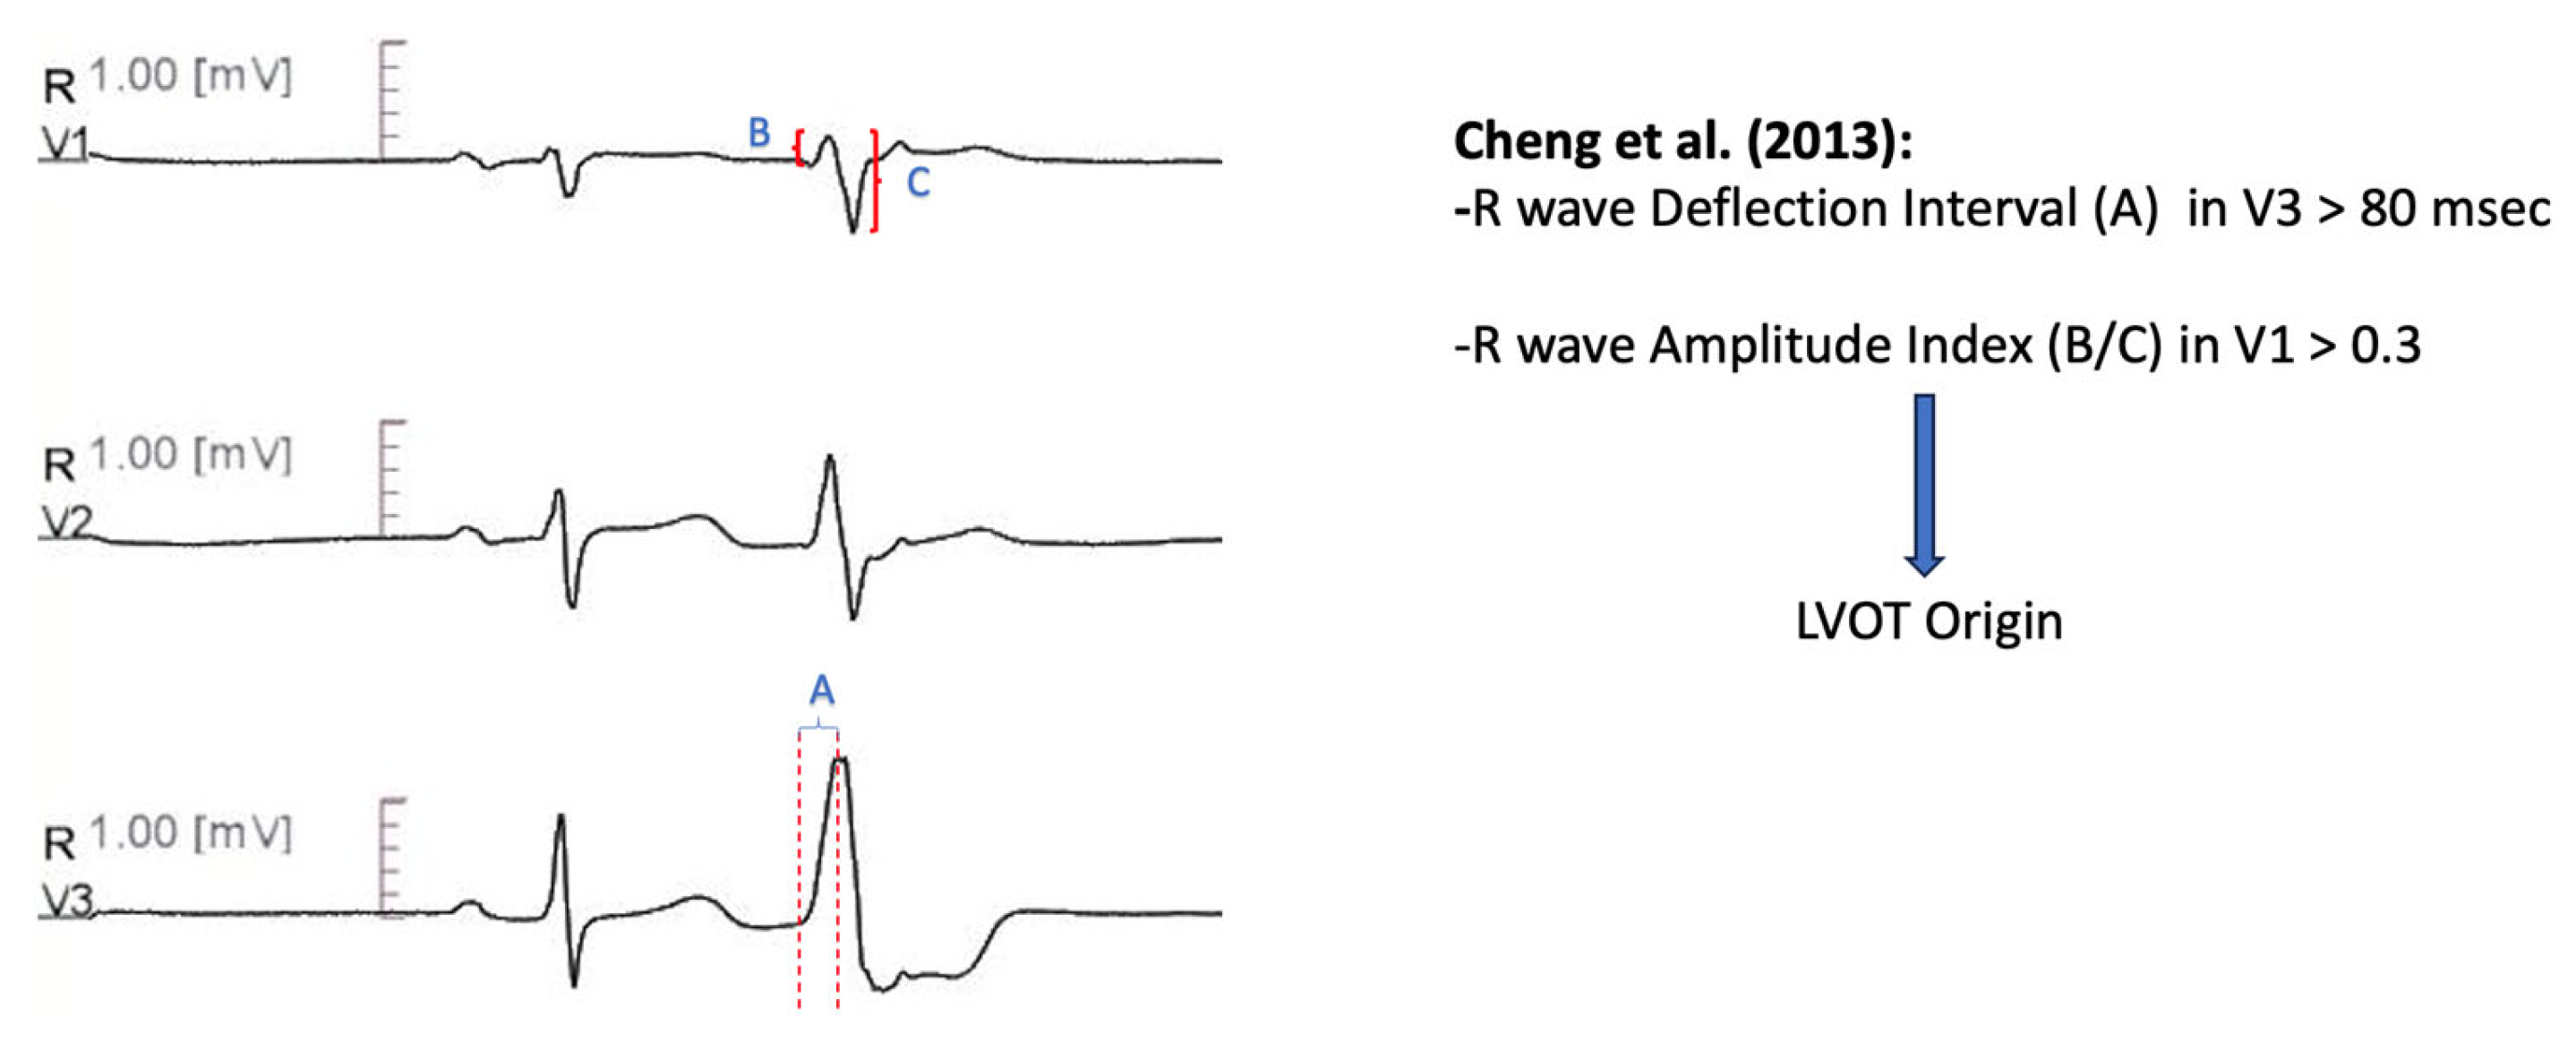
11.1.5. V3 R-Wave Deflection Interval Combined with V1 R-Wave Amplitude Index
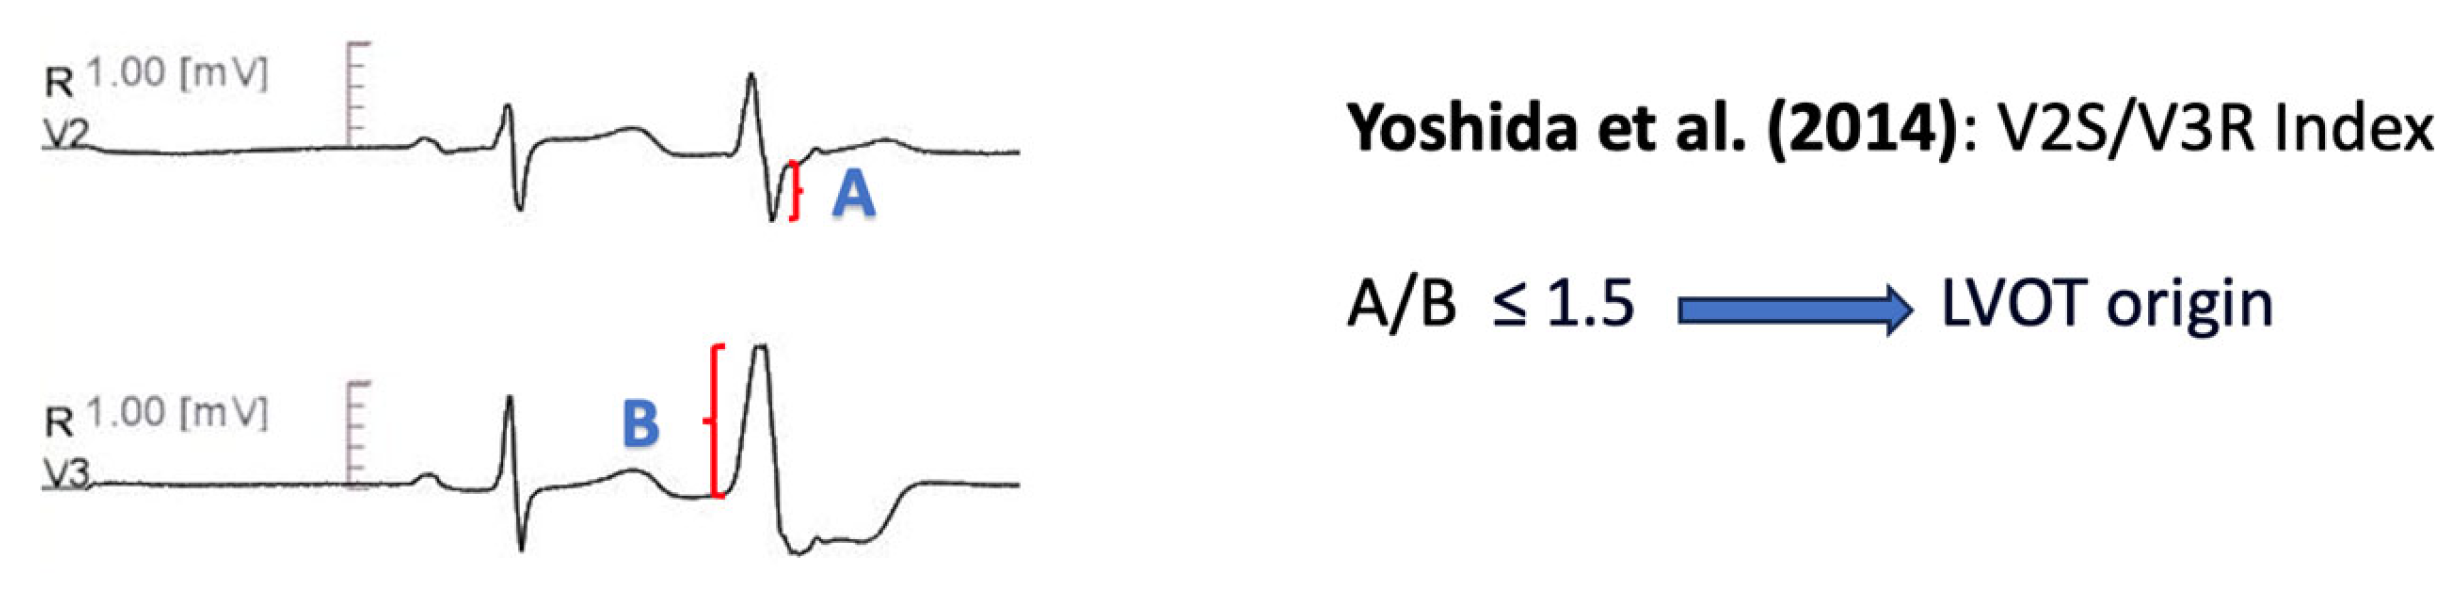
11.1.6. V2S/V3R Amplitude Index
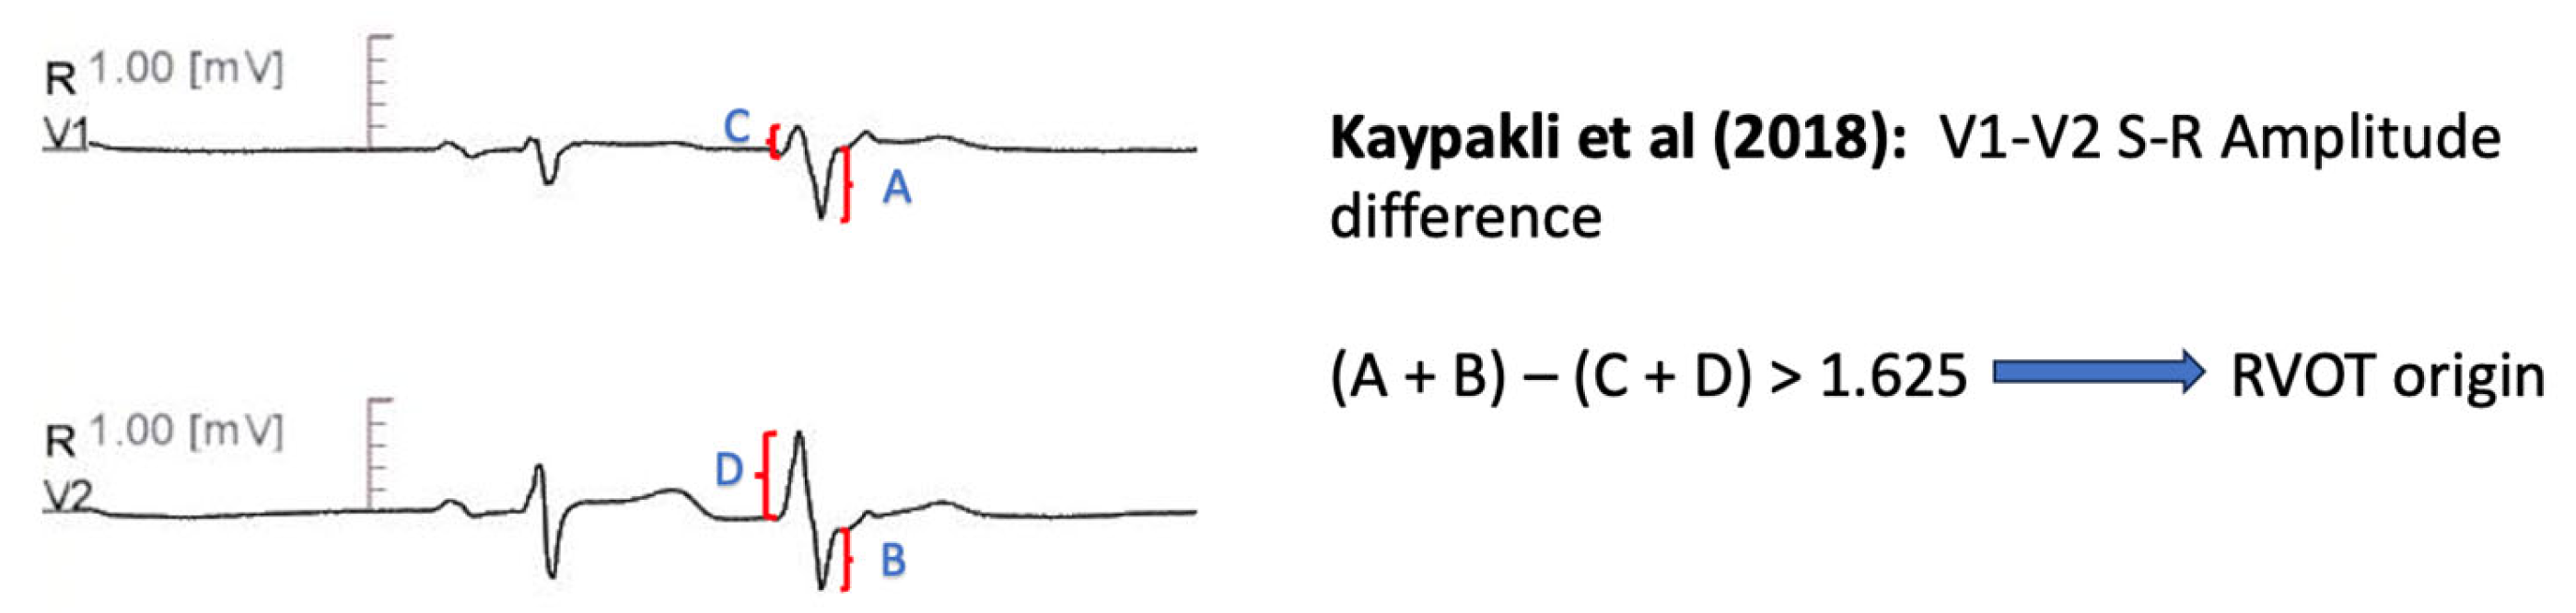
11.1.7. V1–V2 S-R Amplitude Difference
11.1.8. Combined Transition Zone and V2S/V3R Amplitude Index
11.1.9. Lead I R-Wave Amplitude
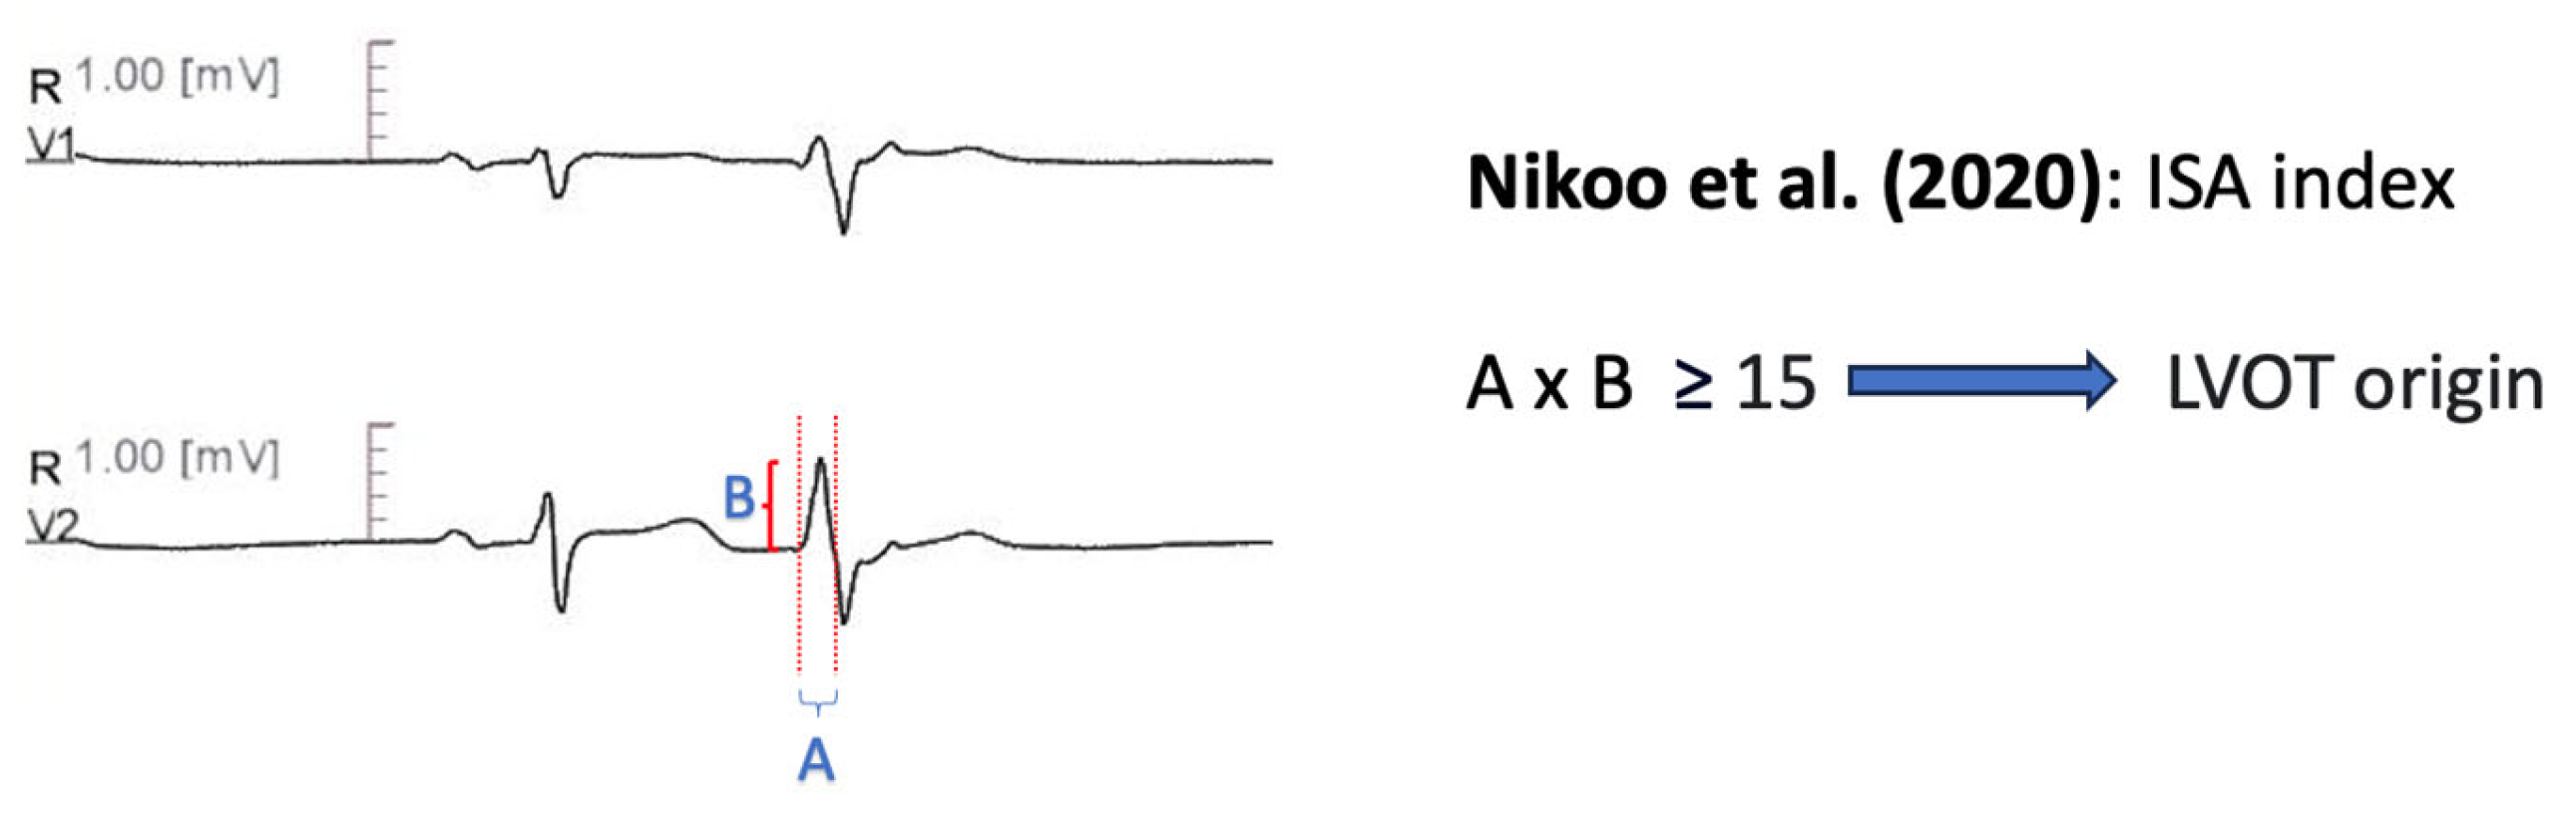
11.1.10. Initial R Wave Surface Area Index (ISA)
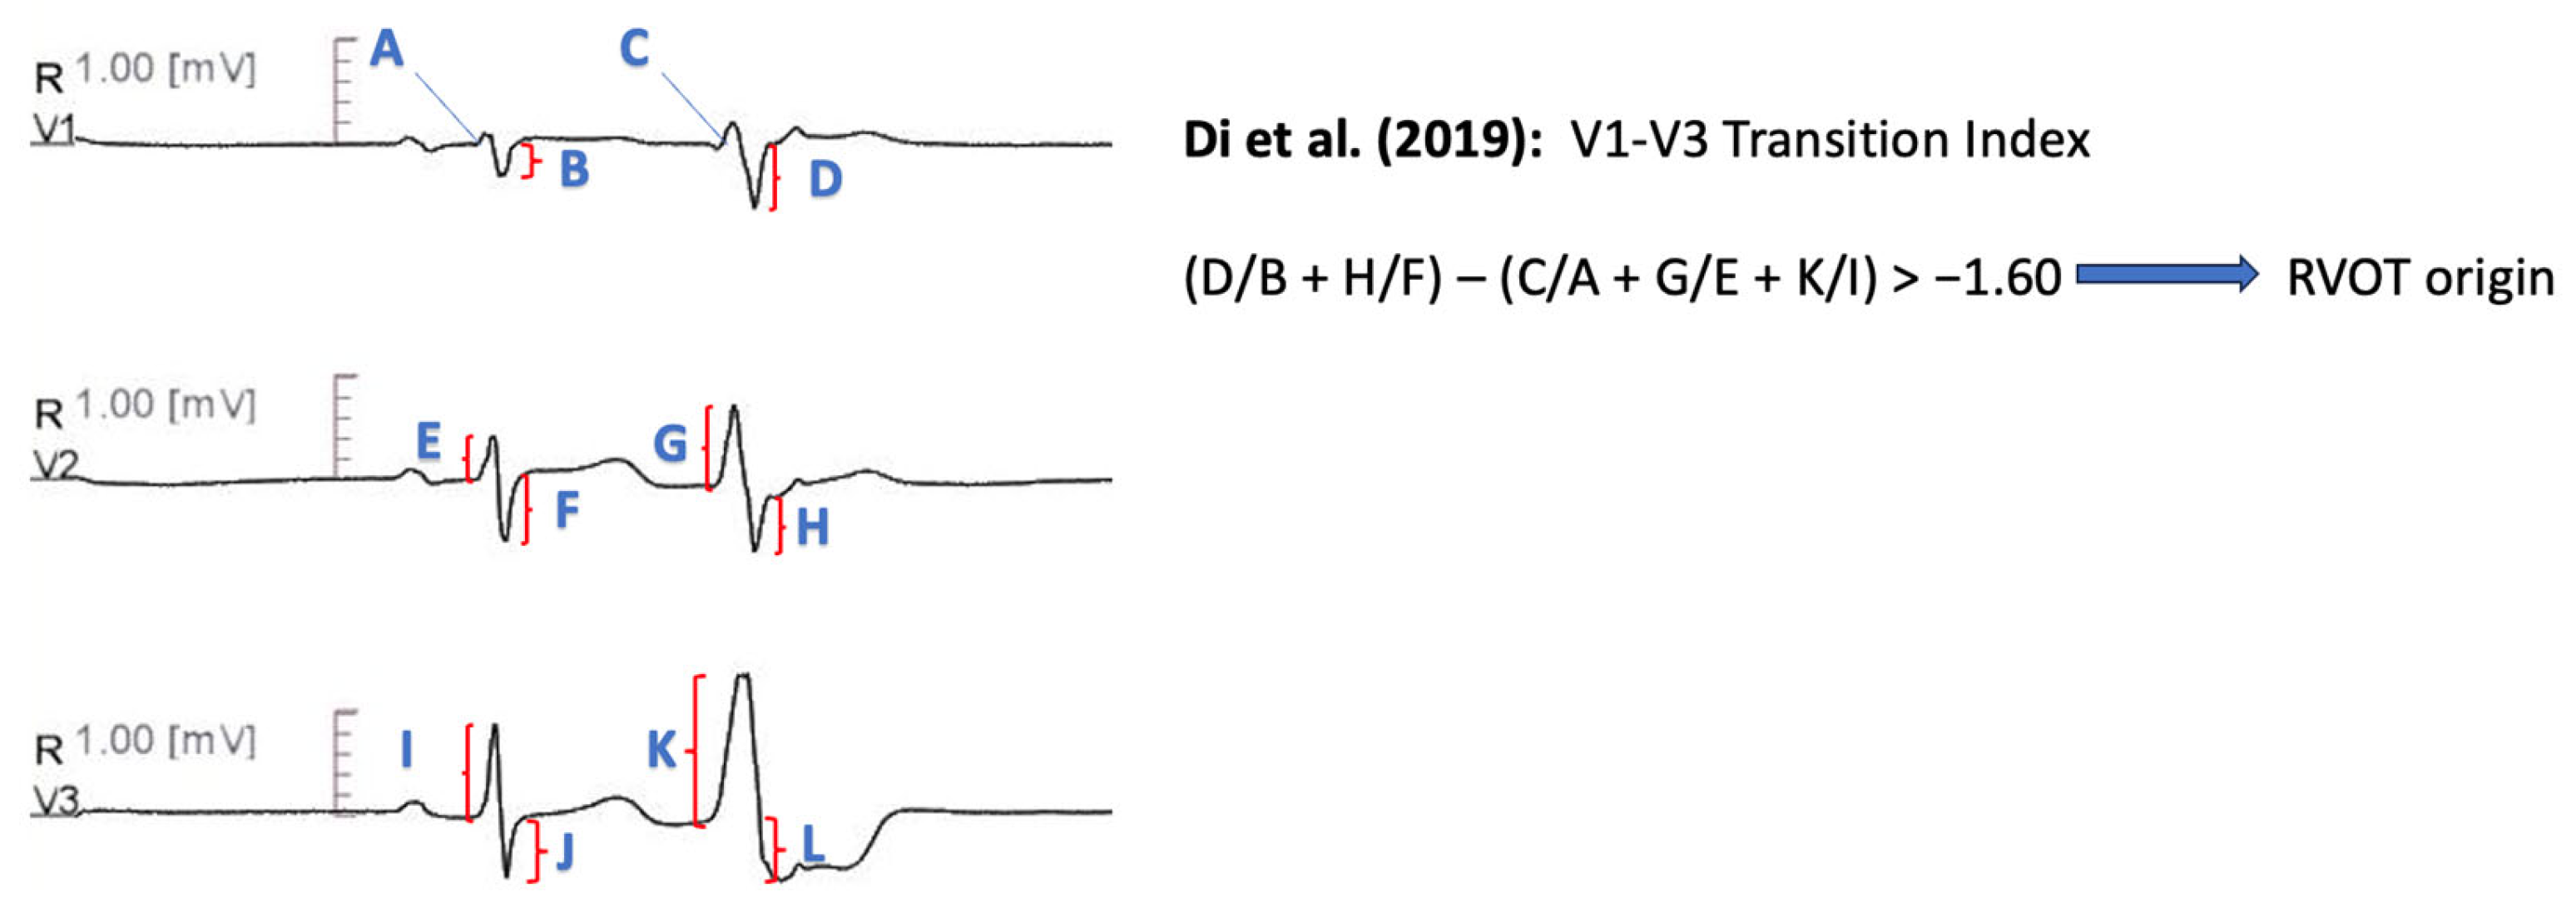
11.1.11. V1–V3 Transition Index
11.1.12. RV1-V3 Transition Ratio
11.1.13. R-S Difference Index

| Author | Year Published | Site Differentiation | Patients Included | Study Methodology | Electroanatomical Mapping | Inclusion Criteria |
|---|---|---|---|---|---|---|
| Yang et al. [59] | 2007 | RVOT vs. ASC | 45 | Retrospective | 31 patients | Symptomatic-Refractory VT Antiarrhythmic drugs refractoriness Absence of structural heart disease |
| Zhang et al. [60] | 2009 | RVOT vs. LVOT | 52 | Retrospertive cohort: 39 patients Prospective cohort: 13 patients | Yes | Monomorphic VA with LBBB morphology and inferior axis. Normal LVEF Failed or intolerant beta-blocker/antiarrhythmic therapy |
| Betensky et al. [61] | 2011 | RVOT vs. LVOT | 61 | Retrospertive cohort: 40 patients Prospective cohort: 21 patients | Yes | Idiopathic PVC or VT Precordial transition in lead V3 Patients with presumed cardiomyopathy due to frequent ventricular ectopy were included |
| Yoshida et al. [62] | 2011 | RVOT vs. ASC | 112 | Retrospective | NR | Symptomatic idiopathic VT or PVCs, successfully ablated in either RVOT or ASC ECG with typical LBBB morphology with inferior axis Normal ECG during SR |
| Cheng et al. [63] | 2012 | RVOT vs. LVOT | 43 | Retrospertive cohort: 31 patients Prospective cohort: 12 patients | NR | At least one failed antiarrhythmic drug treatment Precordial transition in lead V3 |
| Yoshida et al. [64] | 2014 | RVOT vs. LVOT | 207 | Retrospective | Yes | Absence of structural heart disease LBBB morphology–inferior axis of VT/PVC |
| Kaypakli et al. [65] | 2017 | RVOT vs. LVOT | 123 | Retrospective | 22 patients | Symptomatic patients Frequent outflow tract PVCs Successful ablation Not fulfilling ARVC task force criteria |
| He et al. [66] | 2018 | RVOT vs. LVOT | 695 | Retrospertive cohort: 488 patients Prospective cohort: 207 patients | YES | Successful outflow tract ventricular arrhythmias with LBBB and inferior axis Absence of structural heart disease |
| Xie et al. [67] | 2018 | RVOT vs. LVOT | 75 | Retrospective | YES | Ventricular arrhythmias with LBBB morphology and inferior axis Absence of structural heart hisease |
| Nikoo et al. [68] | 2020 | RVOT vs. LVOT | 60 | Retrospective | NR | Symptomatic VT or PVC, refractory to pharmaceutical therapy, with inferior axis Absence of structural heart disease Successful ablation |
| Di et al. [69] | 2019 | RVOT vs. LVOT | 184 | Retrospertive cohort: 147 patients Prospective cohort: 37 patients | YES | Symptomatic outflow tract VT or PVC Precordial transition in lead V3 Absence of ischemic-structural heart disease and paced rhythm |
| Efremidis et al. [70] | 2021 | RVOT vs. LVOT | 58 | YES | Outflow tract ventricular VT or PVC with LBBB and inferior axis Precordial transition in lead V3 Absence of structural heart disease | |
| Zhao et al. [71] | 2022 | Septum of RVOT vs. LVOT-ASC | 259 | Retrospective | NR | Idiopathic PVCs Successful ablation |
| Author | Algorithm | Diagnostic Measures |
|---|---|---|
| Yang et al. [59] | V2 is not the lead with the earliest QRS onset, OR Time to initial QRS peak/nadir in lead III > 120 msec, OR Time to initial QRS peak/nadir in lead V2 > 78 ms: Predicts ASC origin. | Sensitivity 92% Specificity 88% |
| Zhang et al. [60] | Transition zone ≥ V4 predicts RVOT origin R wave duration index [QRS duration (PVC)/R duration (PVC)] in V1 or V2 < 0.5 OR R(PVC)/S(PVC) amplitude index < 0.3 in V1 or V2 predicts RVOT origin | Precision 100% Sensitivity 92.30% for Criterion A Precision 100% Sensitivity 94.87% for Criterion B |
| Betensky et al. [61] | PVC precordial transition later than SR transition predicts RVOT origin, IF NOT V2 Transition Ratio: VT (R/R + S) divided by SR(R/R + S) ≥ 0.60 predicts LVOT origin | Specificity 100% Sensitivity 19% for Criterion A Precision 100%, Specificity 100% Sensitivity 95%, AUC 0.992 for Criterion B |
| Yoshida et al. [62] | Transition Zone index, defined as Transition Zone score (calculated according to the position where the amplitudes of the R and S waves are equal) of OT-VA minus Transition Zone score of sinus beat. TZ index < 0 predicts ASC origin | Sensitivity 88% Specificity 82% AUC 0.9 |
| Cheng et al. [63] | R wave deflection interval (ascending part of R in PVC) in V3 > 80 msec predicts LVOT VT, IF NOT R wave amplitude index (R wave amplitude divided by QRS amplitude during PVC) in V1 > 0.3 predicts LVOT VT | Precision 85.70% Sensitivity 100% Specificity 83.30% |
| Yoshida et al. [64] | V2S/V3R (in PVC) ≤ 1.5 predicts LVOT origin | Precision 84.0% Sensitivity 89.0% Specificity 94.0% AUC 0.964 |
| Kaypakli et al. [65] | S-R difference: (V1S + V2S) − (V1R + V2R) > 1.625 mV predicts RVOT origin. | Precision 86.50% Sensitivity 95.10% Specificity 85.0% AUC 0.929 |
| He et al. [66] | Y = −1,15 × (TZ) − 0.494 × (V2S/V3R). Y ≥ −0.76 predicts LVOT origin. | Sensitivity 90.0% Specificity 87.0% AUC 0.88 |
| Xie et al. [67] | R wave amplitude ≥ 0.1 in I predicts LVOT origin | Precision 92.30% Sensitivity 98.0% Specificity 75.0% AUC 0.85 |
| Nikoo et al. [68] | ISA index: multiplying R wave in msec by the R wave amplitude in mV in the leads V1 or V2. A cut off value ≥ 15 in any of these leads predicts LVOT origin. | Precision 94.60% Sensitivity 78.20% Specificity 94.60% AUC 0.81 |
| Di et al. [69] | V1–V3 transition index: [(SPVC/SSR)V1 + (SPVC/SSR)V2] − [(RPVC/RSR)V1 + (RPVC/RSR)V2 + (RPVC/RSR)V3] > −1.60 | Sensitivity 93.00% Specificity 86.00% AUC 0.931 |
| Efremidis et al. [70] | RV1-V3 transition ratio [(RV1 + RV2 + RV3)PVC/(RV1 + RV2 + RV3)SR] ≥ 0.9 predicts LVOT origin. | Sensitivity 94.00% Specificity 73.00% AUC 0.856 |
| Zhao et al. [71] | R-S difference index (V2R + V3R +V4R − V1S) − of PVCs > 20.9 predicts LVOT origin. | Sensitivity 73.30% Specificity 86.30% AUC 0.867 |
11.2. Alternative ECG Configuration Algorithms (Table 3 and Table 4)
11.2.1. Earliest Onset in V2 and Time to the First QRS Peak/Nadir in Leads V2 and III
QRS Morphology in V5R
11.2.2. R/S Concordance in Synthesized V3R, V4R and V5R
11.2.3. V4/V8 Index
11.2.4. V3R/V7 Index
| Author | Year Published | Site Differentiation | Patients Included | Study Methodology | Electroanatomical Mapping | Inclusion Criteria |
|---|---|---|---|---|---|---|
| Igarashi et al. [72] | 2014 | RVOT vs. LVOT | 101 | Retrospertive cohort: 28 patients Prospective cohort: 73 patients | Yes | Idiopathic, symptomatic, drug-refractory ventricular arrhythmia Single bundle branch block with inferior axis on surface ECG |
| Nakano et al. [73] | 2014 | RVOT septum vs. RVOT free wall vs. LVOT | 63 | Retrospective | 16 patients | Absence of obvious structural heart disease Successful RF ablation of symptomatic arrhythmia |
| Zhang et al. [74] | 2017 | RVOT vs. LVOT | 174 | Derivation Cohort: 134 patients Validation Cohort: 40 patients | Yes | Absence of structural heart disease, permanent pacing and bundle branch block |
| Cheng et al. [75] | 2018 | RVOT vs. LVOT | 191 | Derivation Cohort: 97 patiens Validation Cohort: 94 patients | Yes | Absence of coronary heart disease, structural heart disease, paced rhythm and preexisting bundle branch block during sinus rhythm |
| Author | Algorithm | Diagnostic Measures |
|---|---|---|
| Igarashi et al. [72] | RS biphasic pattern predicts RVOT morphology (both Rs and rS). | Sensitivity 87% Specificity 91% |
| Nakano et al. [73] |
| Sensitivity 100% Specificity 100% for Criterion A Sensitivity 100% Specificity 85% for Criterion B Sensitivity 85% Specificity 100% for Criterion C |
| Zhang et al. [74] | V4/V8 index: (RPVCV4/RPVCV8)/(RSRV4/RSRV8) > 2.28 predicts LVOT origin | Sensitivity 67% Specificity 96% |
| Cheng et al. [75] | RPVCV3R/RPVCV7 ≥ 0.85 predicts LVOT | Sensitivity 87% Specificity 96% |
11.3. Artificial-Intelligence-Derived Algorithms (Table 5 and Table 6)
11.3.1. Gradient Boosting Method
11.3.2. Visualization Deep Learning Model
11.3.3. Decision Tree Analysis
| Author | Year Published | Site Differentiation | Patients Included | Study Methodology | Electroanatomical Mapping | Inclusion Criteria |
|---|---|---|---|---|---|---|
| Zheng et al. [76] | 2021 | RVOT vs. LVOT | 420 | Training cohort: 340 patients Validation cohort: 38 patients Testing cohort: 42 patients | Yes | PVC or VT burden > 10% of total test duration |
| Nakasone et al. [77] | 2022 | RVOT vs. LVOT | 80 | Retrospective | Yes | NR |
| Shimojo et al. [79] | 2023 | RVOT vs. LVOT | 104 | Retrospective Training cohort: 72 patients Testing cohort: 32 patients | Yes | Precordial transition in lead V3 Left bundle branch block pattern Inferior axis QRS morphology |
| Author | Algorithm | Diagnostic Measures |
|---|---|---|
| Zheng et al. [76] | Extreme gradient boosting tree model, applied to automatically extracted ECG features | Sensitivity 96.97% Specificity 100% |
| Nakasone et al. [77] | Deep learning model, gradient—weighted class activation mapping method | Sensitivity 95.2% Positive Predictive Value 92.0% |
| Shimojo et al. [79] | Decision tree with maximum depth of three | Sensitivity 100% Positive Predictive Value 91.5% |
12. Disadvantages of ECG Prediction Algorithms
13. Management of Idiopathic PVCs
14. Conclusions
Author Contributions
Funding
Institutional Review Board Statement
Informed Consent Statement
Data Availability Statement
Conflicts of Interest
References
- Sirichand, S.; Killu, A.M.; Padmanabhan, D.; Hodge, D.O.; Chamberlain, A.M.; Brady, P.A.; Kapa, S.; Noseworthy, P.A.; Packer, D.L.; Munger, T.M.; et al. Incidence of Idiopathic Ventricular Arrhythmias: A Population-Based Study. Circ. Arrhythm. Electrophysiol. 2017, 10, e004662. [Google Scholar] [CrossRef] [PubMed]
- Hiss, R.G.; Lamb, L.E. Electrocardiographic findings in 122,043 individuals. Circulation 1962, 25, 947–961. [Google Scholar] [CrossRef]
- Simpson, R.J., Jr.; Cascio, W.E.; Schreiner, P.J.; Crow, R.S.; Rautaharju, P.M.; Heiss, G. Prevalence of premature ventricular contractions in a population of African American and white men and women: The Atherosclerosis Risk in Communities (ARIC) study. Am. Heart J. 2002, 143, 535–540. [Google Scholar] [CrossRef]
- Von Rotz, M.; Aeschbacher, S.; Bossard, M.; Schoen, T.; Blum, S.; Schneider, S.; Estis, J.; Todd, J.; Risch, M.; Risch, L.; et al. Risk factors for premature ventricular contractions in young and healthy adults. Heart 2017, 103, 702–707. [Google Scholar] [CrossRef] [PubMed]
- Kerola, T.; Dewland, T.A.; Vittinghoff, E.; Heckbert, S.R.; Stein, P.K.; Marcus, G.M. Modifiable Predictors of Ventricular Ectopy in the Community. J. Am. Heart Assoc. 2018, 7, e010078. [Google Scholar] [CrossRef] [PubMed]
- Lee, A.; Denman, R.; Haqqani, H.M. Ventricular Ectopy in the Context of Left Ventricular Systolic Dysfunction: Risk Factors and Outcomes Following Catheter Ablation. Heart Lung Circ. 2019, 28, 379–388. [Google Scholar] [CrossRef]
- Voskoboinik, A.; Hadjis, A.; Alhede, C.; Im, S.I.; Park, H.; Moss, J.; Marcus, G.M.; Hsia, H.; Lee, B.; Tseng, Z.; et al. Predictors of adverse outcome in patients with frequent premature ventricular complexes: The ABC-VT risk score. Heart Rhythm 2020, 17, 1066–1074. [Google Scholar] [CrossRef]
- Gaita, F.; Giustetto, C.; Di Donna, P.; Richiardi, E.; Libero, L.; Brusin, M.C.; Molinari, G.; Trevi, G. Long-term follow-up of right ventricular monomorphic extrasystoles. J. Am. Coll. Cardiol. 2001, 38, 364–370. [Google Scholar] [CrossRef]
- Tsuji, A.; Nagashima, M.; Hasegawa, S.; Nagai, N.; Nishibata, K.; Goto, M.; Matsushima, M. Long-term follow-up of idiopathic ventricular arrhythmias in otherwise normal children. Jpn. Circ. J. 1995, 59, 654–662. [Google Scholar] [CrossRef]
- Lee, A.K.Y.; Andrade, J.; Hawkins, N.M.; Alexander, G.; Bennett, M.T.; Chakrabarti, S.; Laksman, Z.W.; Krahn, A.; Yeung-Lai-Wah, J.A.; Deyell, M.W. Outcomes of untreated frequent premature ventricular complexes with normal left ventricular function. Heart 2019, 105, 1408–1413. [Google Scholar] [CrossRef]
- Gatzoulis, K.A.; Archontakis, S.; Vlasseros, I.; Tsiachris, D.; Vouliotis, A.; Arsenos, P.; Dilaveris, P.; Sideris, S.; Karystinos, G.; Skiadas, I.; et al. Complex right ventricular outflow tract ectopy in the absence of organic heart disease. Results of a long-term prospective observational study. Int. J. Cardiol. 2014, 172, e351–e353. [Google Scholar] [CrossRef] [PubMed]
- Niwano, S.; Wakisaka, Y.; Niwano, H.; Fukaya, H.; Kurokawa, S.; Kiryu, M.; Hatakeyama, Y.; Izumi, T. Prognostic significance of frequent premature ventricular contractions originating from the ventricular outflow tract in patients with normal left ventricular function. Heart 2009, 95, 1230–1237. [Google Scholar] [CrossRef] [PubMed]
- Mukharji, J.; Rude, R.E.; Poole, W.K.; Gustafson, N.; Thomas, L.J., Jr.; Strauss, W.; Jaffe, A.S.; Muller, J.E.; Roberts, R.; Raabe, D.S., Jr.; et al. Risk factors for sudden death after acute myocardial infarction: Two-year follow-up. Am. J. Cardiol. 1984, 54, 31–36. [Google Scholar] [CrossRef] [PubMed]
- Bigger, J.T., Jr.; Fleiss, J.L.; Kleiger, R.; Miller, J.P.; Rolnitzky, L.M. The relationships among ventricular arrhythmias, left ventricular dysfunction, and mortality in the 2 years after myocardial infarction. Circulation 1984, 69, 250–258. [Google Scholar] [CrossRef]
- Moss, A.J.; Davis, H.T.; DeCamilla, J.; Bayer, L.W. Ventricular ectopic beats and their relation to sudden and nonsudden cardiac death after myocardial infarction. Circulation 1979, 60, 998–1003. [Google Scholar] [CrossRef]
- Cardiac Arrhythmia Suppression Trial (CAST) Investigators. Preliminary report: Effect of encainide and flecainide on mortality in a randomized trial of arrhythmia suppression after myocardial infarction. N. Engl. J. Med. 1989, 321, 406–412. [Google Scholar] [CrossRef]
- Boas, R.; Thune, J.J.; Pehrson, S.; Kober, L.; Nielsen, J.C.; Videbaek, L.; Haarbo, J.; Korup, E.; Bruun, N.E.; Brandes, A.; et al. Prevalence and prognostic association of ventricular arrhythmia in non-ischaemic heart failure patients: Results from the DANISH trial. Europace 2021, 23, 587–595. [Google Scholar] [CrossRef]
- Kennedy, H.L.; Whitlock, J.A.; Sprague, M.K.; Kennedy, L.J.; Buckingham, T.A.; Goldberg, R.J. Long-term follow-up of asymptomatic healthy subjects with frequent and complex ventricular ectopy. N. Engl. J. Med. 1985, 312, 193–197. [Google Scholar] [CrossRef]
- Lee, V.; Hemingway, H.; Harb, R.; Crake, T.; Lambiase, P. The prognostic significance of premature ventricular complexes in adults without clinically apparent heart disease: A meta-analysis and systematic review. Heart 2012, 98, 1290–1298. [Google Scholar] [CrossRef]
- Dukes, J.W.; Dewland, T.A.; Vittinghoff, E.; Mandyam, M.C.; Heckbert, S.R.; Siscovick, D.S.; Stein, P.K.; Psaty, B.M.; Sotoodehnia, N.; Gottdiener, J.S.; et al. Ventricular Ectopy as a Predictor of Heart Failure and Death. J. Am. Coll. Cardiol. 2015, 66, 101–109. [Google Scholar] [CrossRef]
- Muser, D.; Santangeli, P.; Castro, S.A.; Casado Arroyo, R.; Maeda, S.; Benhayon, D.A.; Liuba, I.; Liang, J.J.; Sadek, M.M.; Chahal, A.; et al. Risk Stratification of Patients with Apparently Idiopathic Premature Ventricular Contractions: A Multicenter International CMR Registry. JACC Clin. Electrophysiol. 2020, 6, 722–735. [Google Scholar] [CrossRef] [PubMed]
- Andreini, D.; Dello Russo, A.; Pontone, G.; Mushtaq, S.; Conte, E.; Perchinunno, M.; Guglielmo, M.; Santos, A.C.; Magatelli, M.; Baggiano, A.; et al. CMR for Identifying the Substrate of Ventricular Arrhythmia in Patients with Normal Echocardiography. JACC Cardiovasc. Imaging 2020, 13 Pt 1, 410–421. [Google Scholar] [CrossRef] [PubMed]
- Gatzoulis, K.A.; Archontakis, S.; Dilaveris, P.; Tsiachris, D.; Arsenos, P.; Sideris, S.; Stefanadis, C. Ventricular arrhythmias: From the electrophysiology laboratory to clinical practice. Part II: Potentially malignant and benign ventricular arrhythmias. Hell. J. Cardiol. 2012, 53, 217–233. [Google Scholar]
- Gatzoulis, K.A.; Archontakis, S.; Dilaveris, P.; Tsiachris, D.; Arsenos, P.; Sideris, S.; Stefanadis, C. Ventricular arrhythmias: From the electrophysiology laboratory to clinical practice. Part I: Malignant ventricular arrhythmias. Hell. J. Cardiol. 2011, 52, 525–535. [Google Scholar]
- Yamada, T.; Kay, G.N. Anatomical Consideration in Catheter Ablation of Idiopathic Ventricular Arrhythmias. Arrhythm. Electrophysiol. Rev. 2016, 5, 203–209. [Google Scholar] [CrossRef]
- Yamada, T.; Litovsky, S.H.; Kay, G.N. The left ventricular ostium: An anatomic concept relevant to idiopathic ventricular arrhythmias. Circ. Arrhythm. Electrophysiol. 2008, 1, 396–404. [Google Scholar] [CrossRef]
- Zeppenfeld, K.; Tfelt-Hansen, J.; de Riva, M.; Winkel, B.G.; Behr, E.R.; Blom, N.A.; Charron, P.; Corrado, D.; Dagres, N.; de Chillou, C.; et al. 2022 ESC Guidelines for the management of patients with ventricular arrhythmias and the prevention of sudden cardiac death. Eur. Heart J. 2022, 43, 3997–4126. [Google Scholar] [CrossRef]
- Roca-Luque, I.; Mont, L. Frequent premature ventricular complexes and normal ejection fraction: To treat or not to treat? Heart 2019, 105, 1386–1387. [Google Scholar] [CrossRef]
- Baman, T.S.; Lange, D.C.; Ilg, K.J.; Gupta, S.K.; Liu, T.Y.; Alguire, C.; Armstrong, W.; Good, E.; Chugh, A.; Jongnarangsin, K.; et al. Relationship between burden of premature ventricular complexes and left ventricular function. Heart Rhythm 2010, 7, 865–869. [Google Scholar] [CrossRef]
- Ban, J.E.; Park, H.C.; Park, J.S.; Nagamoto, Y.; Choi, J.I.; Lim, H.E.; Park, S.W.; Kim, Y.H. Electrocardiographic and electrophysiological characteristics of premature ventricular complexes associated with left ventricular dysfunction in patients without structural heart disease. Europace 2013, 15, 735–741. [Google Scholar] [CrossRef]
- Hasdemir, C.; Ulucan, C.; Yavuzgil, O.; Yuksel, A.; Kartal, Y.; Simsek, E.; Musayev, O.; Kayikcioglu, M.; Payzin, S.; Kultursay, H.; et al. Tachycardia-induced cardiomyopathy in patients with idiopathic ventricular arrhythmias: The incidence, clinical and electrophysiologic characteristics, and the predictors. J. Cardiovasc. Electrophysiol. 2011, 22, 663–668. [Google Scholar] [CrossRef] [PubMed]
- Yokokawa, M.; Kim, H.M.; Good, E.; Crawford, T.; Chugh, A.; Pelosi, F., Jr.; Jongnarangsin, K.; Latchamsetty, R.; Armstrong, W.; Alguire, C.; et al. Impact of QRS duration of frequent premature ventricular complexes on the development of cardiomyopathy. Heart Rhythm 2012, 9, 1460–1464. [Google Scholar] [CrossRef] [PubMed]
- Yokokawa, M.; Kim, H.M.; Good, E.; Chugh, A.; Pelosi, F., Jr.; Alguire, C.; Armstrong, W.; Crawford, T.; Jongnarangsin, K.; Oral, H.; et al. Relation of symptoms and symptom duration to premature ventricular complex-induced cardiomyopathy. Heart Rhythm 2012, 9, 92–95. [Google Scholar] [CrossRef] [PubMed]
- Olgun, H.; Yokokawa, M.; Baman, T.; Kim, H.M.; Armstrong, W.; Good, E.; Chugh, A.; Pelosi, F., Jr.; Crawford, T.; Oral, H.; et al. The role of interpolation in PVC-induced cardiomyopathy. Heart Rhythm 2011, 8, 1046–1049. [Google Scholar] [CrossRef] [PubMed]
- Latchamsetty, R.; Yokokawa, M.; Morady, F.; Kim, H.M.; Mathew, S.; Tilz, R.; Kuck, K.H.; Nagashima, K.; Tedrow, U.; Stevenson, W.G.; et al. Multicenter Outcomes for Catheter Ablation of Idiopathic Premature Ventricular Complexes. JACC Clin. Electrophysiol. 2015, 1, 116–123. [Google Scholar] [CrossRef]
- Penela, D.; Van Huls Van Taxis, C.; Aguinaga, L.; Fernandez-Armenta, J.; Mont, L.; Castel, M.A.; Heras, M.; Tolosana, J.M.; Sitges, M.; Ordóñez, A.; et al. Neurohormonal, structural, and functional recovery pattern after premature ventricular complex ablation is independent of structural heart disease status in patients with depressed left ventricular ejection fraction: A prospective multicenter study. J. Am. Coll. Cardiol. 2013, 62, 1195–1202. [Google Scholar] [CrossRef]
- Penela, D.; Jauregui, B.; Fernandez-Armenta, J.; Aguinaga, L.; Tercedor, L.; Ordonez, A.; Acosta, J.; Bisbal, P.; Vassanelli, F.; Teres, C.; et al. Influence of baseline QRS on the left ventricular ejection fraction recovery after frequent premature ventricular complex ablation. Europace 2020, 22, 274–280. [Google Scholar] [CrossRef]
- Cronin, E.M.; Bogun, F.M.; Maury, P.; Peichl, P.; Chen, M.; Namboodiri, N.; Aguinaga, L.; Leite, L.R.; Al-Khatib, S.M.; Anter, E.; et al. 2019 HRS/EHRA/APHRS/LAHRS expert consensus statement on catheter ablation of ventricular arrhythmias. Europace 2019, 21, 1143–1144. [Google Scholar] [CrossRef]
- Srivathsan, K.; Lester, S.J.; Appleton, C.P.; Scott, L.R.; Munger, T.M. Ventricular tachycardia in the absence of structural heart disease. Indian Pacing Electrophysiol. J. 2005, 5, 106–121. [Google Scholar]
- Ouyang, F.; Mathew, S.; Wu, S.; Kamioka, M.; Metzner, A.; Xue, Y.; Ju, W.; Yang, B.; Zhan, X.; Riling, A.; et al. Ventricular arrhythmias arising from the left ventricular outflow tract below the aortic sinus cusps: Mapping and catheter ablation via transseptal approach and electrocardiographic characteristics. Circ. Arrhythm. Electrophysiol. 2014, 7, 445–455. [Google Scholar] [CrossRef]
- Asirvatham, S.J. Correlative anatomy for the invasive electrophysiologist: Outflow tract and supravalvar arrhythmia. J. Cardiovasc. Electrophysiol. 2009, 20, 955–968. [Google Scholar] [CrossRef] [PubMed]
- Dixit, S.; Gerstenfeld, E.P.; Callans, D.J.; Marchlinski, F.E. Electrocardiographic patterns of superior right ventricular outflow tract tachycardias: Distinguishing septal and free-wall sites of origin. J. Cardiovasc. Electrophysiol. 2003, 14, 1–7. [Google Scholar] [CrossRef] [PubMed]
- Jadonath, R.L.; Schwartzman, D.S.; Preminger, M.W.; Gottlieb, C.D.; Marchlinski, F.E. Utility of the 12-lead electrocardiogram in localizing the origin of right ventricular outflow tract tachycardia. Am. Heart J. 1995, 130, 1107–1113. [Google Scholar] [CrossRef] [PubMed]
- Hasdemir, C.; Aktas, S.; Govsa, F.; Aktas, E.O.; Kogak, A.; Bozkaya, Y.T.; Demirbas, M.I.; Ulucan, G.; Ozdogan, O.; Kayikcioglu, M.; et al. Demonstration of ventricular myocardial extensions into the pulmonary artery and aorta beyond the ventriculo-arterial junction. Pacing Clin. Electrophysiol. 2007, 30, 534–539. [Google Scholar] [CrossRef]
- Tada, H.; Tadokoro, K.; Miyaji, K.; Ito, S.; Kurosaki, K.; Kaseno, K.; Naito, S.; Nogami, A.; Oshima, S.; Taniguchi, K. Idiopathic ventricular arrhythmias arising from the pulmonary artery: Prevalence, characteristics, and topography of the arrhythmia origin. Heart Rhythm 2008, 5, 419–426. [Google Scholar] [CrossRef]
- Sekiguchi, Y.; Aonuma, K.; Takahashi, A.; Yamauchi, Y.; Hachiya, H.; Yokoyama, Y.; Iesaka, Y.; Isobe, M. Electrocardiographic and electrophysiologic characteristics of ventricular tachycardia originating within the pulmonary artery. J. Am. Coll. Cardiol. 2005, 45, 887–895. [Google Scholar] [CrossRef]
- Liao, Z.; Zhan, X.; Wu, S.; Xue, Y.; Fang, X.; Liao, H.; Deng, H.; Liang, Y.; Wei, W.; Liu, Y.; et al. Idiopathic Ventricular Arrhythmias Originating from the Pulmonary Sinus Cusp: Prevalence, Electrocardiographic/Electrophysiological Characteristics, and Catheter Ablation. J. Am. Coll. Cardiol. 2015, 66, 2633–2644. [Google Scholar] [CrossRef]
- Iwai, S.; Cantillon, D.J.; Kim, R.J.; Markowitz, S.M.; Mittal, S.; Stein, K.M.; Shah, B.K.; Yarlagadda, R.K.; Cheung, J.W.; Tan, V.R.; et al. Right and left ventricular outflow tract tachycardias: Evidence for a common electrophysiologic mechanism. J. Cardiovasc. Electrophysiol. 2006, 17, 1052–1058. [Google Scholar] [CrossRef]
- Cheung, J.W.; Anderson, R.H.; Markowitz, S.M.; Lerman, B.B. Catheter Ablation of Arrhythmias Originating from the Left Ventricular Outflow Tract. JACC Clin. Electrophysiol. 2019, 5, 1–12. [Google Scholar] [CrossRef]
- Anderson, R.H. Clinical anatomy of the aortic root. Heart 2000, 84, 670–673. [Google Scholar] [CrossRef]
- Lin, D.; Ilkhanoff, L.; Gerstenfeld, E.; Dixit, S.; Beldner, S.; Bala, R.; Garcia, F.; Callans, D.; Marchlinski, F.E. Twelve-lead electrocardiographic characteristics of the aortic cusp region guided by intracardiac echocardiography and electroanatomic mapping. Heart Rhythm 2008, 5, 663–669. [Google Scholar] [CrossRef] [PubMed]
- Kumagai, K. Idiopathic ventricular arrhythmias arising from the left ventricular outflow tract: Tips and tricks. J. Arrhythmia 2014, 30, 211–221. [Google Scholar] [CrossRef]
- Bala, R.; Garcia, F.C.; Hutchinson, M.D.; Gerstenfeld, E.P.; Dhruvakumar, S.; Dixit, S.; Cooper, J.M.; Lin, D.; Harding, J.; Riley, M.P.; et al. Electrocardiographic and electrophysiologic features of ventricular arrhythmias originating from the right/left coronary cusp commissure. Heart Rhythm 2010, 7, 312–322. [Google Scholar] [CrossRef]
- Yamada, T.; Yoshida, N.; Murakami, Y.; Okada, T.; Muto, M.; Murohara, T.; McElderry, H.T.; Kay, G.N. Electrocardiographic characteristics of ventricular arrhythmias originating from the junction of the left and right coronary sinuses of Valsalva in the aorta: The activation pattern as a rationale for the electrocardiographic characteristics. Heart Rhythm 2008, 5, 184–192. [Google Scholar] [CrossRef] [PubMed]
- McAlpine, W. Heart and Coronary Arteries; Springer-Verlag: Berlin/Heidelberg, Germany; New York, NY, USA, 1975; pp. 27–30. [Google Scholar]
- Yamada, T.; McElderry, H.T.; Doppalapudi, H.; Okada, T.; Murakami, Y.; Yoshida, Y.; Yoshida, N.; Inden, Y.; Murohara, T.; Plumb, V.J.; et al. Idiopathic ventricular arrhythmias originating from the left ventricular summit: Anatomic concepts relevant to ablation. Circ. Arrhythm. Electrophysiol. 2010, 3, 616–623. [Google Scholar] [CrossRef]
- Baman, T.S.; Ilg, K.J.; Gupta, S.K.; Good, E.; Chugh, A.; Jongnarangsin, K.; Pelosi, F., Jr.; Ebinger, M.; Crawford, T.; Oral, H.; et al. Mapping and ablation of epicardial idiopathic ventricular arrhythmias from within the coronary venous system. Circ. Arrhythm. Electrophysiol. 2010, 3, 274–279. [Google Scholar] [CrossRef]
- Hayashi, T.; Santangeli, P.; Pathak, R.K.; Muser, D.; Liang, J.J.; Castro, S.A.; Garcia, F.C.; Hutchinson, M.D.; Supple, G.E.; Frankel, D.S.; et al. Outcomes of Catheter Ablation of Idiopathic Outflow Tract Ventricular Arrhythmias with an R Wave Pattern Break in Lead V2: A Distinct Clinical Entity. J. Cardiovasc. Electrophysiol. 2017, 28, 504–514. [Google Scholar] [CrossRef]
- Yang, Y.; Saenz, L.C.; Varosy, P.D.; Badhwar, N.; Tan, J.H.; Kilicaslan, F.; Keung, E.C.; Natale, A.; Marrouche, N.F.; Scheinman, M.M. Using the initial vector from surface electrocardiogram to distinguish the site of outflow tract tachycardia. Pacing Clin. Electrophysiol. 2007, 30, 891–898. [Google Scholar] [CrossRef]
- Zhang, F.; Chen, M.; Yang, B.; Ju, W.; Chen, H.; Yu, J.; Lau, C.P.; Cao, K.; Tse, H.F. Electrocardiographic algorithm to identify the optimal target ablation site for idiopathic right ventricular outflow tract ventricular premature contraction. Europace 2009, 11, 1214–1220. [Google Scholar] [CrossRef]
- Betensky, B.P.; Park, R.E.; Marchlinski, F.E.; Hutchinson, M.D.; Garcia, F.C.; Dixit, S.; Callans, D.J.; Cooper, J.; Bala, R.; Lin, D.; et al. The V(2) transition ratio: A new electrocardiographic criterion for distinguishing left from right ventricular outflow tract tachycardia origin. J. Am. Coll. Cardiol. 2011, 57, 2255–2262. [Google Scholar] [CrossRef]
- Yoshida, N.; Inden, Y.; Uchikawa, T.; Kamiya, H.; Kitamura, K.; Shimano, M.; Tsuji, Y.; Hirai, M.; Murohara, T. Novel transitional zone index allows more accurate differentiation between idiopathic right ventricular outflow tract and aortic sinus cusp ventricular arrhythmias. Heart Rhythm 2011, 8, 349–356. [Google Scholar] [CrossRef] [PubMed]
- Cheng, Z.; Cheng, K.; Deng, H.; Chen, T.; Gao, P.; Zhu, K.; Fang, Q. The R-wave deflection interval in lead V3 combining with R-wave amplitude index in lead V1: A new surface ECG algorithm for distinguishing left from right ventricular outflow tract tachycardia origin in patients with transitional lead at V3. Int. J. Cardiol. 2013, 168, 1342–1348. [Google Scholar] [CrossRef] [PubMed]
- Yoshida, N.; Yamada, T.; McElderry, H.T.; Inden, Y.; Shimano, M.; Murohara, T.; Kumar, V.; Doppalapudi, H.; Plumb, V.J.; Kay, G.N. A novel electrocardiographic criterion for differentiating a left from right ventricular outflow tract tachycardia origin: The V2S/V3R index. J. Cardiovasc. Electrophysiol. 2014, 25, 747–753. [Google Scholar] [CrossRef] [PubMed]
- Kaypakli, O.; Koca, H.; Sahin, D.Y.; Karatas, F.; Ozbicer, S.; Koc, M. S-R difference in V1-V2 is a novel criterion for differentiating the left from right ventricular outflow tract arrhythmias. Ann. Noninvasive Electrocardiol. 2018, 23, e12516. [Google Scholar] [CrossRef]
- He, Z.; Liu, M.; Yu, M.; Lu, N.; Li, J.; Xu, T.; Zhu, J.; O’ Gara, M.O.; O’ Meara, M.; Ye, H.; et al. An electrocardiographic diagnostic model for differentiating left from right ventricular outflow tract tachycardia origin. J. Cardiovasc. Electrophysiol. 2018, 29, 908–915. [Google Scholar] [CrossRef]
- Xie, S.; Kubala, M.; Liang, J.J.; Hayashi, T.; Park, J.; Padros, I.L.; Garcia, F.C.; Santangeli, P.; Supple, G.E.; Frankel, D.S.; et al. Lead I R-wave amplitude to differentiate idiopathic ventricular arrhythmias with left bundle branch block right inferior axis originating from the left versus right ventricular outflow tract. J. Cardiovasc. Electrophysiol. 2018, 29, 1515–1522. [Google Scholar] [CrossRef]
- Nikoo, M.H.; Taheri, S.; Attar, A. A novel ECG criterion to differentiate left from right ventricular outflow tract premature complex. Scand. Cardiovasc. J. 2020, 54, 139–145. [Google Scholar] [CrossRef]
- Di, C.; Wan, Z.; Tse, G.; Letsas, K.P.; Liu, T.; Efremidis, M.; Li, J.; Lin, W. The V(1)-V(3) transition index as a novel electrocardiographic criterion for differentiating left from right ventricular outflow tract ventricular arrhythmias. J. Interv. Card. Electrophysiol. 2019, 56, 37–43. [Google Scholar] [CrossRef]
- Efremidis, M.; Vlachos, K.; Kyriakopoulou, M.; Mililis, P.; Martin, C.A.; Bazoukis, G.; Dragasis, S.; Megarisiotou, A.; Unger, P.; Frontera, A.; et al. The RV(1)-V(3) transition ratio: A novel electrocardiographic criterion for the differentiation of right versus left outflow tract premature ventricular complexes. Heart Rhythm O2 2021, 2, 521–528. [Google Scholar] [CrossRef]
- Zhao, L.; Li, R.; Zhang, J.; Xie, R.; Lu, J.; Liu, J.; Miao, C.; Cui, W. The R-S difference index: A new electrocardiographic method for differentiating idiopathic premature ventricular contractions originating from the left and right ventricular outflow tracts presenting a left bundle branch block pattern. Front. Physiol. 2022, 13, 1002926. [Google Scholar] [CrossRef]
- Igarashi, M.; Nogami, A.; Sekiguchi, Y.; Kuroki, K.; Yamasaki, H.; Machino, T.; Yui, Y.; Ogawa, K.; Talib, A.K.; Murakoshi, N.; et al. The QRS morphology pattern in V5R is a novel and simple parameter for differentiating the origin of idiopathic outflow tract ventricular arrhythmias. Europace 2015, 17, 1107–1116. [Google Scholar] [CrossRef] [PubMed]
- Nakano, M.; Ueda, M.; Ishimura, M.; Kajiyama, T.; Hashiguchi, N.; Kanaeda, T.; Kondo, Y.; Hiranuma, Y.; Kobayashi, Y. Estimation of the origin of ventricular outflow tract arrhythmia using synthesized right-sided chest leads. Europace 2014, 16, 1373–1378. [Google Scholar] [CrossRef] [PubMed]
- Zhang, F.; Hamon, D.; Fang, Z.; Xu, Y.; Yang, B.; Ju, W.; Bradfield, J.; Shivkumar, K.; Chen, M.; Tung, R. Value of a Posterior Electrocardiographic Lead for Localization of Ventricular Outflow Tract Arrhythmias: The V(4)/V(8) Ratio. JACC Clin. Electrophysiol. 2017, 3, 678–686. [Google Scholar] [CrossRef] [PubMed]
- Cheng, D.; Ju, W.; Zhu, L.; Chen, K.; Zhang, F.; Chen, H.; Yang, G.; Li, X.; Li, M.; Gu, K.; et al. V(3)R/V(7) Index: A Novel Electrocardiographic Criterion for Differentiating Left from Right Ventricular Outflow Tract Arrhythmias Origins. Circ. Arrhythm. Electrophysiol. 2018, 11, e006243. [Google Scholar] [CrossRef]
- Zheng, J.; Fu, G.; Abudayyeh, I.; Yacoub, M.; Chang, A.; Feaster, W.W.; Ehwerhemuepha, L.; El-Askary, H.; Du, X.; He, B.; et al. A High-Precision Machine Learning Algorithm to Classify Left and Right Outflow Tract Ventricular Tachycardia. Front. Physiol. 2021, 12, 641066. [Google Scholar] [CrossRef]
- Nakasone, K.; Nishimori, M.; Kiuchi, K.; Shinohara, M.; Fukuzawa, K.; Takami, M.; El Hamriti, M.; Sommer, P.; Sakai, J.; Nakamura, H.; et al. Development of a Visualization Deep Learning Model for Classifying Origins of Ventricular Arrhythmias. Circ. J. 2022, 86, 1273–1280. [Google Scholar] [CrossRef]
- Somani, S.; Russak, A.J.; Richter, F.; Zhao, S.; Vaid, A.; Chaudhry, F.; De Freitas, J.K.; Naik, N.; Miotto, R.; Nadkarni, G.N.; et al. Deep learning and the electrocardiogram: Review of the current state-of-the-art. Europace 2021, 23, 1179–1191. [Google Scholar] [CrossRef]
- Shimojo, M.; Inden, Y.; Yanagisawa, S.; Suzuki, N.; Tsurumi, N.; Watanabe, R.; Nakagomi, T.; Okajima, T.; Suga, K.; Tsuji, Y.; et al. A novel practical algorithm using machine learning to differentiate outflow tract ventricular arrhythmia origins. J. Cardiovasc. Electrophysiol. 2023, 34, 627–637. [Google Scholar] [CrossRef]
- Anderson, R.D.; Kumar, S.; Parameswaran, R.; Wong, G.; Voskoboinik, A.; Sugumar, H.; Watts, T.; Sparks, P.B.; Morton, J.B.; McLellan, A.; et al. Differentiating Right- and Left-Sided Outflow Tract Ventricular Arrhythmias: Classical ECG Signatures and Prediction Algorithms. Circ. Arrhythm. Electrophysiol. 2019, 12, e007392. [Google Scholar] [CrossRef]
- Hamon, D.; Swid, M.A.; Rajendran, P.S.; Liu, A.; Boyle, N.G.; Shivkumar, K.; Bradfield, J.S. Premature ventricular contraction diurnal profiles predict distinct clinical characteristics and beta-blocker responses. J. Cardiovasc. Electrophysiol. 2019, 30, 836–843. [Google Scholar] [CrossRef]
- Tang, J.K.K.; Andrade, J.G.; Hawkins, N.M.; Laksman, Z.W.; Krahn, A.D.; Bennett, M.T.; Heilbron, B.; Chakrabarti, S.; Yeung-Lai-Wah, J.A.; Deyell, M.W. Effectiveness of medical therapy for treatment of idiopathic frequent premature ventricular complexes. J. Cardiovasc. Electrophysiol. 2021, 32, 2246–2253. [Google Scholar] [CrossRef] [PubMed]
- Belhassen, B.; Horowitz, L.N. Use of intravenous verapamil for ventricular tachycardia. Am. J. Cardiol. 1984, 54, 1131–1133. [Google Scholar] [CrossRef] [PubMed]
- Hyman, M.C.; Mustin, D.; Supple, G.; Schaller, R.D.; Santangeli, P.; Arkles, J.; Lin, D.; Muser, D.; Dixit, S.; Nazarian, S.; et al. Class IC antiarrhythmic drugs for suspected premature ventricular contraction-induced cardiomyopathy. Heart Rhythm 2018, 15, 159–163. [Google Scholar] [CrossRef] [PubMed]
- Singh, S.N.; Fletcher, R.D.; Fisher, S.G.; Singh, B.N.; Lewis, H.D.; Deedwania, P.C.; Massie, B.M.; Colling, C.; Lazzeri, D. Survival Trial of Antiarrhythmic Therapy in Congestive Heart Failure. N. Engl. J. Med. 1995, 333, 77–82. [Google Scholar] [CrossRef]
- Primeau, R.A.A.; Giorgi, C.; Shenasa, M.; Nadeau, R. Long term efficacy and toxicity of amiodarone in the treatment of refractory cardiac arrhythmias. Can. J. Cardiol. 1989, 5, 98–104. [Google Scholar] [PubMed]
- Ling, Z.; Liu, Z.; Su, L.; Zipunnikov, V.; Wu, J.; Du, H.; Woo, K.; Chen, S.; Zhong, B.; Lan, X.; et al. Radiofrequency ablation versus antiarrhythmic medication for treatment of ventricular premature beats from the right ventricular outflow tract: Prospective randomized study. Circ. Arrhythm. Electrophysiol. 2014, 7, 237–243. [Google Scholar] [CrossRef]
- De Silva, K.; Haqqani, H.; Mahajan, R.; Qian, P.; Chik, W.; Voskoboinik, A.; Kistler, P.M.; Lee, G.; Jackson, N.; Kumar, S. Catheter Ablation vs. Antiarrhythmic Drug Therapy for Treatment of Premature Ventricular Complexes: A Systematic Review. JACC Clin. Electrophysiol. 2023, 9, 873–885. [Google Scholar] [CrossRef]


Disclaimer/Publisher’s Note: The statements, opinions and data contained in all publications are solely those of the individual author(s) and contributor(s) and not of MDPI and/or the editor(s). MDPI and/or the editor(s) disclaim responsibility for any injury to people or property resulting from any ideas, methods, instructions or products referred to in the content. |
© 2023 by the authors. Licensee MDPI, Basel, Switzerland. This article is an open access article distributed under the terms and conditions of the Creative Commons Attribution (CC BY) license (https://creativecommons.org/licenses/by/4.0/).
Share and Cite
Tsiachris, D.; Botis, M.; Doundoulakis, I.; Bartsioka, L.I.; Tsioufis, P.; Kordalis, A.; Antoniou, C.-K.; Tsioufis, K.; Gatzoulis, K.A. Electrocardiographic Characteristics, Identification, and Management of Frequent Premature Ventricular Contractions. Diagnostics 2023, 13, 3094. https://doi.org/10.3390/diagnostics13193094
Tsiachris D, Botis M, Doundoulakis I, Bartsioka LI, Tsioufis P, Kordalis A, Antoniou C-K, Tsioufis K, Gatzoulis KA. Electrocardiographic Characteristics, Identification, and Management of Frequent Premature Ventricular Contractions. Diagnostics. 2023; 13(19):3094. https://doi.org/10.3390/diagnostics13193094
Chicago/Turabian StyleTsiachris, Dimitris, Michail Botis, Ioannis Doundoulakis, Lamprini Iro Bartsioka, Panagiotis Tsioufis, Athanasios Kordalis, Christos-Konstantinos Antoniou, Konstantinos Tsioufis, and Konstantinos A. Gatzoulis. 2023. "Electrocardiographic Characteristics, Identification, and Management of Frequent Premature Ventricular Contractions" Diagnostics 13, no. 19: 3094. https://doi.org/10.3390/diagnostics13193094