
Reseek-Arrhythmia: Empirical Evaluation of ResNet Architecture for Detection of Arrhythmia

 , ,
, ,  , and
, and
Abstract
:1. Introduction
- Proposes Reseek-Arrhythmia model to detect and classify arrhythmia HD.
- Utilizes two different datasets, namely the MIT-BIH and PTB datasets, to evaluate the proposed model.
- Handles unbalanced and noisy data.
- Evaluates the proposed model using various performance metrics, including accuracy, precision, recall, F1-score, and loss.
- Compares the performance of the proposed model with previous studies in the field.
2. Related Work
- (1)
- This study may be used to increase the prediction ability of models that take cardiac abnormalities into account, and it can be used for datasets that are both broad and varied.
- (2)
- Real-time monitoring of cardiac patients is necessary for the development of effective algorithms, the extraction of features, and categorization.
- (3)
- This study employs complex categorization methods. These models complement the MPA algorithm to create meaningful classification outputs with increased accuracy, and they have the potential to improve classification process accuracy.
- (4)
- The findings corroborate previous research. Most existing techniques are slower and less accurate than the MPA-CNN method. MPA with CNN classifier had detection precision levels of 99.31 percent (MIT-BIH), 99.76 percent (EDB), and 99.47 percent (EDB) (INCART).
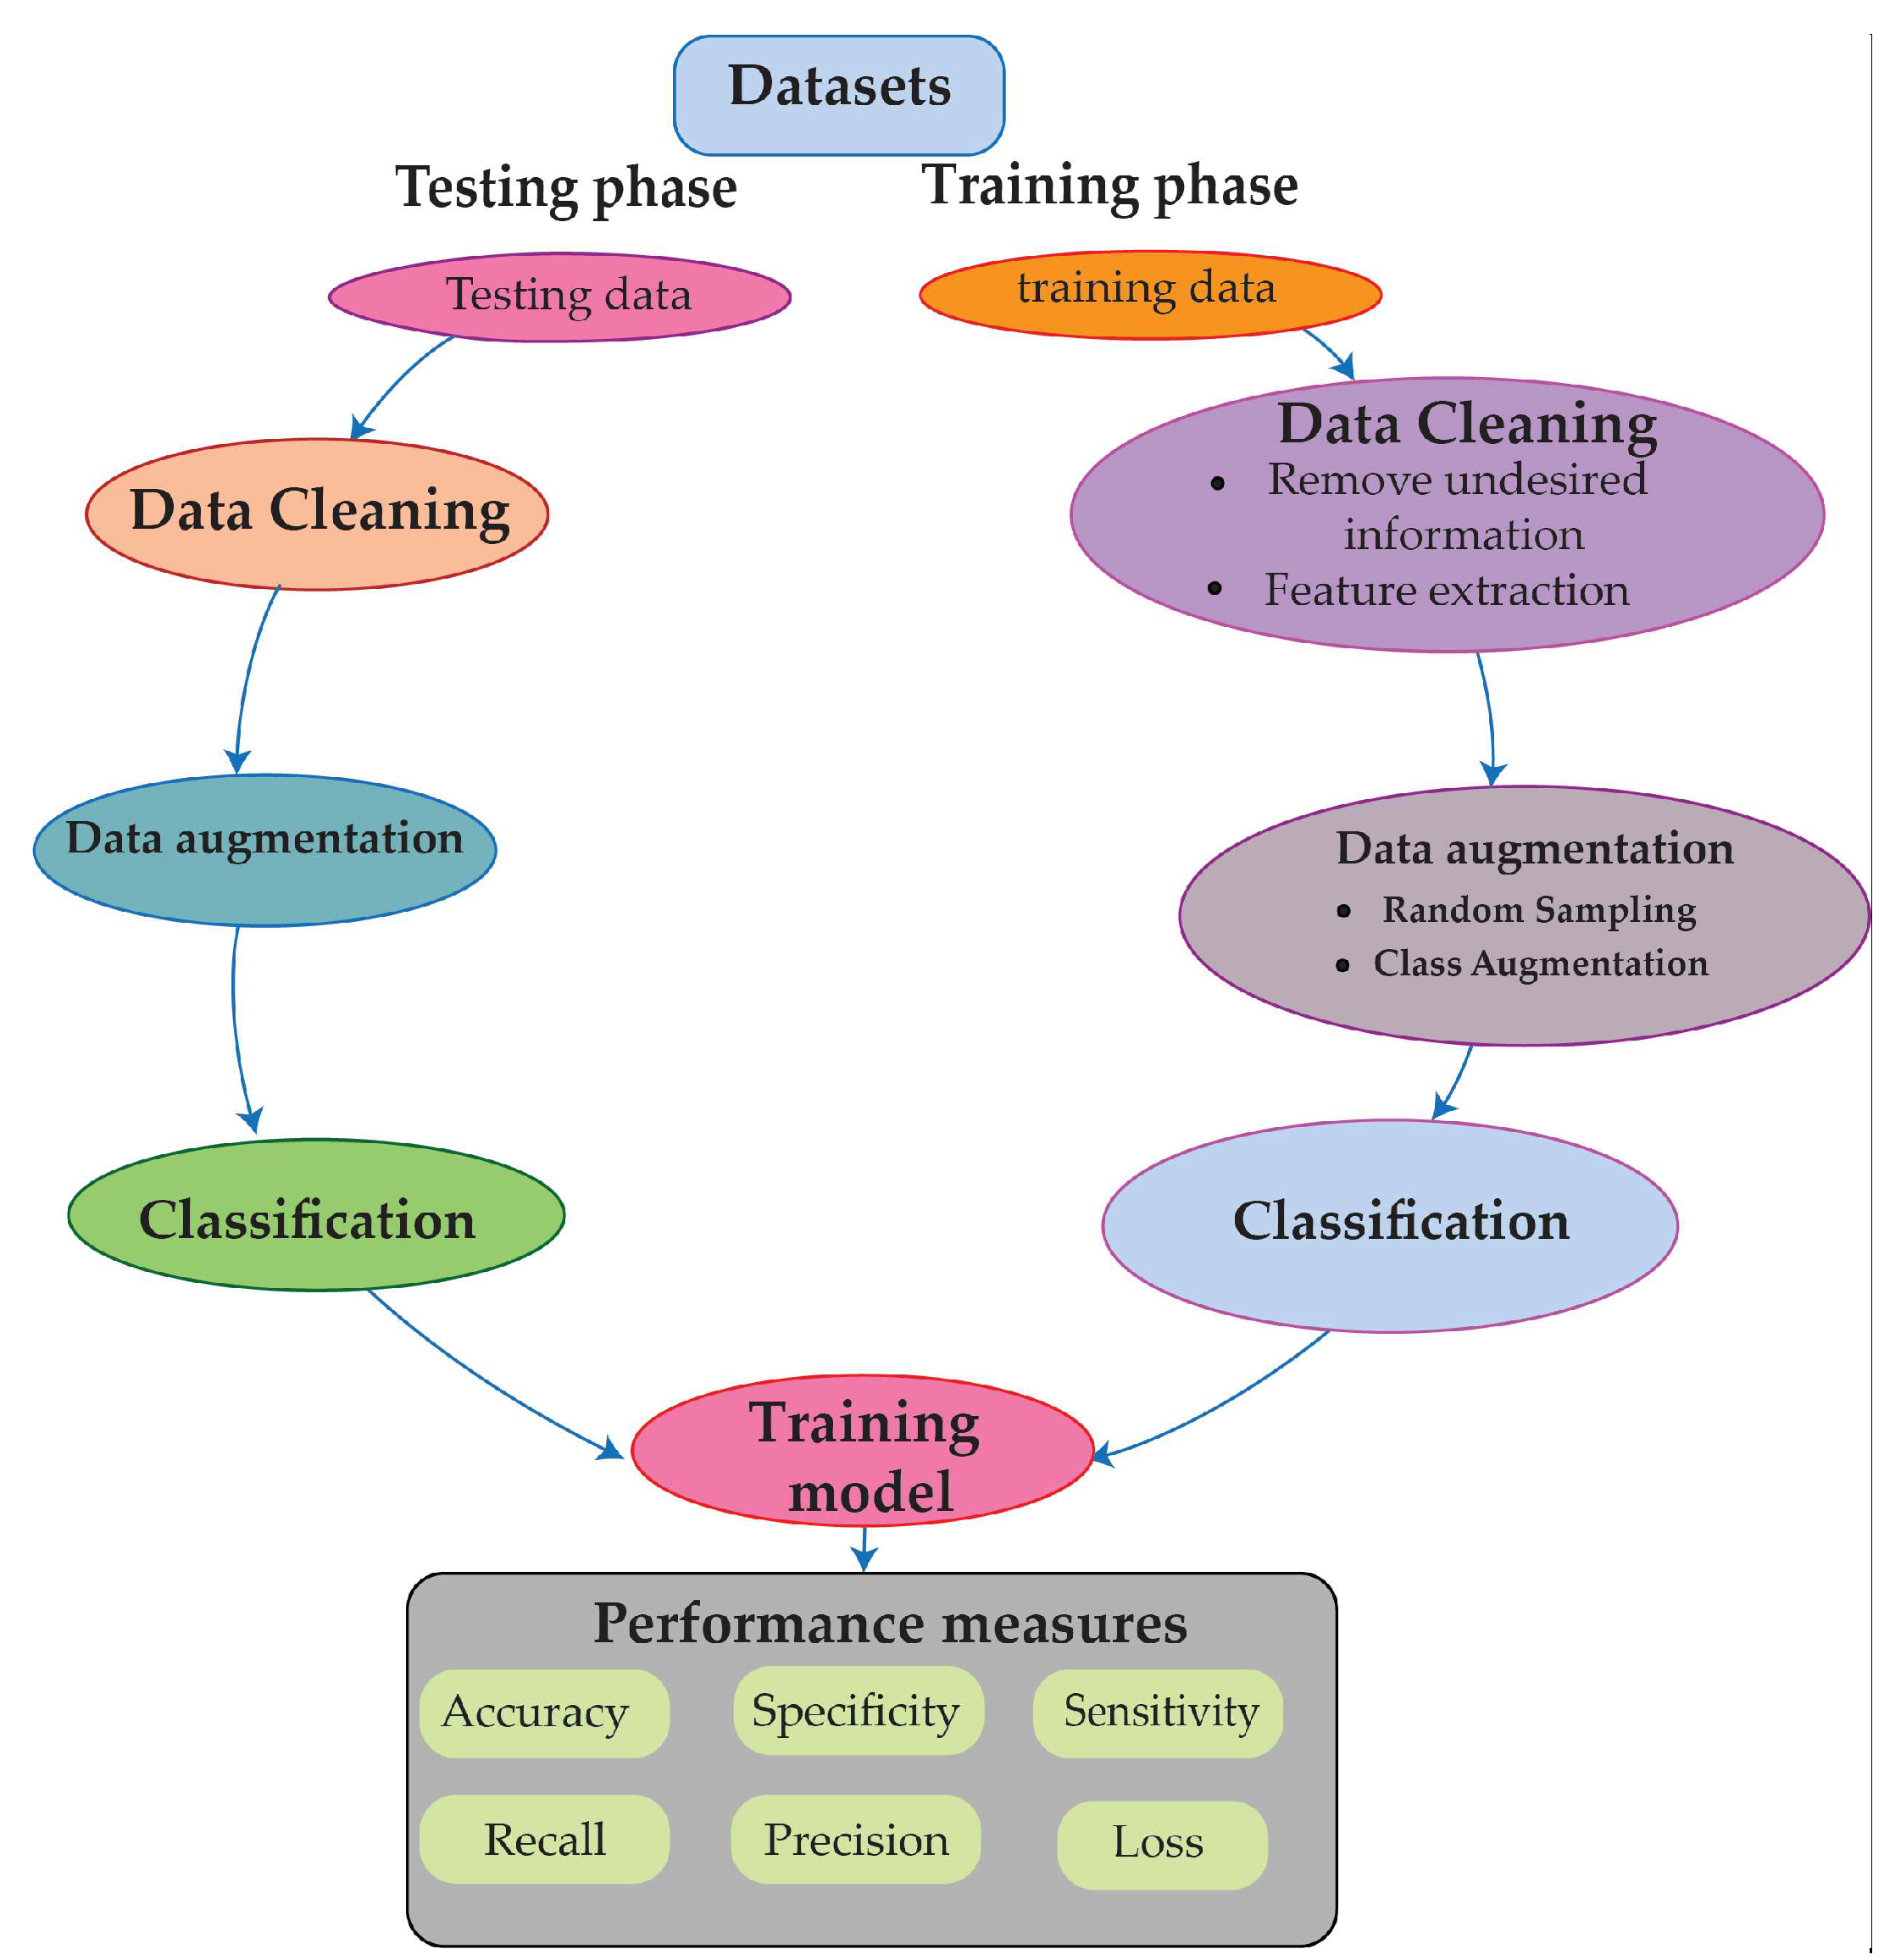
3. Methodology
- i.
- Divide the dataset into two sets: training (70%) and testing (30%).
- ii.
- Apply cleaning techniques.
- iii.
- Apply data augmentation techniques.
- iv.
- Design the proposed Reseek-Arrhythmia model for detecting and classifying heart arrhythmia disease.
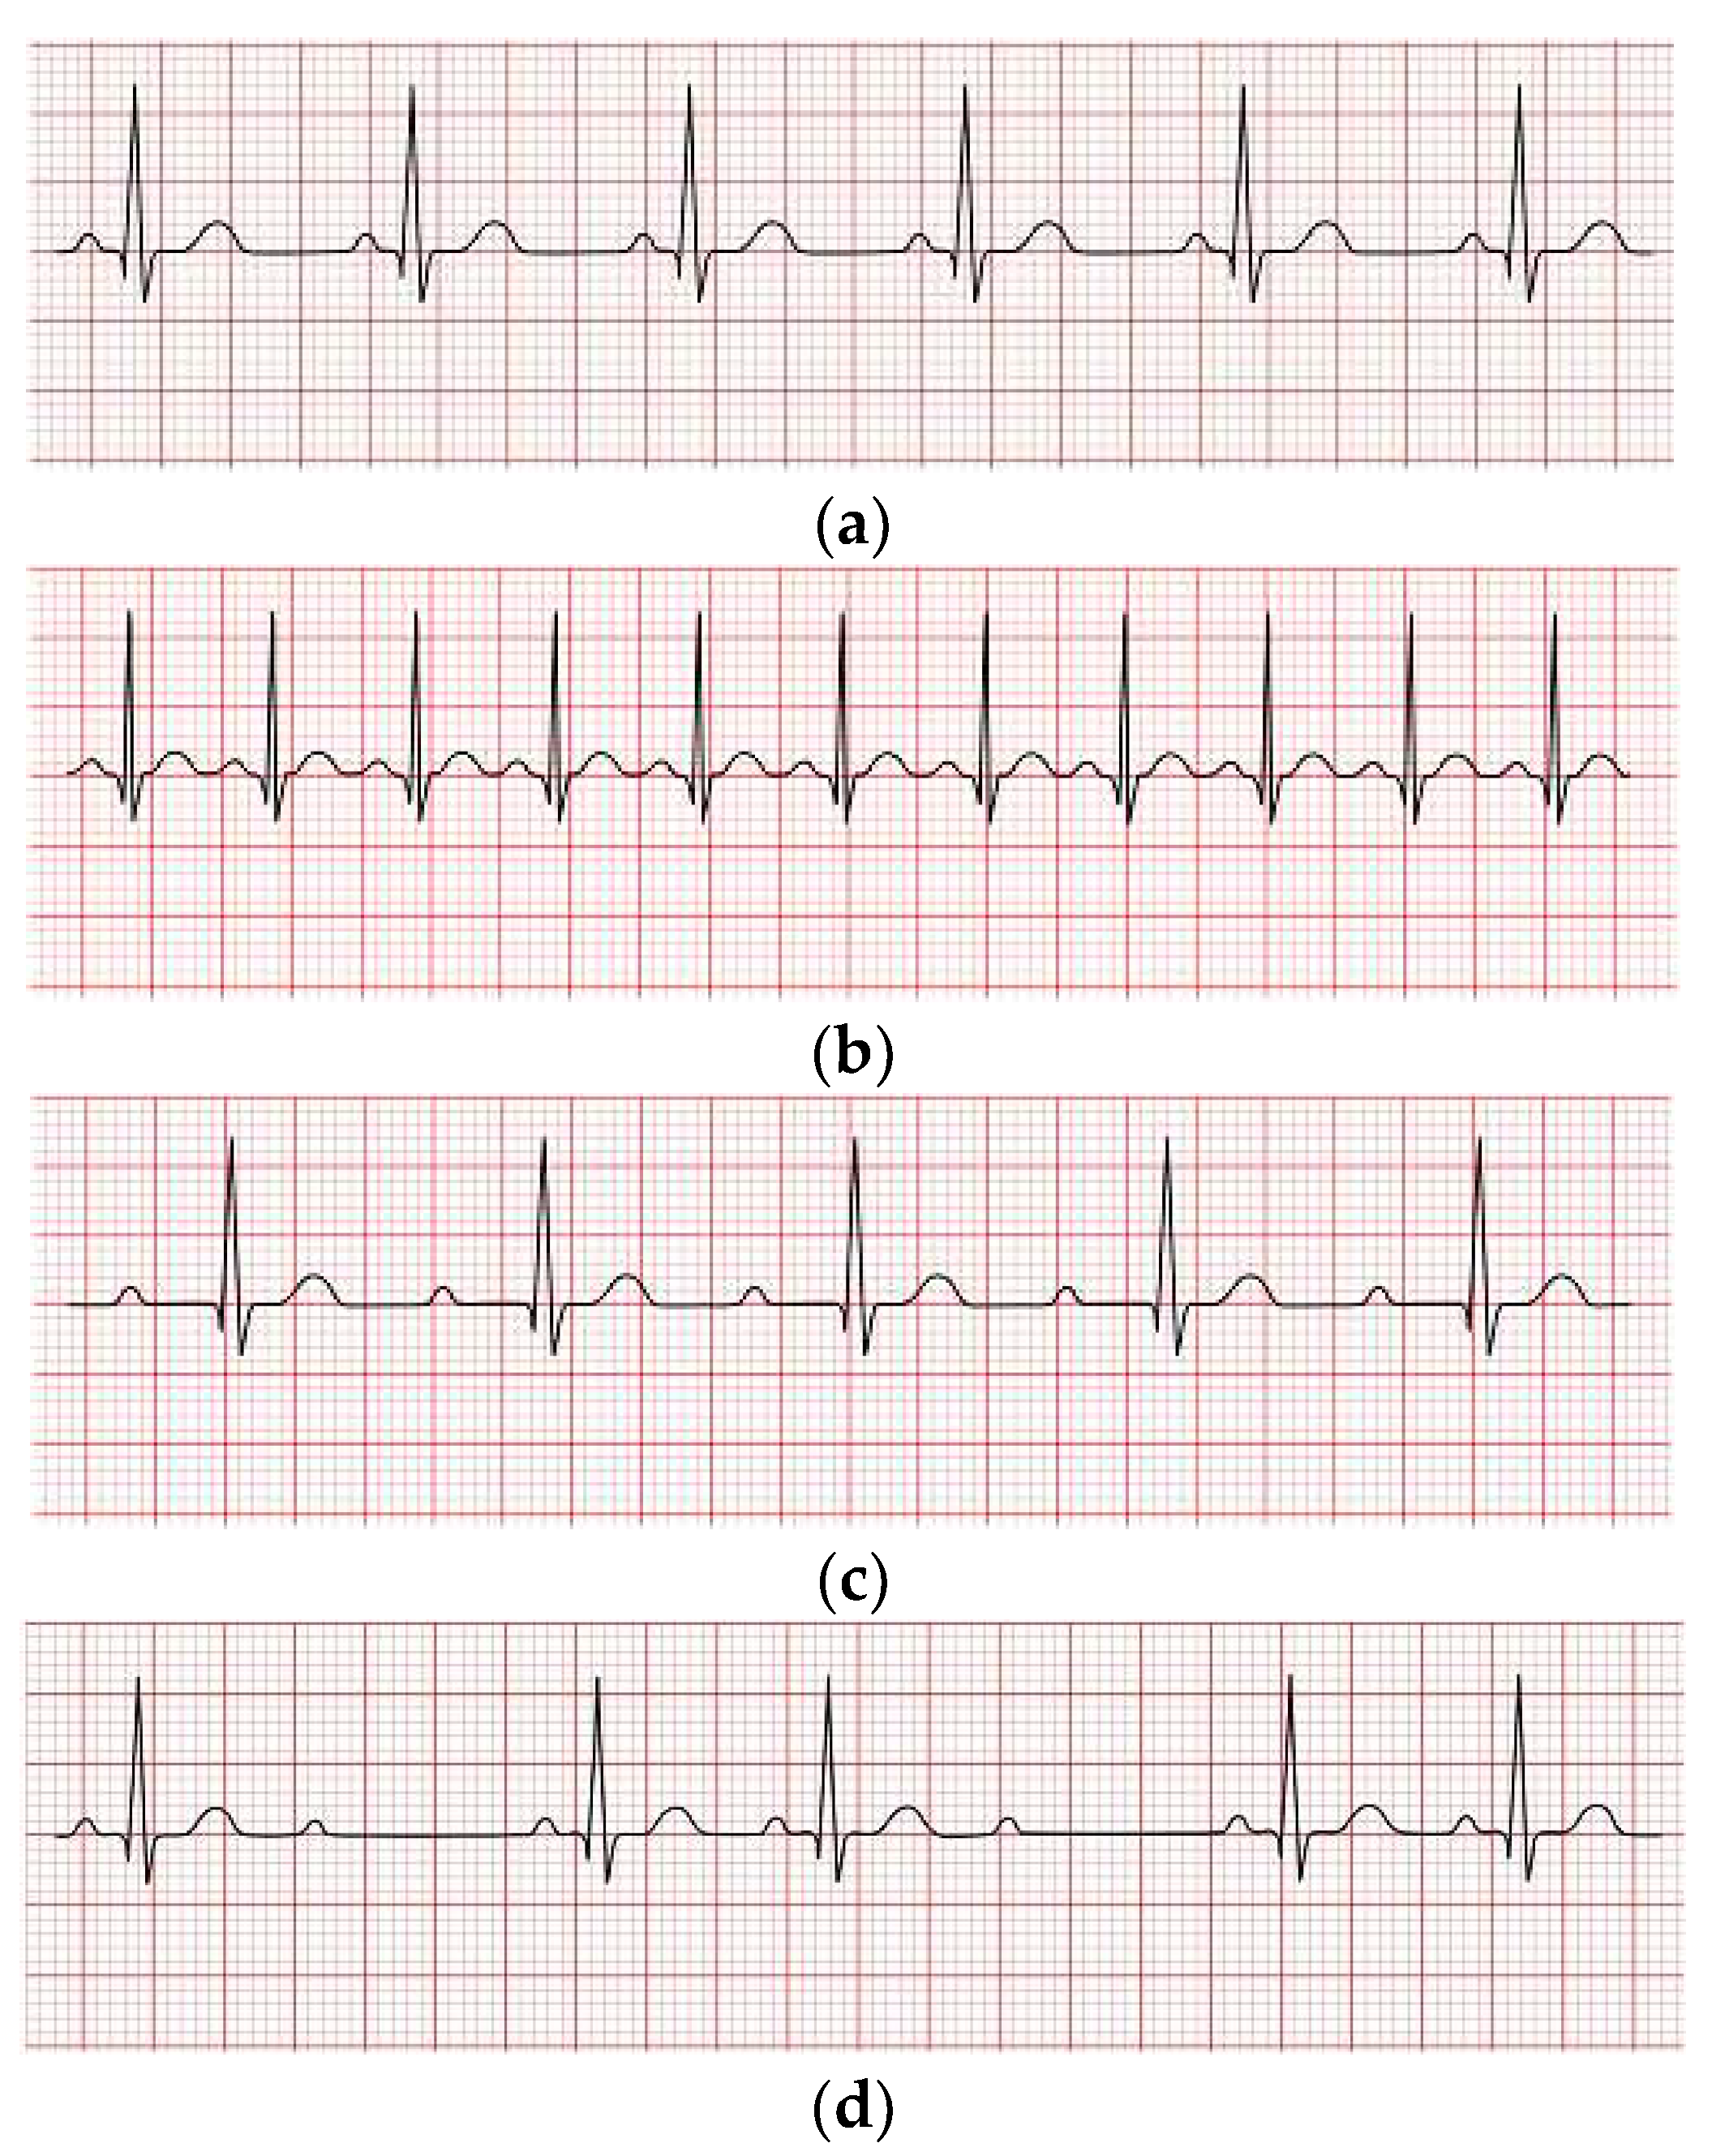
3.1. PTB Dataset
3.2. MIT-BIH Dataset
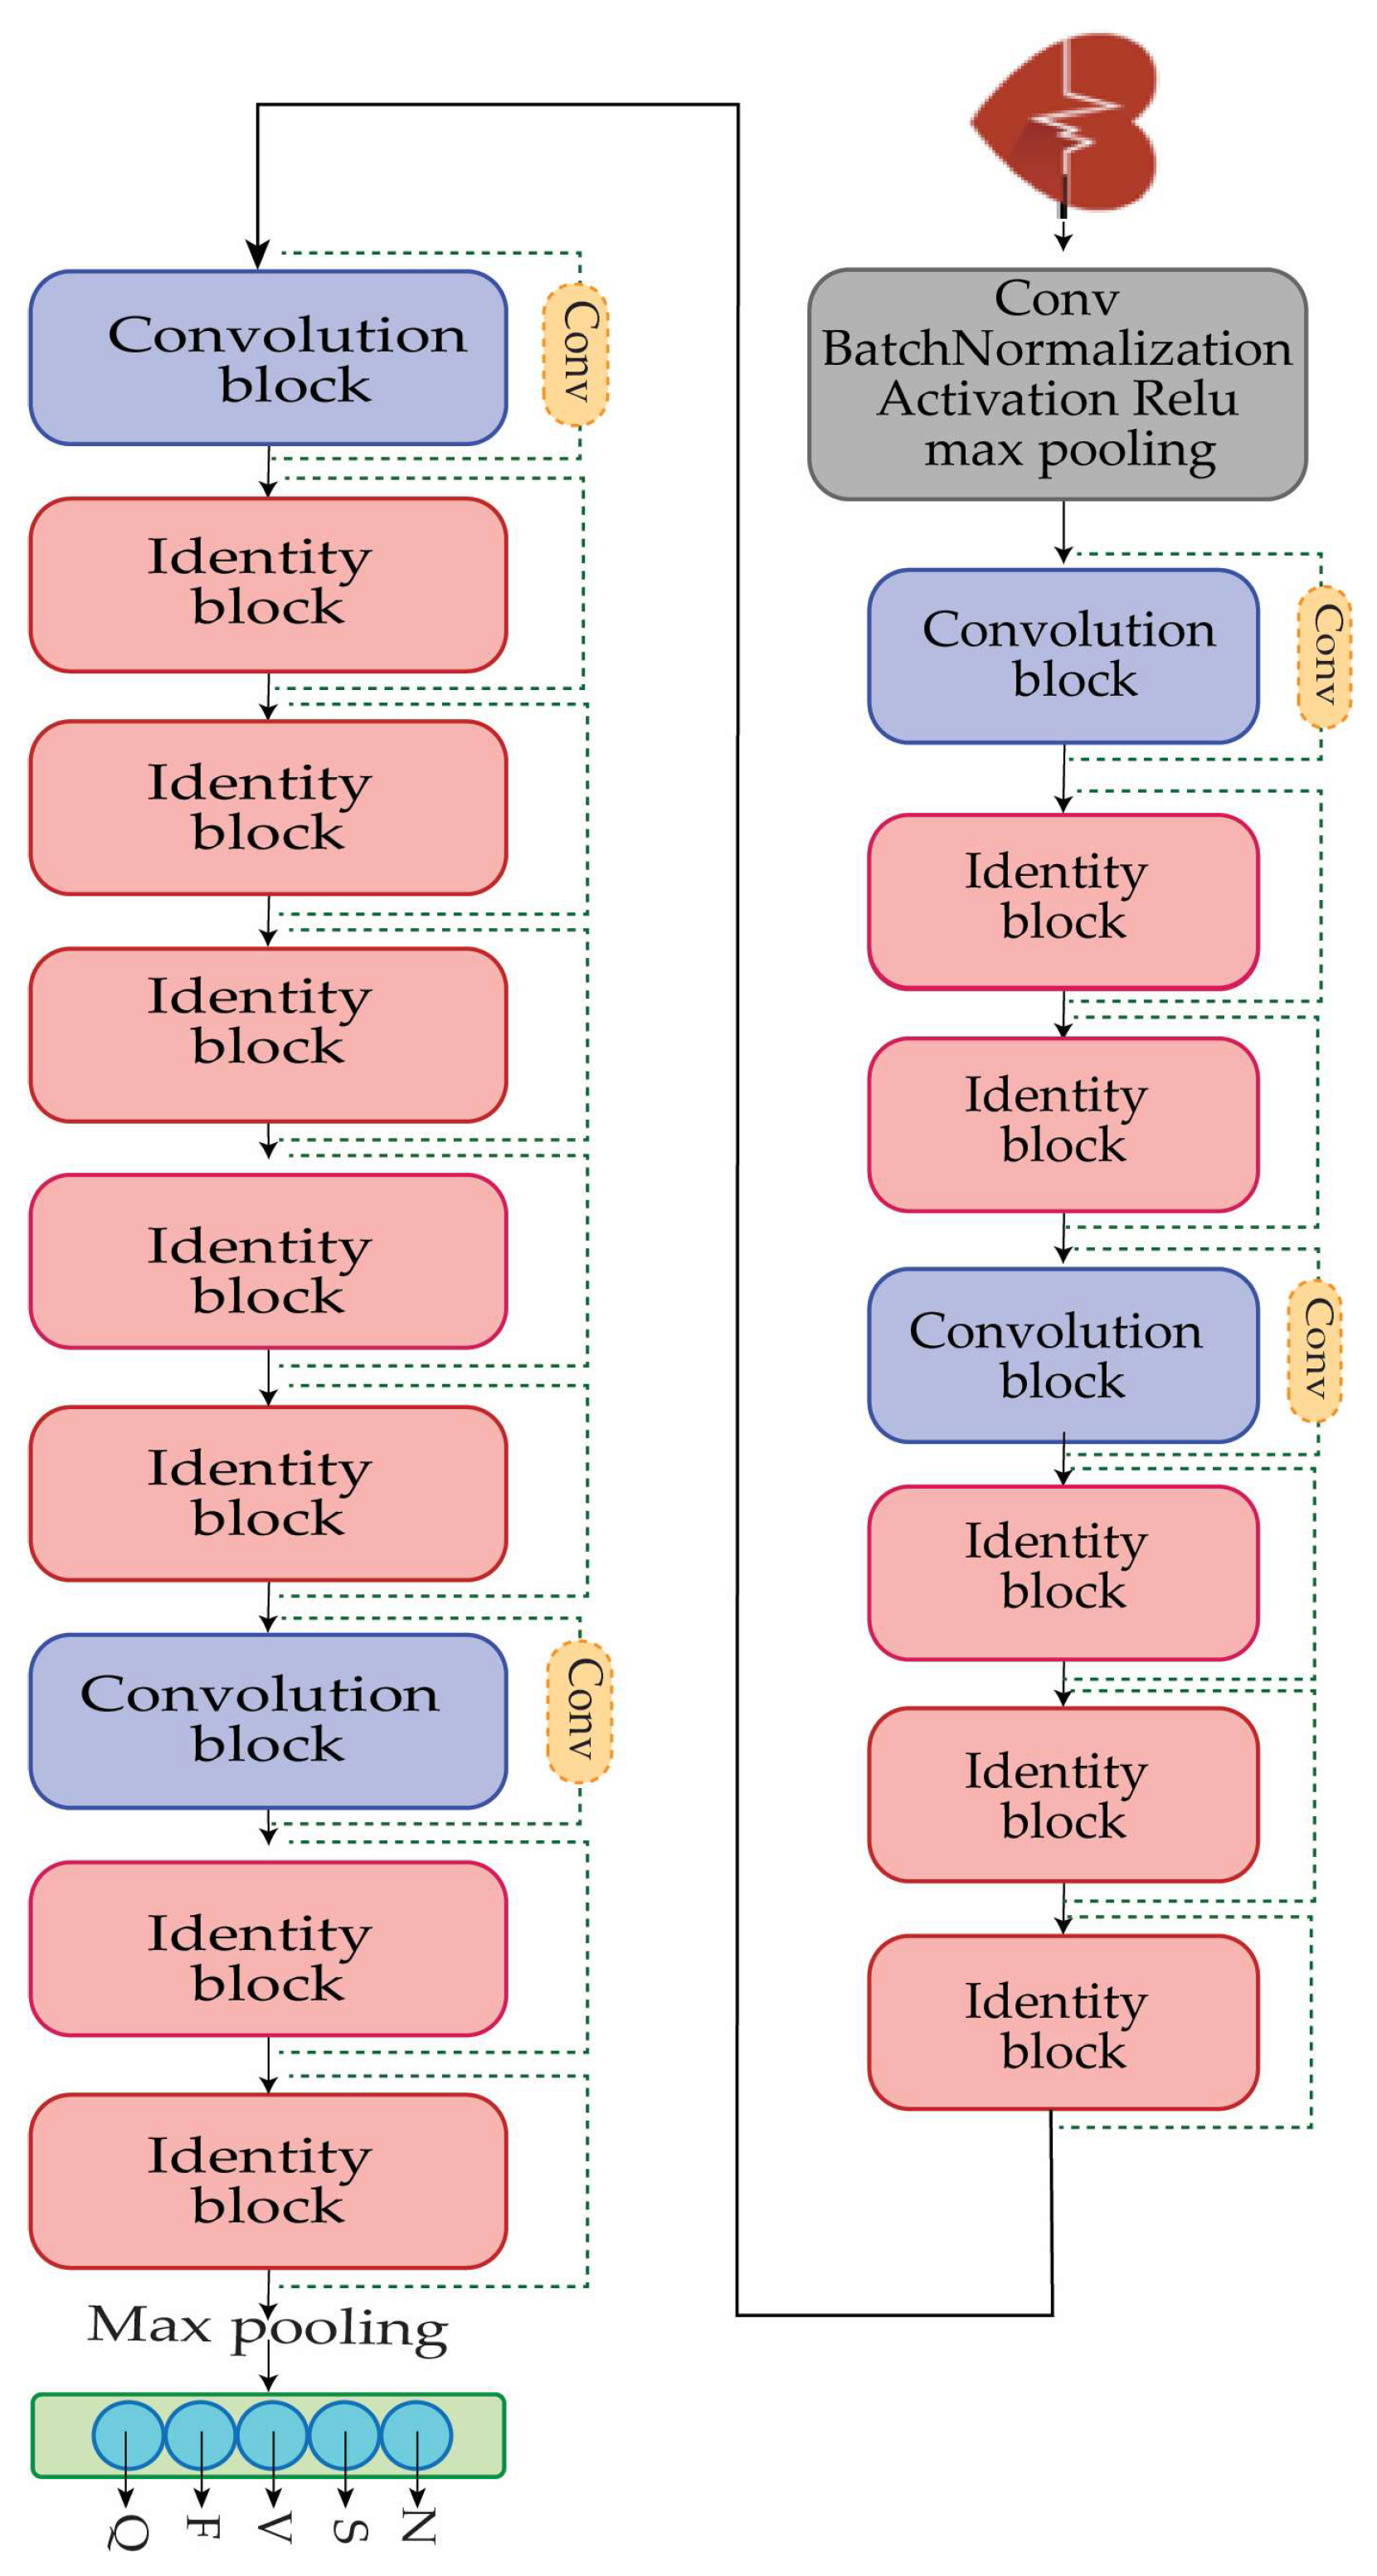
3.3. Proposed Model
- Python: The Python programming language was the core language used for developing the model due to its versatility and strong support for machine learning frameworks.
- TensorFlow: TensorFlow, an open-source machine learning framework developed by Google, was employed for building and training the deep learning model.
- Keras: Keras, a high-level neural network API written in Python, was used as an interface for building and configuring the neural network layers.
- NumPy: NumPy, a fundamental package for numerical computations in Python, was employed for handling mathematical operations and data manipulation.
- Pandas: The Pandas library was used for data preprocessing and manipulation, facilitating efficient handling of datasets and data frames.
- Matplotlib and Seaborn: These libraries were utilized for data visualization, aiding in the creation of various graphs and plots to present the model’s performance.
- Scikit-learn: Scikit-learn, a machine learning library for Python, provided essential tools for evaluating the model’s performance and implementing machine learning algorithms.
- Jupyter Notebook: Jupyter Notebook was used as the interactive coding environment, enabling code execution, data exploration, and result visualization in an integrated manner.
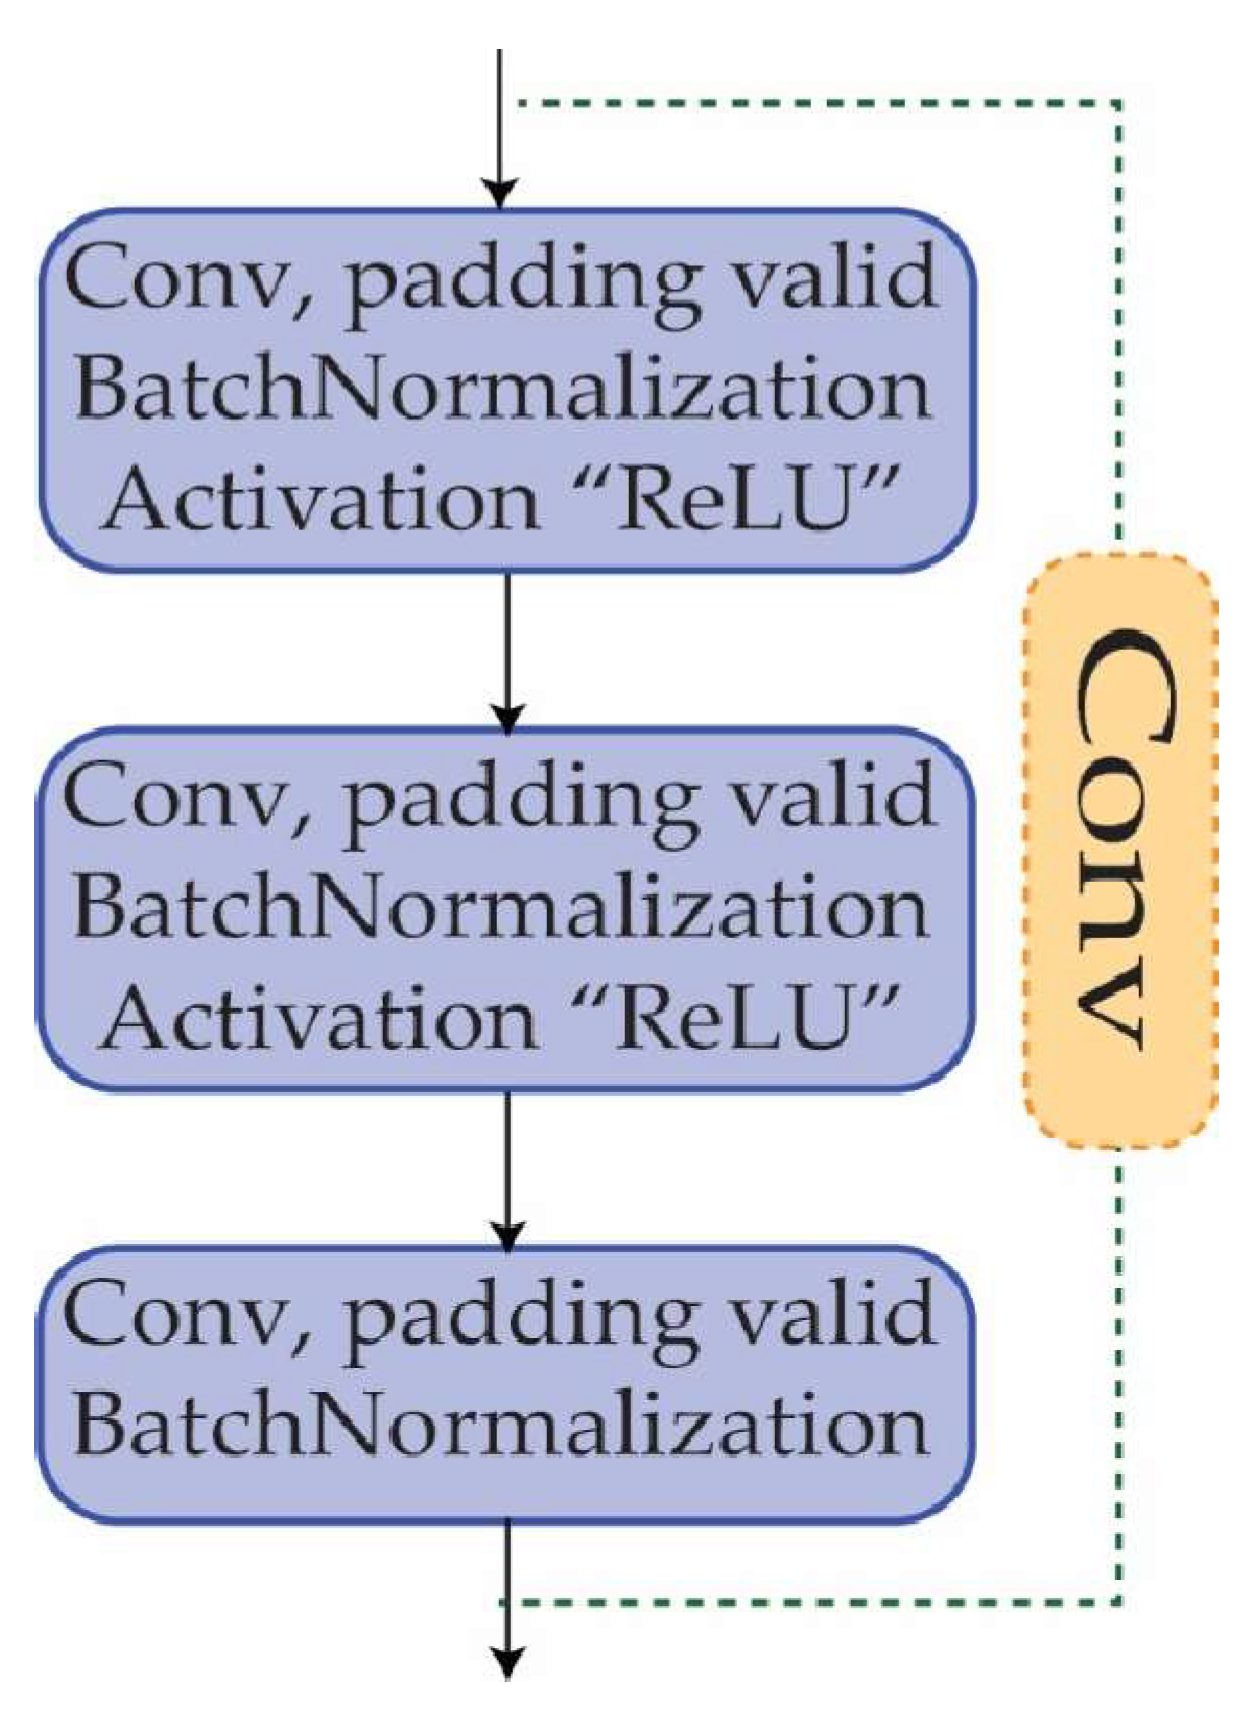
3.4. Convolutional Block
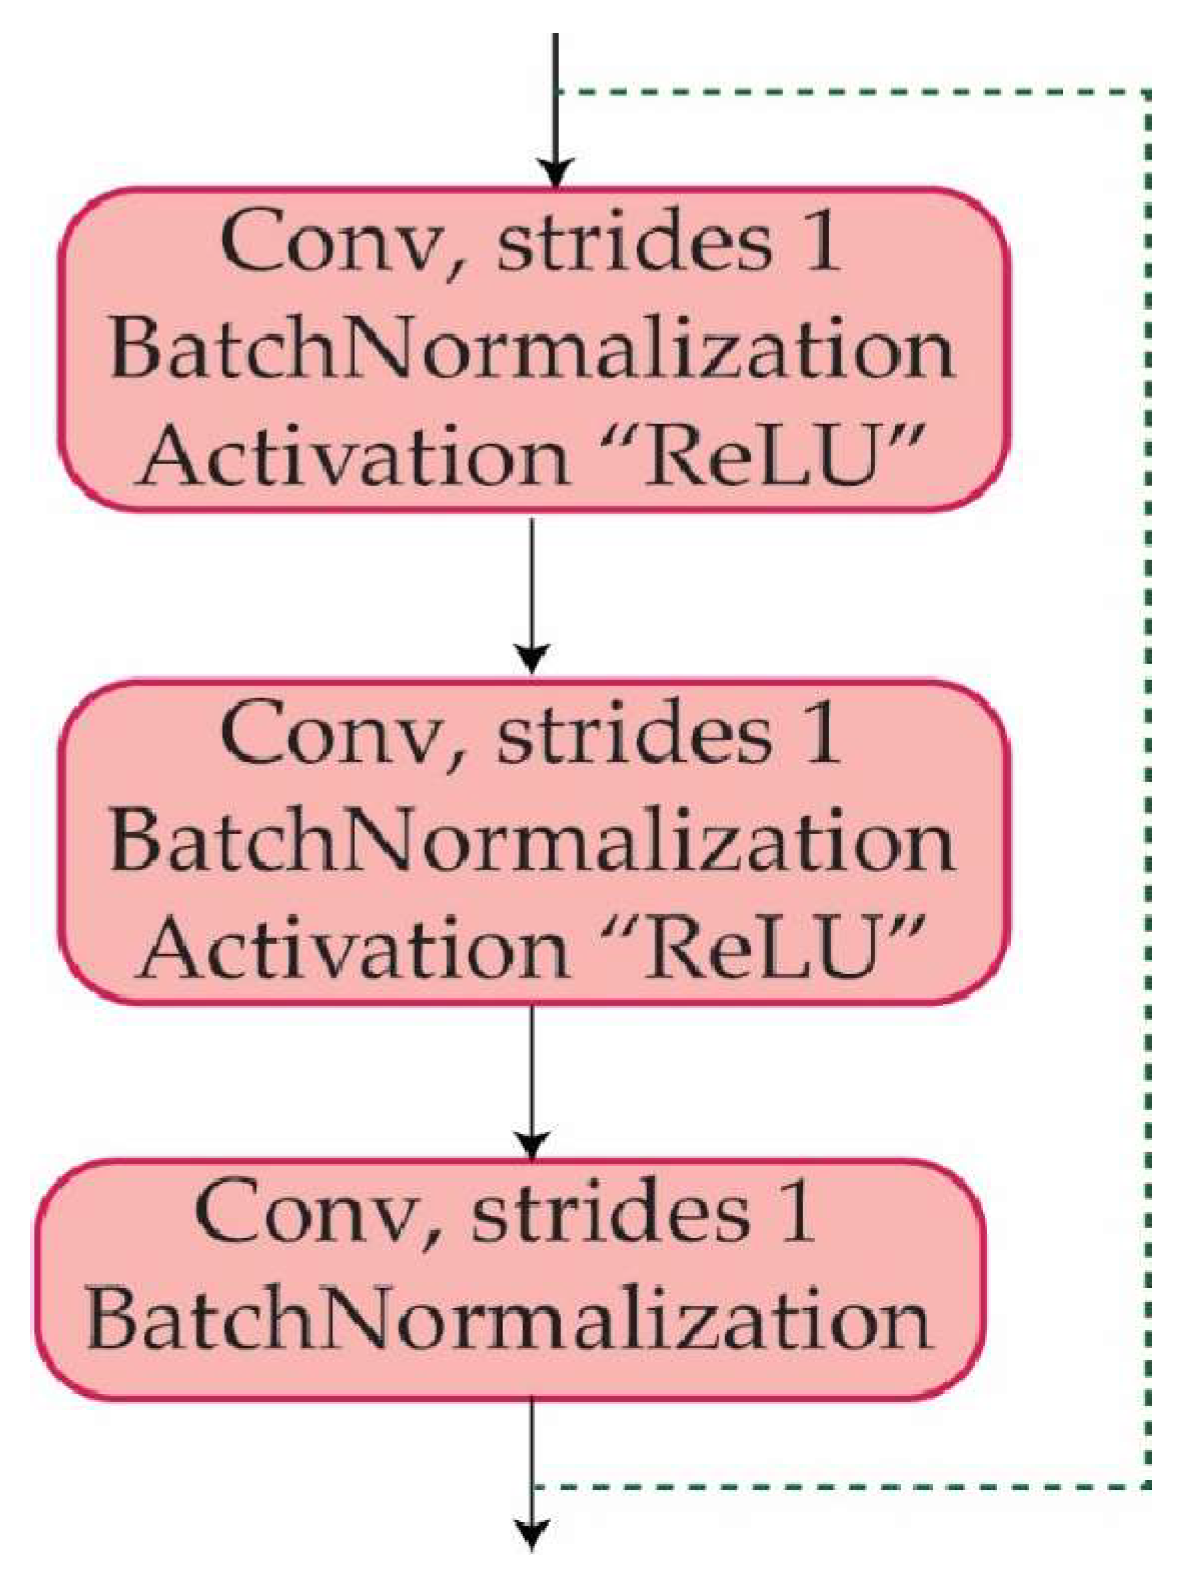
3.5. Identity Block
4. Results
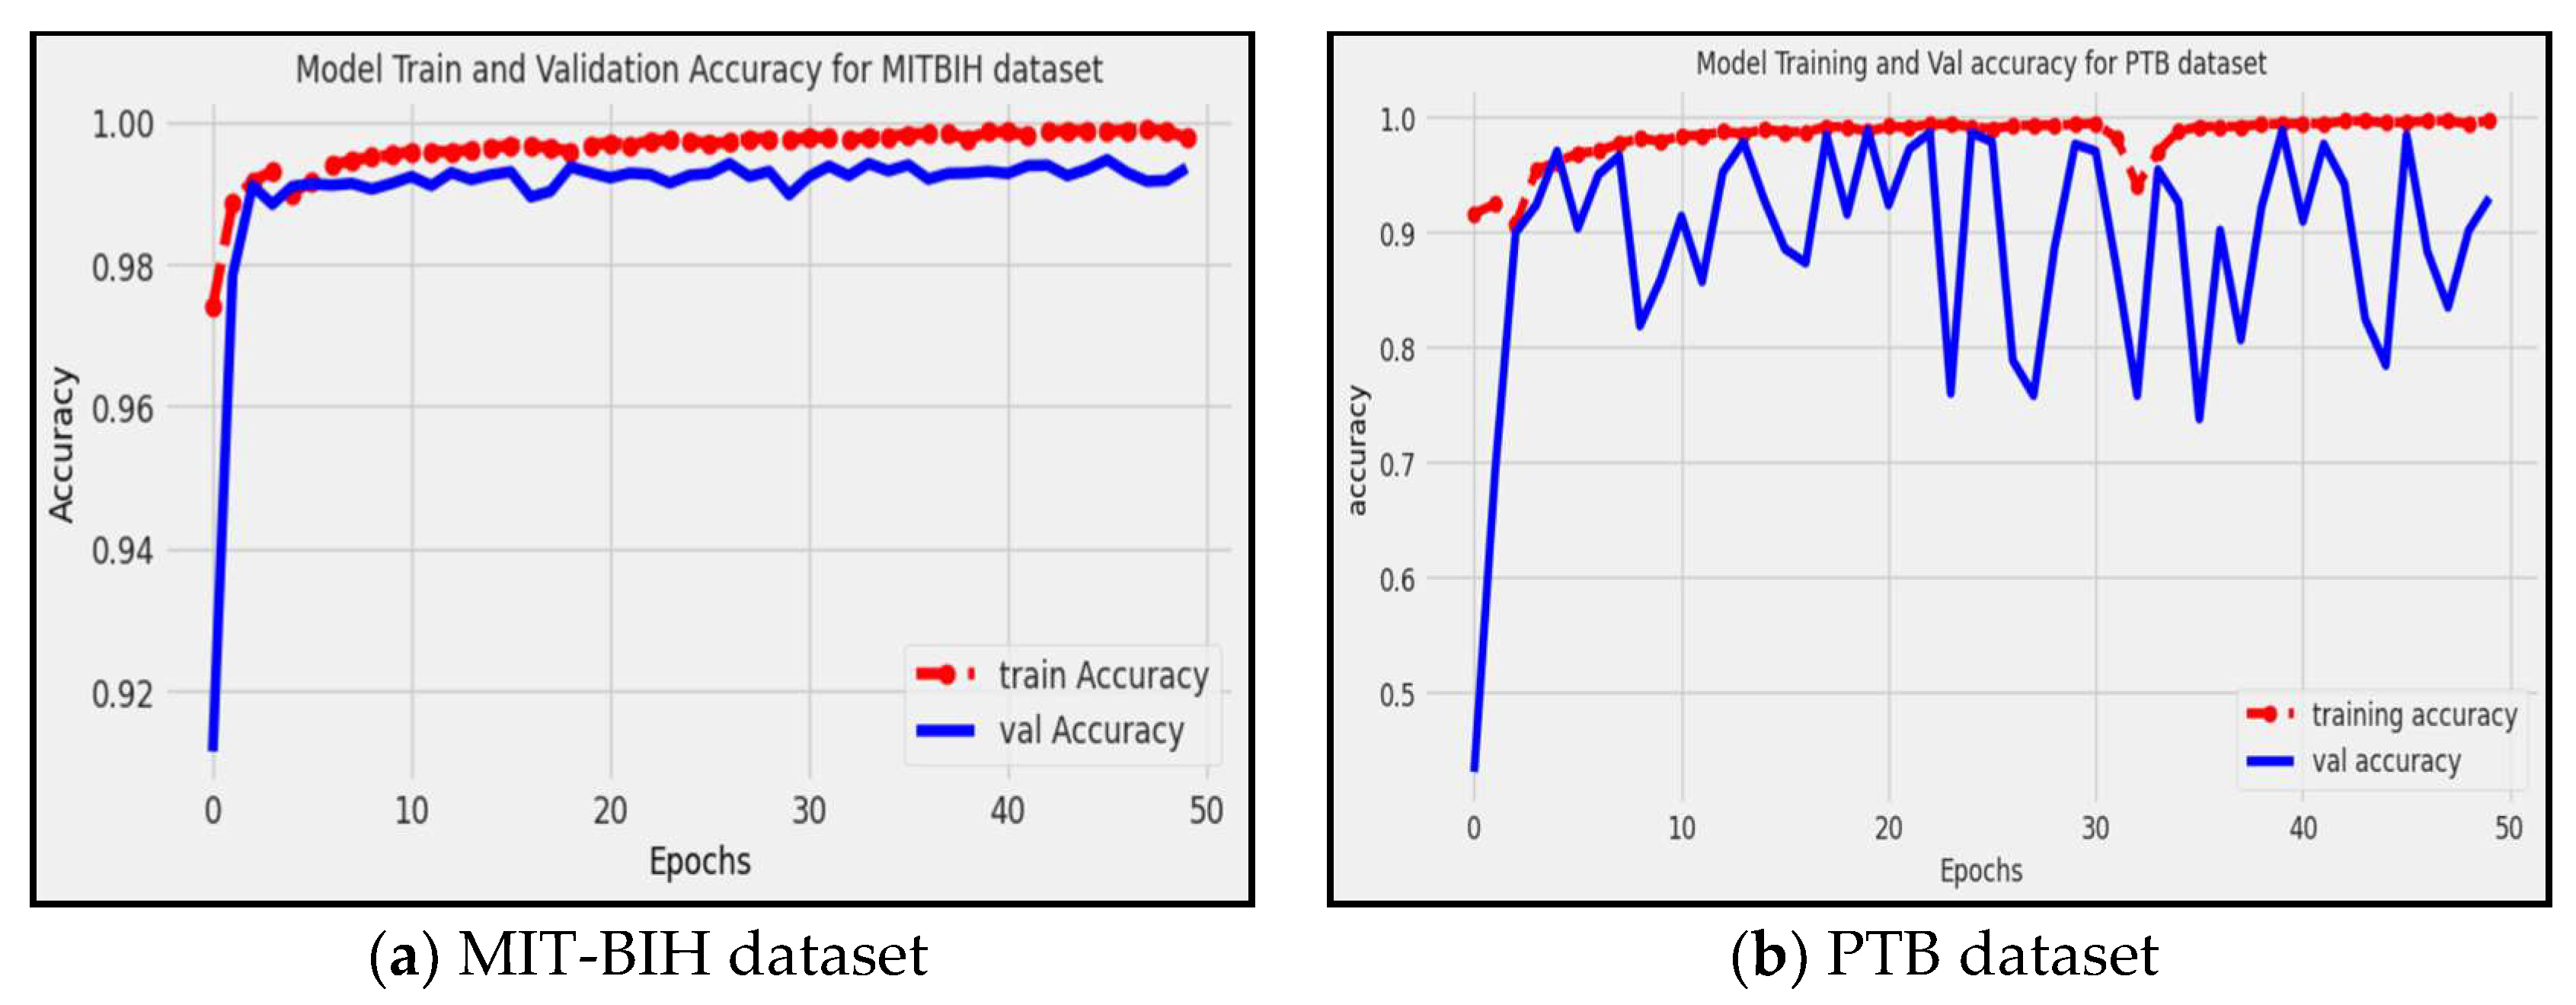
4.1. Accuracy
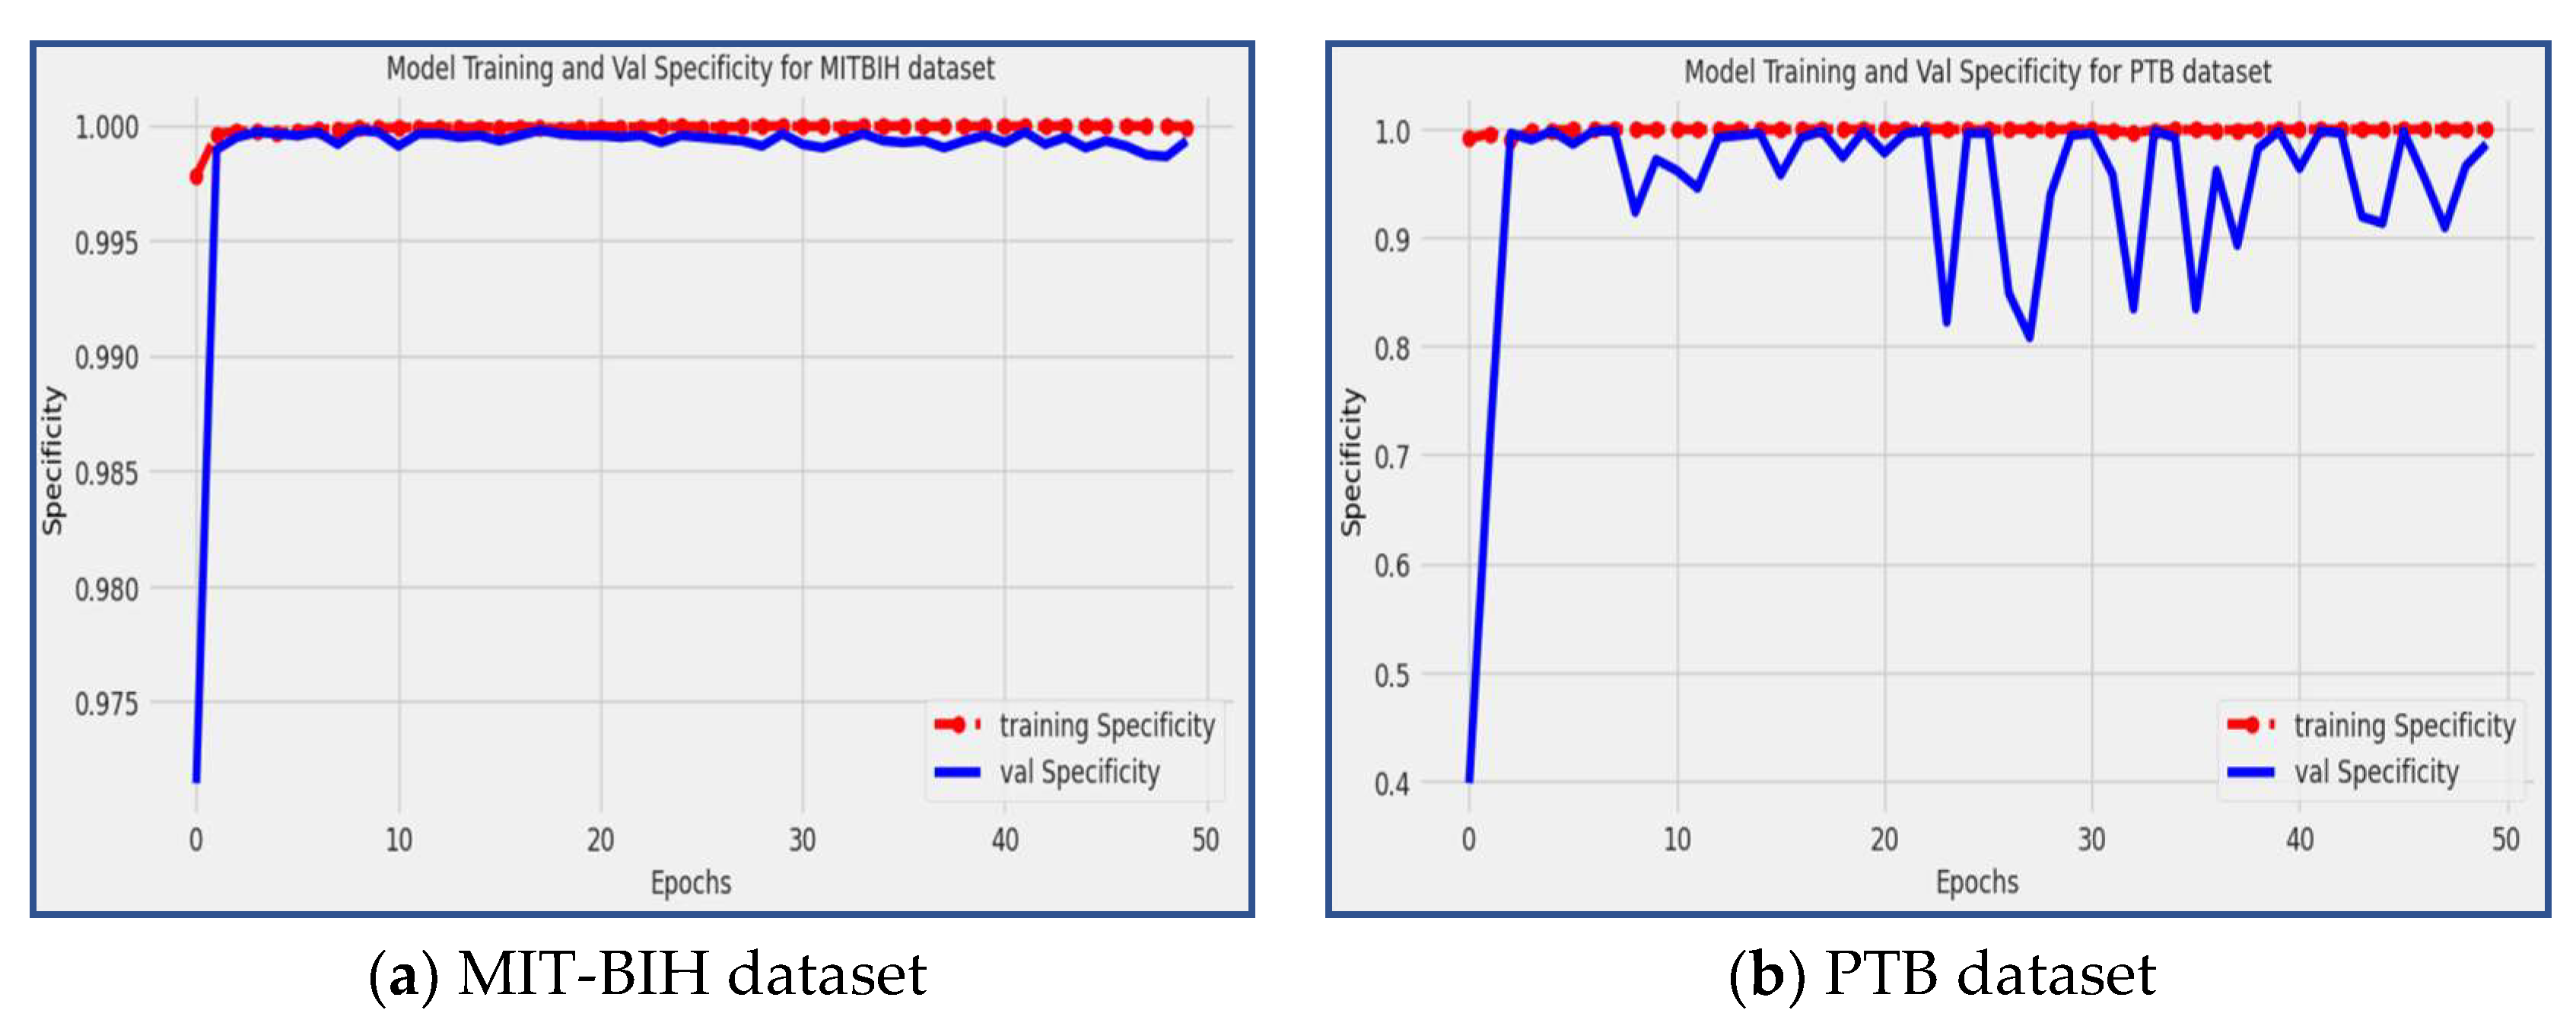
4.2. Specificity
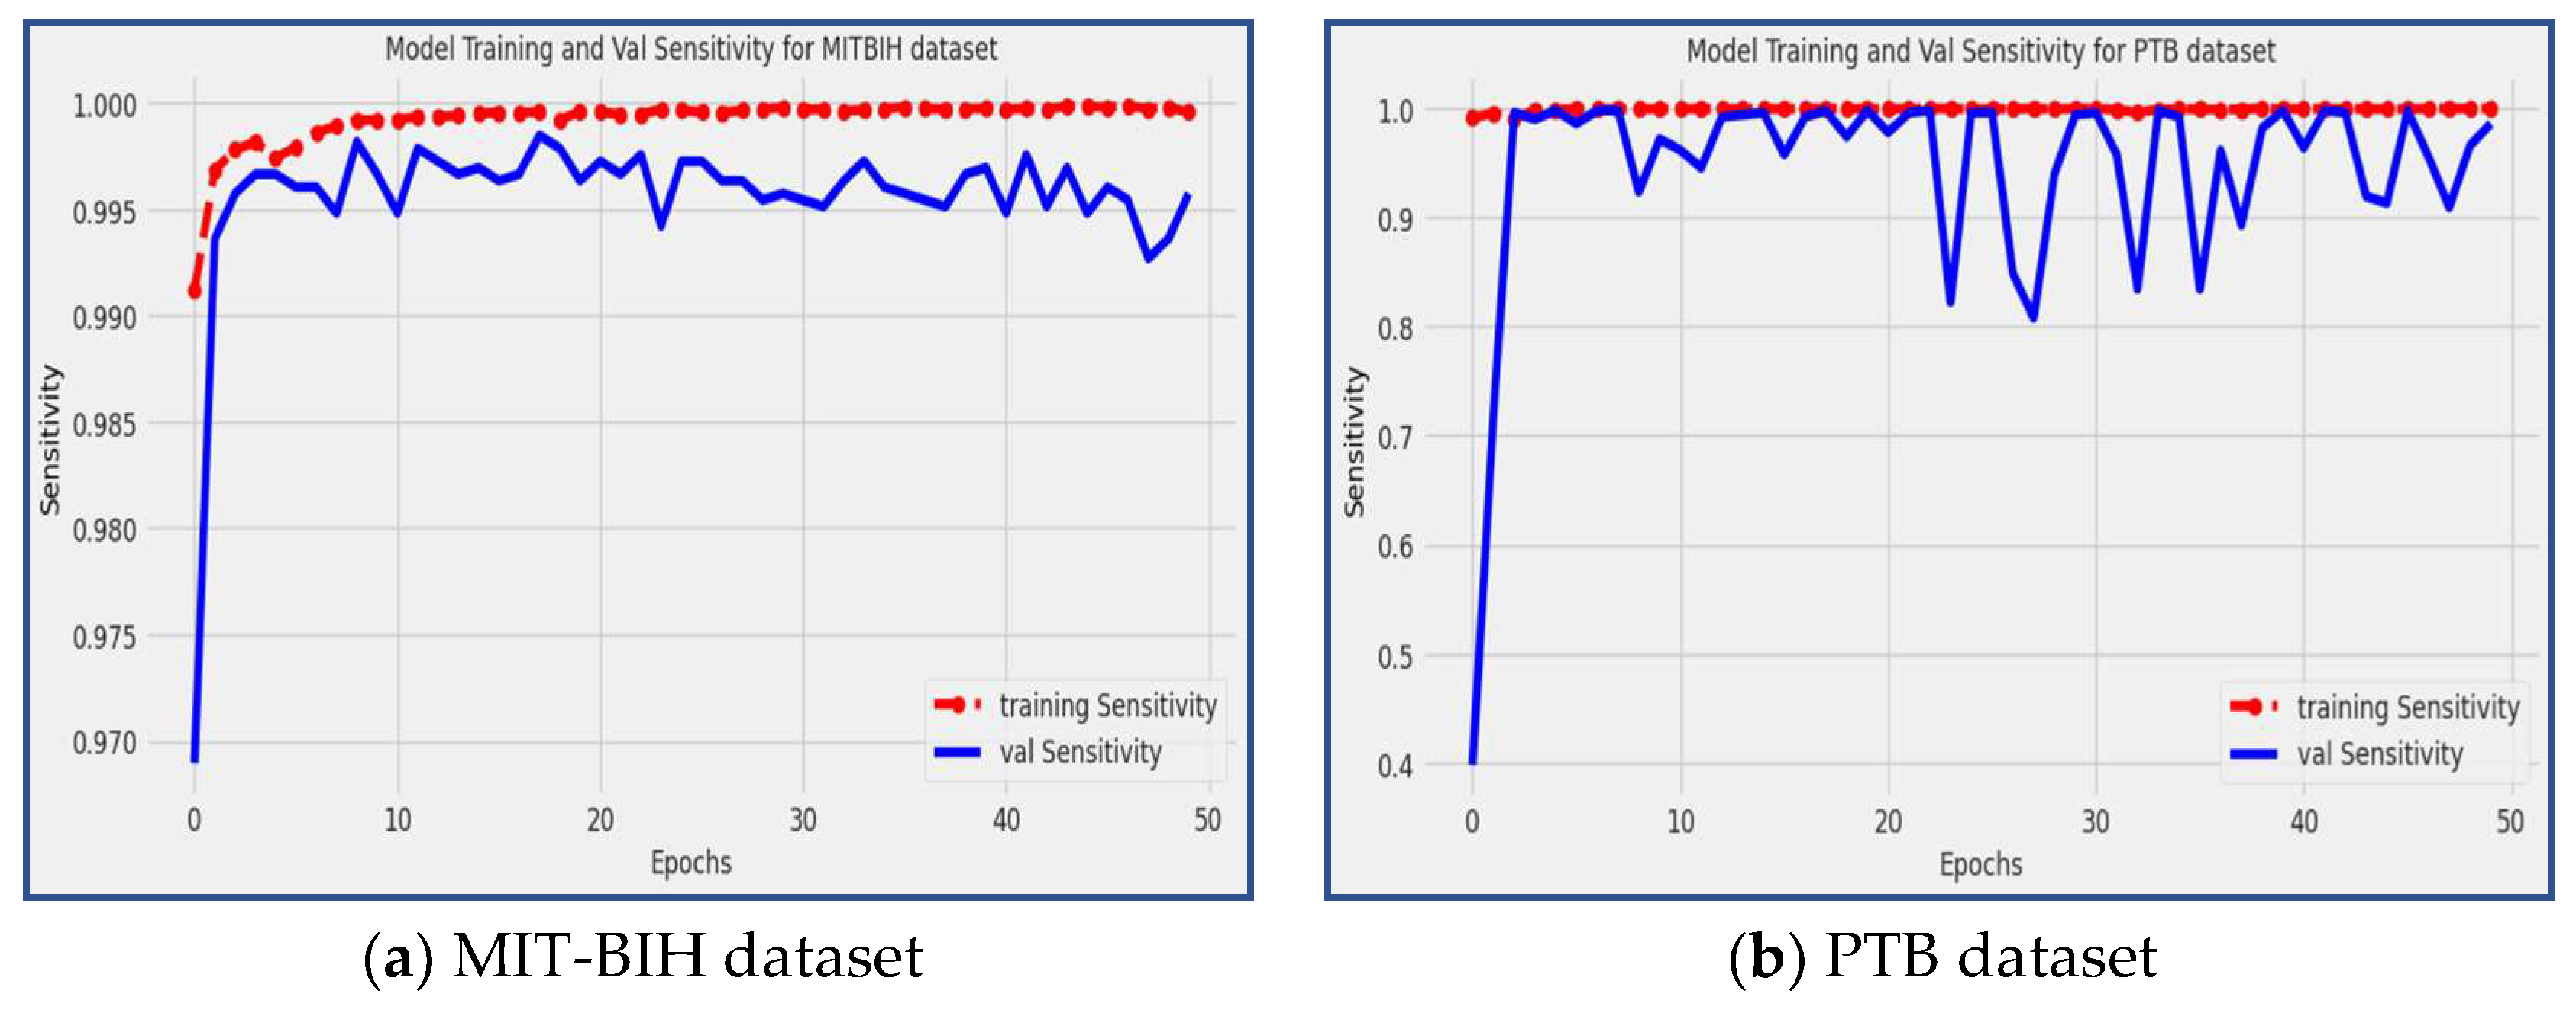
4.3. Sensitivity
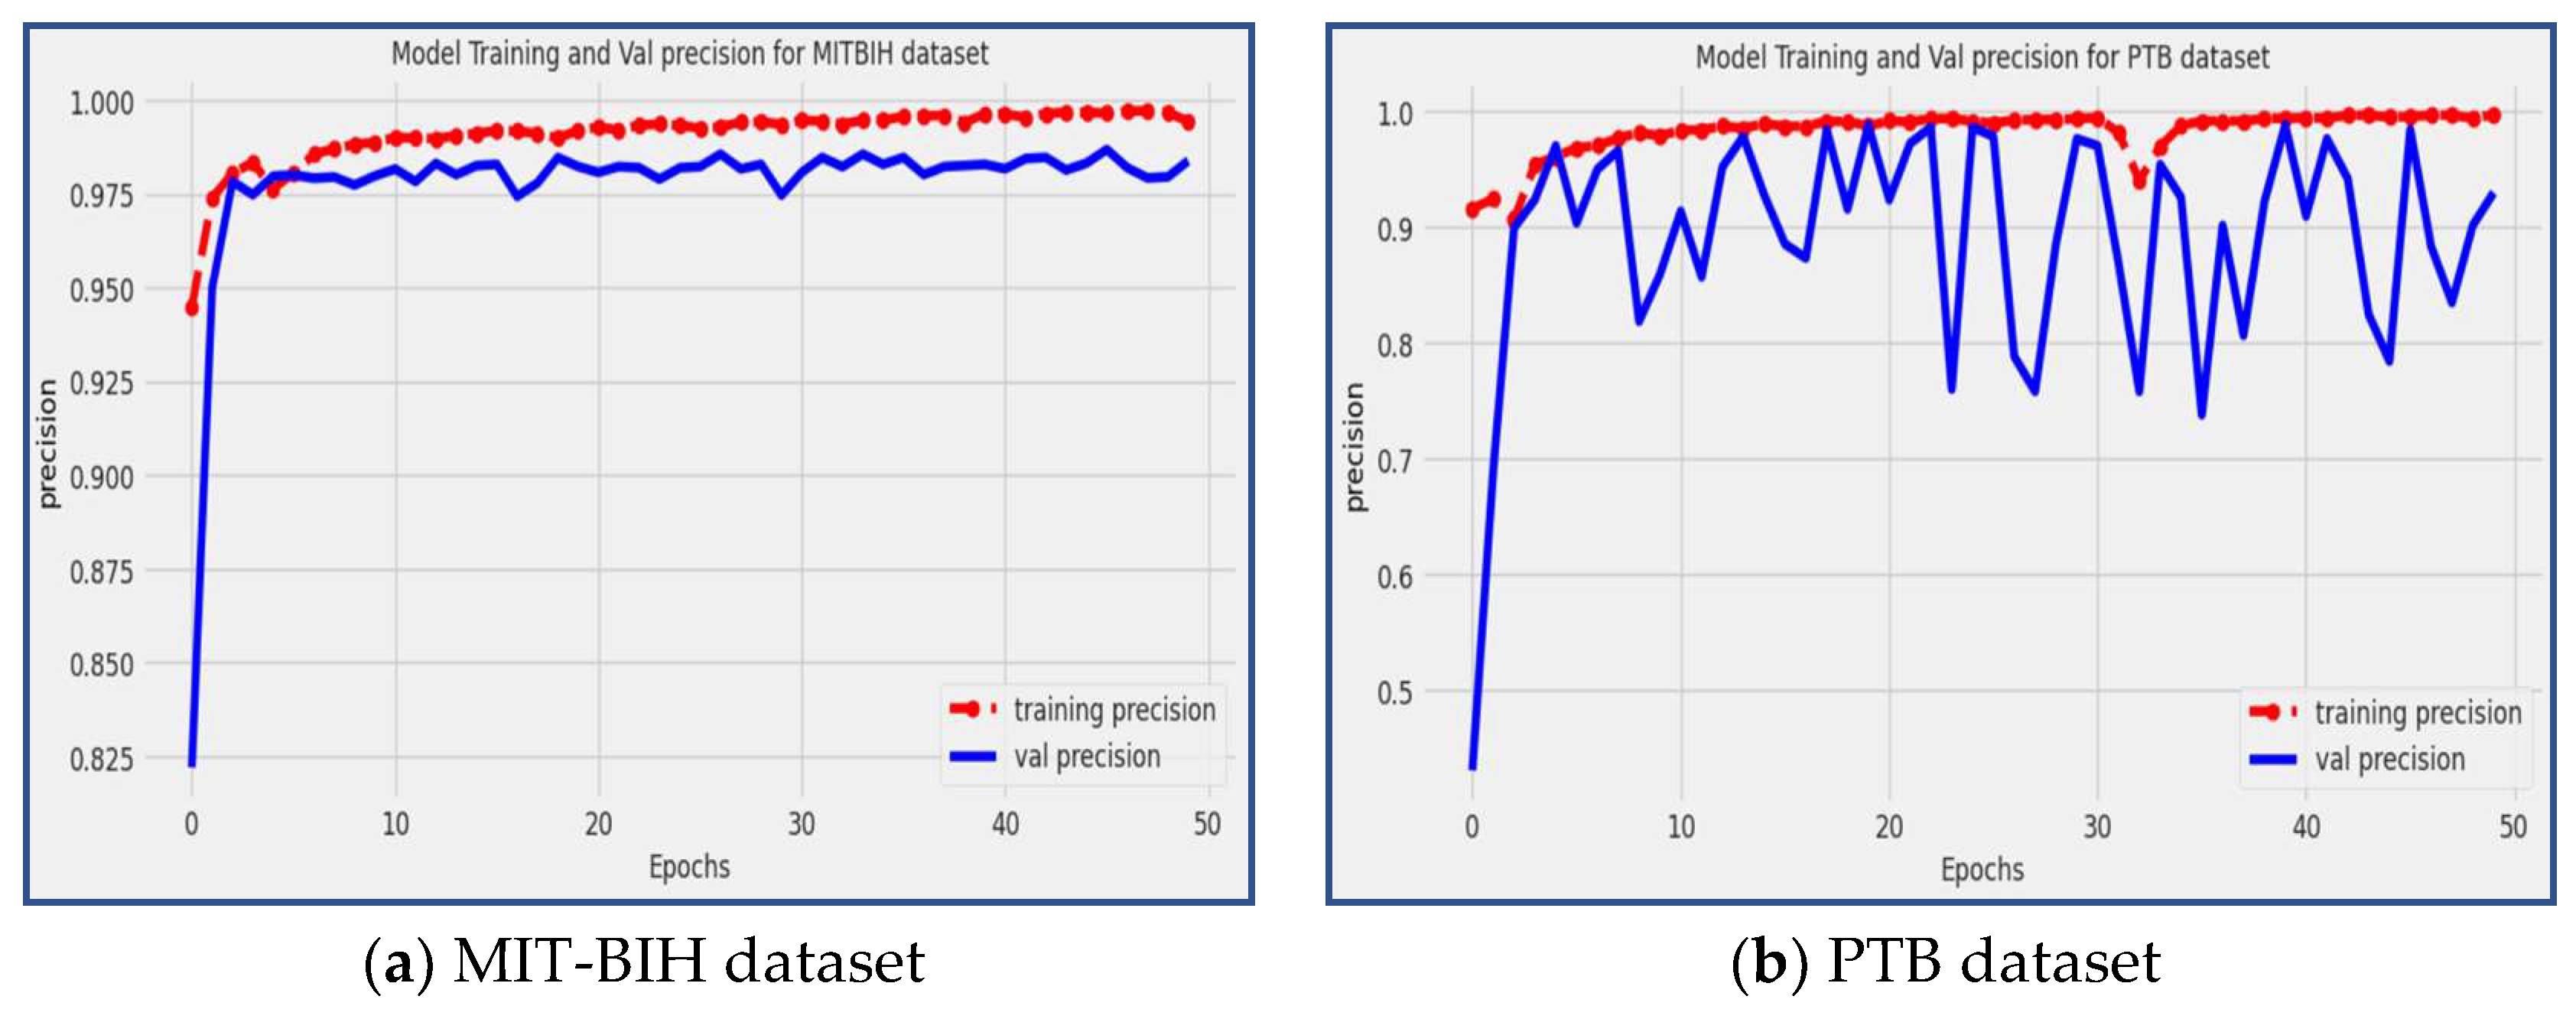
4.4. Precision
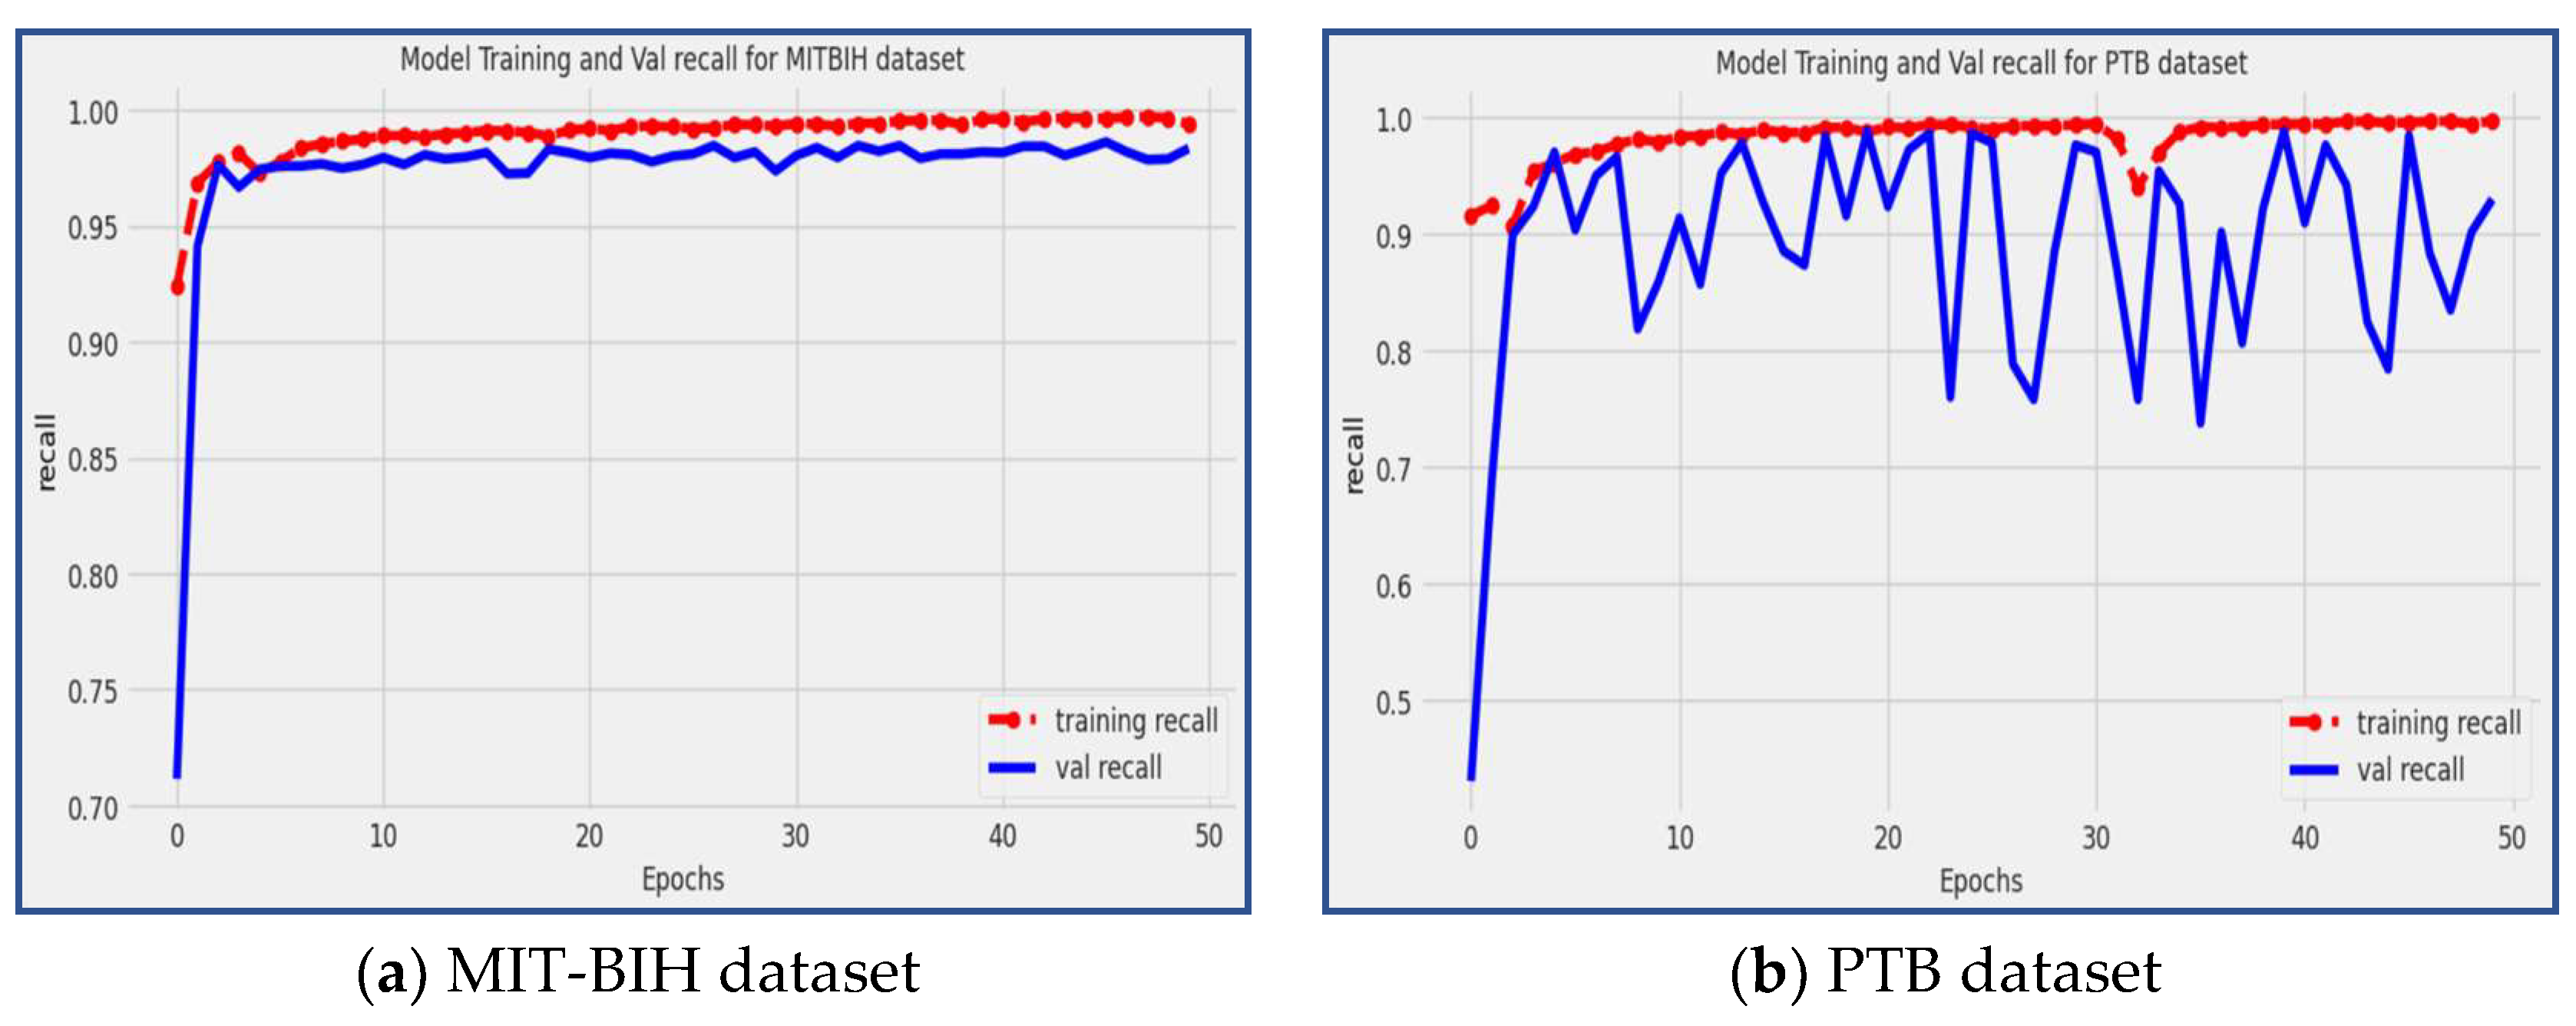
4.5. Recall
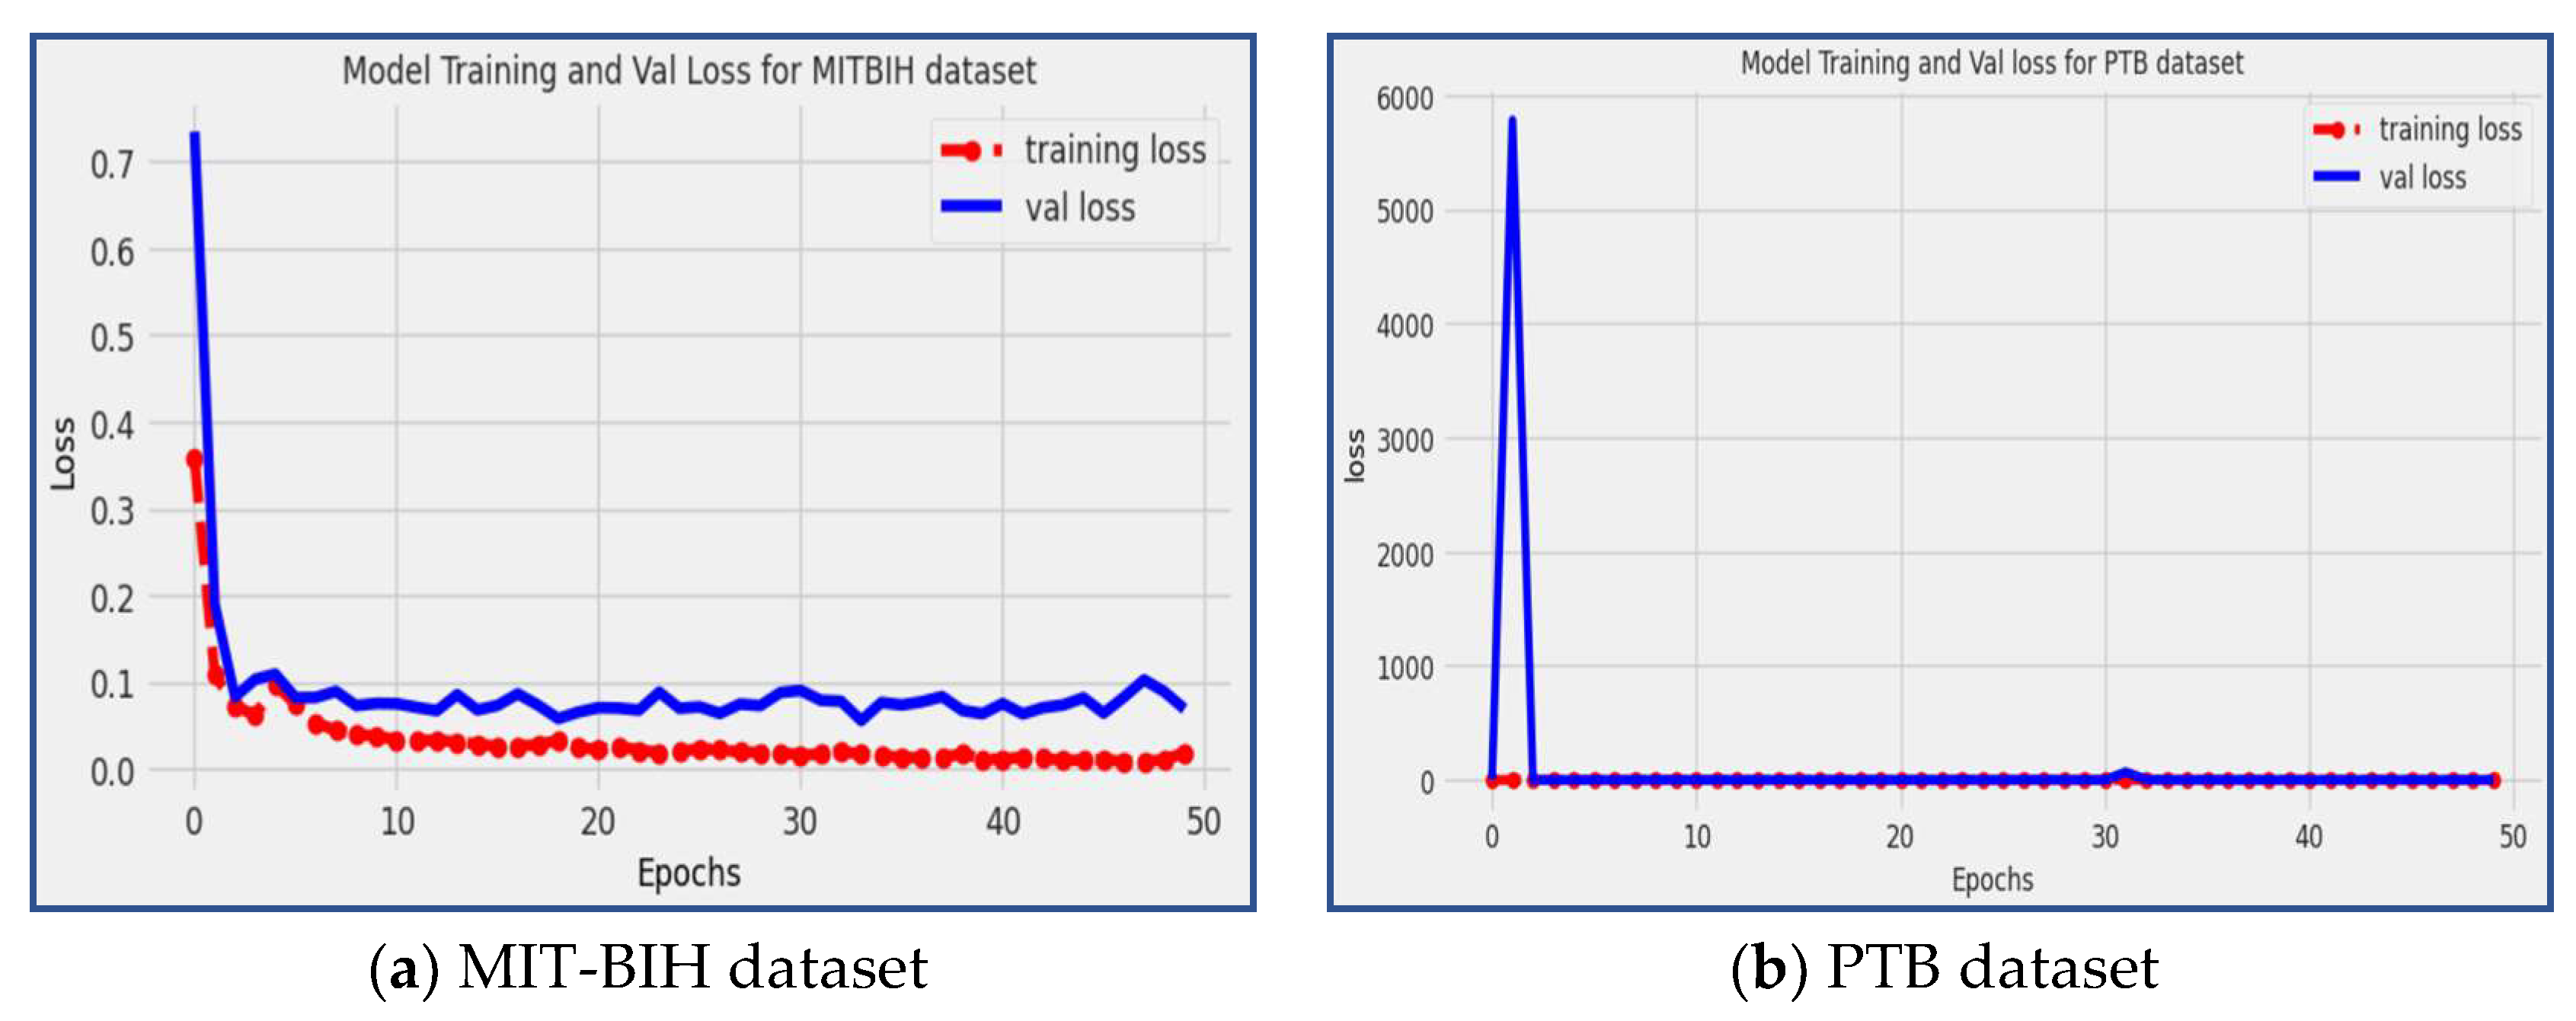
4.6. Loss
5. Discussion
6. Conclusions
Author Contributions
Funding
Institutional Review Board Statement
Informed Consent Statement
Data Availability Statement
Conflicts of Interest
References
- Walker, F.M. Advances at the Interface: Merging Information Technologies with Genomic Methodologies. Ph.D. Thesis, University of California, Oakland, CA, USA, September 2015. [Google Scholar]
- Khoury, A.L.; Jernigan, E.G.; Nelson, J.S.; Strassle, P.D.; Gonzalez, V.J.; Essaid, L.; Chowdhury, M.H.; Long, J.M.; Sharma, M.S. The University of north carolina heart-lung transplant experience: Historical perspective and notes on surveillance for very long-term survivors. J. Patient Care 2021, 7, 161. [Google Scholar]
- Su, Q.; Huang, Y.; Wu, X.; Zhang, B.; Lu, P.; Lyu, T. Atrial Fibrillation Detection Based on a Residual CNN Using BCG Signals. Electronics 2022, 11, 2974. [Google Scholar] [CrossRef]
- Atal, D.K.; Singh, M. Arrhythmia classification with ECG signals based on the optimization-enabled deep convolutional neural network. Comput. Methods Programs Biomed. 2020, 196, 105607. [Google Scholar] [CrossRef] [PubMed]
- Almutairi, H.; Hassan, G.M.; Datta, A. Classification of Obstructive Sleep Apnoea from single-lead ECG signals using convolutional neural and Long Short Term Memory networks. Biomed. Signal Process. Control 2021, 69, 102906. [Google Scholar] [CrossRef]
- Isin, A.; Ozdalili, S. Cardiac arrhythmia detection using deep learning. Proc. Comput. Sci. 2017, 120, 268–275. [Google Scholar] [CrossRef]
- Li, Z.; Zhou, D.; Wan, L.; Li, J.; Mou, W. Heartbeat classification using the deep residual convolutional neural network from the 2-lead electrocardiogram. J. Electrocardiol. 2020, 58, 105–112. [Google Scholar] [CrossRef]
- Imran, M.; Ullah, A.; Arif, M.; Noor, R. A unified technique for entropy enhancement based diabetic retinopathy detection using hybrid neural network. Comput. Biol. Med. 2022, 145, 105424. [Google Scholar]
- Jahmunah, V.; Ng, E.Y.K.; Tan, R.S.; Oh, S.L.; Acharya, U.R. Explainable detection of myocardial infarction using deep learning models with Grad-CAM technique on ECG signals. Comput. Biol. Med. 2022, 146, 105550. [Google Scholar] [CrossRef]
- Mohammadzadeh-Asl, B.; Setarehdan, S.K. Neural network based arrhythmia classification using heart rate variability signal. In Proceedings of the 2006 14th European Signal Processing Conference, Florence, Italy, 4–8 September 2006. [Google Scholar]
- Kumari, C.U.; Murthy, A.S.D.; Prasanna, B.L.; Reddy, M.P.P.; Panigrahy, A.K. An automated detection of heart arrhythmias using machine learning technique: SVM. Mater. Today Proc. 2021, 45, 1393–1398. [Google Scholar] [CrossRef]
- Wu, Q.; Sun, Y.; Yan, H.; Wu, X. ECG signal classification with binarized convolutional neural network. Comput. Biol. Med. 2020, 121, 103800. [Google Scholar] [CrossRef]
- Wang, A.; Xu, W.; Sun, H.; Pu, N.; Liu, Z.; Liu, H. Arrhythmia classifier using binarized convolutional neural network for resource-constrained devices. In Proceedings of the 2022 4th International Conference on Communications, Information System and Computer Engineering (CISCE), Shenzhen, China, 27–29 May 2022; pp. 213–220. [Google Scholar]
- Zheng, J.; Chu, H.; Struppa, D.; Zhang, J.; Yacoub, S.M.; El-Askary, H.; Rakovski, C. Optimal multi-stage arrhythmia classification approach. Sci. Rep. 2020, 10, 2898. [Google Scholar] [CrossRef] [PubMed]
- Lee, K.R. Low Power ECG Arrhythmia Detection SoC with STT-MRAM and LDMAC Unit. Ph.D. Thesis, Korea Advanced Institute of Science & Technology, Daejeon, Republic of Korea, 2021. [Google Scholar]
- Sahoo, S.; Kanungo, B.; Behera, S.; Sabut, S. Multiresolution wavelet transform based feature extraction and ECG classification to detect cardiac abnormalities. Measurement 2017, 108, 55–66. [Google Scholar] [CrossRef]
- Li, P.; Wang, Y.; He, J.; Wang, L.; Tian, Y.; Zhou, T.-S.; Li, T.; Li, J.-S. High-performance personalized heartbeat classification model for long-term ECG signal. IEEE Trans. Biomed. Eng. 2017, 64, 78–86. [Google Scholar]
- Shadmand, S.; Mashoufi, B. A new personalized ECG signal classification algorithm using block-based neural network and particle swarm optimization. Biomed. Signal Process. Control 2016, 25, 12–23. [Google Scholar] [CrossRef]
- Sakhare, P.B.; Ghongade, R. An approach for ECG beats classification using adaptive neuro fuzzy inference system. In Proceedings of the 2015 Annual IEEE India Conference, New Delhi, India, 17–20 December 2015; pp. 1–6. [Google Scholar]
- Nurmaini, S.; Umi Partan, R.; Caesarendra, W.; Dewi, T.; Naufal Rahmatullah, M.; Darmawahyuni, A.; Firdaus, F. An automated ECG beat classification system using deep neural networks with an unsupervised feature extraction technique. Appl. Sci. 2019, 9, 2921. [Google Scholar] [CrossRef]
- Bhattacharyya, S.; Majumder, S.; Debnath, P.; Chanda, M. Arrhythmic heartbeat classification using ensemble of random forest and support vector machine algorithm. IEEE Trans. Artif. Intell. 2021, 2, 260–268. [Google Scholar] [CrossRef]
- Zhou, S.; Tan, B. Electrocardiogram soft computing using hybrid deep learning CNN-ELM. Appl. Soft Comput. 2020, 86, 105778. [Google Scholar] [CrossRef]
- Martis, R.J.; Acharya, U.R.; Min, L.C. ECG beat classification using PCA, LDA, ICA and discrete wavelet transform. Biomed. Signal Process. Control 2013, 8, 437–448. [Google Scholar] [CrossRef]
- Martis, R.J.; Acharya, U.R.; Lim, C.M.; Mandana, K.; Ray, A.K.; Chakraborty, C. Application of higher order cumulant features for cardiac health diagnosis using ECG signals. Int. J. Neural Syst. 2013, 23, 1350014. [Google Scholar] [CrossRef]
- Kumari, V.; Kumar, P.R. Cardiac arrhythmia prediction using improved multilayer perceptron neural network. Int. J. Electron. Commun. Instrum. Eng. Res. Dev. 2013, 3, 73–80. [Google Scholar]
- Srivastava, V.; Prasad, D. DWT-based feature extraction from ECG signal. Am. J. Eng. Res. 2013, 2, 44–50. [Google Scholar]
- Khazaee, A. Heart beat classification using particle swarm optimization. Int. J. Intell. Syst. Appl. 2013, 5, 25–33. [Google Scholar] [CrossRef]
- Jadhav, S.M.; Nalbalwar, S.L.; Ghatol, A.A. Artificial neural network models based cardiac arrhythmia disease diagnosis from ECG signal data. Int. J. Comput. Appl. 2012, 44, 8–13. [Google Scholar]
- Wang, J.-S.; Chiang, W.-C.; Yang, Y.-T.C.; Hsu, Y.-L. An effective ECG arrhythmia classification algorithm. In Proceedings of the International Conference on Intelligent Computing, Zhengzhou, China, 11–14 August 2011; pp. 545–550. [Google Scholar]
- Kamath, C. ECG beat classification using features extracted from teager energy functions in time and frequency domains. IET Signal Process. 2011, 5, 575–581. [Google Scholar] [CrossRef]
- Dallali, A.; Kachouri, A.; Samet, M. Classification of cardiac arrhythmia using WT, HRV, and fuzzy c-means clustering. Signal Process. Int. J. 2011, 5, 101–109. [Google Scholar]
- Zeraatkar, E.; Kermani, S.; Mehridehnavi, A.; Aminzadeh, A.; Zeraatkar, E.; Sanei, H. Arrhythmia detection based on morphological and time-frequency features of t-wave in electrocardiogram. J. Med. Signals Sens. 2011, 1, 99–106. [Google Scholar] [PubMed]
- Ullah, W.; Siddique, I.; Zulqarnain, R.M.; Alam, M.M.; Ahmad, I.; Raza, U.A. Classification of arrhythmia in heartbeat detection using deep learning. Comput. Intell. Neurosci. 2021, 2021, 2195922. [Google Scholar] [CrossRef] [PubMed]
- Haque, A. Cardiac Dysrhythmia Detection with Gpu-Accelerated Neural Networks; Computer Science Department, Stanford University: Stanford, CA, USA, 2014. [Google Scholar]
- Huanhuan, M.; Yue, Z. Classification of electrocardiogram signals with deep belief networks. In Proceedings of the 2014 IEEE 17th International Conference on Computational Science and Engineering, Chengdu, China, 19–21 December 2014; pp. 7–12. [Google Scholar]
- Dmitrievich, I.A. Deep Learning in Information Analysis of Electrocardiogram Signals for Disease Diagnostics. Bachelor’s Thesis, Moscow Institute of Physics and Technology, Dolgoprudny, Russia, 2015. [Google Scholar]
- Gupta, A.; Banerjee, A.; Babaria, D.; Lotlikar, K.; Raut, H. Prediction and classification of cardiac Arrhythmia. In Proceedings of the Sentimental Analysis and Deep Learning, Hat Yai, Thailand, 18–19 June 2021; pp. 527–538. [Google Scholar]
- Ayatollahi, H.; Gholamhosseini, L.; Salehi, M. Predicting coronary artery disease: A comparison between two data mining algorithms. BMC Public Health 2019, 19, 448. [Google Scholar] [CrossRef]
- Ayon, S.I.; Islam, M.M.; Hossain, M.R. Coronary artery heart disease prediction: A comparative study of computational intelligence techniques. IETE J. Res. 2020, 68, 2488–2507. [Google Scholar] [CrossRef]
- Ramesh, G.; Satyanarayana, D.; Sailaja, M. Composite feature vector based cardiac arrhythmia classification using convolutional neural networks. J. Ambient Intell. Humaniz. Comput. 2021, 12, 6465–6478. [Google Scholar] [CrossRef]
- Botros, M.; Curry, E.J.; Yin, J.; Jawa, A.; Eichinger, J.K.; Li, X. Reverse shoulder arthroplasty has higher perioperative implant complications and transfusion rates than total shoulder arthroplasty. JSES Open Access 2019, 3, 108–112. [Google Scholar] [CrossRef] [PubMed]
- Arooj, S.; Rehman, S.U.; Imran, A.; Almuhaimeed, A.; Alzahrani, A.K.; Alzahrani, A. A Deep Convolutional Neural Network for the Early Detection of Heart Disease. Biomedicines 2022, 10, 2796. [Google Scholar] [CrossRef] [PubMed]
- Jinjri, W.M.; Keikhosrokiani, P.; Abdullah, N.L. Machine learning algorithms for the classification of cardiovascular disease-A comparative study. In Proceedings of the 2021 International Conference on Information Technology (ICIT), Amman, Jordan, 14–15 July 2021; pp. 132–138. [Google Scholar]
- Sraitih, M.; Jabrane, Y.; Atlas, A. An overview on machine learning methods for ECG Heartbeat Arrhythmia Classification. In Proceedings of the 2021 International Conference on Digital Age & Technological Advances for Sustainable Development (ICDATA), Marrakech, Morocco, 29–30 June 2021; pp. 8–14. [Google Scholar]
- Zarei, R. Developing Enhanced Classification Methods for ECG and EEG Signals. Ph.D. Thesis, Victoria University, Melbourne, VIC, Australia, 2017. [Google Scholar]
- Sharma, L.; Tripathy, R.; Dandapat, S. Multiscale energy and eigenspace approach to detection and localization of myocardial infarction. IEEE Trans. Biomed. Eng. 2015, 62, 1827–1837. [Google Scholar] [CrossRef]
- Houssein, E.H.; Abdelminaam, D.S.; Ibrahim, I.E.; Hassaballah, M.; Wazery, Y.M. A hybrid heartbeats classification approach based on marine predators algorithm and convolution neural networks. IEEE Access 2021, 9, 86194–86206. [Google Scholar] [CrossRef]
- Ardakani, A.A.; Kanafi, A.R.; Acharya, U.R.; Khadem, N.; Mohammadi, A. Application of deep learning technique to manage COVID-19 in routine clinical practice using CT images: Results of 10 convolutional neural networks. Comput. Biol. Med. 2020, 121, 103795. [Google Scholar] [CrossRef]
- Janarthanan, S.; Ganesh Kumar, T.; Janakiraman, S.; Dhanaraj, R.K.; Shah, M.A. An Efficient Multispectral Image Classification and Optimization Using Remote Sensing Data. J. Sens. 2022, 2022, 2004716. [Google Scholar] [CrossRef]


| S.No | Ref. No | Detection Techniques | Accuracy (%) |
|---|---|---|---|
| 1 | Atrial Fibrillation Detection Based on a Residual CNN Using BCG Signals (2022) [3] | CNN | 96.8 |
| 2 | An automated detection of heart arrhythmias using machine learning technique: SVM (2021) [11] | SVM | 95.92 |
| 3 | ECG signal classification with binarized convolutional neural network (2020) [12] | BNN | 86.8 |
| 4 | Arrhythmia Classifier using Binarized Convolutional Neural Network for Resource-Constrained Devices (2022) [13] | BCNN | 96.45 |
| 5 | Arrhythmia classification with ECG signals based on the optimization-enabled deep convolutional neural network (2020) [4] | CNN | 93.19 |
| 6 | Optimal multi-stage arrhythmia classification approach (2020) [14] | Extreme gradient boosting tree | 97 |
| 7 | Low-power ECG arrhythmia detection SoC with STT-MRAM and LDMAC unit (2021) [15] | STT-MRAM | 85.1 |
| 8 | Classification of Obstructive Sleep Apnoea from single-lead ECG signals using convolutional neural and Long Short Term Memory networks (2021) [5] | CNN, LSTM | 90.92 |
| 9 | Cardiac arrhythmia detection using deep learning (2017) [6] | DCNN | 92 |
| 10 | Multiresolution wavelet transform-based feature extraction and ECG classification to detect cardiac abnormalities (2017) [16] | SVM | 98.9 |
| 11 | High-performance personalized heartbeat classification model for long-term ECG signal (2017) [17] | GRNN | 88 |
| 12 | A new personalized ECG signal classification algorithm using block-based neural network and particle swarm optimiza-tion (2016) [18] | BBNN | 97 |
| 13 | An approach for ECG beats classification using adaptive neuro-fuzzy inference system (2016) [19] | ANFIS | 96 |
| 14 | An automated ECG beat classification system using deep neural networks with an unsupervised feature extraction technique (2019) [20] | DL | 99.73 |
| 15 | Arrhythmic heartbeat classification using ensemble of random forest and support vector machine algorithm (2021) [21] | SVM, RF | 98.21 |
| 16 | Electrocardiogram soft computing using hybrid deep learning CNN-ELM (2020) [22] | CNN + EML | 97.50 |
| 17 | ECG beat classification using PCA, LDA, ICA and discrete wavelet transform (2013) [23] | SVM | 99.28 |
| 18 | Application of higher-order cumulant features for cardiac health diagnosis using ECG signals (2013) [24] | NN, LS-SVM | 94.52 |
| 19 | Cardiac arrhythmia prediction using improved multilayer perceptron neural network (2013) [25] | MLPNN | 95.1 |
| 20 | DWT-based feature extraction from ECG signal (2013) [26] | MLPNN | 85 |
| 21 | Heartbeat classification using particle swarm optimization (2013) [27] | BMLPNN | 76 |
| 22 | Artificial neural network models based cardiac arrhythmia disease diagnosis from ECG signal data (2012) [28] | MNN-generalized FFNN | 86.67 |
| 23 | An effective ECG arrhythmia classification algorithm (2011) [29] | PNN | 99.71 |
| 24 | ECG beat classification using features extracted from teager energy functions in time and frequency domains (2011) [30] | NN | 95 |
| 25 | Classification of cardiac arrhythmia using WT, HRV, and fuzzy c-means clustering (2011) [31] | FCM-HRV | 99.05 |
| 26 | Arrhythmia detection based on morphological and time-frequency features of t-wave in electrocardiogram (2011) [32] | MLP, ANN | 96.7 |
| 27 | Classification of arrhythmia in heartbeat detection using deep learning (2021) [33] | CNN + LSTM + Attention | 99.29 |
| S/No. | Class | Beats Type | Number of Beats |
|---|---|---|---|
| 1 | N | Normal beat | 90,589 |
| 2 | S | Supraventricular premature beat | 8039 |
| 3 | V | Premature ventricular contraction | 7236 |
| 4 | F | Fusion of ventricular and normal beat | 2779 |
| 5 | Q | Unclassifiable beat | 803 |
| Total number of beats in the MIT-BIH dataset for training | 109,446 | ||
Disclaimer/Publisher’s Note: The statements, opinions and data contained in all publications are solely those of the individual author(s) and contributor(s) and not of MDPI and/or the editor(s). MDPI and/or the editor(s) disclaim responsibility for any injury to people or property resulting from any ideas, methods, instructions or products referred to in the content. |
© 2023 by the authors. Licensee MDPI, Basel, Switzerland. This article is an open access article distributed under the terms and conditions of the Creative Commons Attribution (CC BY) license (https://creativecommons.org/licenses/by/4.0/).
Share and Cite
Haq, S.U.; Bazai, S.U.; Fatima, A.; Marjan, S.; Yang, J.; Por, L.Y.; Anjum, M.; Shahab, S.; Ku, C.S. Reseek-Arrhythmia: Empirical Evaluation of ResNet Architecture for Detection of Arrhythmia. Diagnostics 2023, 13, 2867. https://doi.org/10.3390/diagnostics13182867
Haq SU, Bazai SU, Fatima A, Marjan S, Yang J, Por LY, Anjum M, Shahab S, Ku CS. Reseek-Arrhythmia: Empirical Evaluation of ResNet Architecture for Detection of Arrhythmia. Diagnostics. 2023; 13(18):2867. https://doi.org/10.3390/diagnostics13182867
Chicago/Turabian StyleHaq, Shams Ul, Sibghat Ullah Bazai, Ali Fatima, Shah Marjan, Jing Yang, Lip Yee Por, Mohd Anjum, Sana Shahab, and Chin Soon Ku. 2023. "Reseek-Arrhythmia: Empirical Evaluation of ResNet Architecture for Detection of Arrhythmia" Diagnostics 13, no. 18: 2867. https://doi.org/10.3390/diagnostics13182867