
Reduced Left Ventricular Twist Early after Acute ST-Segment Elevation Myocardial Infarction as a Predictor of Left Ventricular Adverse Remodelling

 , , , ,
Abstract
:1. Introduction
2. Materials and Methods
2.1. Study Population
2.2. Clinical and Humoral Variables
2.3. Ecocardiography
2.4. Statistical Analysis
3. Results
3.1. Patients’ Characterisitics
3.2. Cardiac Remodelling
4. Discussion
5. Conclusions
6. Limitations
Author Contributions
Funding
Institutional Review Board Statement
Informed Consent Statement
Data Availability Statement
Conflicts of Interest
References
- Hartley, A.; Marshall, D.C.; Salciccioli, J.D.; Sikkel, M.B.; Maruthappu, M.; Shalhoub, J. Trends in mortality from ischemic heart disease and cerebrovascular disease in Europe: 1980 to 2009. Circulation 2016, 133, 1916–1926. [Google Scholar] [CrossRef]
- Sugiyama, T.; Hasegawa, K.; Kobayashi, Y.; Takahashi, O.; Fukui, T.; Tsugawa, Y. Differential time trends of outcomes and costs of care for acute myocardial infarction hospitalizations by ST elevation and type of intervention in the United States, 2001–2011. J. Am. Heart Assoc. 2015, 4, e001445. [Google Scholar] [CrossRef] [PubMed]
- McManus, D.D.; Gore, J.; Yarzebski, J.; Spencer, F.; Lessard, D.; Goldberg, R.J. Recent trends in the incidence, treatment, and outcomes of patients with STEMI and NSTEMI. Am. J. Med. 2011, 124, 40–47. [Google Scholar] [CrossRef] [PubMed]
- Puymirat, E.; Simon, T.; Steg, P.G.; Schiele, F.; Gueret, P.; Blanchard, D.; Khalife, K.; Goldstein, P.; Cattan, S.; Vaur, L.; et al. FAST MI Investigators. Association of changes in clinical characteristics and management with improvement in survival among patients with ST-elevation myocardial infarction. JAMA 2012, 308, 998–1006. [Google Scholar] [CrossRef] [PubMed]
- Velagaleti, R.S.; Pencina, M.J.; Murabito, J.M.; Wang, T.J.; Parikh, N.I.; D’Agostino, R.B.; Levy, D.; Kannel, W.B.; Vasan, R.S. Long-term trends in the incidence of heart failure after myocardial infarction. Circulation 2008, 118, 2057–2062. [Google Scholar] [CrossRef] [PubMed]
- Desta, L.; Jernberg, T.; Lofman, I.; Hofman-Bang, C.; Hagerman, I.; Spaak, J.; Persson, H. Incidence, temporal trends, and prognostic impact of heart failure complicating acute myocardial infarction. The SWEDEHEART Registry (Swedish Web-System for Enhancement and Development of Evidence-Based Care in Heart Disease Evaluated According to Recommended Therapies): A study of 199,851 patients admitted with index acute myocardial infarctions, 1996 to 2008. JACC Heart Fail 2015, 3, 234–242. [Google Scholar]
- Tennant, R.; Wiggers, C.J. The effect of coronary occlusion on myocardial contraction. Am. J. Physiol. Leg. Content 1935, 112, 351–361. [Google Scholar] [CrossRef]
- Burchfield, J.S.; Xie, M.; Hill, J.A. Pathological ventricular remodeling: Mechanisms: Part 1 of 2. Circulation 2013, 128, 388–400. [Google Scholar] [CrossRef]
- White, H.D.; Norris, R.M.; Brown, M.A.; Brandt, P.W.; Whitlock, R.M.; Wild, C.J. Left ventricular end-systolic volume as the major determinant of survival after recovery from myocardial infarction. Circulation 1987, 76, 44–51. [Google Scholar] [CrossRef]
- Bolognese, L.; Neskovic, A.N.; Parodi, G.; Cerisano, G.; Buonamici, P.; Santoro, G.M.; Antoniucci, D. Left ventricular remodeling after primary coronary angioplasty: Patterns of left ventricular dilation and long-term prognostic implications. Circulation 2002, 106, 2351–2357. [Google Scholar] [CrossRef]
- Kloner, R.A.; Jennings, R.B. Consequences of brief ischemia: Stunning, preconditioning, and their clinical implications: Part 1. Circulation 2001, 104, 2981–2989. [Google Scholar] [CrossRef] [PubMed]
- Leitman, M.; Lysiansky, M.; Lysyansky, P.; Friedman, Z.; Tyomkin, V.; Fuchs, T.; Adam, D.; Krakover, R.; Vered, Z. Circumferential and longitudinal strain in 3 myocardial layers in normal subjects and in patients with regional left ventricular dysfunction. J. Am. Soc. Echocardiogr. 2010, 23, 64–70. [Google Scholar] [CrossRef]
- Liu, C.; Li, J.; Ren, M.; Wang, Z.Z.; Li, Z.Y.; Gao, F.; Tian, J.W. Multilayer longitudinal strain at rest may help to predict significant stenosis of the left anterior descending coronary artery in patients with suspected non-ST-elevation acute coronary syndrome. Int. J. Cardiovasc. Imaging 2016, 32, 1675–1685. [Google Scholar] [CrossRef] [PubMed]
- Greenbaum, R.A.; Ho, S.Y.; Gibson, D.G.; Becker, A.E.; Anderson, R.H. Left ventricular fibre architecture in man. Br. Heart J. 1981, 45, 248–263. [Google Scholar] [CrossRef]
- Torrent-Guasp, F.; Kocica, M.J.; Corno, A.F.; Komeda, M.; Carreras-Costa, F.; Flotats, A.; Cosin-Aguillar, J.; Wen, H. Towards new understanding of the heart structure and function. Eur. J. Cardiothorac. Surg. 2005, 27, 191–201. [Google Scholar] [CrossRef] [PubMed]
- Garot, J.; Pascal, O.; Diébold, B.; Derumeaux, G.; Gerber, B.L.; Dubois-Randé, J.L.; Lima, J.A.; Guéret, P. Alterations of systolic left ventricular twist after acute myocardial infarction. Am. J. Physiol. Heart Circ. Physiol. 2002, 282, H357–H362. [Google Scholar] [CrossRef]
- Kroeker, C.A.; Tyberg, J.V.; Beyar, R. Effects of ischemia on left ventricular apex rotation. An experimental study in anesthetized dogs. Circulation 1995, 92, 3539–3548. [Google Scholar] [CrossRef]
- Kim, H.K.; Sohn, D.W.; Lee, S.E.; Choi, S.Y.; Park, J.S.; Kim, Y.J.; Oh, B.H.; Park, Y.B.; Choi, Y.S. Assessment of left ventricular rotation and torsion with two-dimensional speckle tracking echocardiography. J. Am. Soc. Echocardiogr. 2007, 20, 45–53. [Google Scholar] [CrossRef]
- Takeuchi, M.; Nishikage, T.; Nakai, H.; Kokumai, M.; Otani, S.; Lang, R.M. The assessment of left ventricular twist in anterior wall myocardial infarction using two-dimensional speckle tracking imaging. J. Am. Soc. Echocardiogr. 2007, 20, 36–44. [Google Scholar] [CrossRef]
- Ibanez, B.; James, S.; Agewall, S.; Antunes, M.J.; Bucciarelli-Ducci, C.; Bueno, H.; Caforio, A.L.P.; Crea, F.; Goudevenos, J.A.; Halvorsen, S.; et al. 2017 ESC Guidelines for the management of acute myocardial infarction in patients presenting with STsegment elevation: The Task Force for the management of acute myocardial infarction in patients presenting with ST-segment elevation of the European Society of Cardiology (ESC). Eur. Heart J. 2017, 39, 119–177. [Google Scholar]
- Haugaa, K.H.; Grenne, B.L.; Eek, C.H.; Ersbølll, M.; Valeur, N.; Svendsen, J.H.; Florian, A.; Sjøli, B.; Brunvand, H.; Køber, L.; et al. Strain echocardiography improves risk prediction of ventricular arrhythmias after myocardial infarction. JACC Cardiovasc. Imaging 2013, 6, 841–850. [Google Scholar] [CrossRef] [PubMed]
- Lang, R.M.; Badano, L.P.; Mor-Avi, V.; Afilalo, J.; Armstrong, A.; Ernande, L.; Flachskampf, F.A.; Foster, E.; Goldstein, S.A.; Kuznetsova, T.; et al. Recommendations for cardiac chamber quantification by echocardiography in adults: An update from the American Society of Echocardiography and the European Association of Cardiovascular Imaging. Eur. Heart J.-Cardiovasc. Imaging 2015, 16, 233–271. [Google Scholar] [CrossRef] [PubMed]
- Nagueh, S.F.; Smiseth, O.A.; Appleton, C.P.; Byrd, B.F.; Dokainish, H.; Edvardsen, T.; Flachskampf, F.A.; Gillebert, T.C.; Klein, A.L.; Lancellotti, P.; et al. Recommendations for the Evaluation of Left Ventricular Diastolic Function by Echocardiography: An Update from the American Society of Echocardiography and the European Association of Cardiovascular Imaging. J. Am. Soc. Echocardiogr. 2016, 29, 277–314. [Google Scholar] [CrossRef]
- Westholm, C.; Johnson, J.; Sahlen, A.; Winter, R.; Jernberg, T. Peak systolic velocity using color-coded tissue Doppler imaging, a strong and independent predictor of outcome in acute coronary syndrome patients. Cardiovasc. Ultrasound 2013, 11, 9. [Google Scholar] [CrossRef]
- Gc, V.S.; Alshurafa, M.; Sturgess, D.J.; Ting, J.; Gregory, K.; Gonçalves, A.S.O.; Whitty, J.A. Cost-minimisation analysis alongside a pilot study of early Tissue Doppler Evaluation of Diastolic Dysfunction in Emergency Department Non-ST Elevation Acute Coronary Syndromes (TEDDy-NSTEACS). BMJ Open 2019, 9, e023920. [Google Scholar] [CrossRef] [PubMed]
- Mornos, C.; Petrescu, L.; Ionac, A.; Cozma, D. The prognostic value of a new tissue Doppler parameter in patients with heart failure. Int. J. Cardiovasc. Imaging 2014, 30, 47–55. [Google Scholar] [CrossRef]
- Skaarup, K.G.; Iversen, A.; Jørgensen, P.G.; Olsen, F.J.; Grove, G.L.; Jensen, J.S.; Biering-Sørensen, T. Association between layer-specific global longitudinal strain and adverse outcomes following acute coronary syndrome. Eur. Heart J. Cardiovasc. Imaging 2018, 19, 1334–1342. [Google Scholar] [CrossRef]
- Vartdal, T.; Brunvand, H.; Pettersen, E.; Smith, H.J.; Lyseggen, E.; Helle-Valle, T.; Skulstad, H.; Ihlen, H.; Edvardsen, T. Early prediction of infarct size by strain Doppler echocardiography after coronary reperfusion. J. Am. Coll. Cardiol. 2007, 49, 1715–1721. [Google Scholar] [CrossRef]
- Sutherland, G.R.; Di Salvo, G.; Claus, P.; D’hooge, J.; Bijnens, B. Strain and strain rate imaging: A new clinical approach to quantifying regional myocardial function. J. Am. Soc. Echocardiogr. 2004, 17, 788–802. [Google Scholar] [CrossRef]
- Edvardsen, T.; Skulstad, H.; Aakhus, S.; Urheim, S.; Ihlen, H. Regional myocardial systolic function during acute myocardial ischemia assessed by strain Doppler echocardiography. J. Am. Coll. Cardiol. 2001, 37, 726–730. [Google Scholar] [CrossRef]
- Götte, M.J.; van Rossum, A.C.; Twisk, J.W.R.; Kuijer, J.P.A.; Marcus, J.T.; Visser, C.A. Quantification of regional contractile function after infarction: Strain analysis superior to wall thickening analysis in discriminating infarct from remote myocardium. J. Am. Coll. Cardiol. 2001, 37, 808–817. [Google Scholar] [CrossRef] [PubMed]
- Bendary, A.; Tawfeek, W.; Mahros, M.; Salem, M. The predictive value of global longitudinal strain on clinical outcome in patients with ST-segment elevation myocardial infarction and preserved systolic function. Echocardiography 2018, 35, 915–921. [Google Scholar] [CrossRef] [PubMed]
- Goedemans, L.; Abou, R.; Hoogslag, G.E.; Ajmone Marsan, N.; Delgado, V.; Bax, J.J. Left ventricular global longitudinal strain and long-term prognosis in patients with chronic obstructive pulmonary disease after acute myocardial infarction. Eur. Heart J. Cardiovasc. Imaging. 2019, 20, 56–65. [Google Scholar] [CrossRef] [PubMed]
- Reimer, K.A.; Lowe, J.E.; Rasmussen, M.M.; Jennings, R.B. The wavefront phenomenon of ischemic cell death. 1. Myocardial infarct size vs duration of coronary occlusion in dogs. Circulation 1977, 56, 786–794. [Google Scholar] [CrossRef] [PubMed]
- Hamada, S.; Schroeder, J.; Hoffmann, R.; Altiok, E.; Keszei, A.; Almalla, M.; Napp, A.; Marx, N.; Becker, M. Prediction of outcomes in patients with chronic ischemic cardiomyopathy by layer-specific strain echocardiography: A proof of concept. J. Am. Soc. Echocardiogr. 2016, 29, 412–420. [Google Scholar] [CrossRef] [PubMed]
- Song, C.F.; Zhou, Q.; Guo, R.Q. Alteration in the global and regional myocardial strain patterns in patients with inferior ST-elevation myocardial infarction prior to and after percutaneous coronary intervention. Kaohsiung J. Med. Sci. 2014, 30, 29–34. [Google Scholar] [CrossRef]
- Lower, R. Tractatus de Corde; Oxford University Press: London, UK, 1669. [Google Scholar]
- Sun, J.P.; Niu, J.; Chou, D.; Chuang, H.H.; Wang, K.; Drinko, J.; Borowski, A.; Stewart, W.J.; Thomas, J.D. Alterations of regional myocardial function in a swine model of myocardial infarction assessed by echocardiographic 2-dimensional strain imaging. J. Am. Soc. Echocardiogr. 2007, 20, 498–504. [Google Scholar] [CrossRef]
- Bansal, M.; Leano, R.L.; Marwick, T.H. Clinical assessment of left ventricular systolic torsion: Effects of myocardial infarction and ischemia. J. Am. Soc. Echocardiogr. 2008, 21, 887–894. [Google Scholar] [CrossRef]
- Bertini, M.; Nucifora, G.; Marsan, N.A.; Delgado, V.; van Bommel, R.J.; Boriani, G.; Biffi, M.; Holman, E.R.; Van der Wall, E.E.; Schalij, M.J.; et al. Left ventricular rotational mechanics in acute myocardial infarction and in chronic (ischemic and nonischemic) heart failure patients. Am. J. Cardiol. 2009, 103, 1506–1512. [Google Scholar] [CrossRef]
- Gheorghiade, M.; Bonow, R.O. Chronic heart failure in the United States: A manifestation of coronary artery disease. Circulation 1998, 97, 282. [Google Scholar] [CrossRef]
- Goldberg, R.J.; Konstam, M.A. Assessing the population burden from heart failure: Need for sentinel population-based surveillance systems. Arch. Intern. Med. 1999, 159, 15. [Google Scholar] [CrossRef]
- Luca, C.-T.; Crisan, S.; Cozma, D.; Negru, A.; Lazar, M.-A.; Vacarescu, C.; Trofenciuc, M.; Rachieru, C.; Craciun, L.M.; Gaita, D.; et al. Arterial Hypertension: Individual Therapeutic Approaches—From DNA Sequencing to Gender Differentiation and New Therapeutic Targets. Pharmaceutics 2021, 13, 856. [Google Scholar] [CrossRef]
- Spinelli, L.; Morisco, C.; Assante di Panzillo, E.; Izzo, R.; Trimarco, B. Reverse left ventricular remodeling after acute myocardial infarction: The prognostic impact of left ventricular global torsion. Int. J. Cardiovasc. Imaging 2013, 29, 787–795. [Google Scholar] [CrossRef]
- Hristova, K. Recovery of the left ventricular twist and left ventricular untwist in patients with ST-segment elevation acute myocardial infarction. J. Indian. Acad. Echocardiogr. Cardiovasc. Imaging 2019, 3, 45–52. [Google Scholar] [CrossRef]
- Gad, A.; Bashandy, M.; Sharaf, A.E. Role of Left Ventricular Twist and Torsion in Assessment of Reperfusion in Acute ST-Elevation Myocardial Infarction Patients. Int. J. Med. Arts 2020, 2, 475–482. [Google Scholar] [CrossRef]
- Mielczarek, A.; Kasprzak, J.D.; Lipiec, P.; Miśkowiec, D.; Kurpesa, M.; Rechciński, T.; Szymczyk, E.; Wierzbowska-Drabik, K. Quantitative assessment of the rotation and twist of the left ventricle during dobutamine stress echocardiography: A comparison of patients with and without significant coronary artery disease. Kardiol. Pol. 2019, 77, 696–702. [Google Scholar] [CrossRef] [PubMed]


| (A) | |
| Characteristic | Overall (n = 60) |
| Age (years) Median (IQR) | 57.50 (50.00, 66.00) |
| Male sex, (n, %) | 43 (71.7%) |
| Smoking history, (n, %) | 40 (66.7%) |
| Hypertension, (n, %) | 44 (73.3%) |
| Diabetes mellitus, (n, %) | 15 (25.0%) |
| Hypercholesterolemia, (n, %) | 60 (100.0%) |
| Obesity, (n, %) Body mass index, kg/m2 | 15 (25.0%) 26.91 (25.38, 30.43) |
| Haemoglobin, (g/dL) Median (IQR) | 14.55 (13.25, 15.43) |
| Glycemia, (g/dL) Median (IQR) | 117.00 (108.00, 153.00) |
| White blood cells, (/microl) Median (IQR) | 11055.00 (9135.00, 13225.00) |
| Creatinine, (mg/dL) Median (IQR) | 1.03 (0.91, 1.16) |
| LDLc, (mg/dL) Median (IQR) | 111.00 (94.25, 132.25) |
| TG, (mg/dL) Median (IQR) | 145.00 (100.75, 197.50) |
| High-sensitivity cardiac troponin I, ng/L Median (IQR) | 7122.50 (1304.00, 33542.75) |
| Peak CK | |
| At admission | 22 (36.7%) |
| 6 h after admission | 38 (63.3%) |
| (B) | |
| Thrombolytic therapy | 25 (41.7%) |
| Thrombolytic therapy effectiveness Myocardial infarction wall | 21/25 (84.0%) |
| Anterior | 30 (50.0%) |
| Inferior | 24 (40.0%) |
| Other localisations | 6 (10.0%) |
| TIMI flow before PCI | |
| 0 | 22 (36.7%) |
| 1 | 2 (3.3%) |
| 2 | 4 (6.7%) |
| 3 | 32 (53.3%) |
| TIMI flow after PCI | |
| 0 | 3 (5.0%) |
| 1 | 2 (3.3%) |
| 2 | 2 (3.3%) |
| 3 | 53 (88.3%) |
| BMS | |
| 1 | 10 (16.7%) |
| 2 | 2 (3.3%) |
| 3 | 1 (1.7%) |
| DES | |
| 1 | 28 (46.7%) |
| 2 | 8 (13.3%) |
| 3 | 2 (3.3%) |
| 4 | 1 (1.7%) |
| Complete revascularisation, n (%) | 36 (60.0%) |
| Treatment at discharge | |
| Beta-blockers, n (%) | 48 (80.0%) |
| Spironolactone | 49 (81.7%) |
| ACEI/ARB | 42 (70.0%) |
| Variable | Initial (n = 60) Median (IQR) | 6 Months (n = 60) Median (IQR) | p Value |
|---|---|---|---|
| E, m/s | 0.69 (0.57, 0.82) | 0.70 (0.62, 0.90) | 0.056 |
| A, m/s | 0.76 (0.61, 0.92) | 0.80 (0.60, 0.90) | 0.629 |
| E/A ratio | 0.86 (0.71, 1.17) | 0.92 (0.78, 1.37) | 0.852 |
| Mean e’, m/s | 0.08 (0.07, 0.10) | 0.09 (0.07, 0.10) | 0.149 |
| E/e’ ratio | 8.00 (6.85, 10.00) | 8.44 (6.65, 10.92) | 0.651 |
| Mean s’, m/s | 0.08 (0.07, 0.09) | 0.07 (0.07, 0.09) | 0.311 |
| E/(e’×s’) ratio | 98.63 (81.09, 141.30) | 102.94 (85.85, 157.92) | 0.762 |
| RVFW s’, m/s | 0.14 (0.13, 0.16) | 0.15 (0.13, 0.17) | 0.036 * |
| Left atrial diameter, cm | 4.00 (3.60, 4.15) | 4.00 (3.70, 4.40) | 0.007 * |
| Left atrial volume, mL | 52.00 (40.00, 62.25) | 54.00 (40.00, 70.00) | 0.088 |
| Indexed left atrial volume, mL/m2 | 27.69 (20.05, 33.50) | 27.64 (20.57, 35.86) | 0.623 |
| LV end-diastolic diameter, cm | 4.96 (4.50, 5.11) | 5.00 (4.79, 5.50) | <0.001 * |
| Systolic pulmonary artery pressure, mmHg | 30.00 (25.34, 36.25) | 25.50 (21.00, 36.25) | 0.532 |
| TAPSE, mm | 22.00 (20.00, 25.00) | 24.00 (22.00, 25.25) | 0.002 * |
| LV end-diastolic volume, mL | 101.50 (83.75, 117.25) | 107.50 (94.75, 120.00) | 0.033 * |
| LV end-systolic volume, mL | 52.50 (45.50, 65.25) | 55.00 (45.00, 65.00) | 0.558 |
| LVEF (%) | 46.00 (40.75, 51.00) | 50.00 (41.75, 53.00) | 0.018 * |
| Variable | Initial (n = 60) Median (IQR) | 6 Months (n = 60) Median (IQR) | p Value |
|---|---|---|---|
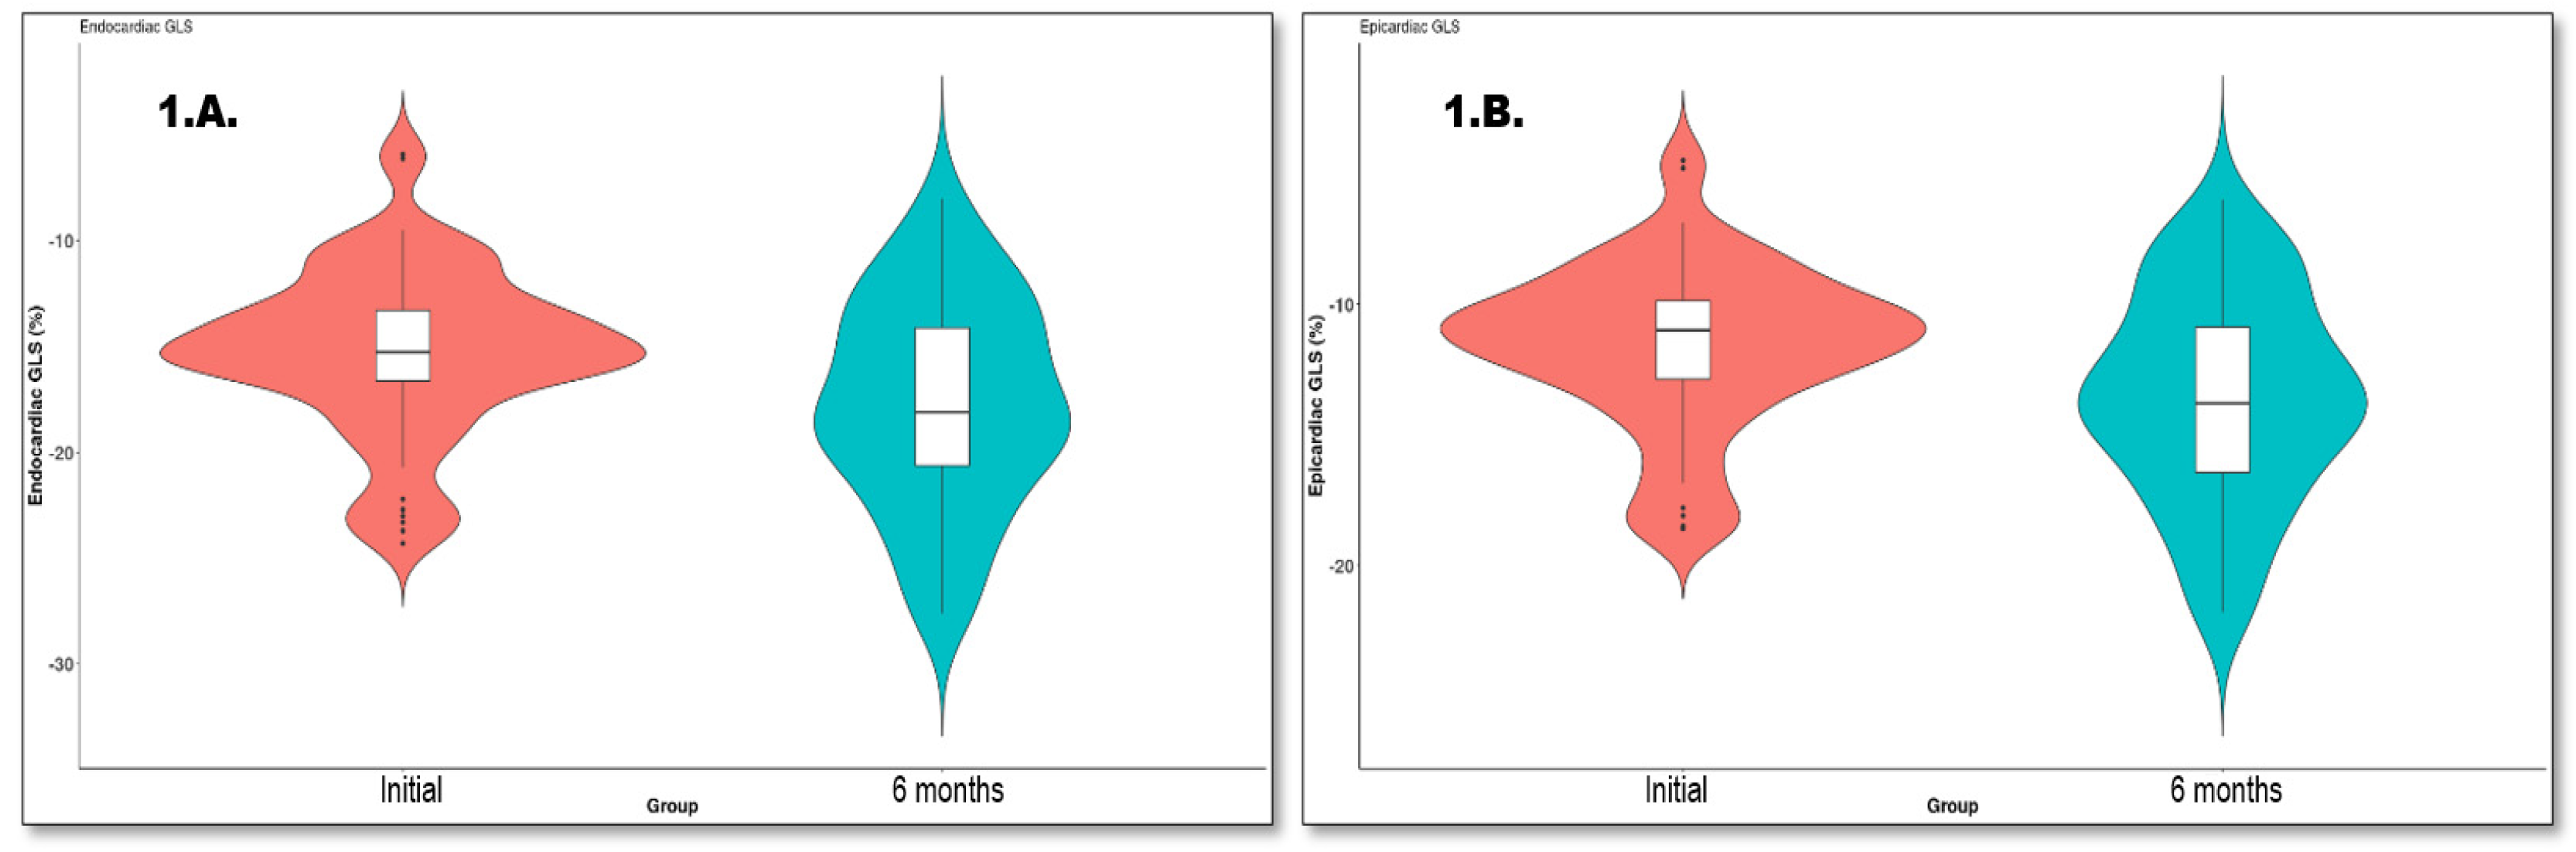
| GLS, % | −13.25 (−14.57, −11.55) | −15.60 (−18.25, −12.38) | <0.001 * |
| MD, ms | 53.50 (46.00, 65.25) | 55.00 (44.50, 68.25) | 0.762 |
| GLS/MD ratio, %/ms | −0.23 (−0.29, −0.19) | −0.27 (−0.41, −0.19) | 0.002 * |
| LS endo, % | −15.15 (−16.50, −13.20) | −18.10 (−20.62, −14.10) | <0.001 * |
| LS epi, % | −11.00 (−12.72, −9.80) | −13.80 (−16.45, −10.88) | <0.001 * |
| LS endo/epi ratio | 1.33 (1.27, 1.37) | 1.30 (1.25, 1.36) | 0.496 |
| Mid-CS endo, % | −18.50 (−22.30, −14.05) | −19.60 (−25.00, −13.50) | 0.241 |
| Mid-CS epi, % | −7.00 (−10.20, −5.70) | −8.00 (−11.05, −6.40) | 0.439 |
| Mid-CS endo/epi ratio | 2.45 (1.80, 2.83) | 2.23 (1.52, 2.79) | 0.277 |
| Base CS, % | −10.80 (−13.40, −6.40) | −11.40 (−14.20, −9.40) | 0.004 * |
| Mid-CS, % | −11.40 (−14.95, −7.40) | −12.30 (−15.10, −9.35) | 0.303 |
| Apical CS, % | −11.70 (−16.40, −8.80) | −13.20 (−18.45, −9.50) | 0.033 * |
| Base RS, % | 24.83 (14.75, 30.41) | 26.83 (15.18, 34.25) | 0.399 |
| Mid-RS, % | 20.66 (13.33, 32.00) | 24.33 (16.10, 40.05) | 0.009 * |
| Apical RS, % | 21.00 (13.00, 31.20) | 23.00 (16.33, 33.35) | 0.507 |
| Twist, ° | 9.00 (6.17, 13.28) | 9.97 (6.50, 14.79) | 0.593 |
| Variable | B | S.E | p | 95%CI for OR |
|---|---|---|---|---|
| Thrombolytic therapy | 2.853 | 0.851 | 0.001 | 1.184; 4.523 |
| ACEI/ARB | −2.389 | 0.931 | 0.013 | −4.213; −0.564 |
| LVEF | −0.363 | 0.055 | <0.001 | −0.471; −0.255 |
| E/e’ ratio | 0.227 | 0.121 | 0.066 | −0.010; 0.465 |
| Diabetes mellitus | 1.765 | 1.013 | 0.087 | −0.221; 2.847 |
| Characteristic | No Remodelling (n = 21) | Adverse Remodelling (n = 26) | Reverse Remodelling (n = 13) | p Value |
|---|---|---|---|---|
| Age, years, Median (IQR) | 57.00 (50.00, 66.00) | 62.00 (53.25, 74.00) | 52.00 (42.00, 62.00) | 0.064 |
| Male sex | 17 (81.0%) | 16 (61.5%) | 10 (76.9%) | 0.304 |
| Current smoker, n (%) | 14 (66.7%) | 17 (65.4%) | 9 (69.2%) | 0.972 |
| Systemic hypertension, n (%) | 18 (85.7%) | 20 (76.9%) | 6 (46.2%) | 0.035 * |
| Diabetes mellitus, n (%) | 8 (38.1%) | 6 (23.1%) | 1 (7.7%) | 0.132 |
| Hypercholesterolemia, n (%) | 21 (100.0%) | 26 (100.0%) | 13 (100.0%) | 0.116 |
| Obesity, n (%) | 5 (23.8%) | 6 (23.1%) | 4 (30.8%) | 0.862 |
| Height (cm), Median (IQR) | 175.0 (167.0, 178.0) | 167.0 (160.0, 175.0) | 170.0 (165.00, 174.00) | 0.047 * |
| Weight (kg), Median (IQR) | 84.0 (74.0, 90.0) | 75.0 (68.0, 86.0) | 80.0 (75.0, 81.0) | 0.248 |
| Body mass index, kg/m2, Median (IQR) | 27.45 (25.08, 32.46) | 27.05 (25.45, 30.04) | 26.40 (25.71, 28.71) | 0.769 |
| Characteristic | No Remodelling (n = 21) | Adverse Remodelling (n = 26) | Reverse Remodelling (n = 13) | p Value |
|---|---|---|---|---|
| Haemoglobin, g/dL, Median (IQR) | 14.60 (13.10, 15.60) | 14.70 (13.10, 15.10) | 14.20 (13.60, 15.00) | 0.972 |
| Blood glucose, mg/dL, Median (IQR) | 136.00 (114.00, 161.00) | 112 (107.25, 152.75) | 109.00 (108, 118) | 0.077 |
| White blood count, * 103/µL, Median (IQR) | 11.06 (9.33, 12.32) | 11.28 (9.44, 14.27) | 10.43 (8.60, 13.00) | 0.697 |
| Creatinine, mg/dL, Median (IQR) | 1.06 (0.97, 1.18) | 1.02 (0.91, 1.18) | 1.01 (0.90, 1.03) | 0.419 |
| LDLc, mg/dL, Median (IQR) | 105.0 (79.0, 129.0) | 111.50 (96.0, 126.0) | 126.0 (102.0, 147.0) | 0.132 |
| Triglycerides, mg/dL, Median (IQR) | 170.00 (122.0, 205.0) | 162.50 (116.0, 209.25) | 115.00 (65.0, 128.0) | 0.029 * |
| High-sensitivity cardiac troponin I, ng/L, Median (IQR) | 4960 (900, 26000) | 10250 (4530, 34576) | 1250 (615 11245) | 0.096 |
| Thrombolytic therapy, n (%) | 10 (47.6%) | 11 (42.3%) | 4 (30.8%) | 0.623 |
| Thrombolytic therapy effectiveness, n (%)Myocardial infarction wall | 9 (42.9%) | 8 (30.8%) | 4 (30.8%) | 0.645 |
| Anterior, n (%) | 6 (28.6%) | 18 (69.2%) | 6 (46.2%) | 0.020 * |
| Inferior, n (%) | 11 (52.4%) | 6 (23.1%) | 7 (53.8%) | 0.064 |
| Other localisations, n (%) | 4 (19.0%) | 2 (7.7%) | 0 (0.0%) | 0.173 |
| LADA, n (%) | 17 (81.0%) | 20 (76.9%) | 9 (69.2%) | 0.734 |
| Circumflex artery, n (%) | 13 (61.9%) | 7 (26.9%) | 2 (15.4%) | 0.009 * |
| Intermediate branch, n (%) | 3 (14.3%) | 1 (3.8%) | 0 (0.0%) | 0.200 |
| Complete revascularisation, n (%) | 11 (52.4%) | 15 (57.7%) | 10 (76.9%) | 0.347 |
| Body surface area, m2, Median (IQR) | 1.97 (1.85, 2.06) | 1.89 (1.74, 1.94) | 1.94 (1.85, 1.95) | 0.042 * |
| Beta-blockers, n (%) | 19 (90.5%) | 20 (76.9%) | 9 (69.2%) | 0.281 |
| Spironolactone, n (%) | 20 (95.2%) | 21 (80.8%) | 8 (61.5%) | 0.047 * |
| ACEI/ARB | 16 (76.2%) | 17 (65.4%) | 9 (69.2%) | 0.722 |
| No Remodelling (n = 21) Median (IQR) | Adverse Remodelling (n = 26) Median (IQR) | Reverse Remodelling (n = 13) Median (IQR) | p Value | |
|---|---|---|---|---|
| E, m/s | 0.62 (0.50, 0.77) | 0.70 (0.58, 0.89) | 0.76 (0.63, 0.82) | 0.354 |
| E/A ratio | 0.89 (0.72, 1.17) | 0.82 (0.63, 1.14) | 0.87 (0.80, 1.17) | 0.646 |
| Septal e’, m/s | 0.07 (0.06, 0.09) | 0.07 (0.05, 0.09) | 0.08 (0.08, 0.10) | 0.101 |
| Septal s’, m/s | 0.07 (0.06, 0.09) | 0.08 (0.06, 0.08) | 0.08 (0.07, 0.09) | 0.409 |
| Lateral e’, m/s | 0.08 (0.07, 0.10) | 0.09 (0.07, 0.10) | 0.10 (0.08, 0.13) | 0.399 |
| Lateral s’, m/s | 0.07 (0.06, 0.09) | 0.08 (0.07, 0.09) | 0.08 (0.06, 0.09) | 0.837 |
| Mean e’, m/s | 0.07 (0.07, 0.10) | 0.07 (0.07, 0.09) | 0.09 (0.08, 0.12) | 0.180 |
| E/e’ ratio | 7.53 (6.67, 8.33) | 9.07 (7.19, 11.81) | 7.41 (7.24, 8.44) | 0.193 |
| Mean s’, m/s | 0.07 (0.07, 0.08) | 0.08 (0.07, 0.09) | 0.08 (0.07, 0.09) | 0.605 |
| E/(e’_s’) ratio | 93.24 (78.22, 120.78) | 115.28 (87.85, 145.59) | 94.79 (82.05, 120.63) | 0.428 |
| RVFW s’, m/s | 0.14 (0.13, 0.14) | 0.15 (0.13, 0.17) | 0.14 (0.13, 0.16) | 0.149 |
| Left atrial volume, mL | 50.00 (36.00, 62.00) | 53.50 (44.00, 66.50) | 54.00 (42.00, 55.00) | 0.478 |
| Indexed left atrial volume, mL/m2 | 25.11 (18.59, 31.07) | 30.12 (25.75, 35.64) | 27.69 (22.60, 29.67) | 0.124 |
| Systolic pulmonary artery pressure, mmHg | 30.00 (18.00, 32.00) | 32.50 (26.50, 39.00) | 30.00 (30.00, 37.00) | 0.338 |
| TAPSE | 21.00 (20.00, 24.00) | 22.00 (21.00, 24.00) | 25.00 (22.00, 26.00) | 0.079 |
| LV end-diastolic volume, mL | 110.0 (98.0, 119.0) | 85.50 (73.0, 98.75) | 115.00 (110.0, 129.0) | <0.001 * |
| LV end-systolic volume, mL | 60.00 (50.00, 72.00) | 46.50 (37.00, 52.75) | 61.00 (50.00, 72.00) | 0.005 * |
| LVEF ejection fraction, % | 44.00 (40.00, 51.00) | 46.00 (41.50, 50.25) | 47.00 (41.00, 50.00) | 0.959 |
| Variable | No Remodelling (n = 21) Median (IQR) | Adverse Remodelling (n = 26) Median (IQR) | Reverse Remodelling (n = 13) Median (IQR) | p Value |
|---|---|---|---|---|
| GLS, % | −13.40 (−13.95, −11.40) | −13.25 (−14.65, −11.08) | −13.20 (−16.10, −12.50) | 0.587 |
| MD, ms | 59.00 (50.00, 70.00) | 54.00 (48.50, 65.50) | 45.00 (45.00, 53.00) | 0.073 |
| GLS/MD ratio, %/ms | −0.22 (−0.27, −0.18) | −0.21 (−0.29, −0.18) | −0.29 (−0.36, −0.22) | 0.076 |
| LS endo, % | −14.80 (−15.60, −13.20) | −14.55 (−16.88, −12.53) | −15.90 (−18.40, −14.80) | 0.251 |
| LS epi, % | −11.00 (−12.30, −9.40) | −11.05 (−12.30, −9.80) | −11.00 (−14.00, −10.50) | 0.453 |
| LS endo/epi ratio | 1.34 (1.26, 1.37) | 1.30 (1.27, 1.36) | 1.33 (1.27, 1.39) | 0.695 |
| Mid-CS endo, % | −17.70 (−20.30, −13.80) | −18.30 (−24.00, −14.50) | −20.00 (−25.00, −17.90) | 0.222 |
| Mid-CS epi, % | −6.80 (−9.70, −5.30) | −8.40 (−10.20, −6.20) | −7.00 (−10.70, −5.40) | 0.879 |
| Mid-CS endo/epi ratio | 1.85 (1.73, 2.79) | 2.32 (1.90, 2.78) | 2.56 (2.48, 3.10) | 0.295 |
| Base CS, % | −10.80 (−13.50, −6.10) | −10.90 (−13.90, −6.80) | −8.40 (−12.10, −7.20) | 0.879 |
| Mid-CS, % | −10.50 (−13.80, −7.00) | −11.50 (−16.70, −8.30) | −11.90 (−14.20, −7.40) | 0.456 |
| Apical CS, % | −11.20 (−16.50, −8.40) | −12.00 (−15.40, −9.90) | −14.00 (−18.00, −8.80) | 0.671 |
| Base RS, % | 21.20 (11.83, 28.83) | 24.83 (14.83, 30.33) | 29.66 (25.10, 35.00) | 0.184 |
| Mid-RS, % | 15.00 (9.16, 29.20) | 20.66 (16.16, 29.66) | 27.16 (26.30, 34.00) | 0.064 |
| Apical RS, % | 19.50 (9.16, 24.33) | 21.83 (14.16, 34.33) | 26.83 (18.00, 30.10) | 0.123 |
| Twist, ° | 9.45 (8.00, 14.95) | 7.50 (4.64, 10.14) | 11.00 (6.15, 14.78) | 0.124 |
| Variable | β | S.E | p | OR | 95%CI for OR |
|---|---|---|---|---|---|
| Age | 0.095 | 0.037 | 0.05 | 1.100 | 1.029; 1.176 |
| Triglycerides | 0.009 | 0.004 | 0.027 | 1.009 | 1.001; 1.017 |
| Twist | −0.166 | 0.074 | 0.024 | 0.847 | 0.733; 0.978 |
| Mid-RS | 0.058 | 0.027 | 0.032 | 1.060 | 1.005; 1.117 |
| Marker | AUROC | SE AUROC | Lower Limit | Upper Limit | Z Statistic | p-Value |
|---|---|---|---|---|---|---|
| Twist | 0.64819 | 0.07233789 | 0.5064104 | 0.7899697 | 2.048581 | 0.04050307 |
| Optimal Cut-Off Method: Youden Optimal Cut-Off Point: 11° Performance Measures | |||
|---|---|---|---|
| Values | Lower Limit | Upper Limit | |
| Sensitivity | 0.471 | 0.298 | 0.649 |
| Specificity | 0.769 | 0.564 | 0.910 |
| Positive Prediction Value | 0.727 | 0.508 | 0.857 |
| Negative Prediction Value | 0.526 | 0.346 | 0.722 |
| Positive Likelihood Ratio | 2.039 | 0.928 | 4.480 |
| Negative Likelihood Ratio | 0.688 | 0.470 | 1.007 |
Disclaimer/Publisher’s Note: The statements, opinions and data contained in all publications are solely those of the individual author(s) and contributor(s) and not of MDPI and/or the editor(s). MDPI and/or the editor(s) disclaim responsibility for any injury to people or property resulting from any ideas, methods, instructions or products referred to in the content. |
© 2023 by the authors. Licensee MDPI, Basel, Switzerland. This article is an open access article distributed under the terms and conditions of the Creative Commons Attribution (CC BY) license (https://creativecommons.org/licenses/by/4.0/).
Share and Cite
Lazăr, M.-A.; Ionac, I.; Luca, C.-T.; Petrescu, L.; Vacarescu, C.; Crisan, S.; Gaiță, D.; Cozma, D.; Sosdean, R.; Arnăutu, D.-A.; et al. Reduced Left Ventricular Twist Early after Acute ST-Segment Elevation Myocardial Infarction as a Predictor of Left Ventricular Adverse Remodelling. Diagnostics 2023, 13, 2896. https://doi.org/10.3390/diagnostics13182896
Lazăr M-A, Ionac I, Luca C-T, Petrescu L, Vacarescu C, Crisan S, Gaiță D, Cozma D, Sosdean R, Arnăutu D-A, et al. Reduced Left Ventricular Twist Early after Acute ST-Segment Elevation Myocardial Infarction as a Predictor of Left Ventricular Adverse Remodelling. Diagnostics. 2023; 13(18):2896. https://doi.org/10.3390/diagnostics13182896
Chicago/Turabian StyleLazăr, Mihai-Andrei, Ioana Ionac, Constantin-Tudor Luca, Lucian Petrescu, Cristina Vacarescu, Simina Crisan, Dan Gaiță, Dragos Cozma, Raluca Sosdean, Diana-Aurora Arnăutu, and et al. 2023. "Reduced Left Ventricular Twist Early after Acute ST-Segment Elevation Myocardial Infarction as a Predictor of Left Ventricular Adverse Remodelling" Diagnostics 13, no. 18: 2896. https://doi.org/10.3390/diagnostics13182896