
Hybrid Methods for Fundus Image Analysis for Diagnosis of Diabetic Retinopathy Development Stages Based on Fusion Features
 ,
,
Abstract
:1. Introduction
- Enhancement of fundus images with average and Laplacian filters and merging the filters’ outputs to obtain an improved image.
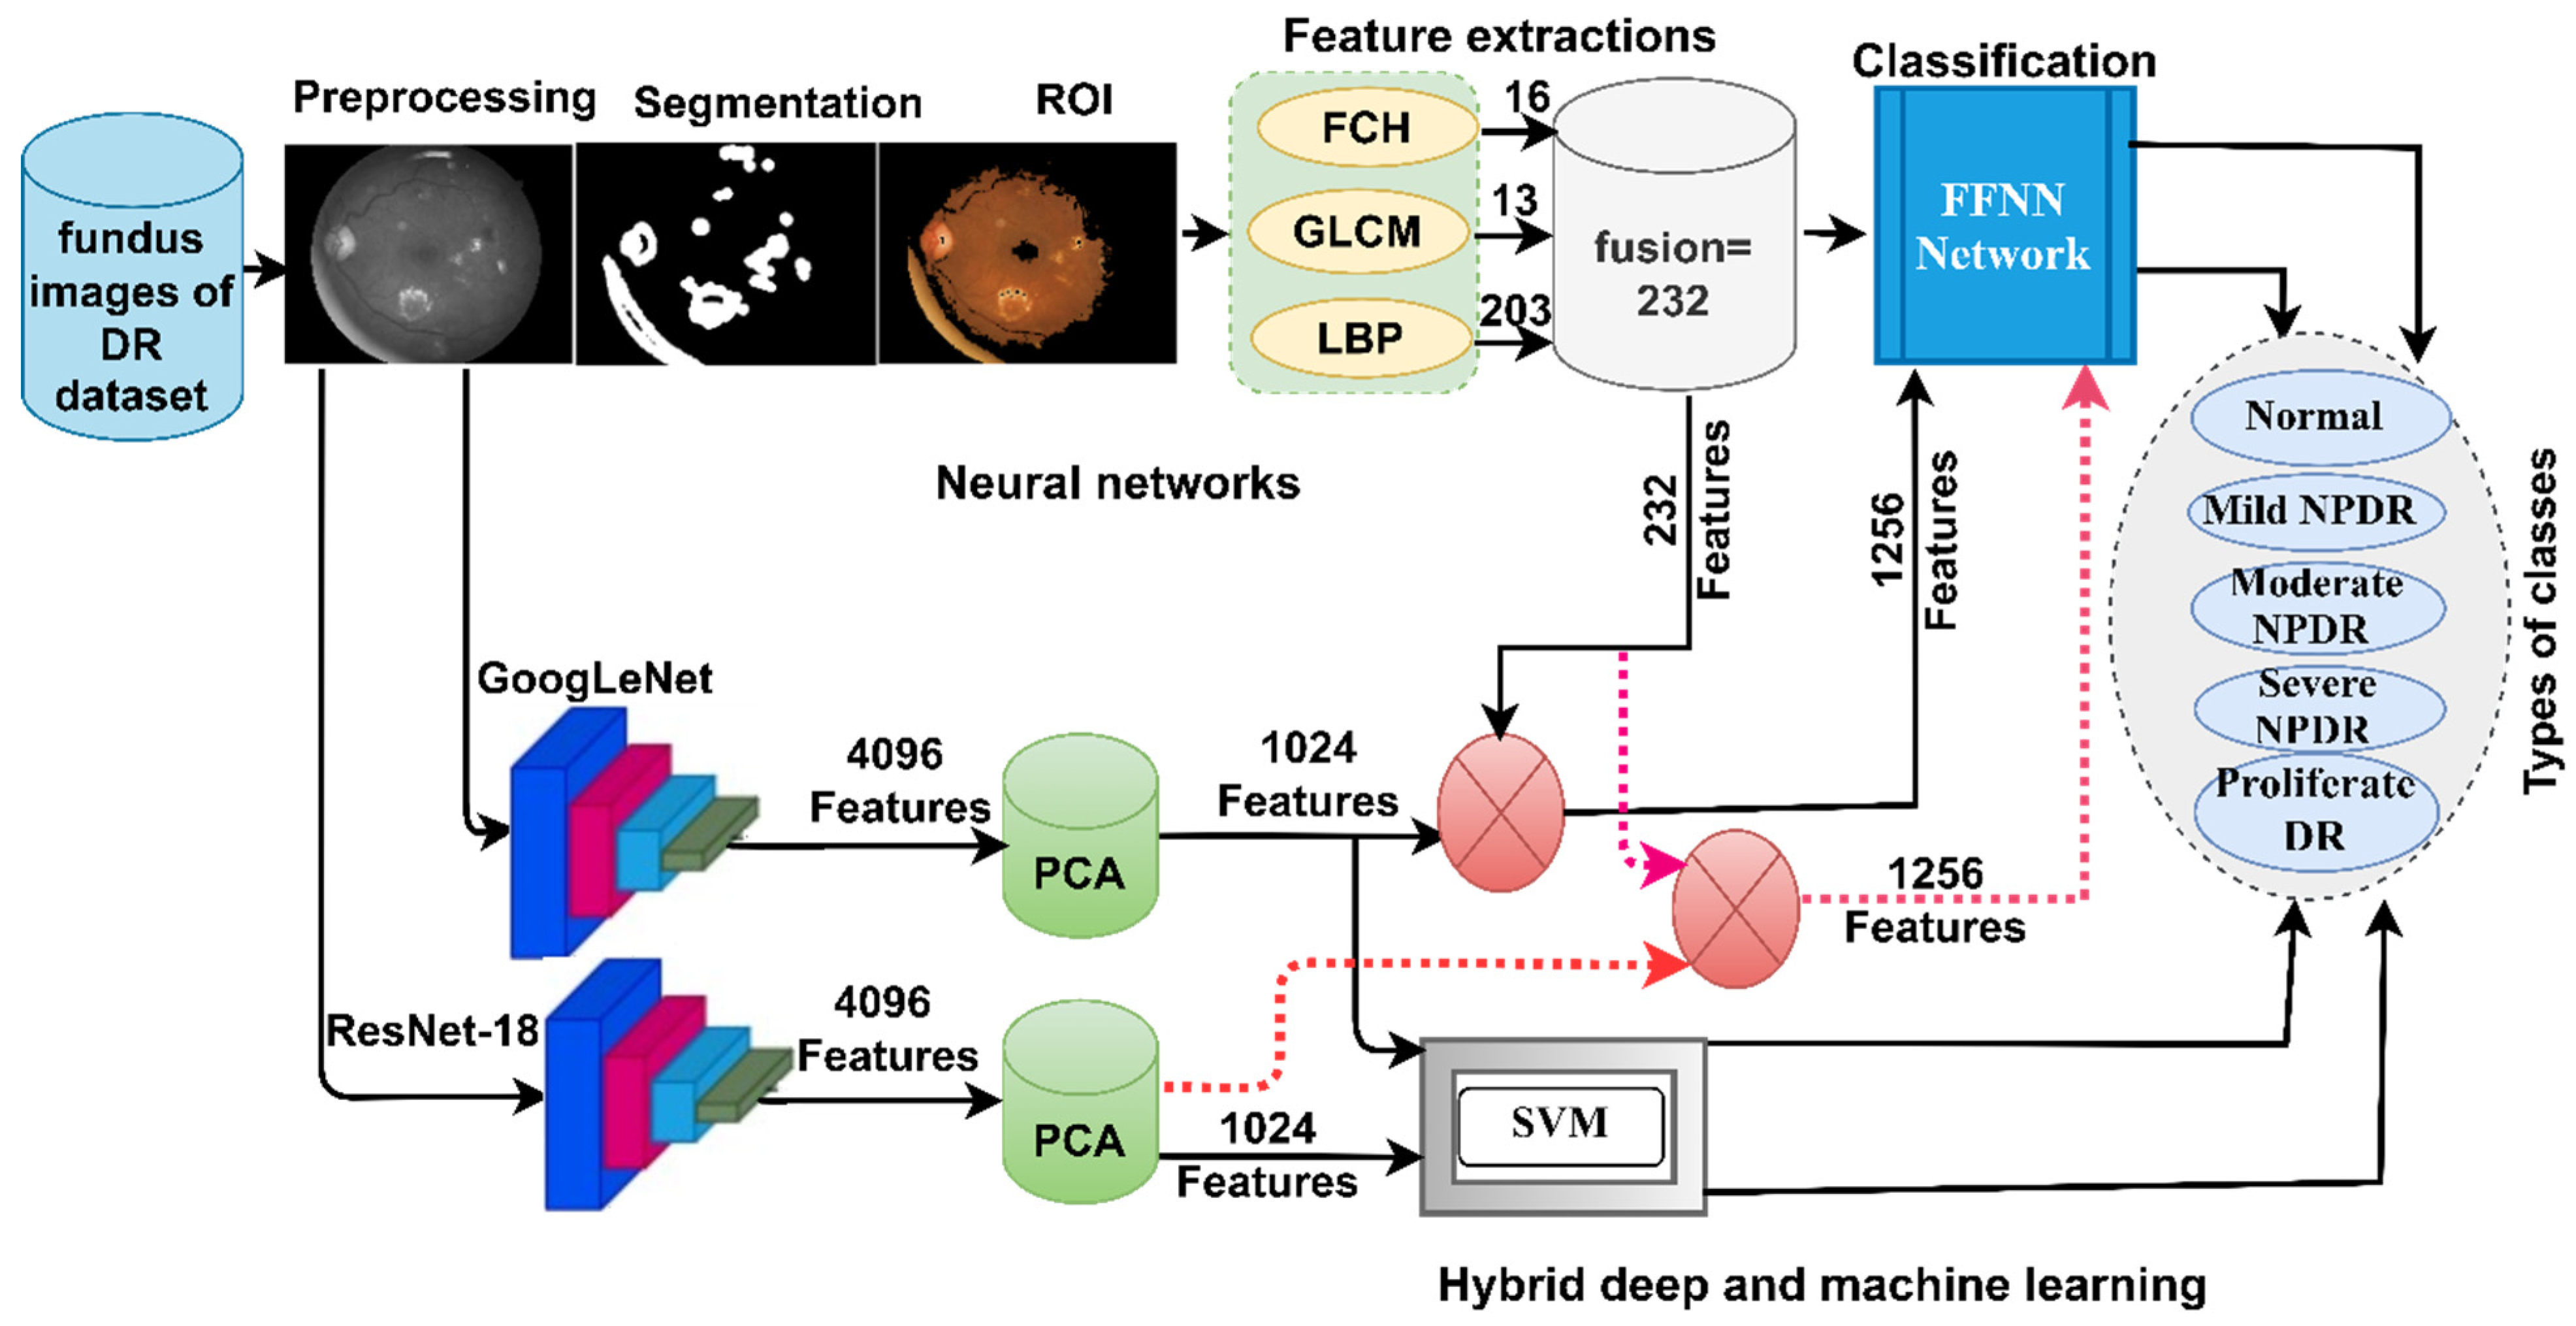
- Diagnosing fundus images by using a hybrid technique between CNN models and SVM algorithm.
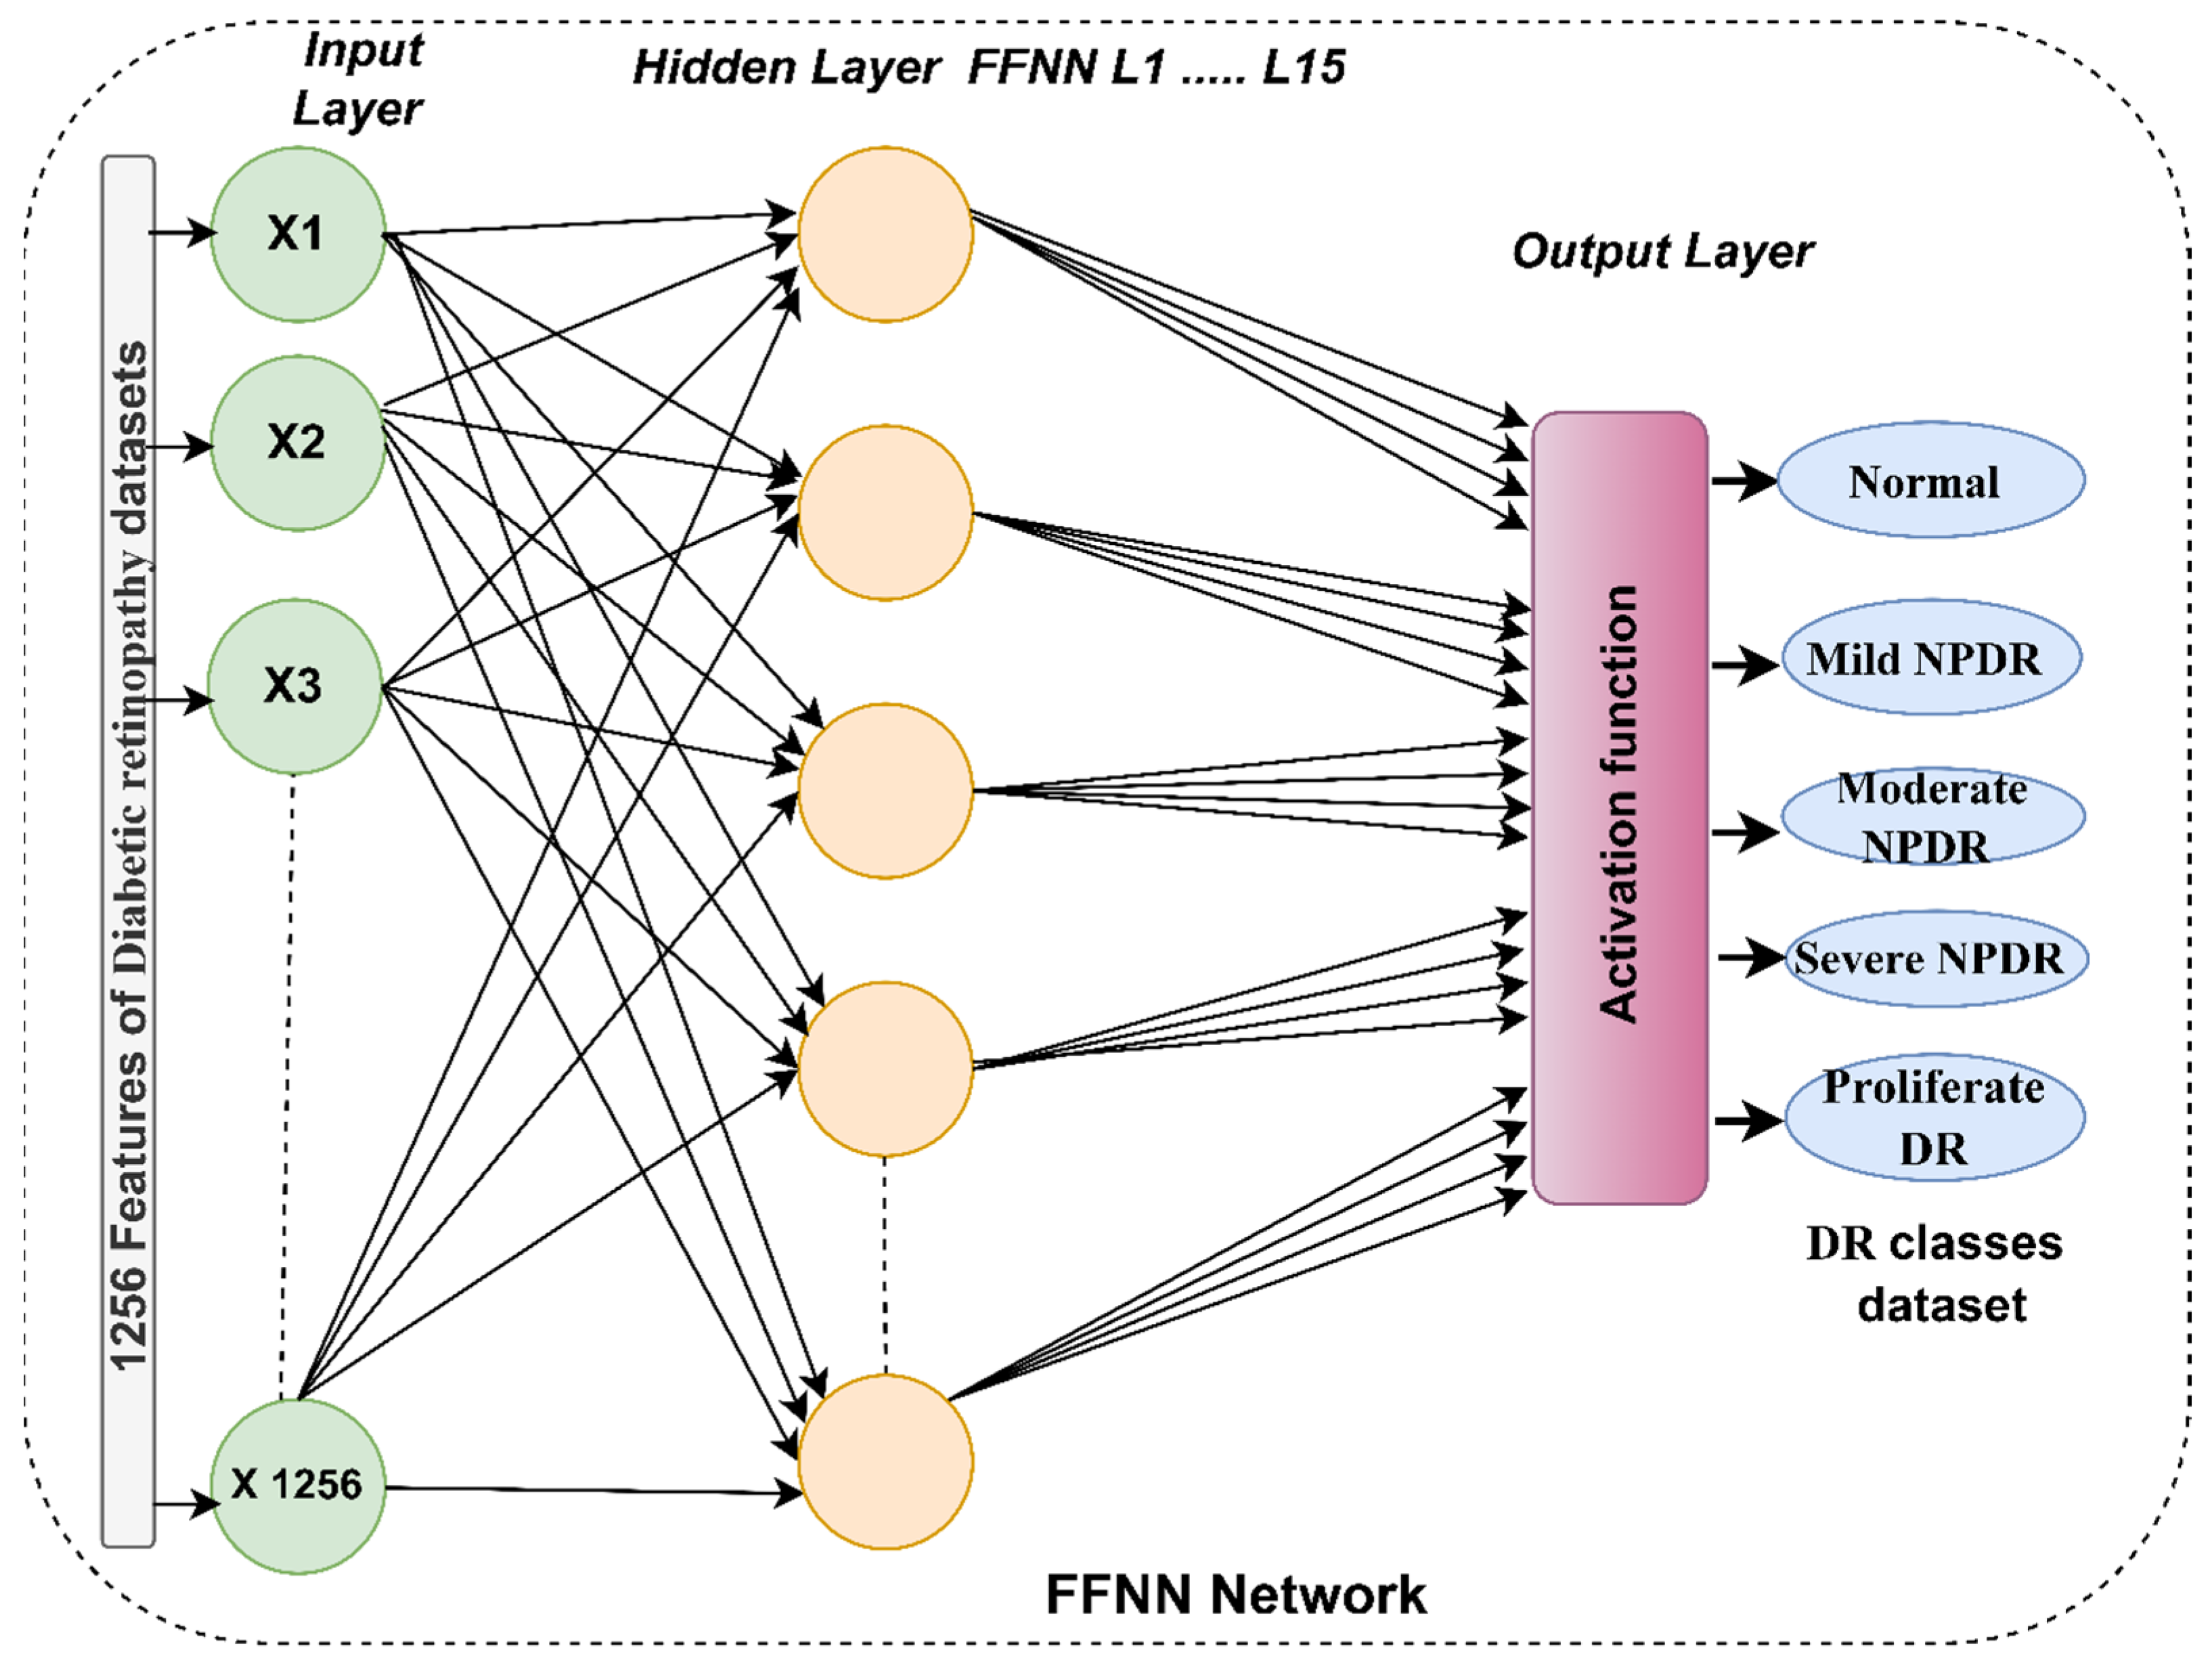
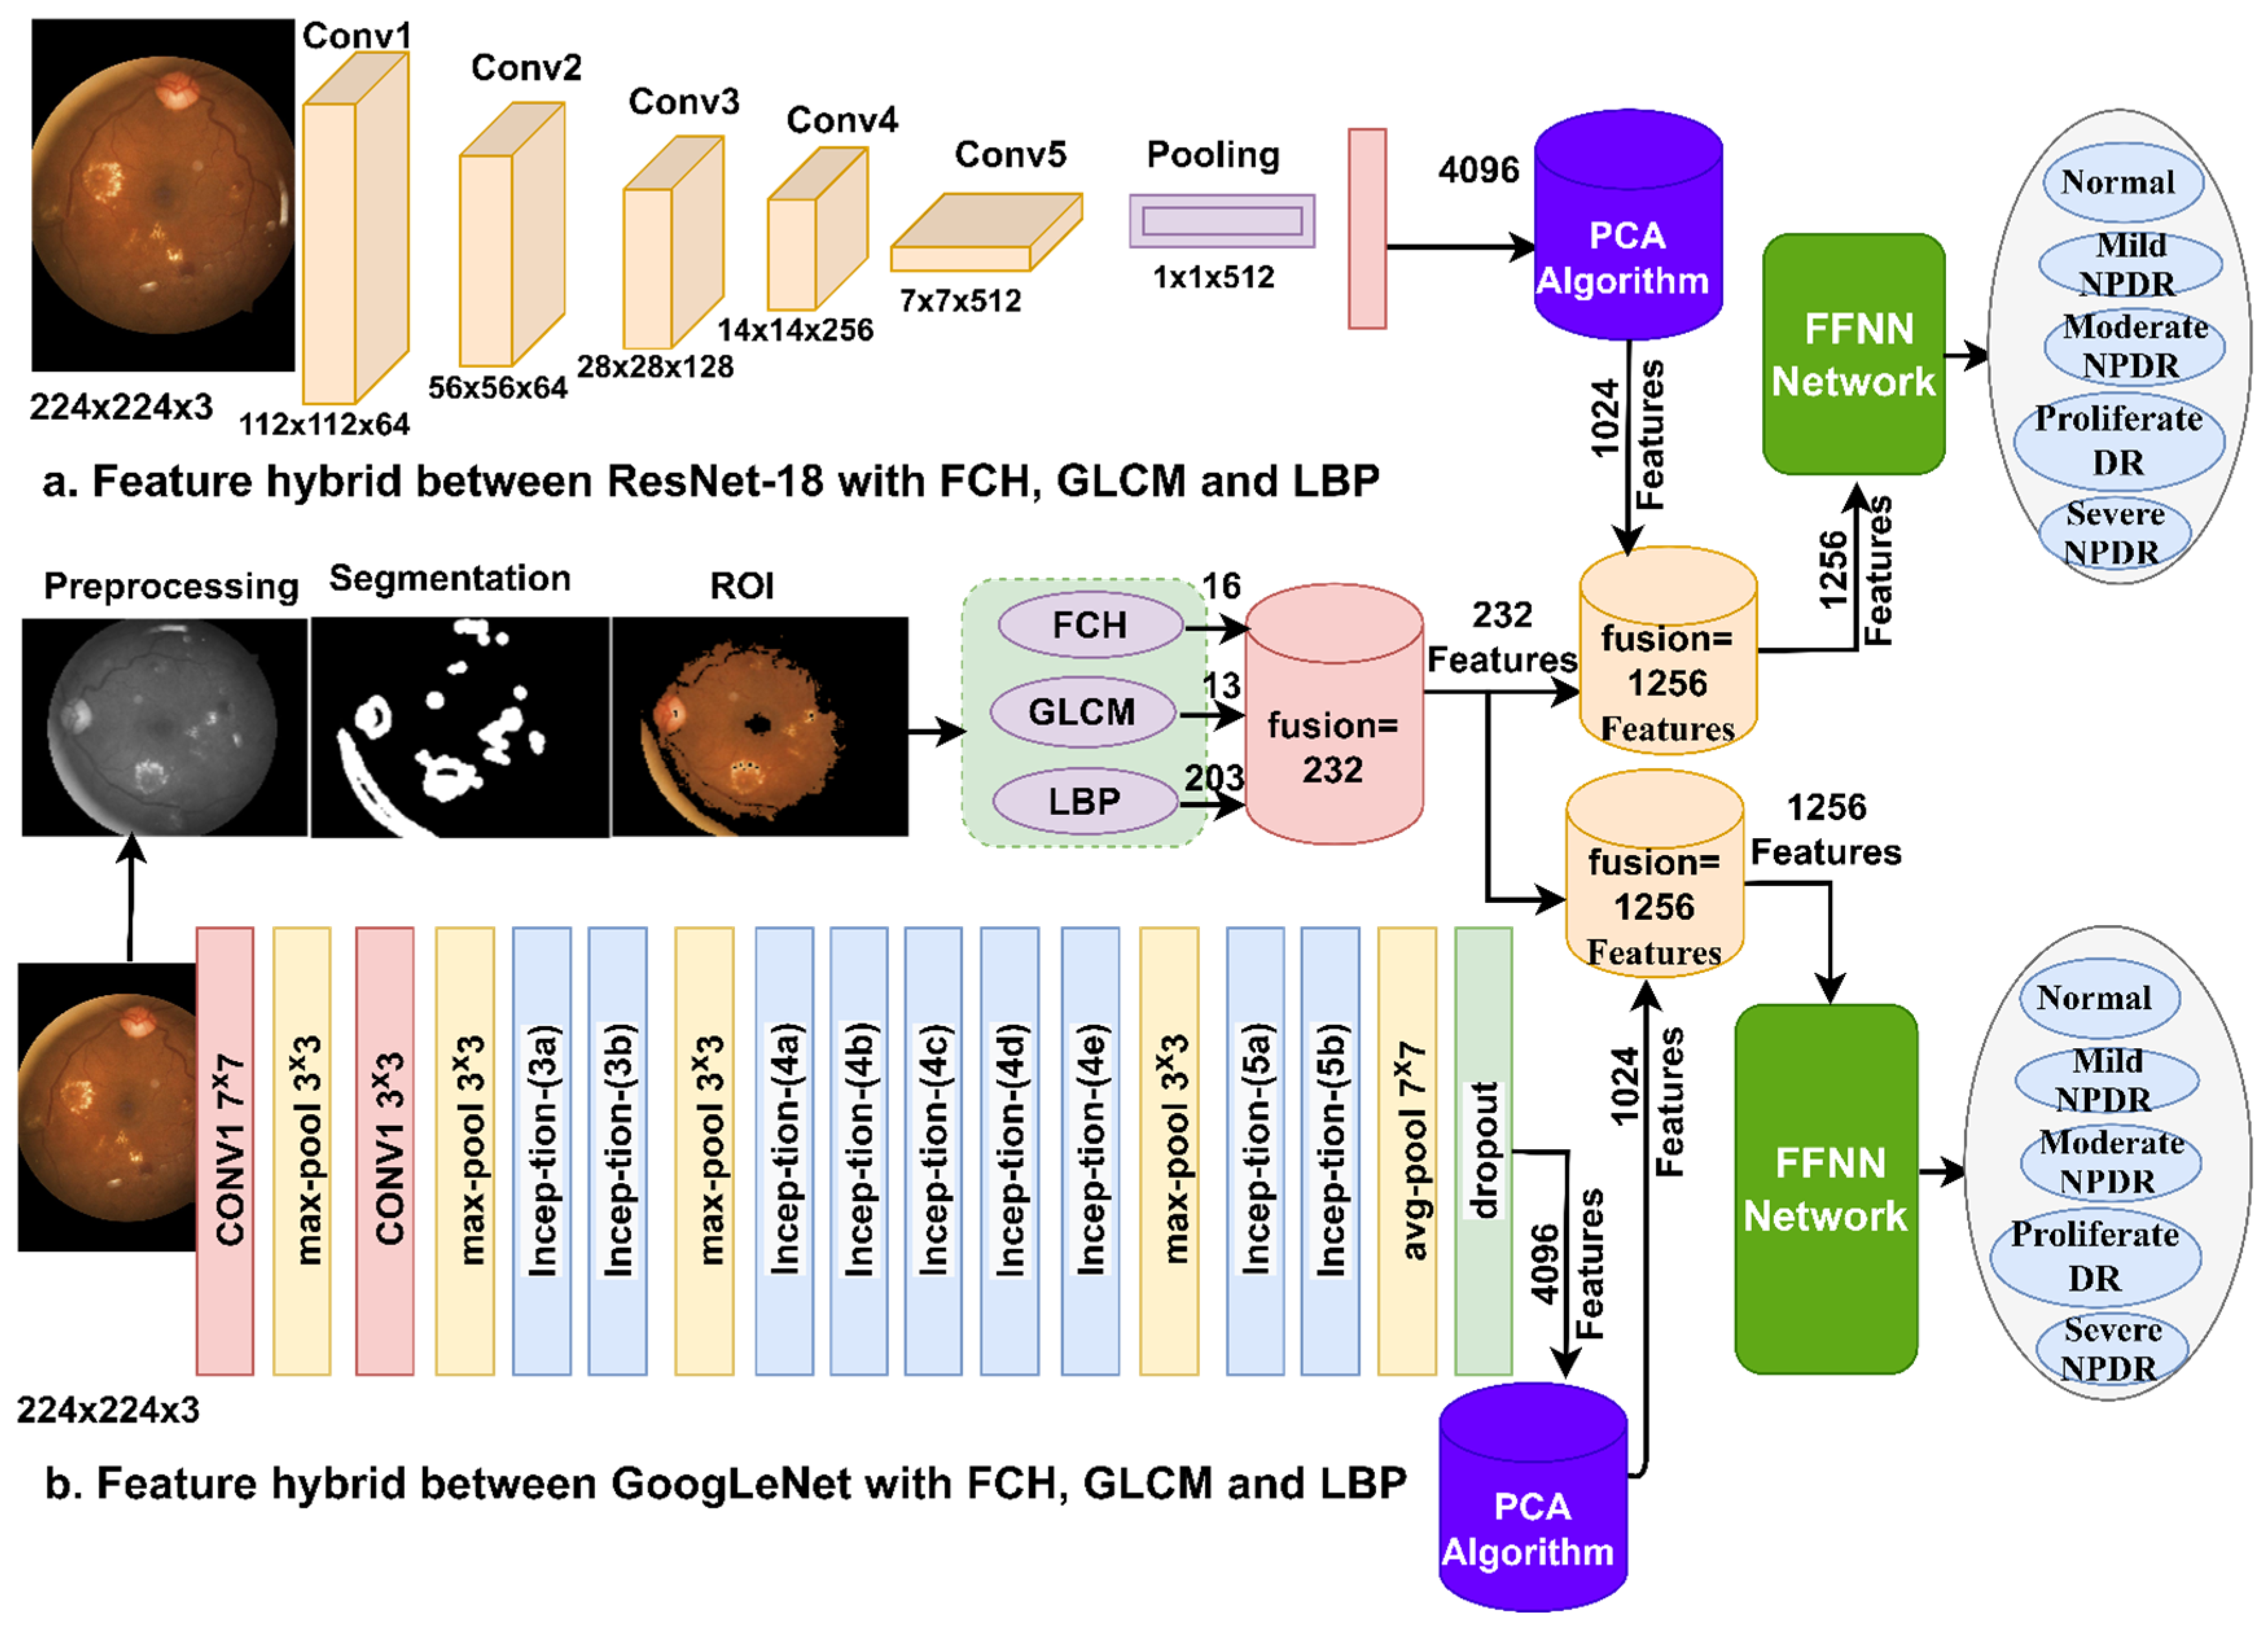
- Applied the FFNN network based on hybrid features of GoogLeNet, and handcrafted as well as ResNet-18 and handcrafted.
2. Related Work
3. Materials and Methods
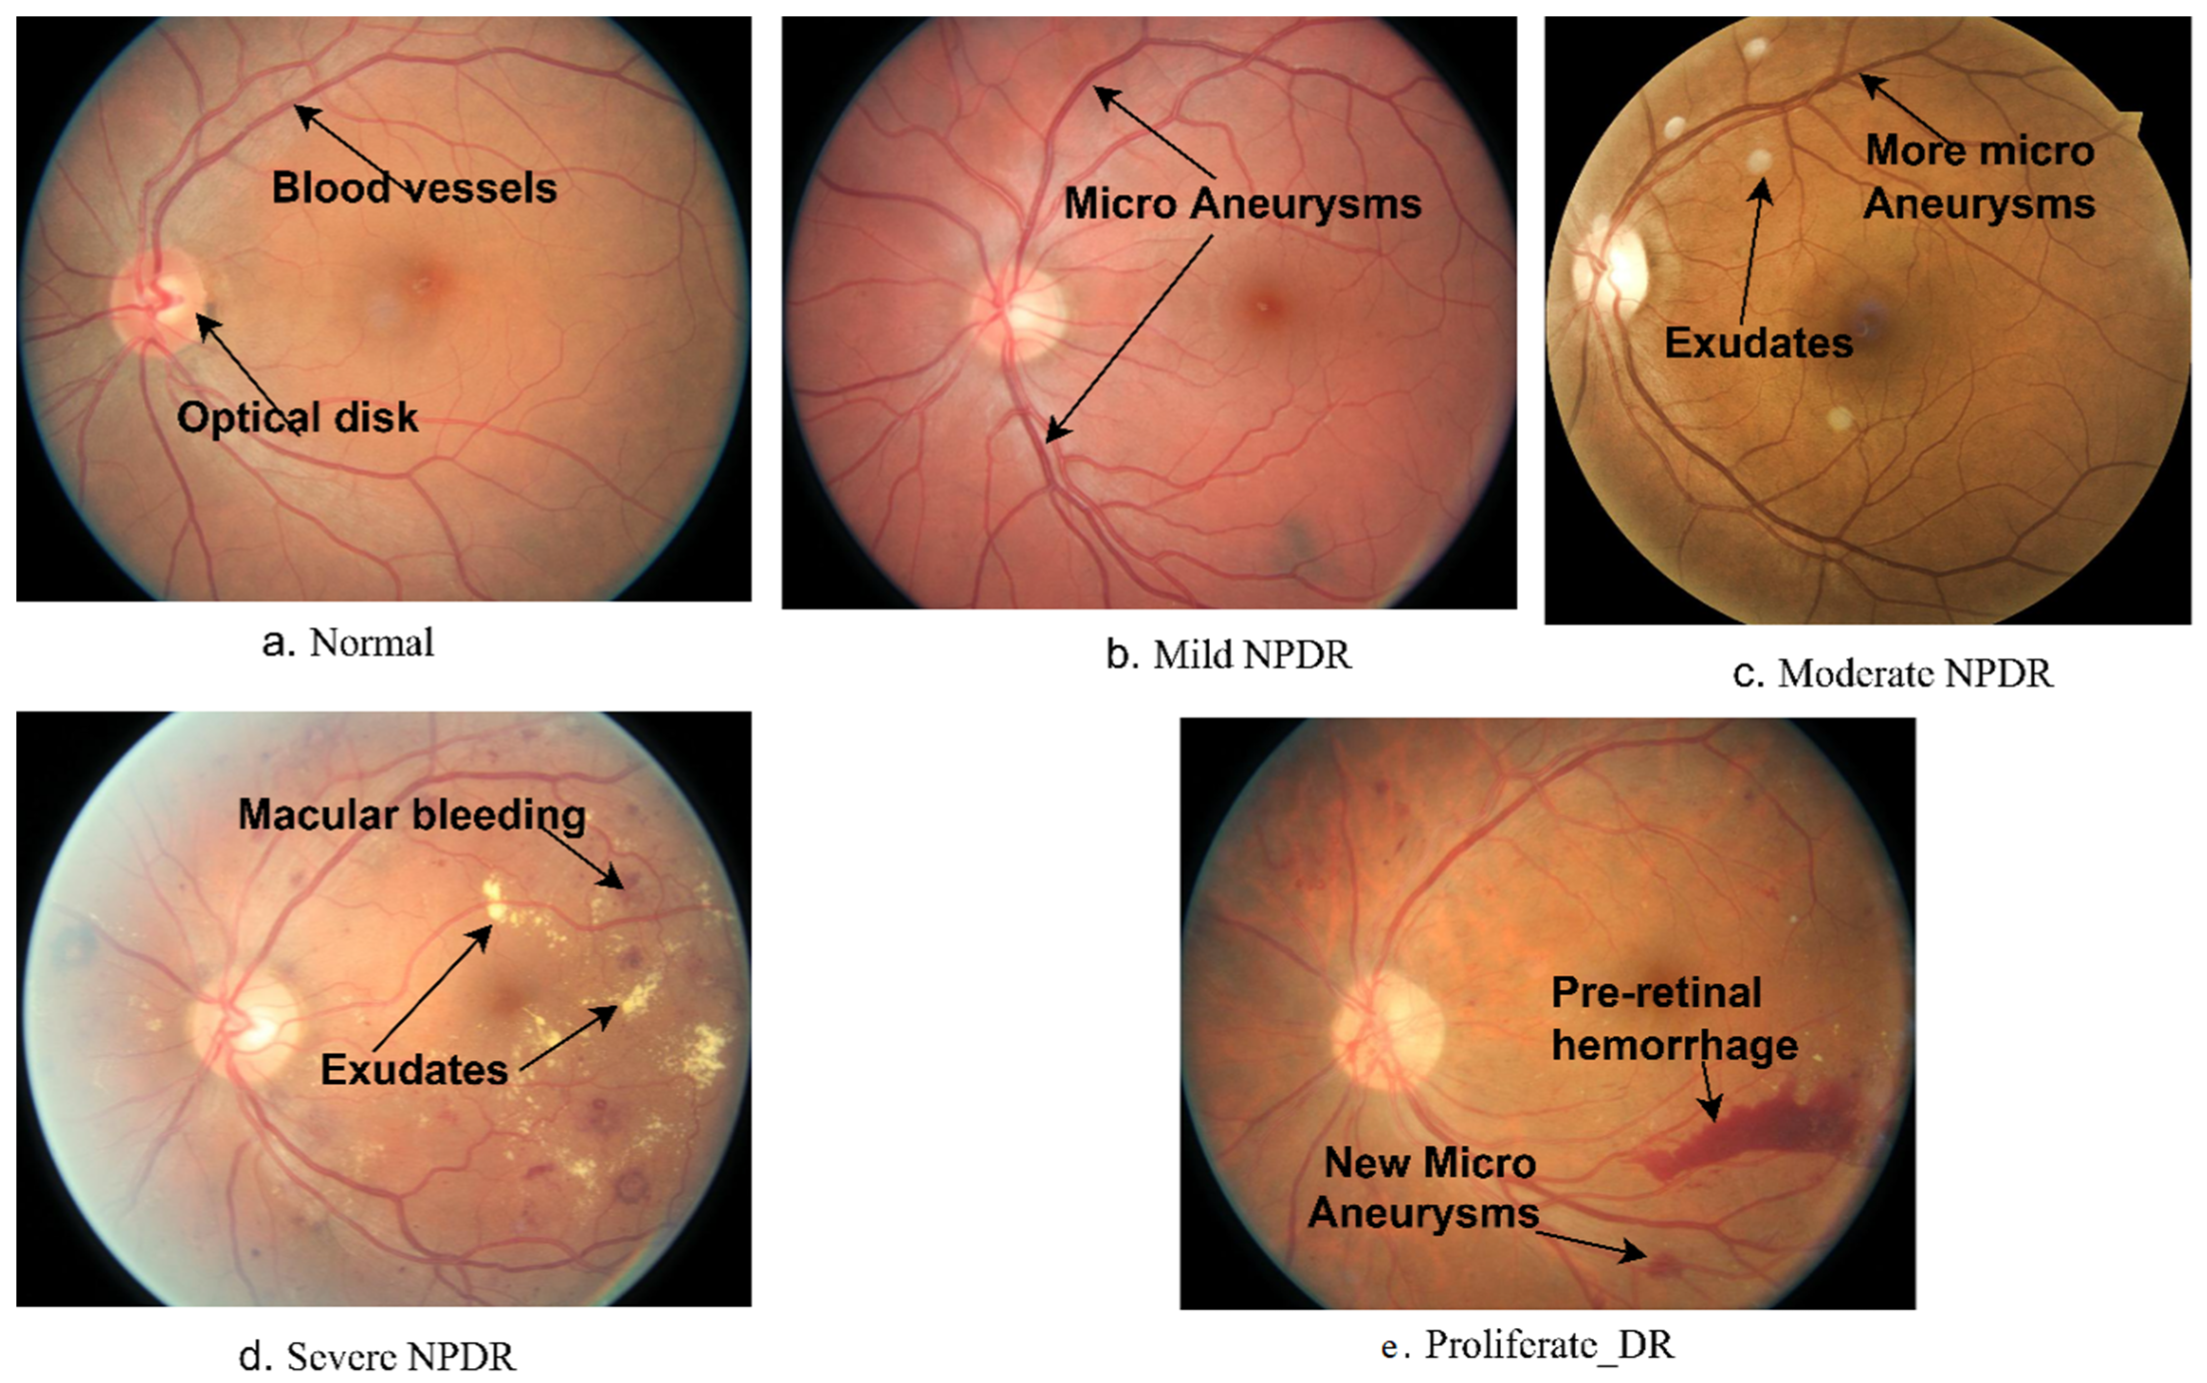
3.1. Data Set Description
3.2. Pre-Processing
3.2.1. Improvement of DR Data Set Images
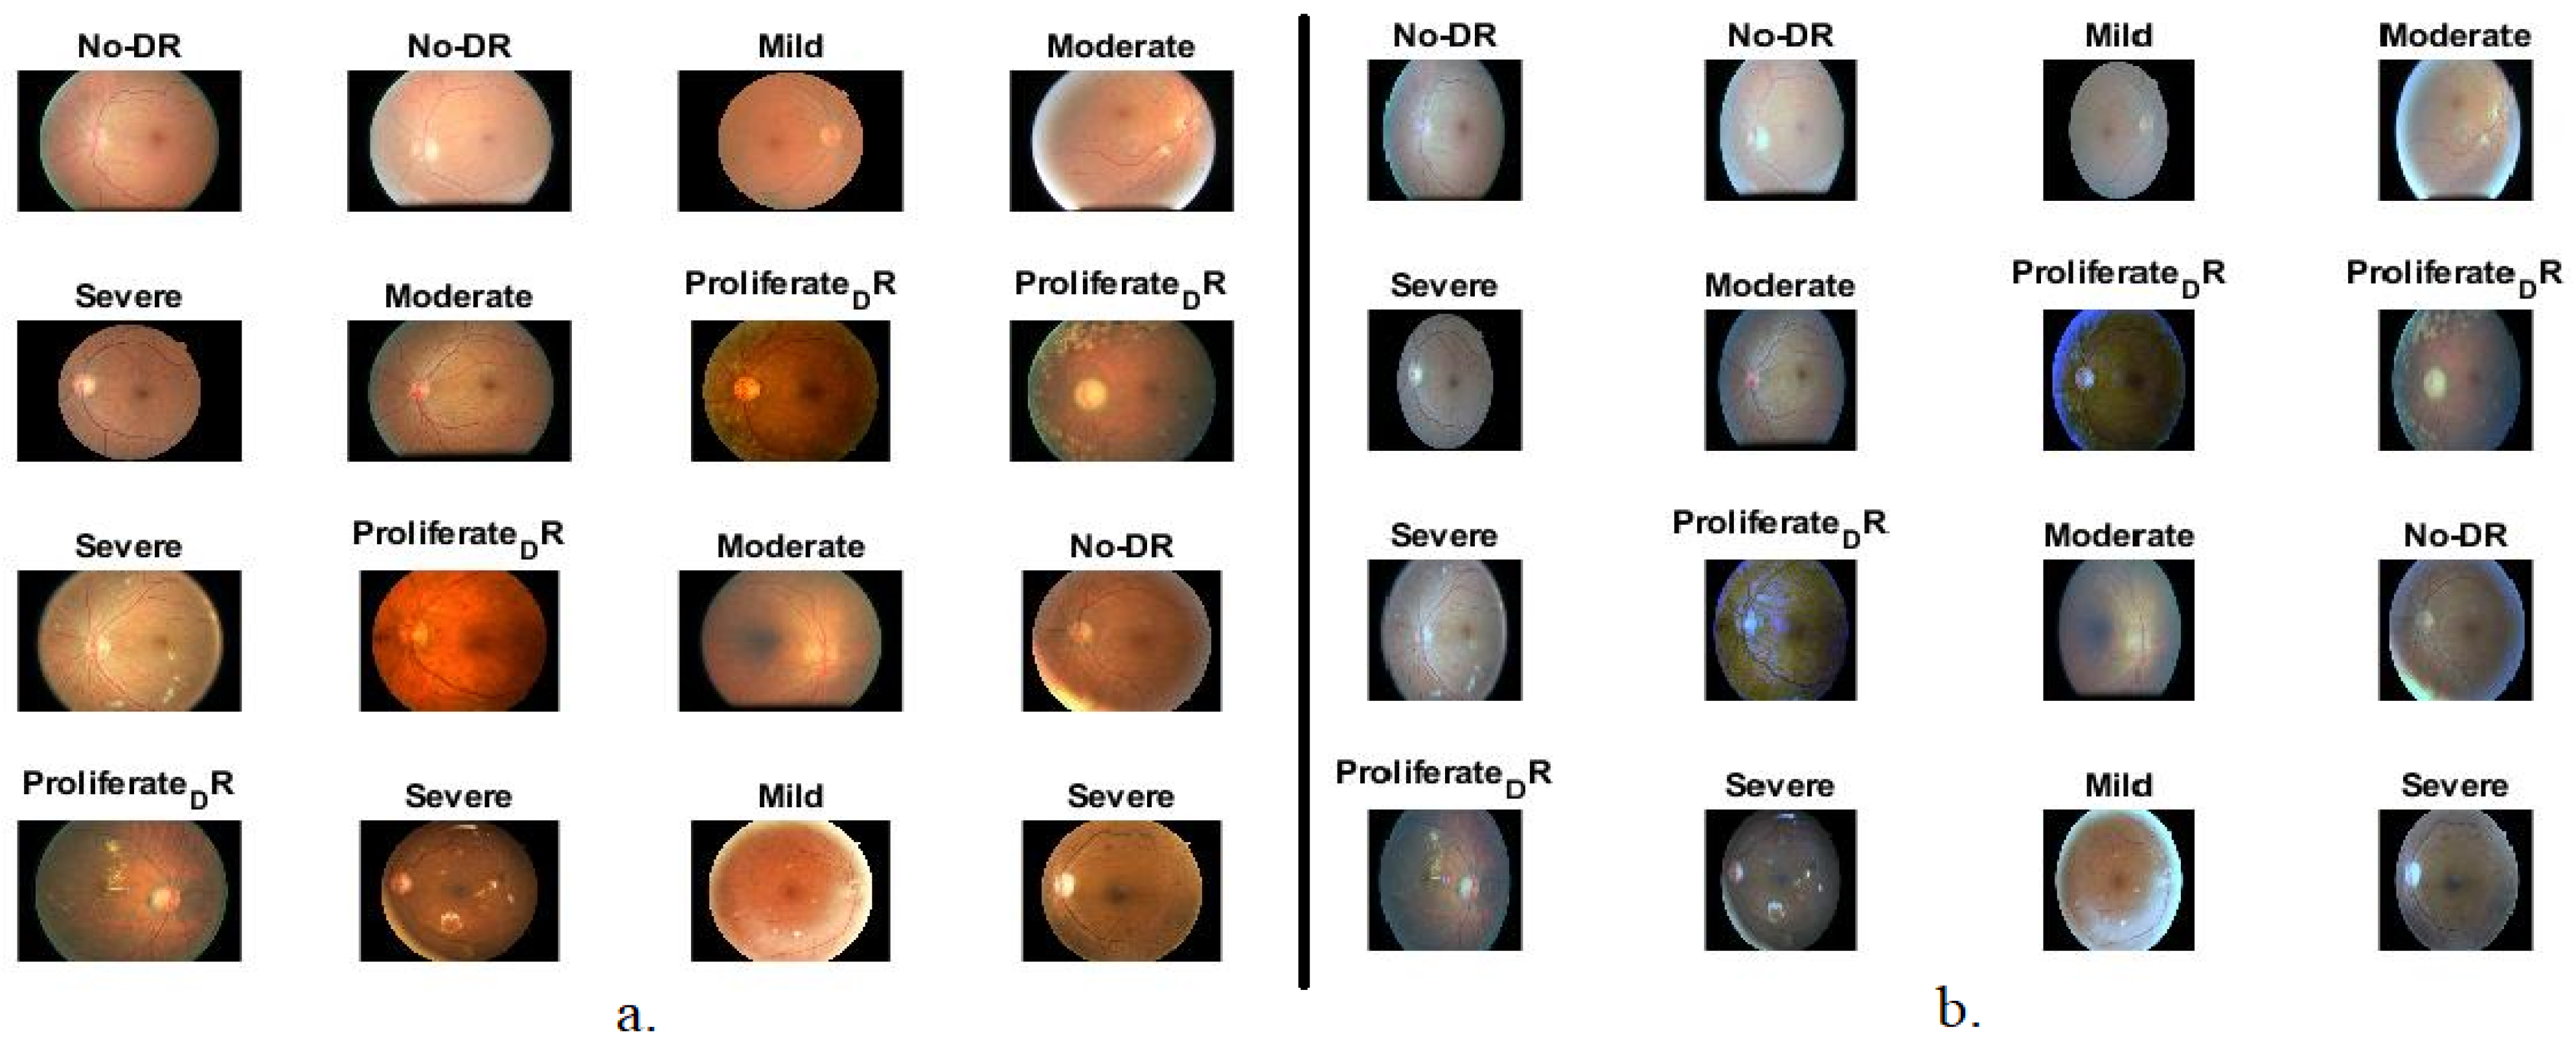
3.2.2. Data Augmentation Method
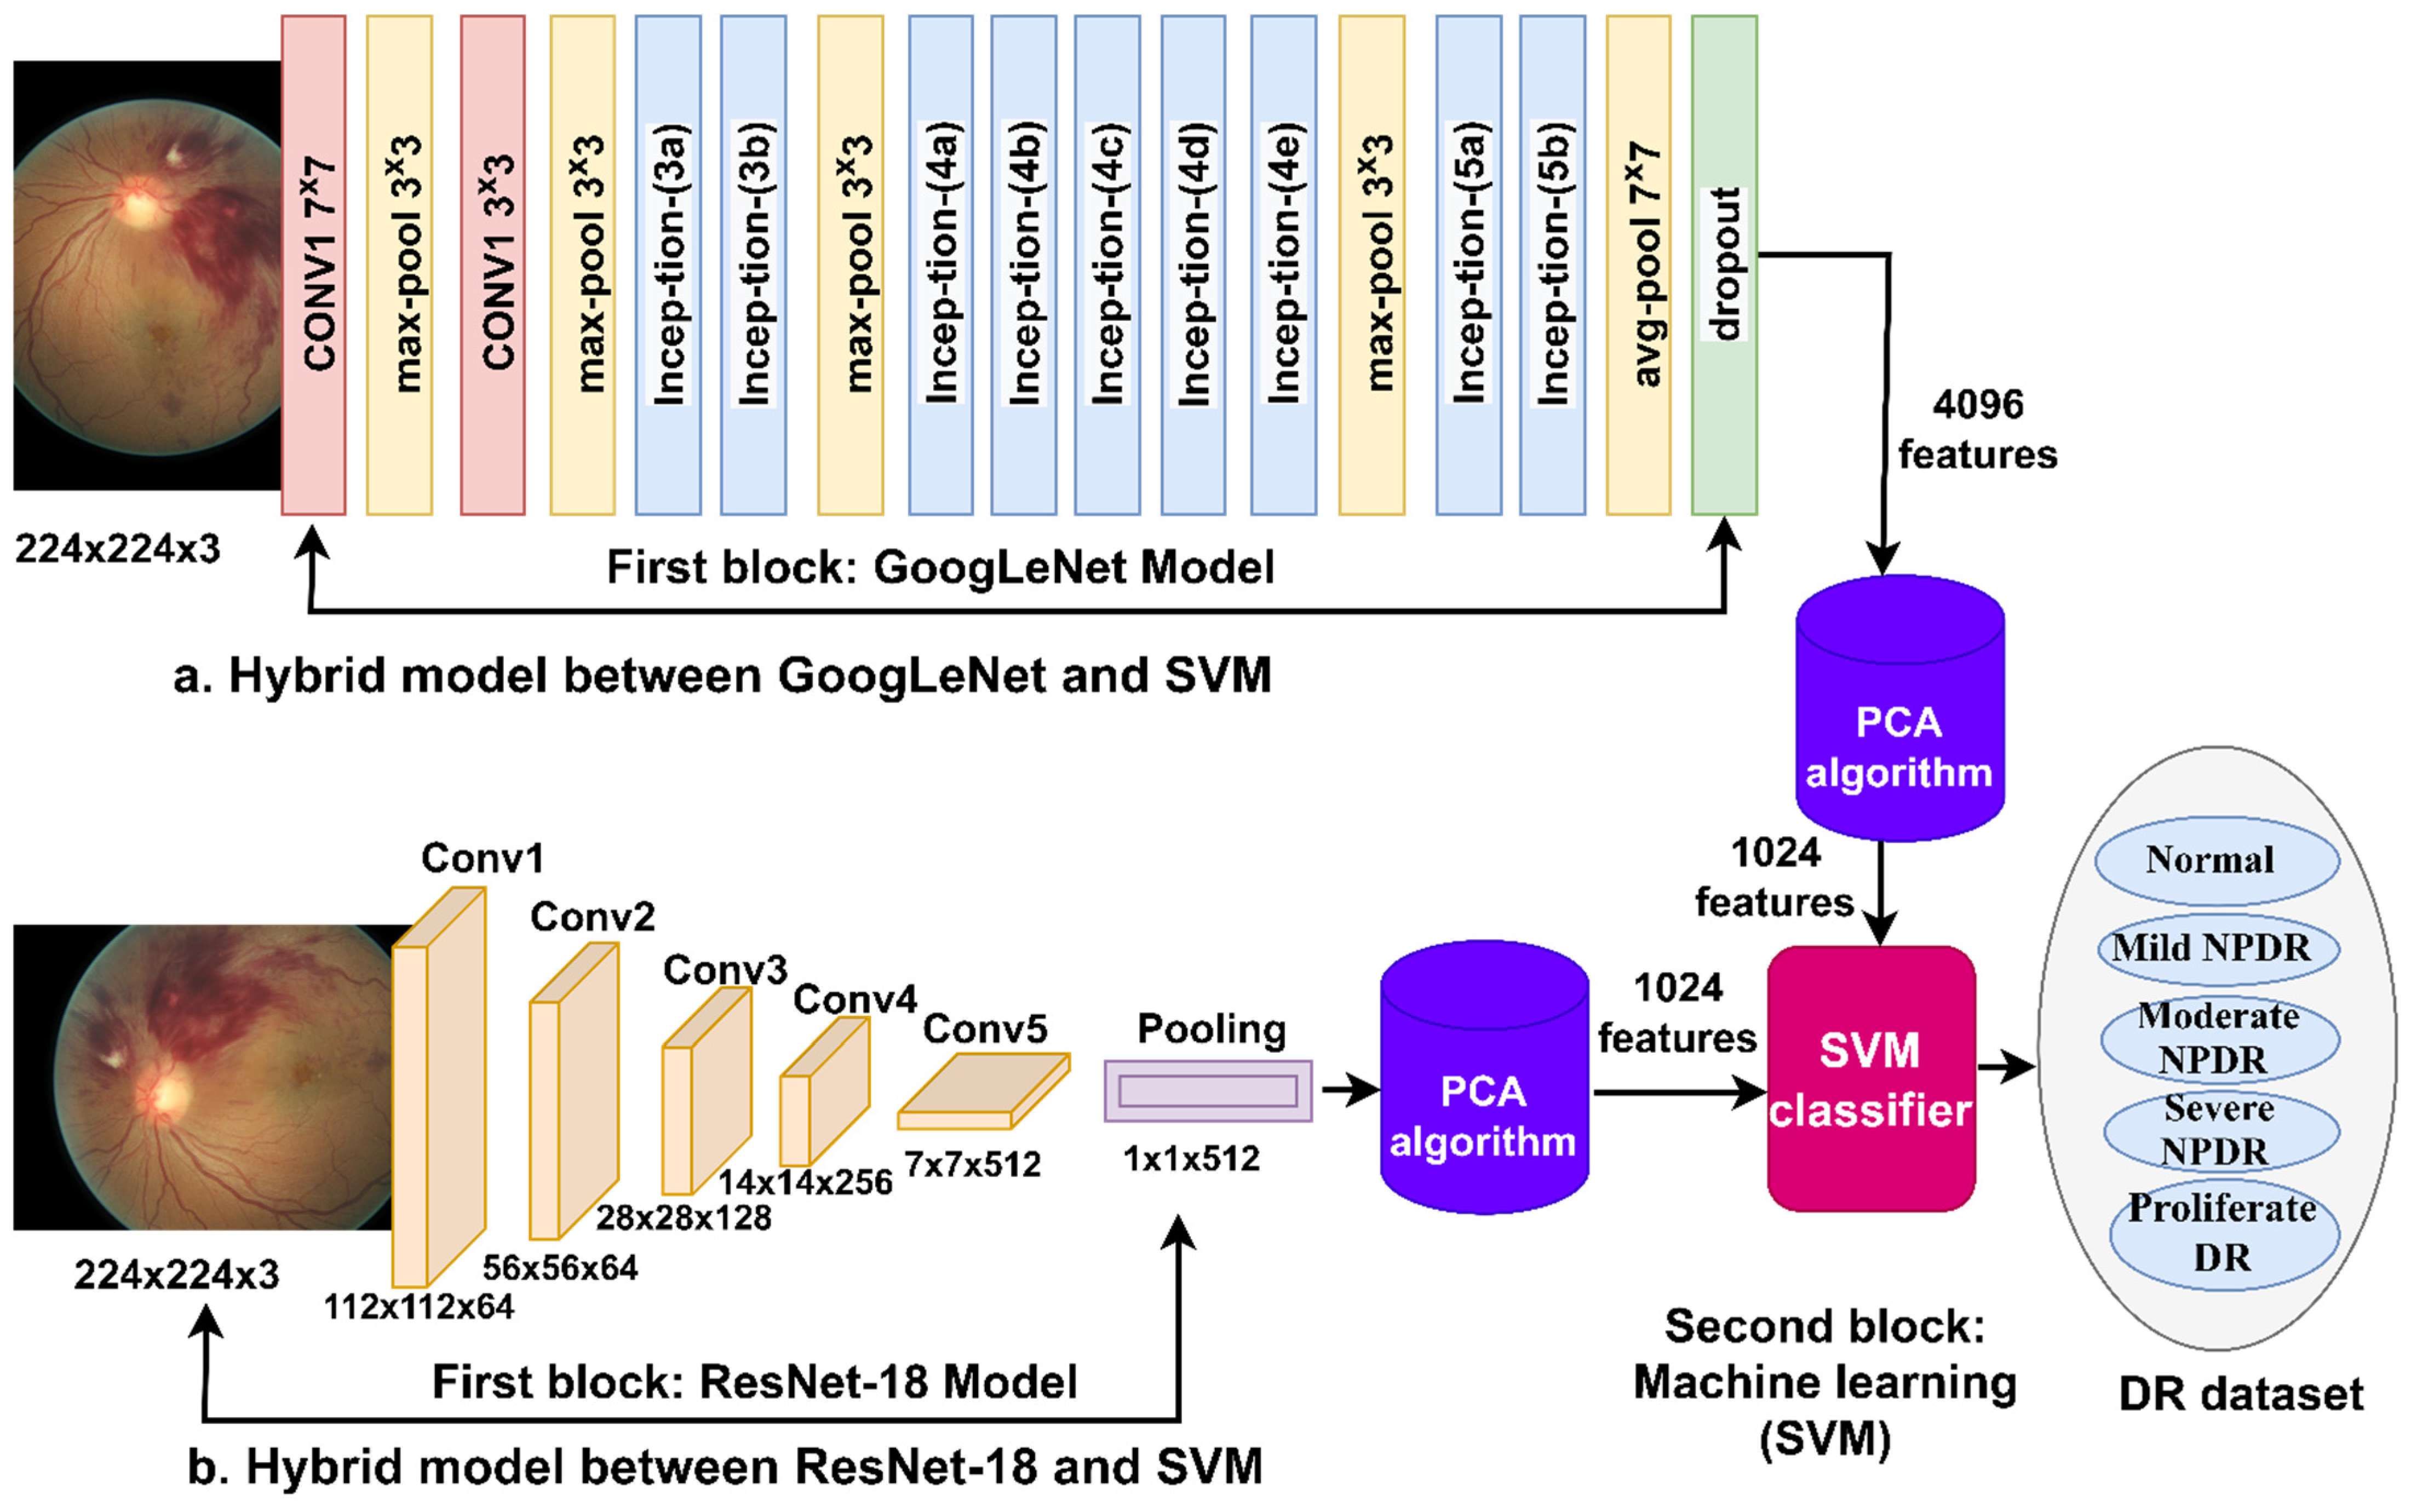
3.3. Hybrid Techniques
3.3.1. Deep Feature Extraction
3.3.2. PCA Algorithm
3.3.3. SVM Classifier
3.4. Features Combined with CNN and Handcrafted Features
4. Experimental Result
4.1. Evaluation Metrics
4.2. Splitting Data Set
4.3. Results of CNN Models and Hybrid Techniques
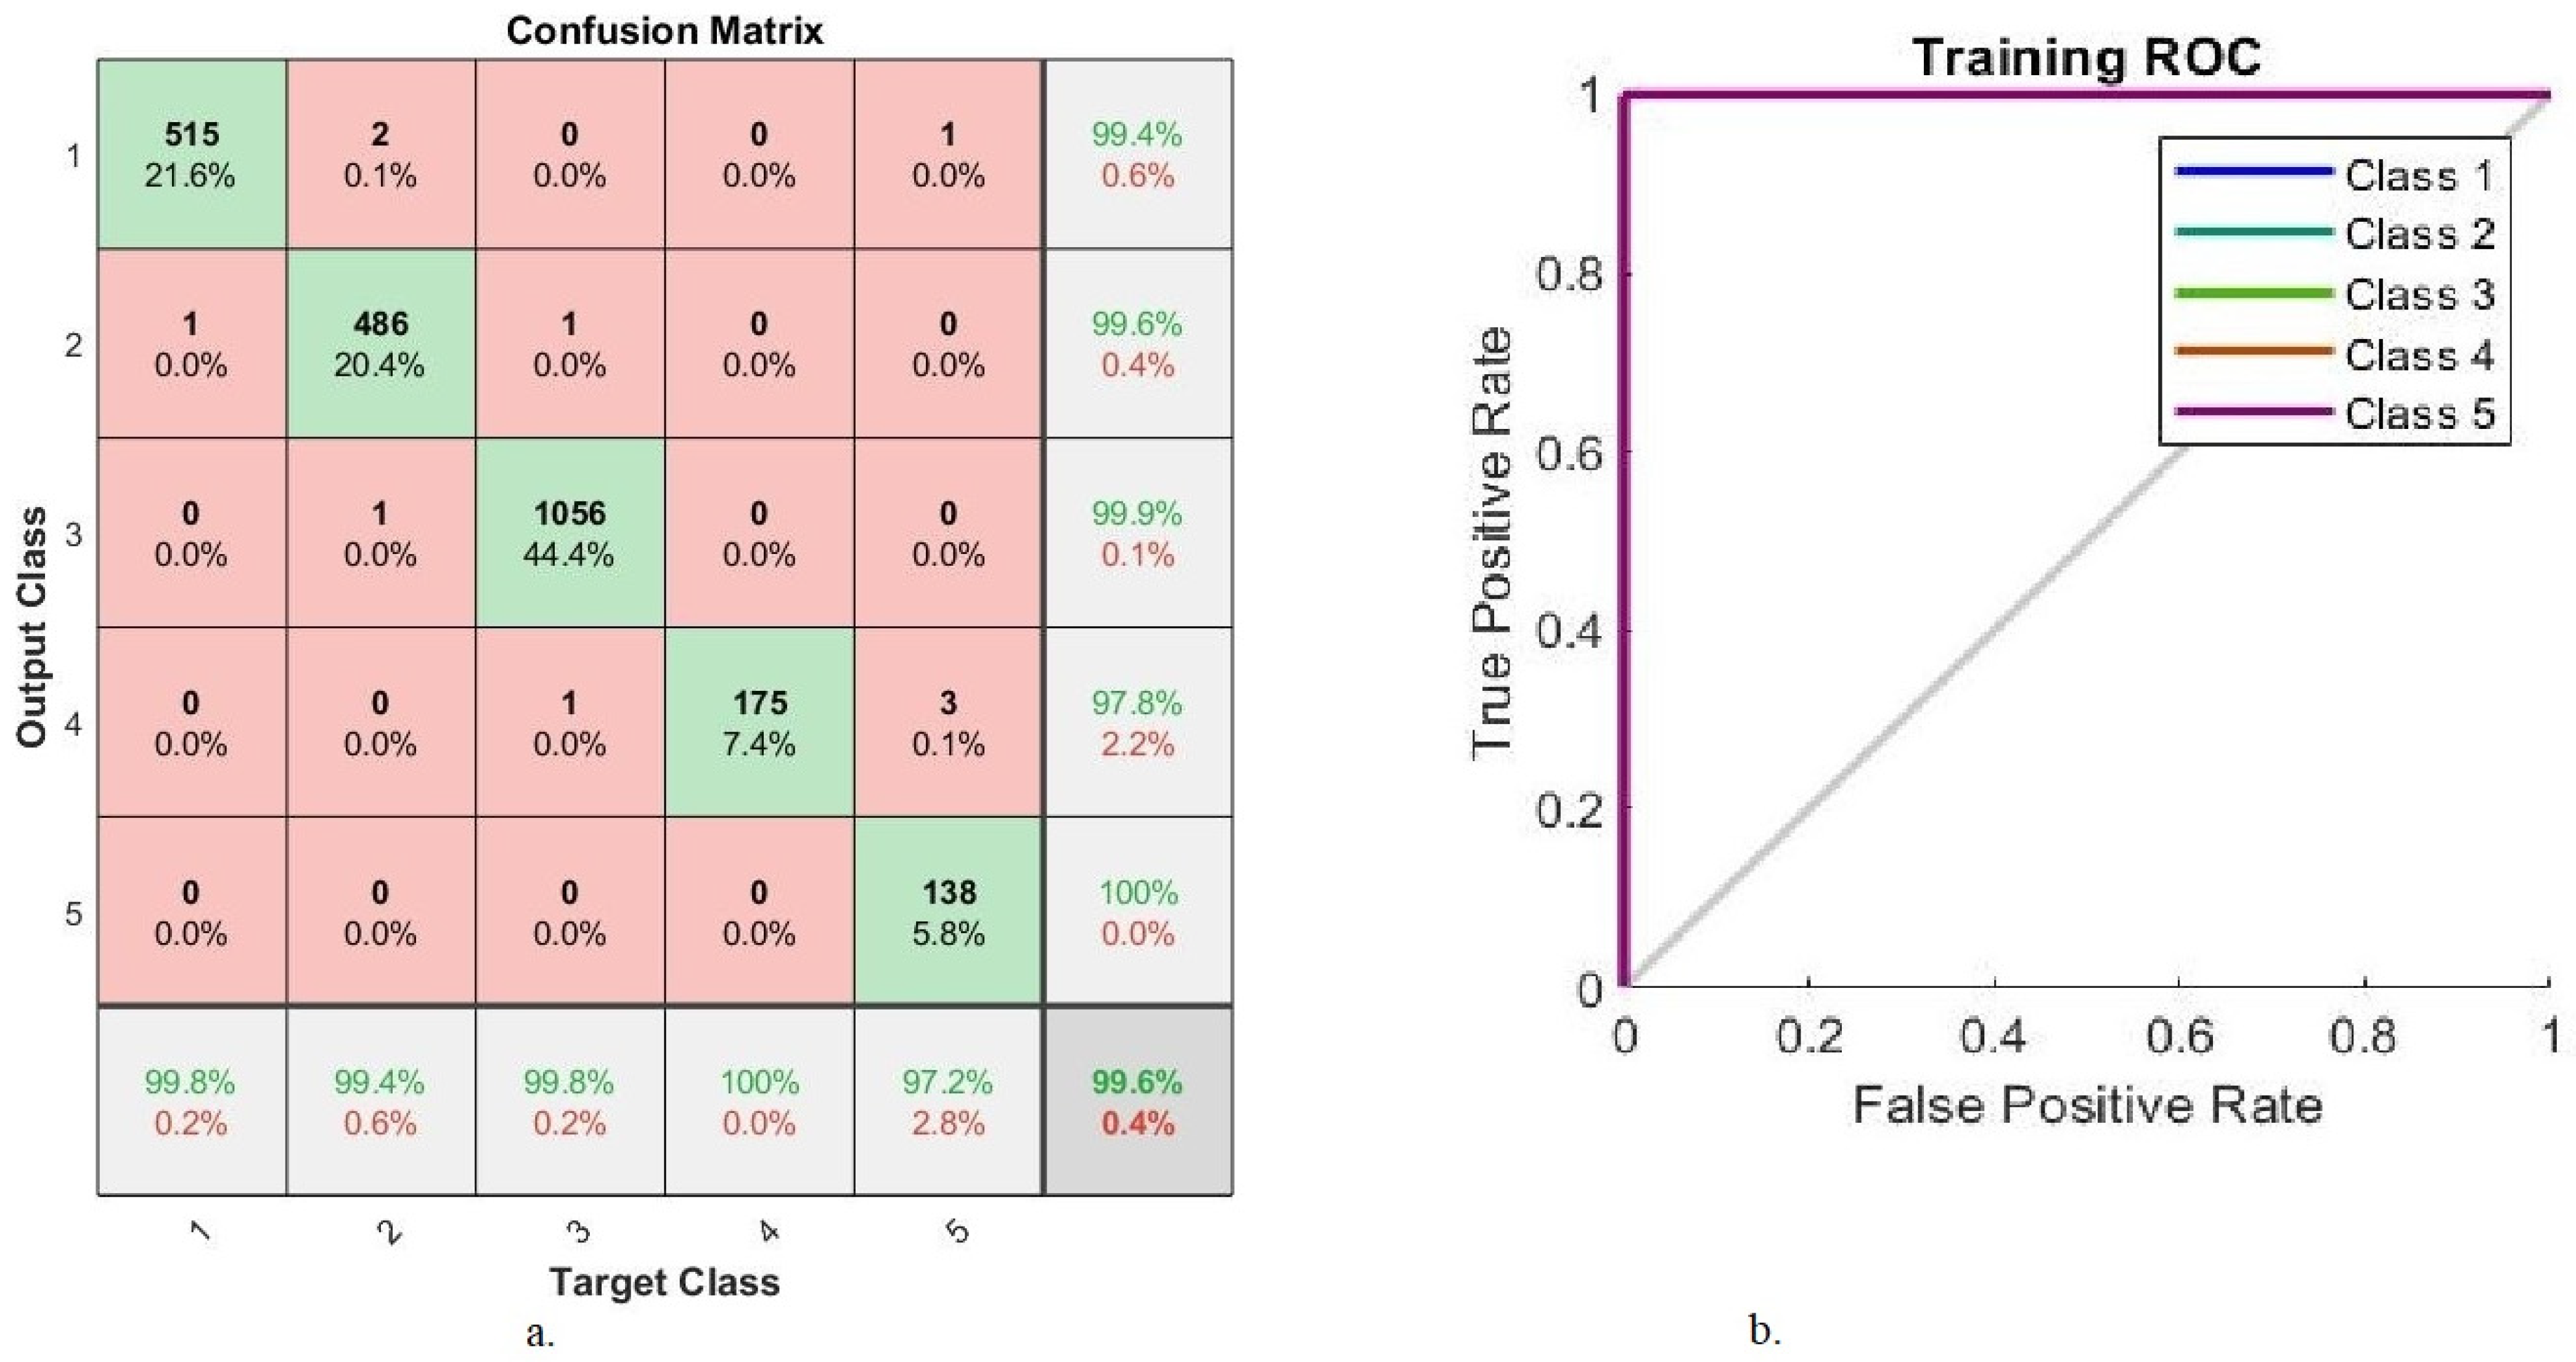
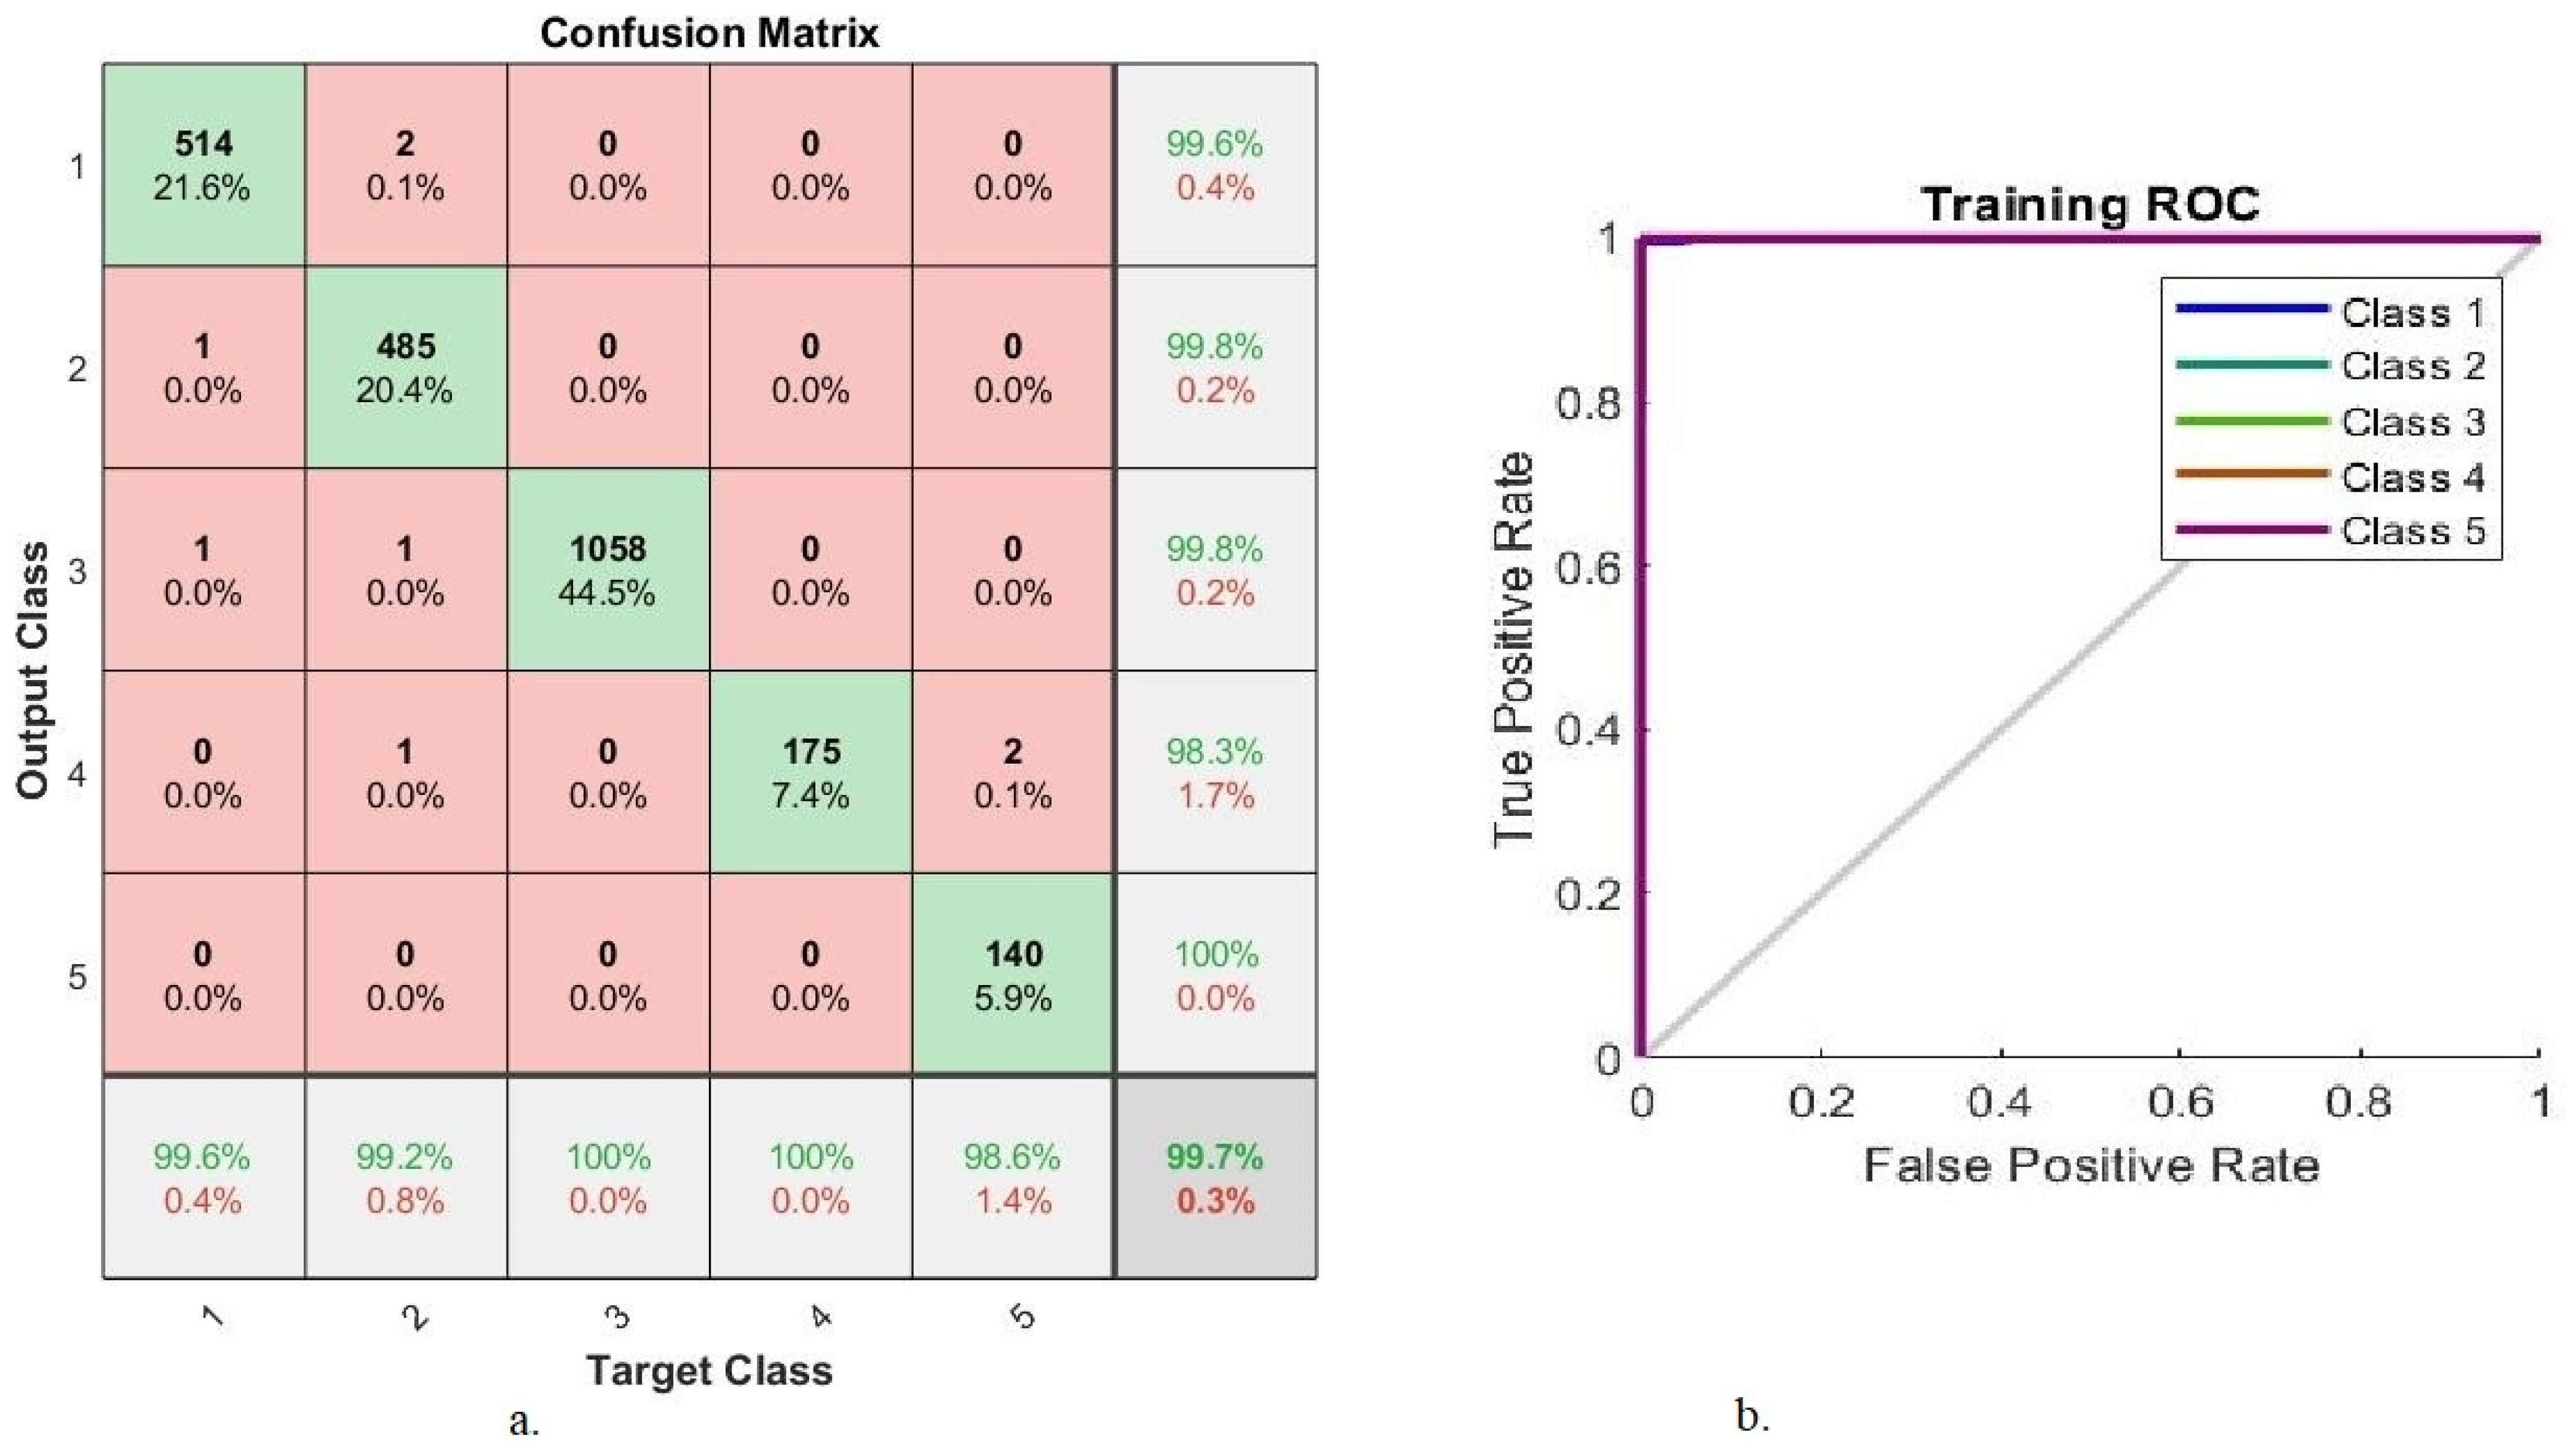
4.4. Results of Hybrid Features of CNN and Handcrafted Features
5. Discussing the Performance of the Systems
6. Conclusions
Author Contributions
Funding
Institutional Review Board Statement
Informed Consent Statement
Data Availability Statement
Acknowledgments
Conflicts of Interest
References
- Duker, J.S.; Waheed, N.K.; Goldman, D. Handbook of Retinal OCT: Optical Coherence Tomography E-Book; Elsevier Health Sciences: London, UK, 2021; Available online: https://books.google.co.in/books?hl=en&lr=&id (accessed on 18 October 2022).
- Wu, Z.; Shi, G.; Chen, Y.; Shi, F.; Chen, X.; Coatrieux, G.; Li, S. Coarse-to-fine classification for diabetic retinopathy grading using convolutional neural network. Artif. Intell. Med. 2020, 108, 101936. [Google Scholar] [CrossRef] [PubMed]
- Haneda, S.; Yamashita, H. International clinical diabetic retinopathy disease severity scale. Nihon Rinsho. Jpn. J. Clin. Med. 2010, 68, 228–235. Available online: https://europepmc.org/article/med/21661159 (accessed on 18 October 2022).
- Roglic, G. WHO Global report on diabetes: A summary. Int. J. Noncommun. Dis. 2016, 1, 3. Available online: https://www.ijncd.org/article.asp?issn=2468-8827 (accessed on 18 October 2022). [CrossRef]
- Jan, S.; Ahmad, I.; Karim, S.; Hussain, Z.L.; Rehman, M.; Shah, M.A. Status of diabetic retinopathy and its presentation patterns in diabetics at ophthalomogy clinics. JPMI J. Postgrad. Med. Inst. 2018, 32, 2143. Available online: https://66.219.22.243/index.php/jpmi/article/view/2143 (accessed on 18 October 2022).
- Tang, J.; Kern, T.S. Inflammation in diabetic retinopathy. Prog. Retin. Eye Res. 2011, 30, 343–358. [Google Scholar] [CrossRef] [PubMed]
- Yang, Y.; Li, T.; Li, W.; Wu, H.; Fan, W.; Zhang, W. Lesion detection and grading of diabetic retinopathy via two-stages deep convolutional neural networks. In Proceedings of the International Conference on Medical Image Computing and Computer-Assisted Intervention, Quebec City, QC, Canada, 11–13 September 2017; Springer: Cham, Switzerland, 2017; pp. 533–540. [Google Scholar] [CrossRef]
- Wu, L.; Fernandez-Loaiza, P.; Sauma, J.; Hernandez-Bogantes, E.; Masis, M. Classification of diabetic retinopathy and diabetic macular edema. World J. Diabetes 2013, 4, 290. Available online: https://www.ncbi.nlm.nih.gov/pmc/articles/PMC3874488/ (accessed on 18 October 2022). [CrossRef]
- Louis, D.N.; Perry, A.; Reifenberger, G.; Von Deimling, A.; Figarella-Branger, D.; Cavenee, W.K.; Ellison, D.W. The 2016 World Health Organization classification of tumors of the central nervous system: A summary. Acta Neuropathol. 2016, 131, 803–820. [Google Scholar] [CrossRef]
- Zang, P.; Gao, L.; Hormel, T.T.; Wang, J.; You, Q.; Hwang, T.S.; Jia, Y. DcardNet: Diabetic retinopathy classification at multiple levels based on structural and angiographic optical coherence tomography. IEEE Trans. Biomed. Eng. 2020, 68, 1859–1870. Available online: https://ieeexplore.ieee.org/abstract/document/9207828 (accessed on 18 October 2022). [CrossRef]
- Resnikoff, S.; Felch, W.; Gauthier, T.M.; Spivey, B. The number of ophthalmologists in practice and training worldwide: A growing gap despite more than 200,000 practitioners. Br. J. Ophthalmol. 2012, 96, 783–787. Available online: https://bjo.bmj.com/content/96/6/783.short (accessed on 18 October 2022). [CrossRef] [PubMed]
- Liu, H.; Yue, K.L.; Cheng, S.; Pan, C.; Sun, J.; Li, W. Hybrid model structure for diabetic retinopathy classification. J. Healthc. Eng. 2020, 2020, 8840174. Available online: https://www.hindawi.com/journals/jhe/2020/8840174/ (accessed on 18 October 2022). [CrossRef]
- Qummar, S.; Khan, F.G.; Shah, S.; Khan, A.; Shamshirband, S.; Rehman, Z.U.; Jadoon, W. A deep learning ensemble approach for diabetic retinopathy detection. IEEE Access 2019, 7, 150530–150539. Available online: https://ieeexplore.ieee.org/abstract/document/8869883/ (accessed on 18 October 2022). [CrossRef]
- Gao, Z.; Li, J.; Guo, J.; Chen, Y.; Yi, Z.; Zhong, J. Diagnosis of diabetic retinopathy using deep neural networks. IEEE Access 2018, 7, 3360–3370. Available online: https://ieeexplore.ieee.org/abstract/document/8581492/ (accessed on 18 October 2022). [CrossRef]
- Gayathri, S.; Gopi, V.P.; Palanisamy, P. A lightweight CNN for Diabetic Retinopathy classification from fundus images. Biomed. Signal Process. Control 2020, 62, 102115. Available online: https://www.sciencedirect.com/science/article/pii/S1746809420302676 (accessed on 18 October 2022).
- Wan, S.; Liang, Y.; Zhang, Y. Deep convolutional neural networks for diabetic retinopathy detection by image classification. Comput. Electr. Eng. 2018, 72, 274–282. Available online: https://www.sciencedirect.com/science/article/pii/S0045790618302556 (accessed on 18 October 2022). [CrossRef]
- Verbraak, F.D.; Abramoff, M.D.; Bausch, G.C.; Klaver, C.; Nijpels, G.; Schlingemann, R.O.; van der Heijden, A.A. Diagnostic accuracy of a device for the automated detection of diabetic retinopathy in a primary care setting. Diabetes Care 2019, 42, 651–656. Available online: https://diabetesjournals.org/care/article-abstract/42/4/651/36147 (accessed on 18 October 2022). [CrossRef] [PubMed]
- Mansour, R.F. Deep-learning-based automatic computer-aided diagnosis system for diabetic retinopathy. Biomed. Eng. Lett. 2018, 8, 41–57. [Google Scholar] [CrossRef]
- Shanthi, T.; Sabeenian, R.S. Modified Alexnet architecture for classification of diabetic retinopathy images. Comput. Electr. Eng. 2019, 76, 56–64. Available online: https://www.sciencedirect.com/science/article/pii/S0045790618334190 (accessed on 18 October 2022). [CrossRef]
- Li, T.; Gao, Y.; Wang, K.; Guo, S.; Liu, H.; Kang, H. Diagnostic assessment of deep learning algorithms for diabetic retinopathy screening. Inf. Sci. 2019, 501, 511–522. Available online: https://www.sciencedirect.com/science/article/pii/S0020025519305377 (accessed on 18 October 2022). [CrossRef]
- Martinez-Murcia, F.J.; Ortiz, A.; Ramírez, J.; Górriz, J.M.; Cruz, R. Deep residual transfer learning for automatic diagnosis and grading of diabetic retinopathy. Neurocomputing 2021, 452, 424–434. Available online: https://www.sciencedirect.com/science/article/pii/S0925231220316520 (accessed on 18 October 2022). [CrossRef]
- Hemanth, D.J.; Deperlioglu, O.; Kose, U. An enhanced diabetic retinopathy detection and classification approach using deep convolutional neural network. Neural Comput. Appl. 2020, 32, 707–721. [Google Scholar] [CrossRef]
- Qiao, L.; Zhu, Y.; Zhou, H. Diabetic retinopathy detection using prognosis of microaneurysm and early diagnosis system for non-proliferative diabetic retinopathy based on deep learning algorithms. IEEE Access 2020, 8, 104292–104302. Available online: https://ieeexplore.ieee.org/abstract/document/9091167/ (accessed on 18 October 2022). [CrossRef]
- Zhang, C.; Lei, T.; Chen, P. Diabetic retinopathy grading by a source-free transfer learning approach. Biomed. Signal Process. Control 2022, 73, 103423. [Google Scholar] [CrossRef]
- Diabetic Retinopathy Detection|Kaggle. Available online: https://www.kaggle.com/competitions/diabetic-retinopathy-detection/data (accessed on 30 March 2022).
- Ahmed, I.A.; Senan, E.M.; Rassem, T.H.; Ali, M.A.; Shatnawi, H.S.A.; Alwazer, S.M.; Alshahrani, M. Eye Tracking-Based Diagnosis and Early Detection of Autism Spectrum Disorder Using Machine Learning and Deep Learning Techniques. Electronics 2022, 11, 530. [Google Scholar] [CrossRef]
- Senan, E.M.; Jadhav, M.E.; Rassem, T.H.; Aljaloud, A.S.; Mohammed, B.A.; Al-Mekhlafi, Z.G. Early Diagnosis of Brain Tumour MRI Images Using Hybrid Techniques between Deep and Machine Learning. Comput. Math. Methods Med. 2022, 2022, 8330833. [Google Scholar] [CrossRef] [PubMed]
- Olayah, F.; Senan, E.M.; Ahmed, I.A.; Awaji, B. AI Techniques of Dermoscopy Image Analysis for the Early Detection of Skin Lesions Based on Combined CNN Features. Diagnostics 2023, 13, 1314. [Google Scholar] [CrossRef]
- Bodapati, J.D.; Shaik, N.S.; Naralasetti, V. Deep convolution feature aggregation: An application to diabetic retinopathy severity level prediction. Signal Image Video Process. 2021, 15, 923–930. [Google Scholar] [CrossRef]
- Kandel, I.; Castelli, M. Transfer Learning with Convolutional Neural Networks for Diabetic Retinopathy Image Classification. A Review. Appl. Sci. 2020, 10, 2021. [Google Scholar] [CrossRef]
- Ebrahimi, P.; Salamzadeh, A.; Soleimani, M.; Khansari, S.M.; Zarea, H.; Fekete-Farkas, M. Startups and Consumer Purchase Behavior: Application of Support Vector Machine Algorithm. Big Data Cogn. Comput. 2022, 6, 34. [Google Scholar] [CrossRef]
- Abunadi, I.; Senan, E.M. Multi-Method Diagnosis of Blood Microscopic Sample for Early Detection of Acute Lymphoblastic Leukemia Based on Deep Learning and Hybrid Techniques. Sensors 2022, 22, 1629. [Google Scholar] [CrossRef]
- Atteia, G.; Abdel Samee, N.; El-Kenawy, E.-S.M.; Ibrahim, A. CNN-Hyperparameter Optimization for Diabetic Maculopathy Diagnosis in Optical Coherence Tomography and Fundus Retinography. Mathematics 2022, 10, 3274. [Google Scholar] [CrossRef]
- Abunadi, I.; Senan, E.M. Deep Learning and Machine Learning Techniques of Diagnosis Dermoscopy Images for Early Detection of Skin Diseases. Electronics 2021, 10, 3158. [Google Scholar] [CrossRef]
- Senan, E.M.; Jadhav, M.E.; Kadam, A. Classification of PH2 images for early detection of skin diseases. In Proceedings of the 2021 6th International Conference for Convergence in Technology (I2CT), Maharashtra, India, 2–4 April 2021; pp. 1–7. [Google Scholar] [CrossRef]
- Mujeeb Rahman, K.K.; Nasor, M.; Imran, A. Automatic Screening of Diabetic Retinopathy Using Fundus Images and Machine Learning Algorithms. Diagnostics 2022, 12, 2262. [Google Scholar] [CrossRef]
- Khalid, A.; Senan, E.M.; Al-Wagih, K.; Ali Al-Azzam, M.M.; Alkhraisha, Z.M. Hybrid Techniques of X-ray Analysis to Predict Knee Osteoarthritis Grades Based on Fusion Features of CNN and Handcrafted. Diagnostics 2023, 13, 1609. [Google Scholar] [CrossRef] [PubMed]
- Senan, E.M.; Abunadi, I.; Jadhav, M.E.; Fati, S.M. Score and Correlation Coefficient-Based Feature Selection for Predicting Heart Failure Diagnosis by Using Machine Learning Algorithms. Comput. Math. Methods Med. 2021, 2021. [Google Scholar] [CrossRef] [PubMed]
- Kalbhor, M.; Shinde, S.; Popescu, D.E.; Hemanth, D.J. Hybridization of Deep Learning Pre-Trained Models with Machine Learning Classifiers and Fuzzy Min–Max Neural Network for Cervical Cancer Diagnosis. Diagnostics 2023, 13, 1363. [Google Scholar] [CrossRef]
- Mohammed, B.A.; Senan, E.M.; Rassem, T.H.; Makbol, N.M.; Alanazi, A.A.; Al-Mekhlafi, Z.G.; Almurayziq, T.S.; Ghaleb, F.A. Multi-Method Analysis of Medical Records and MRI Images for Early Diagnosis of Dementia and Alzheimer’s Disease Based on Deep Learning and Hybrid Methods. Electronics 2021, 10, 2860. [Google Scholar] [CrossRef]
- Zhang, X.; Kim, Y.; Chung, Y.-C.; Yoon, S.; Rhee, S.-Y.; Kim, Y.S. A Wrapped Approach Using Unlabeled Data for Diabetic Retinopathy Diagnosis. Appl. Sci. 2023, 13, 1901. [Google Scholar] [CrossRef]


| Stages of DR | Lesion Detection | No of Images |
|---|---|---|
| Normal | It is normal and no abnormalities were noticed | 25,810 |
| Mild NPDR | The appearance of aneurysms lightly | 2443 |
| Moderate NPDR | Appearance of microvascular aneurysm with an amount of more than Mild NPDR and less than Severe NPDR | 5292 |
| severe NPDR | Spotted macular bleeding in the four quadrants Microvascular abnormalities in at least one quadrant The appearance of blood vessel protrusion in one of the quadrants | 873 |
| PDR | Appearance of pre-retinal hemorrhage—Appearance of Neovascularization | 708 |
| Phase | Training Phase | ||||
|---|---|---|---|---|---|
| Class Name | Normal | Mild | Moderate | Severe | Proliferative |
| Before augmentation | 1652 | 1563 | 3387 | 558 | 453 |
| After augmentation | 6608 | 6252 | 6774 | 6696 | 6342 |
| Phase | Training and Validation 80% | Testing 20% | |
|---|---|---|---|
| Classes | Training (80%) | Validation (20%) | |
| Normal | 1652 | 413 | 516 |
| Mild | 1563 | 391 | 489 |
| Moderate | 3387 | 847 | 1058 |
| Severe | 558 | 140 | 175 |
| Proliferative | 453 | 113 | 142 |
| Techniques | Extracting Features Methods | Training Time | Testing Time |
|---|---|---|---|
| CNN | GoogLeNet | 320 min 54 s | 13 min 49 s |
| ResNet-18 | 280 min 39 s | 11 min 8 s | |
| Hybrid | GoogLeNet + SVM | 5 min 26 s | 1 min 52 s |
| ResNet-18 + SVM | 4 min 9 s | 1 min 14 s | |
| FFNN | GoogLeNet and handcrafted | 11 min 18 s | 2 min 42 s |
| ResNet-18 and handcrafted | 9 min 31 s | 2 min 17 s |
| Methods | CNN Models | Hybrid Models | ||
|---|---|---|---|---|
| Measure | GoogLeNet | ResNet-18 | GoogLeNet + SVM | ResNet-18 + SVM |
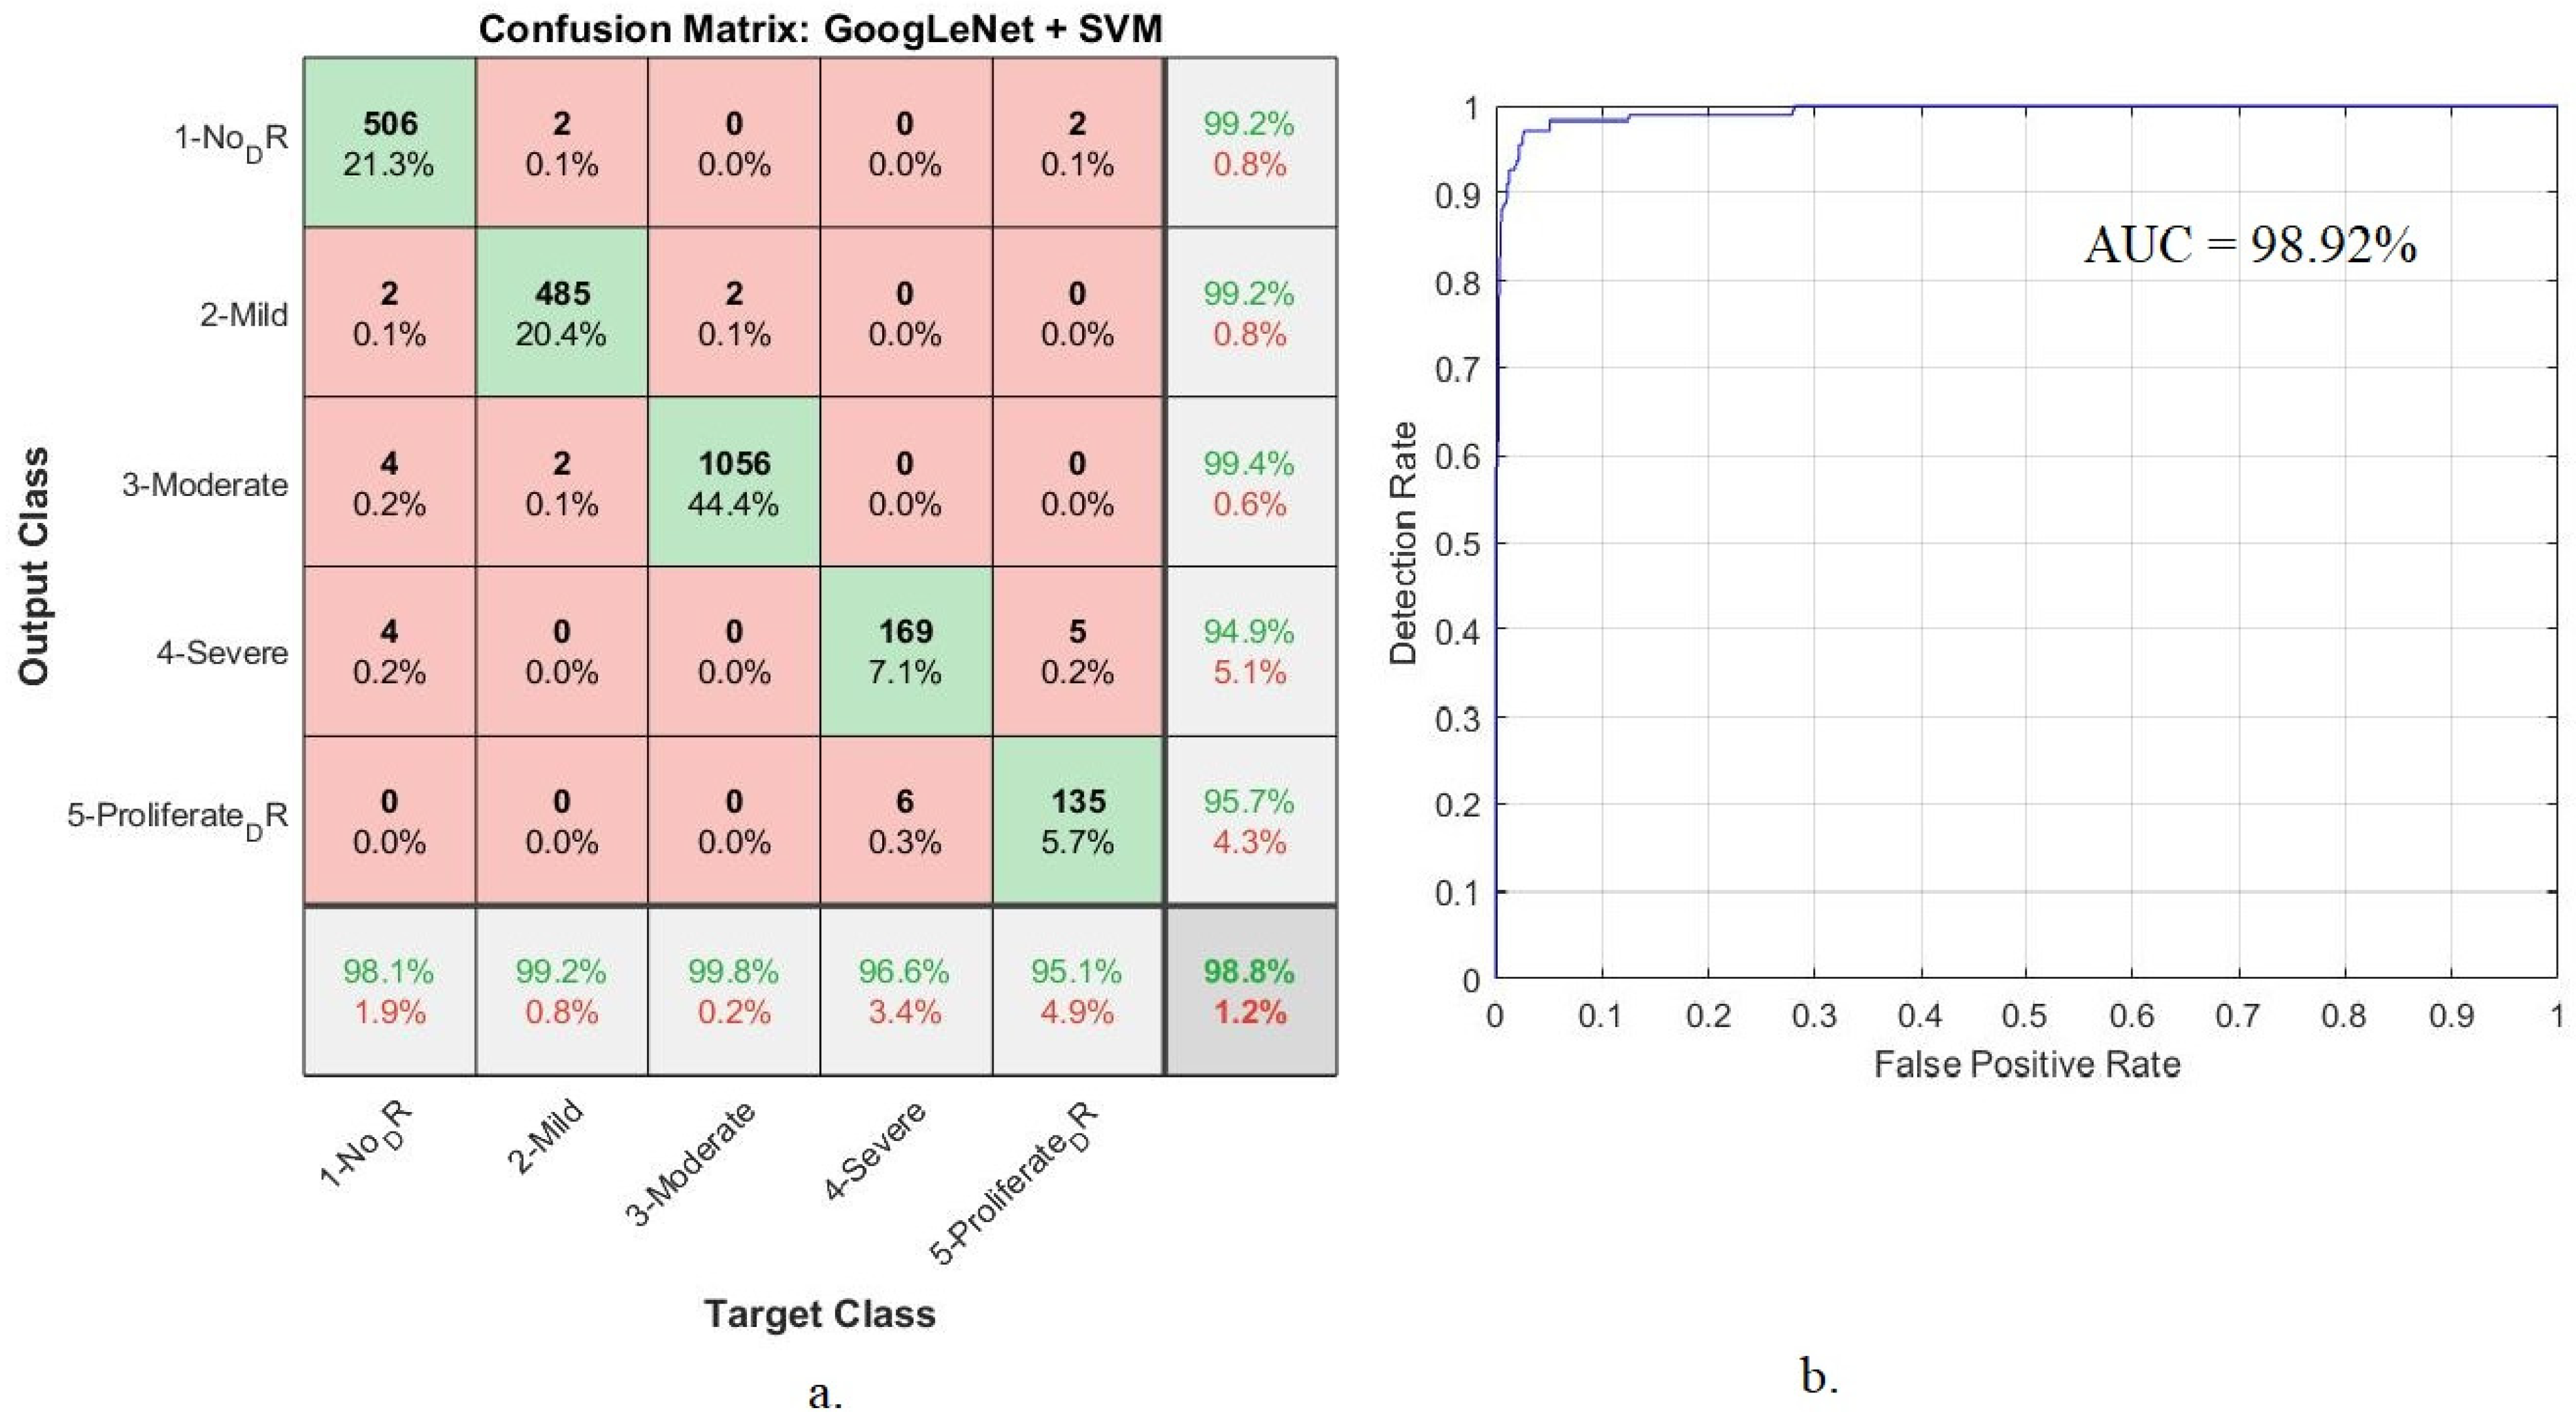
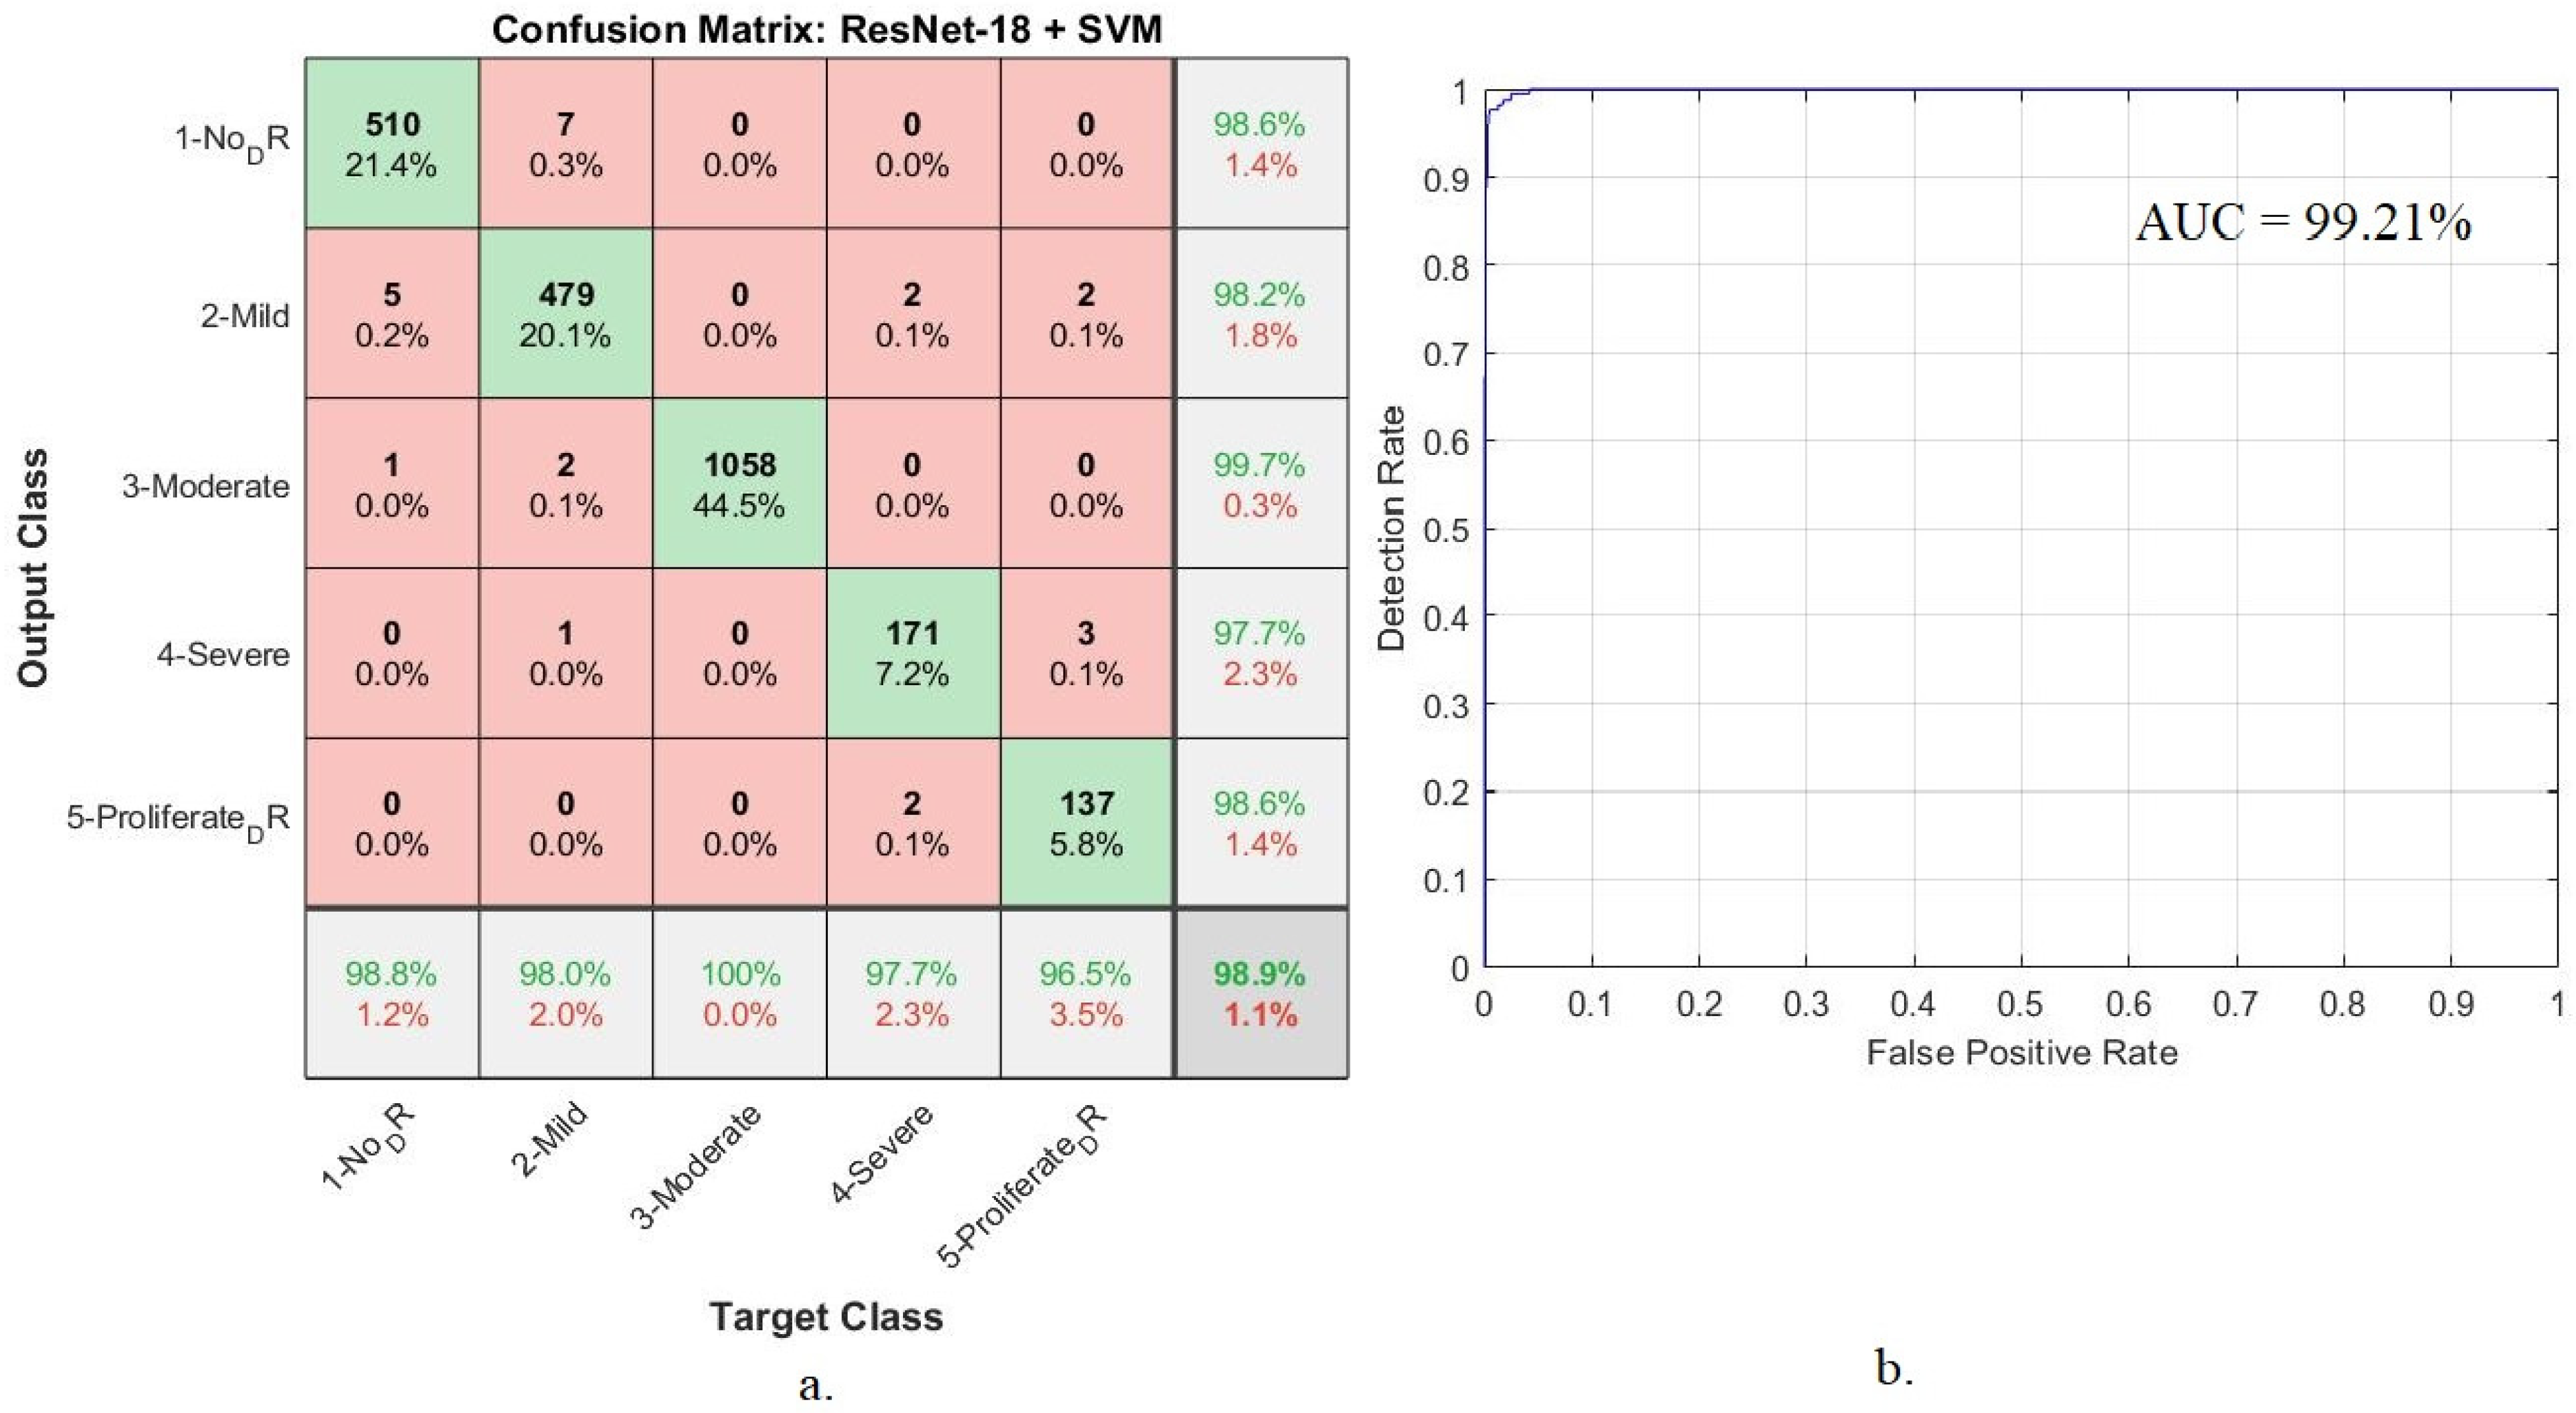
| Accuracy % | 92.56 | 91.47 | 98.8 | 98.9 |
| Precision % | 92.6 | 91.38 | 97.6 | 98.8 |
| Sensitivity % | 91.8 | 90.2 | 97.8 | 98.2 |
| Specificity % | 98.2 | 97.8 | 100 | 100 |
| AUC % | 97.42 | 96.58 | 98.92 | 99.21 |
| Hybrid Features | GoogLeNet-Handcrafted-FFNN | ResNet-18-Handcrafted-FFNN |
|---|---|---|
| Accuracy % | 99.6 | 99.7 |
| Precision % | 99.4 | 99.6 |
| Sensitivity % | 99.2 | 99.6 |
| Specificity % | 100 | 100 |
| AUC % | 99.78 | 99.86 |
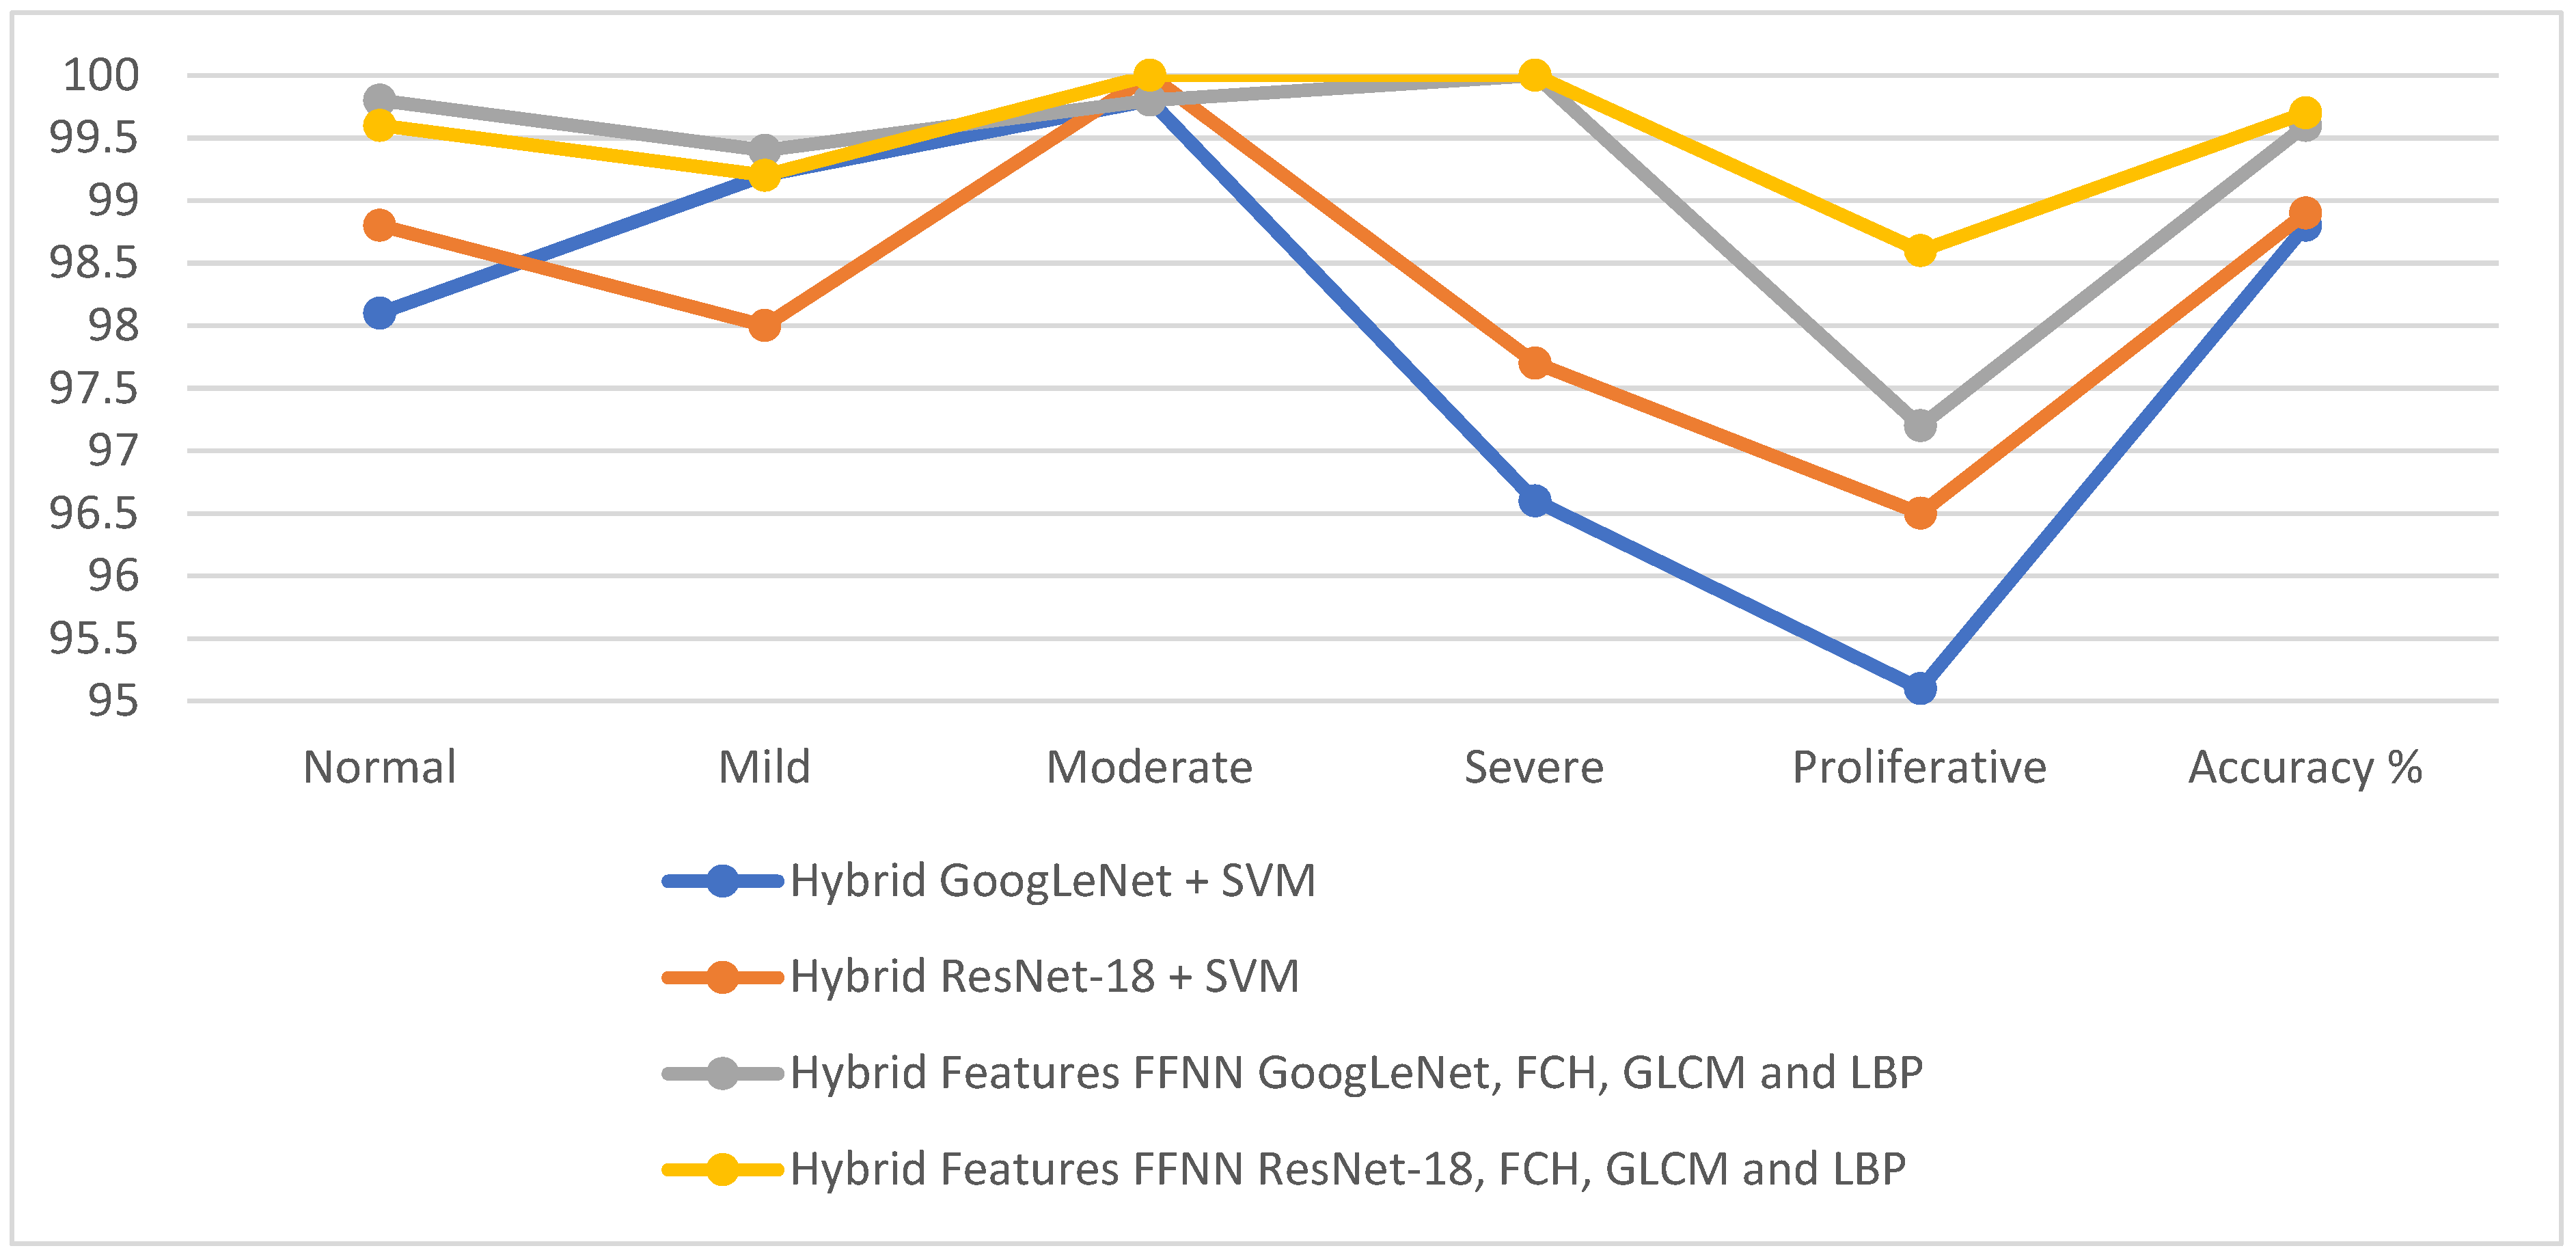
| Diseases | Normal | Mild | Moderate | Severe | Proliferative | Accuracy % | ||
|---|---|---|---|---|---|---|---|---|
| Hybrid | GoogLeNet + SVM | 98.1 | 99.2 | 99.8 | 96.6 | 95.1 | 98.8 | |
| ResNet-18 + SVM | 98.8 | 98 | 100 | 97.7 | 96.5 | 98.9 | ||
| Hybrid Features | FFNN | GoogLeNet, FCH, GLCM and LBP | 99.8 | 99.4 | 99.8 | 100 | 97.2 | 99.6 |
| ResNet-18, FCH, GLCM and LBP | 99.6 | 99.2 | 100 | 100 | 98.6 | 99.7 | ||
| Methods | CNN Models | Hybrid Models | CNN-Handcrafted-FFNN | |||
|---|---|---|---|---|---|---|
| Measure | GoogLeNet | ResNet-18 | GoogLeNet + SVM | ResNet-18 + SVM | GoogLeNet-Handcrafted-FFNN | ResNet-18-Handcrafted-FFNN |
| Accuracy % | 92.56 | 91.47 | 98.8 | 98.9 | 99.6 | 99.7 |
| Precision % | 92.6 | 91.38 | 97.6 | 98.8 | 99.4 | 99.6 |
| Sensitivity % | 91.8 | 90.2 | 97.8 | 98.2 | 99.2 | 99.6 |
| Specificity % | 98.2 | 97.8 | 100 | 100 | 100 | 100 |
| AUC % | 97.42 | 96.58 | 98.92 | 99.21 | 99.78 | 99.86 |
| Previous Studies | Accuracy % | Sensitivity % | Specificity % | AUC % |
|---|---|---|---|---|
| Liu et al. [12] | 85.44 | 98.48 | 71.82 | - |
| Qummar et al. [13] | 65.2 | 64.2 | 66.2 | - |
| Gao et al. [14] | 85.5 | 94 | 93.01 | - |
| Wan et al. [16] | 93.36 | 77.66 | 93.45 | 92.72 |
| Romany et al. [18] | 95.26 | 96 | 93 | - |
| Shanthi et al. [19] | 96.6 | - | - | - |
| Martinez et al. [21] | 95.5 | 98.3 | 94.5 | 97.3 |
| Hemanth et al. [22] | 97 | 94 | 98 | - |
| Proposed model | 99.7 | 99.6 | 100 | 99.86 |
Disclaimer/Publisher’s Note: The statements, opinions and data contained in all publications are solely those of the individual author(s) and contributor(s) and not of MDPI and/or the editor(s). MDPI and/or the editor(s) disclaim responsibility for any injury to people or property resulting from any ideas, methods, instructions or products referred to in the content. |
© 2023 by the authors. Licensee MDPI, Basel, Switzerland. This article is an open access article distributed under the terms and conditions of the Creative Commons Attribution (CC BY) license (https://creativecommons.org/licenses/by/4.0/).
Share and Cite
Alshahrani, M.; Al-Jabbar, M.; Senan, E.M.; Ahmed, I.A.; Saif, J.A.M. Hybrid Methods for Fundus Image Analysis for Diagnosis of Diabetic Retinopathy Development Stages Based on Fusion Features. Diagnostics 2023, 13, 2783. https://doi.org/10.3390/diagnostics13172783
Alshahrani M, Al-Jabbar M, Senan EM, Ahmed IA, Saif JAM. Hybrid Methods for Fundus Image Analysis for Diagnosis of Diabetic Retinopathy Development Stages Based on Fusion Features. Diagnostics. 2023; 13(17):2783. https://doi.org/10.3390/diagnostics13172783
Chicago/Turabian StyleAlshahrani, Mohammed, Mohammed Al-Jabbar, Ebrahim Mohammed Senan, Ibrahim Abdulrab Ahmed, and Jamil Abdulhamid Mohammed Saif. 2023. "Hybrid Methods for Fundus Image Analysis for Diagnosis of Diabetic Retinopathy Development Stages Based on Fusion Features" Diagnostics 13, no. 17: 2783. https://doi.org/10.3390/diagnostics13172783