
Evaluation of Contrast-Enhanced Mammography and Development of Flowchart for BI-RADS Classification of Breast Lesions

 ,
,
Abstract
:1. Introduction
2. Materials and Methods
2.1. Study Design
2.2. Study Population
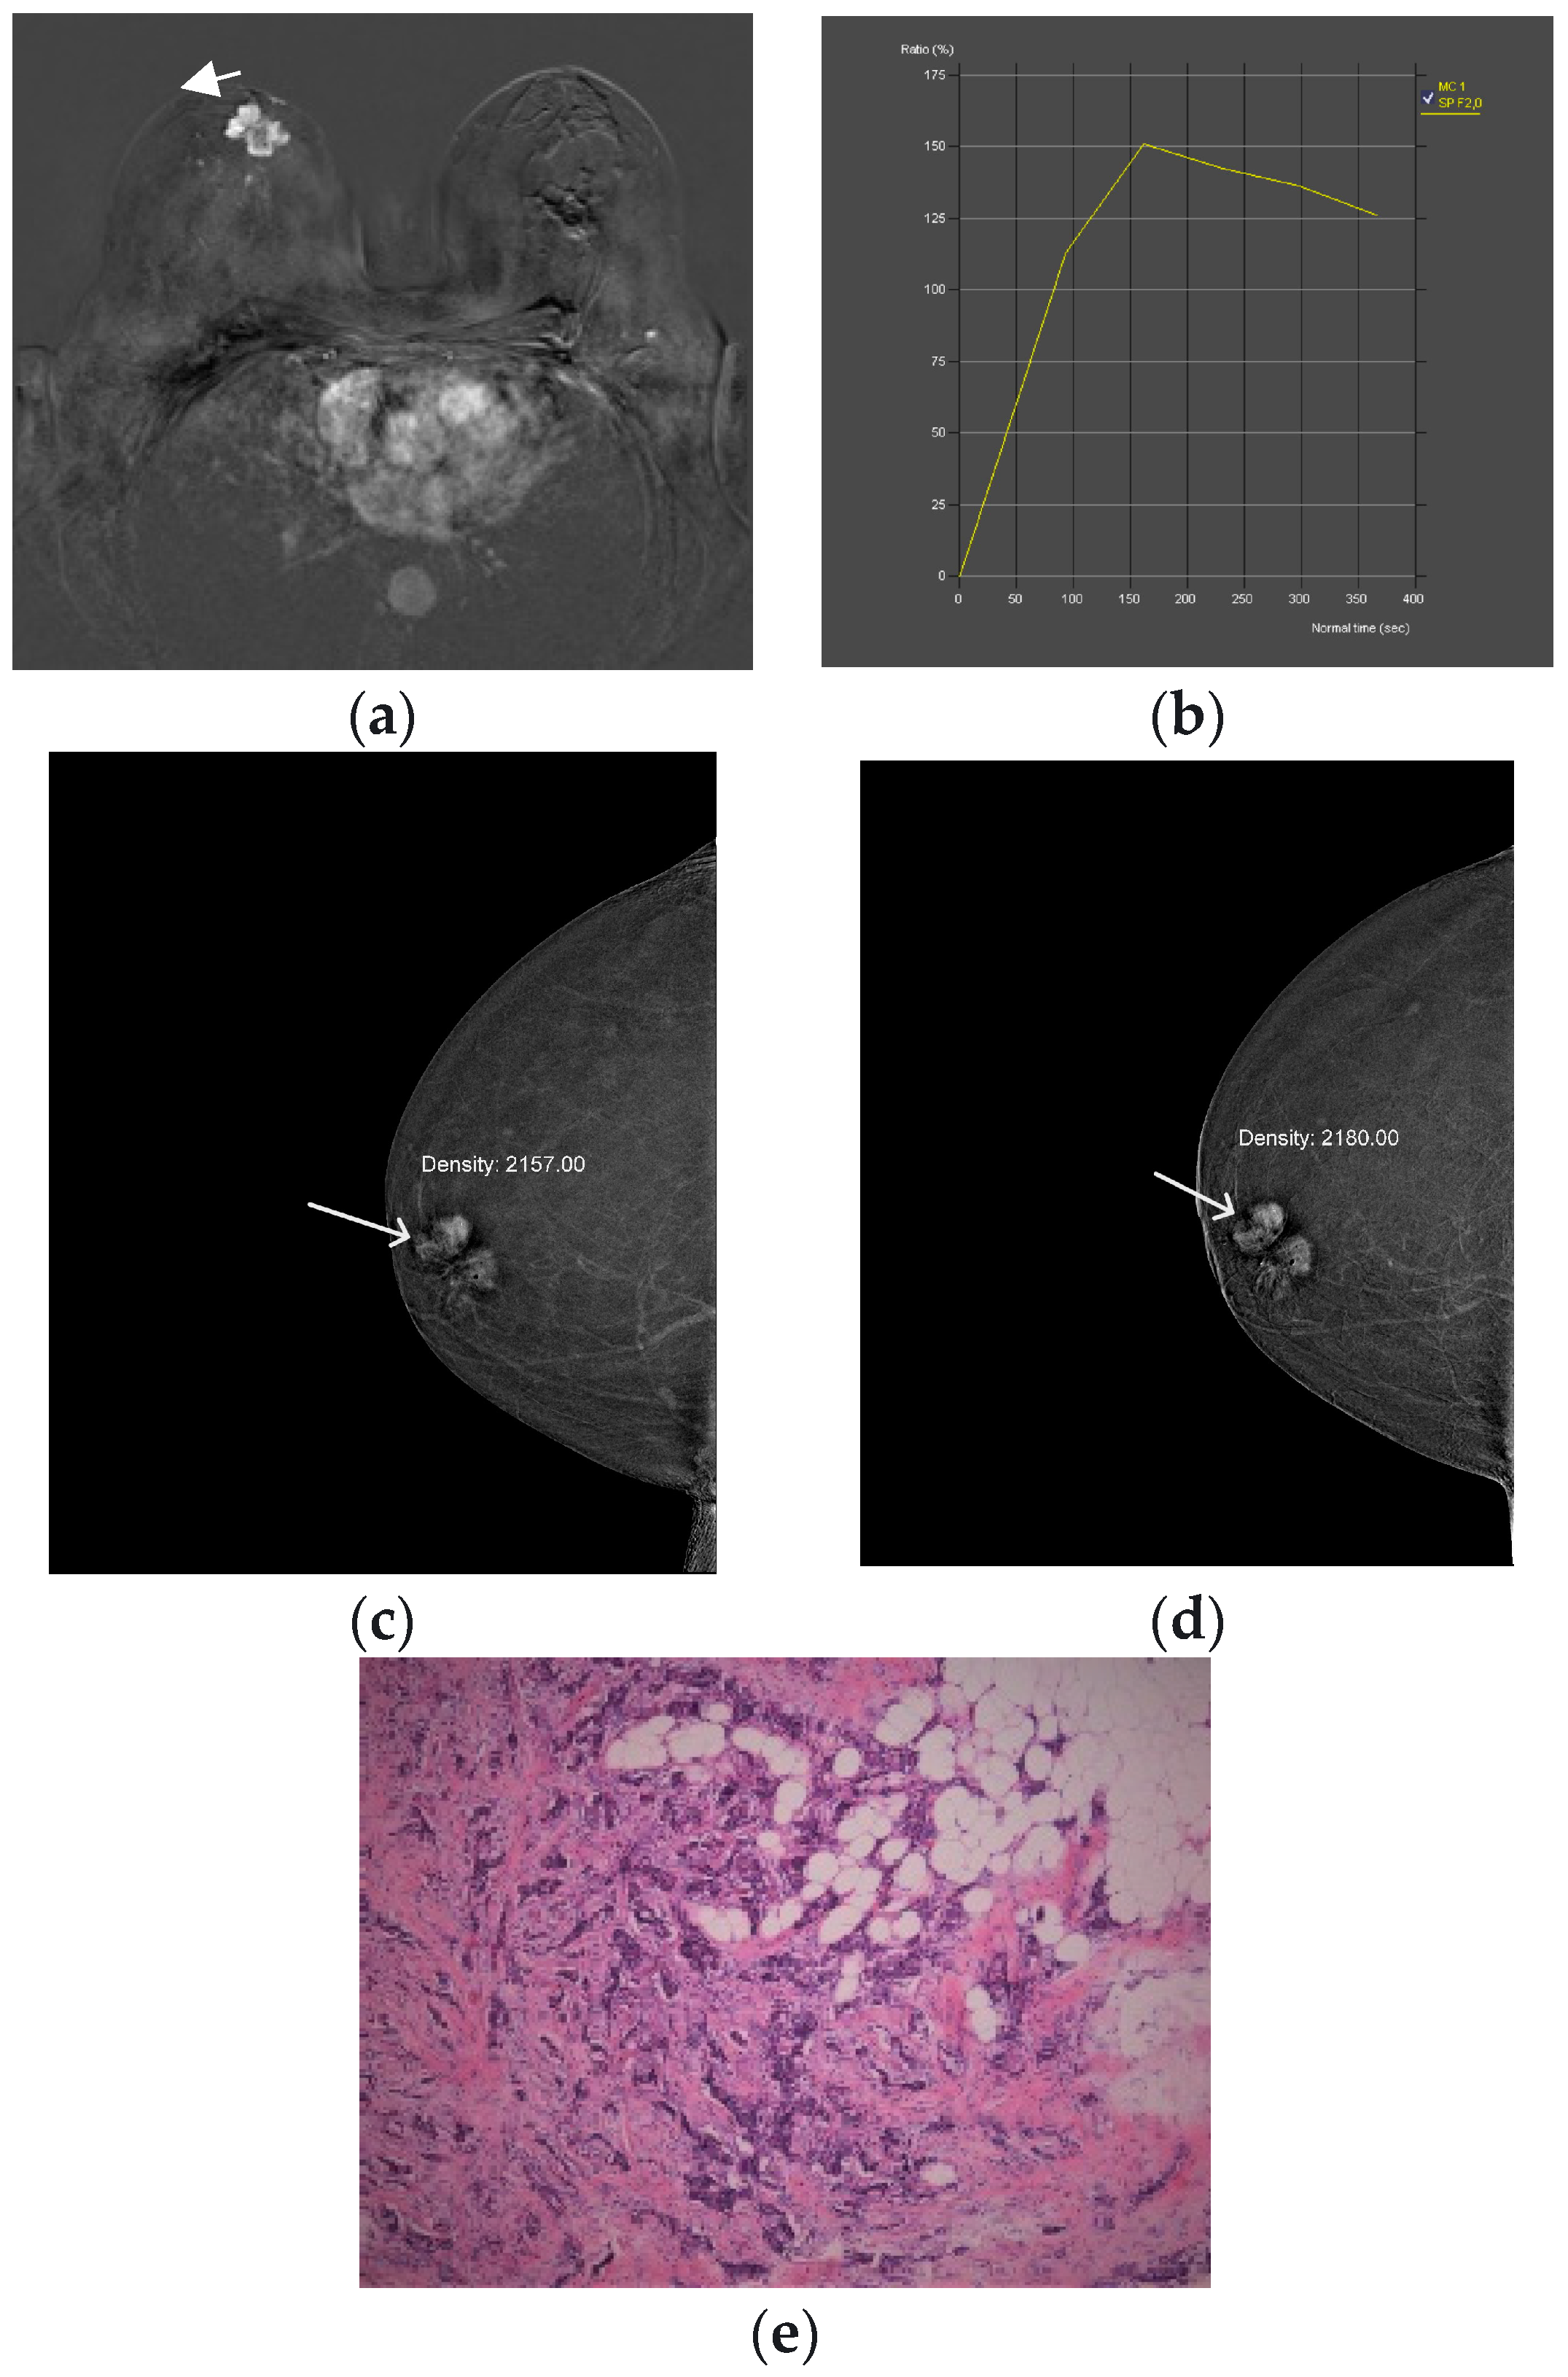
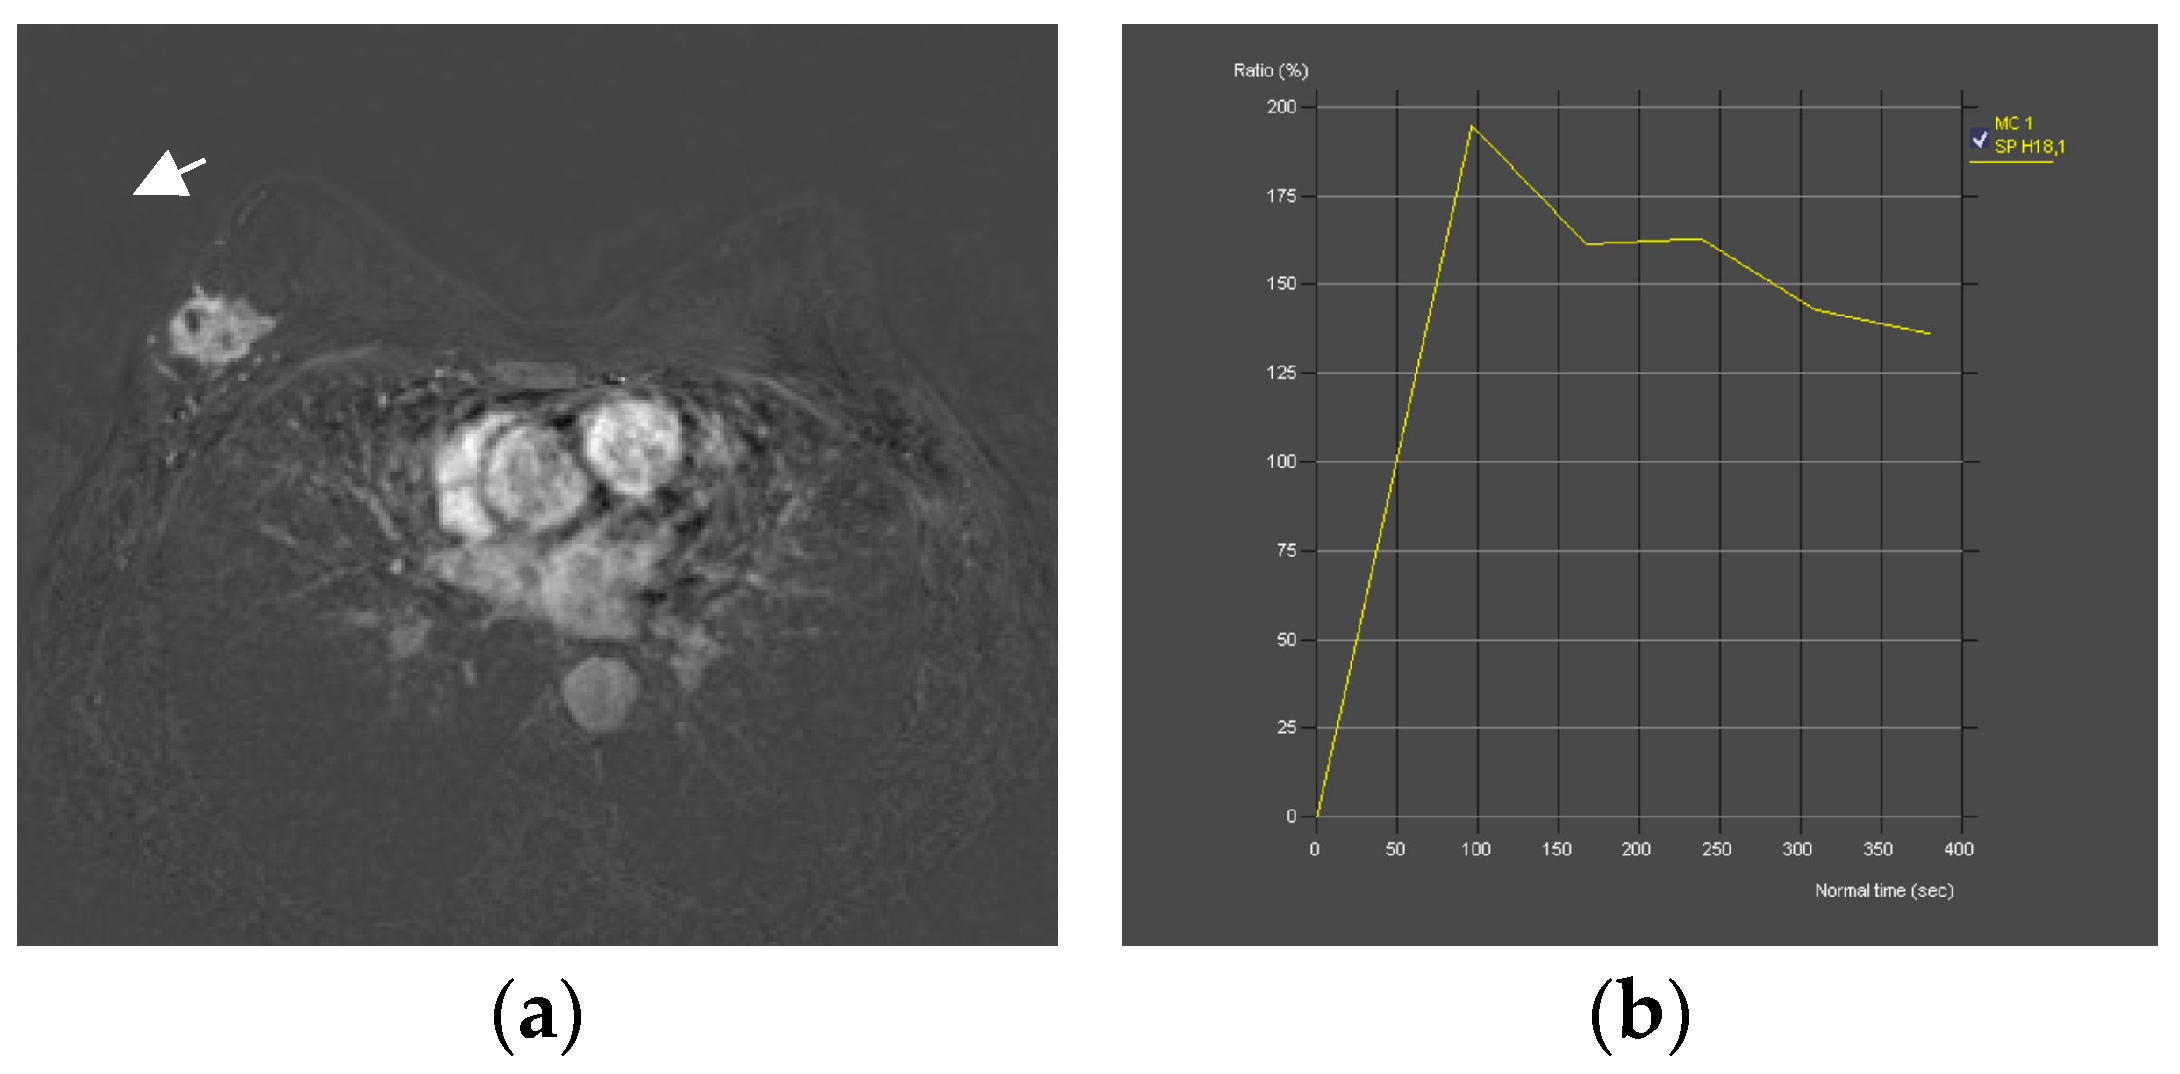
2.3. CEM and MRI Image Acquisition and Comparison
- Spiculated/root sign: absent/present
- Delayed phase: persistent/plato/washout
- Margins: circumscribed/irregular
- Internal enhancement: homogeneous, centrifugal/inhomogeneous, centripetal
- Diffuse oedema: absent/present
2.4. Clinicopathological Data
2.5. Statistical Analysis
3. Results
4. Discussion
5. Conclusions
Author Contributions
Funding
Institutional Review Board Statement
Informed Consent Statement
Data Availability Statement
Conflicts of Interest
References
- Sung, H.; Ferlay, J.; Siegel, R.L.; Laversanne, M.; Soerjomataram, I.; Jemal, A.; Bray, F. Global Cancer Statistics 2020: GLOBOCAN Estimates of Incidence and Mortality Worldwide for 36 Cancers in 185 Countries. CA Cancer J. Clin. 2021, 71, 209–249. [Google Scholar] [CrossRef] [PubMed]
- Kashyap, D.; Pal, D.; Sharma, R.; Garg, V.K.; Goel, N.; Koundal, D.; Zaguia, A.; Koundal, S.; Belay, A. Global Increase in Breast Cancer Incidence: Risk Factors and Preventive Measures. Biomed. Res. Int. 2022, 2022, 9605439. [Google Scholar] [CrossRef] [PubMed]
- Arnold, M.; Morgan, E.; Rumgay, H.; Mafra, A.; Singh, D.; Laversanne, M.; Vignat, J.; Gralow, J.R.; Cardoso, F.; Siesling, S.; et al. The current and future burden of breast cancer: Global statistics for 2020 and 2040. Breast 2022, 66, 15–23. [Google Scholar] [CrossRef] [PubMed]
- Cardoso, F.; Kyriakides, S.; Ohno, S.; Penault-Llorca, F.; Poortmans, P.; Rubio, I.T.; Zackrisson, S.; Senkus, E.; ESMO Guidelines Committee. Early breast cancer: ESMO Clinical Practice Guidelines for diagnosis, treatment and follow-up. Ann. Oncol. 2019, 30, 1194–1220. [Google Scholar] [CrossRef] [PubMed] [Green Version]
- Gennari, A.; André, F.; Barrios, C.H.; Cortés, J.; de Azambuja, E.; DeMichele, A.; Dent, R.; Fenlon, D.; Gligorov, J.; Hurvitz, S.A.; et al. ESMO Clinical Practice Guideline for the diagnosis, staging and treatment of patients with metastatic breast cancer. Ann. Oncol. 2021, 32, 1475–1495. [Google Scholar] [CrossRef] [PubMed]
- Barnard, M.E.; Boeke, C.E.; Tamimi, R.M. Established breast cancer risk factors and risk of intrinsic tumour subtypes. Biochim. Biophys. Acta Rev. Cancer 2015, 1856, 73–85. [Google Scholar] [CrossRef] [PubMed]
- Phillips, J.; Fein-Zachary, V.J.; Slanetz, P.J. Pearls and Pitfalls of Contrast-Enhanced Mammography. J. Breast Imaging 2019, 1, 64–72. [Google Scholar] [CrossRef]
- Nori, J.; Kaur, M. Contrast-Enhanced Digital Mammography; Springer International Publishing AG: New York, NY, USA, 2018. [Google Scholar] [CrossRef]
- Gelardi, F.; Ragaini, E.M.; Sollini, M.; Bernardi, D.; Chiti, A. Contrast-Enhanced Mammography versus Breast Magnetic Resonance Imaging: A Systematic Review and Meta-Analysis. Diagnostics 2022, 12, 1890. [Google Scholar] [CrossRef]
- Kamal, R.; Mansour, S.; Farouk, A.; Hanafy, M.; Elhatw, A.; Goma, M.M. Contrast-enhanced mammography in comparison with dynamic contrast-enhanced MRI: Which modality is appropriate for whom? Egypt. J. Radiol. Nucl. Med. 2021, 52, 216. [Google Scholar] [CrossRef]
- Cheung, Y.C.; Juan, Y.H.; Lin, Y.C.; Lo, Y.-F.; Tsai, H.-P.; Ueng, S.-H.; Chen, S.-C. Dual-Energy Contrast-Enhanced Spectral Mammography: Enhancement Analysis on BI-RADS 4 Non-Mass Microcalcifications in Screened Women. PLoS ONE 2016, 11, e0162740. [Google Scholar] [CrossRef] [PubMed]
- Jochelson, M.S.; Lobbes, M.B.I. Contrast-enhanced Mammography: State of the Art. Radiology 2021, 299, 36–48. [Google Scholar] [CrossRef] [PubMed]
- Fusco, R.; Raiano, N.; Raiano, C.; Maio, F.; Vallone, P.; Raso, M.M.; Setola, S.V.; Granata, V.; Rubulotta, M.R.; Barretta, M.L.; et al. Evaluation of average glandular dose and investigation of the relationship with compressed breast thickness in dual energy contrast enhanced digital mammography and digital breast tomosynthesis. Eur. J. Radiol. 2020, 126, 108912. [Google Scholar] [CrossRef] [PubMed]
- Neeter, L.M.; Raat, H.; Alcantara, R.; Robbe, Q.; Smidt, M.L.; Wildberger, J.E.; Lobbes, M.B. Contrast-enhanced mammography: What the radiologist needs to know. BJR Open 2021, 3, 20210034. [Google Scholar] [CrossRef] [PubMed]
- Contrast-Enhanced Mammography (A Supplement to ACR BI-RADS Mammography 2013) [Internet]. Available online: https://www.acr.org/ (accessed on 1 February 2022).
- Baltzer, P.A.T.; Krug, K.B.; Dietzel, M. Evidence-Based and Structured Diagnosis in Breast MRI using the Kaiser Score. RöFo Fortschr. Auf Dem Geb. Röntgenstrahlen Bildgeb. Verfahr. 2022, 194, 1216–1228. [Google Scholar] [CrossRef] [PubMed]
- Baltzer, P.A.T.; Dietzel, M.; Burmeister, H.P.; Zoubi, R.; Gajda, M.; Camara, O.; Kaiser, W.A. Application of MR mammography beyond local staging: Is there a potential to accurately assess axillary lymph nodes? evaluation of an extended protocol in an initial prospective study. AJR Am. J. Roentgenol. 2011, 196, W641–W647. [Google Scholar] [CrossRef] [PubMed]
- EasyROC Web Tool. 2022. Available online: http://www.biosoft.hacettepe.edu.tr/easyROC/ (accessed on 27 April 2023).
- R Core Team. R: A Language and Environment for Statistical Computing. (Version 4.1) [Computer Software]. 2021. (R Packages Retrieved from MRAN Snapshot 2022-01-01). Available online: https://cran.r-project.org (accessed on 1 February 2022).
- Thiele, C. Cutpoint: Determine and Evaluate Optimal Cutpoints in Binary Classification Tasks. [R Package]. 2019. Available online: https://cran.r-project.org/package=cutpointr (accessed on 27 April 2023).
- Friesen, L.; Kroc, E.; Zumbo, B.D. Psychometrics & Post-Data Analysis: Test ROC. [Jamovi Module]. 2019. Available online: https://github.com/lucasjfriesen/jamoviPsychoPDA (accessed on 27 April 2023).
- Sogani, J.; Mango, V.L.; Keating, D.; Sung, J.S.; Jochelson, M.S. Contrast-enhanced mammography: Past, present, and future. Clin. Imaging 2021, 69, 269–279. [Google Scholar] [CrossRef] [PubMed]
- Rong, X.; Kang, Y.; Xue, J.; Han, P.; Li, Z.; Yang, G.; Shi, G. Value of contrast-enhanced mammography combined with the Kaiser score for clinical decision-making regarding tomosynthesis BI-RADS 4A lesions. Eur. Radiol. 2022, 32, 7439–7447. [Google Scholar] [CrossRef] [PubMed]
- Kang, Y.; Li, Z.; Yang, G.; Xue, J.; Zhang, L.; Rong, X. Diagnostic performance of the Kaiser score in the evaluation of breast lesions on contrast-enhanced mammography. Eur. J. Radiol. 2022, 156, 110524. [Google Scholar] [CrossRef] [PubMed]
- Ainakulova, A.S.; Zholdybay, Z.Z.; Kaidarova, D.R.; Inozemtceva, N.I.; Gabdullina, M.O.; Zhakenova, Z.K.; Panina, A.S.; Toleshbayev, D.K.; Amankulov, J.M. Contrast-enhanced spectral mammography without and with a delayed image for diagnosing malignancy among mass lesions in dense breast. Contemp. Oncol. 2021, 25, 17–22. [Google Scholar] [CrossRef]


| MRI | CEDM | |
|---|---|---|
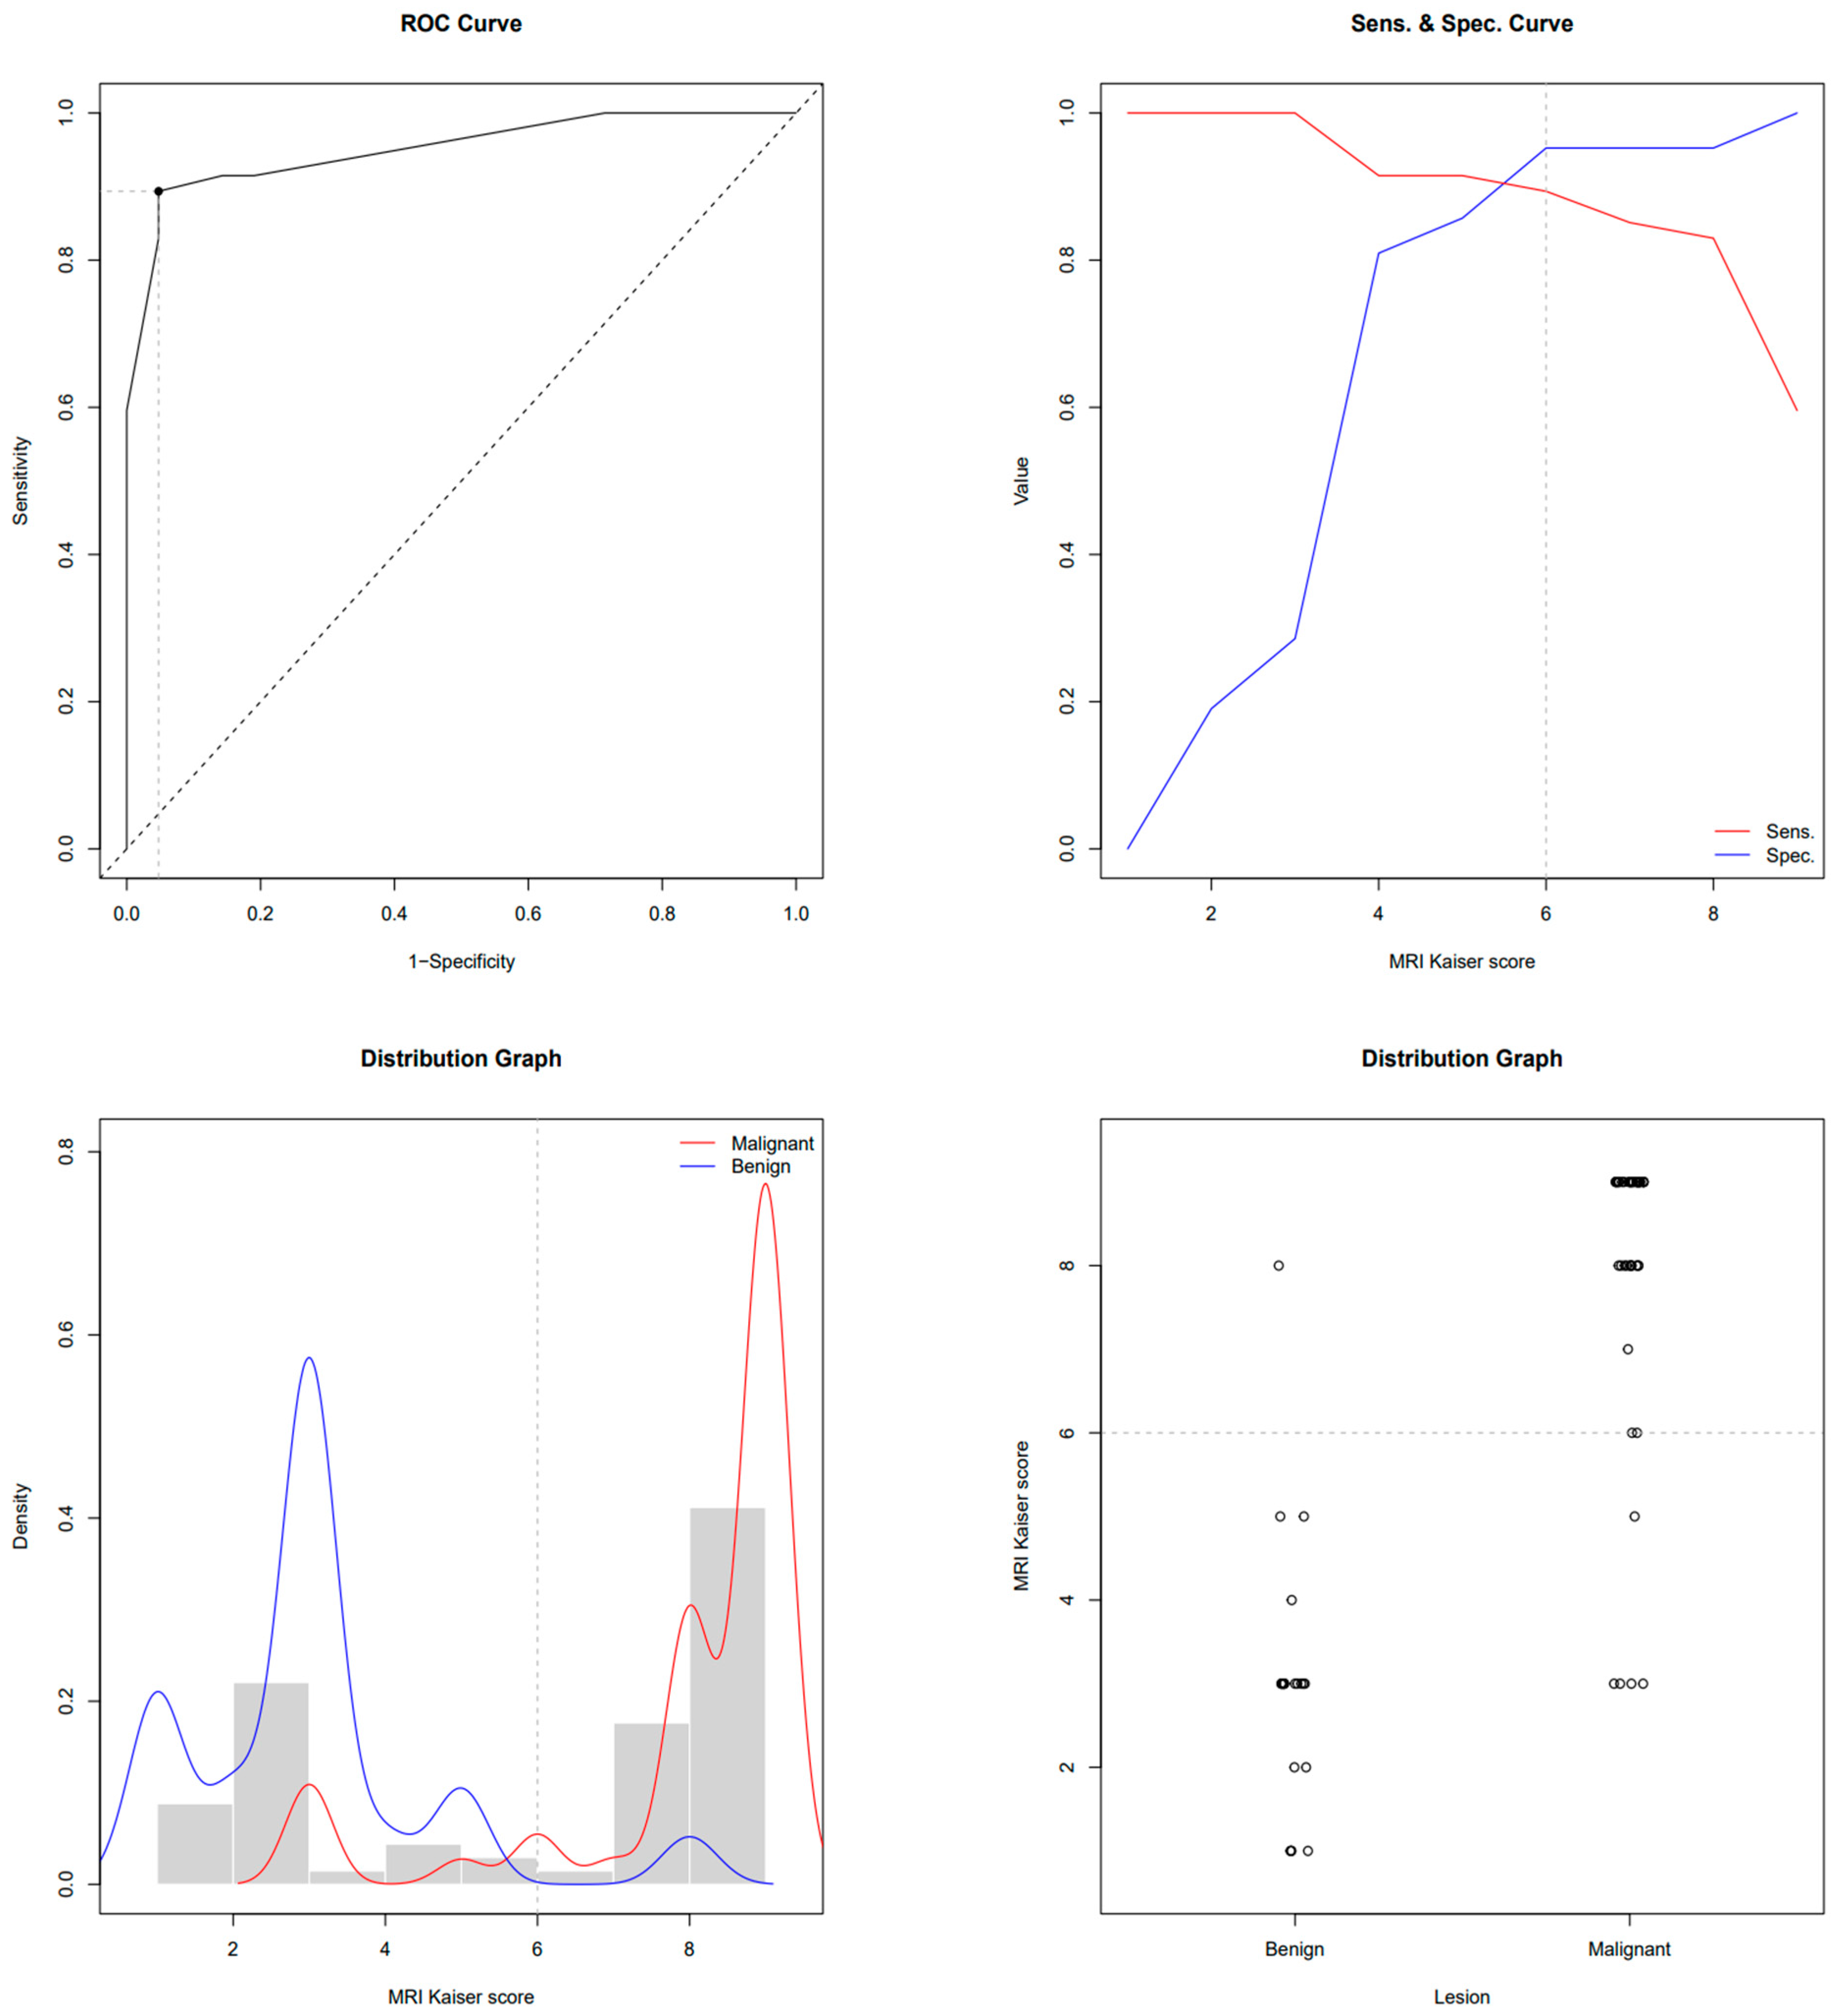
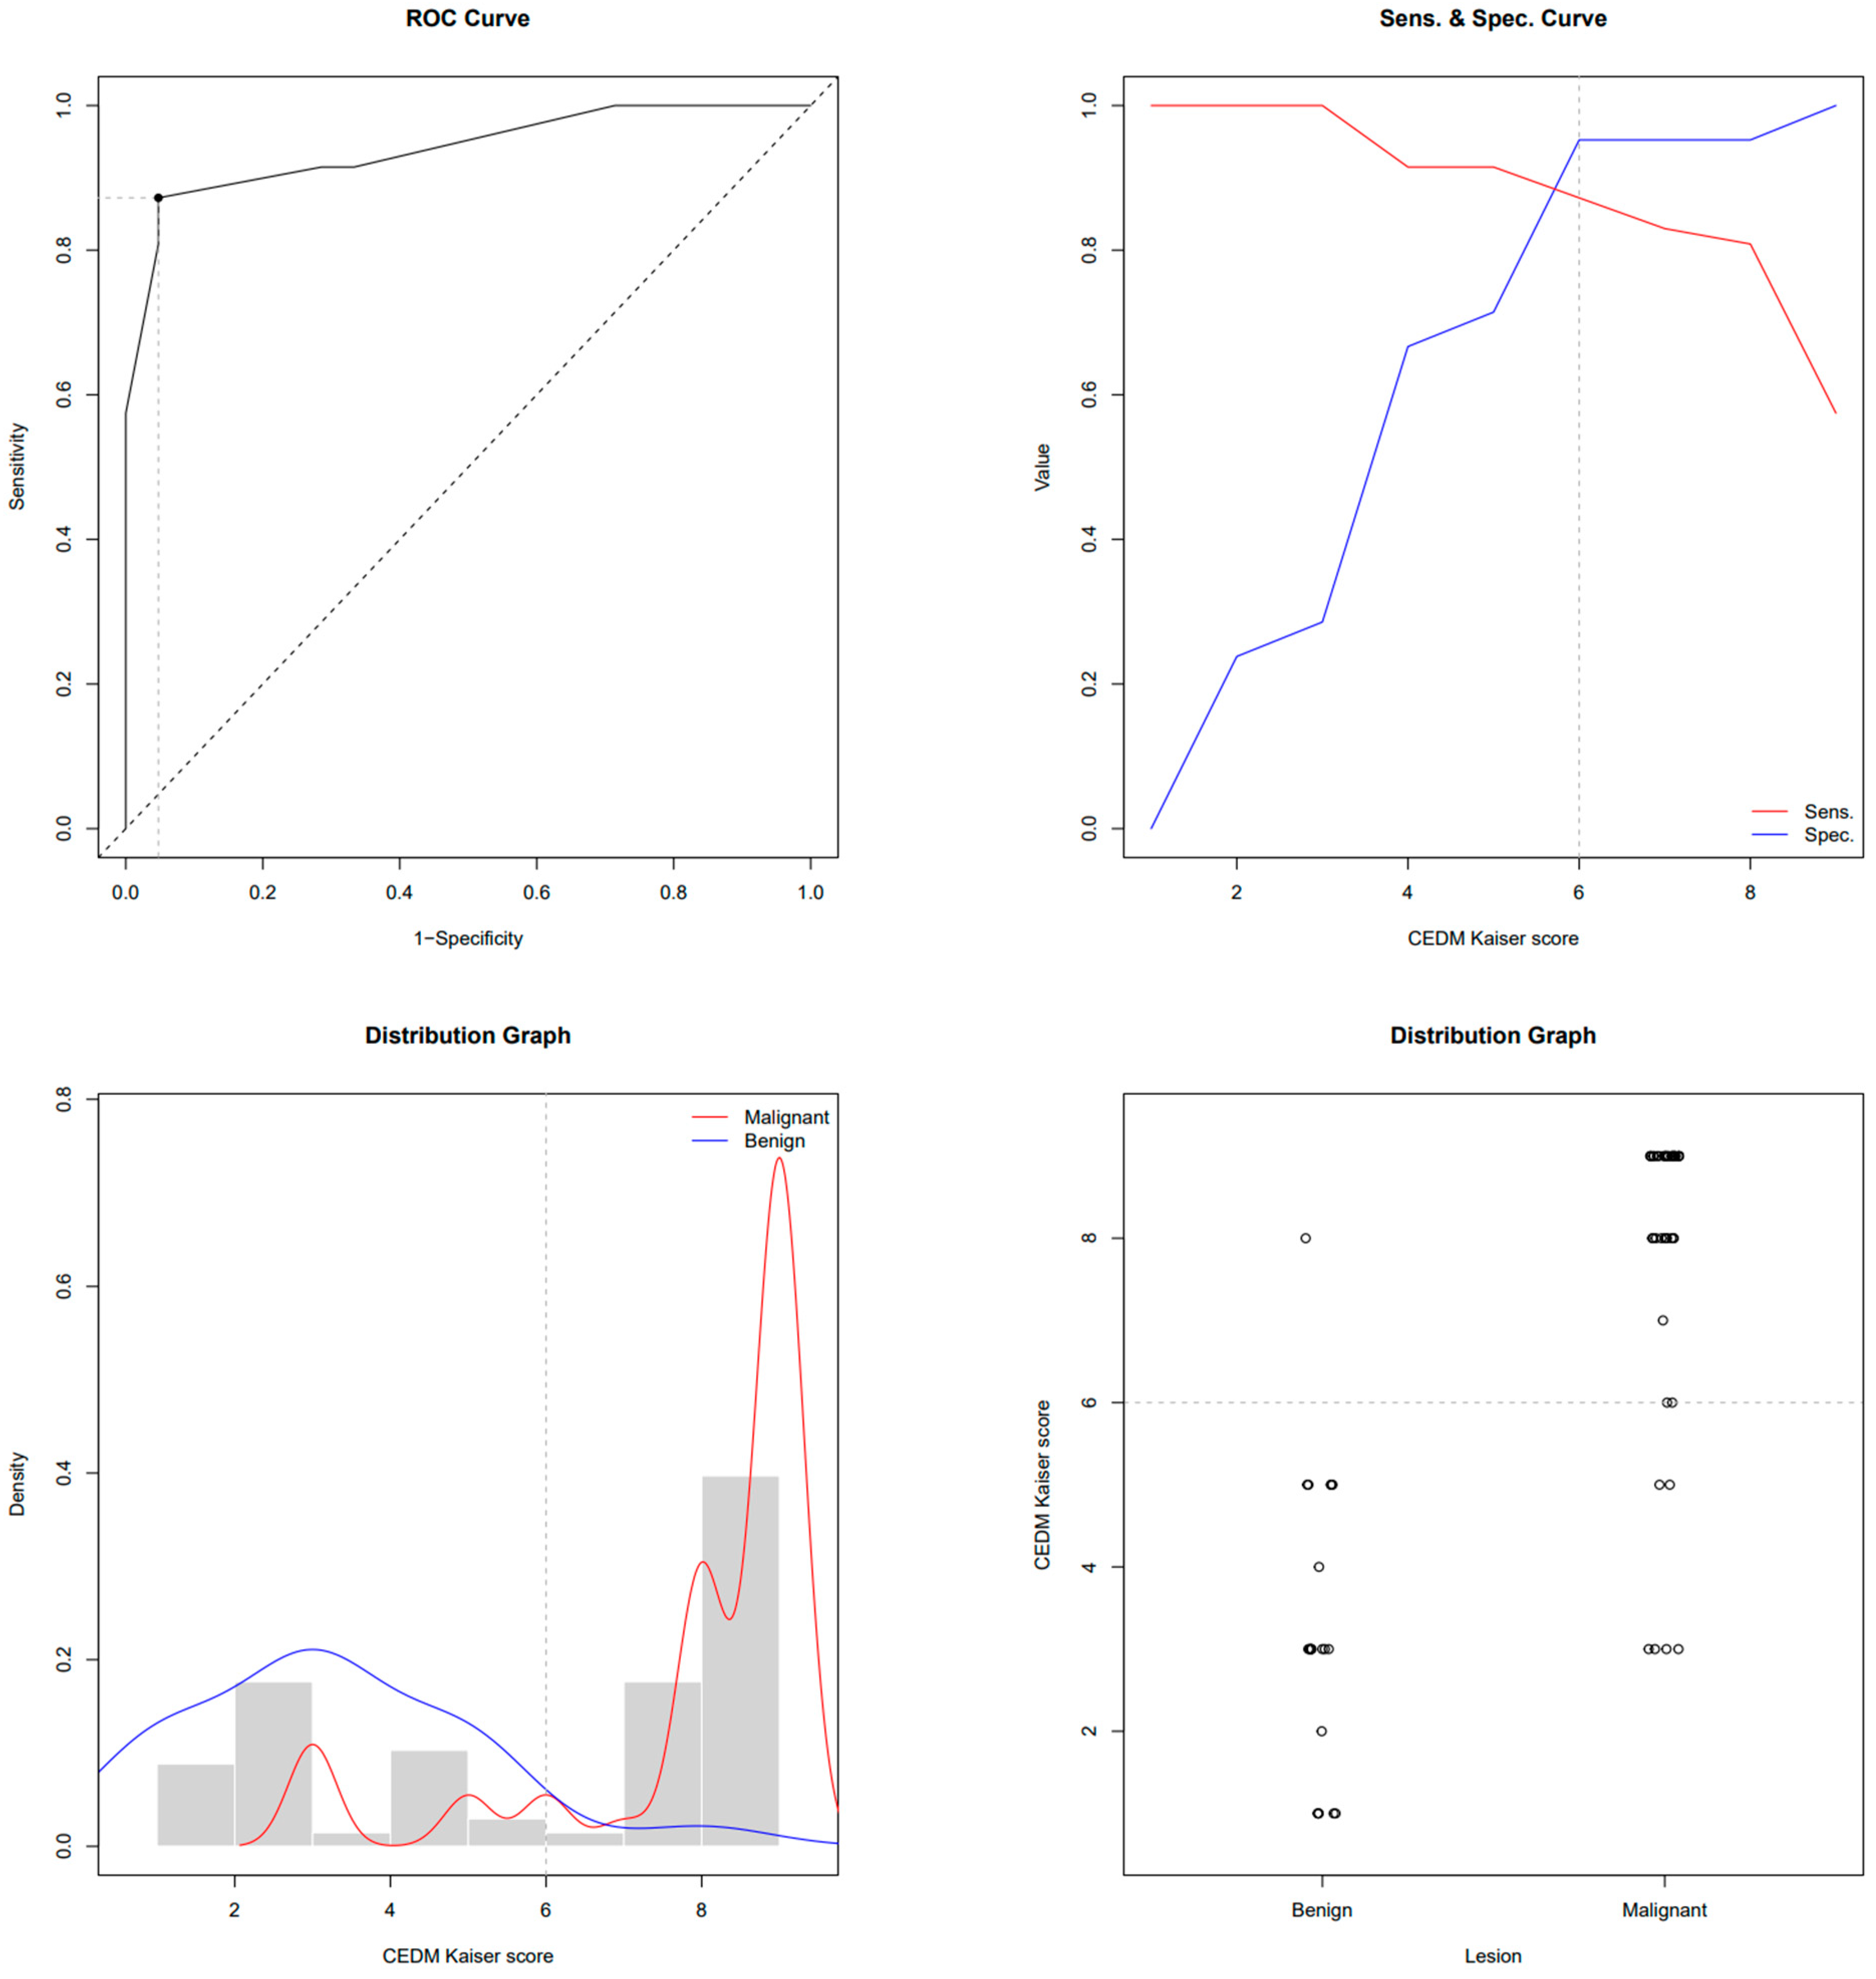
| AUC-ROC | 0.951 | 0.940 * |
| Youden cut-off value of Kaiser score | 6 | 6 |
| 100% TN Kaiser score | 3 | 3 |
| Sensitivity at Youden cut-off | 89.36% | 87.23% |
| Specificity at Youden cut-off | 95.24% | 95.24% |
| Accuracy at Youden cut-off | 88.2% | 86.8% |
| PPV at Youden cut-off | 97.67% | 97.62% |
| NPV at Youden cut-off | 80% | 76.92% |
| Specificity at 100% NPV | 28.57% | 28.57% |
| PPV at 100% NPV | 75.81% | 75.81% |
| Mammography BI-RADS | |
| BI-RADS 3 | 5 (11%) |
| BI-RADS 4 | 12 (26%) |
| BI-RADS 5 | 30 (64%) |
| Type of mammography | |
| National screening program | 13 (28%) |
| Diagnostic | 28 (60%) |
| MG taken at another institution | 6 (13%) |
| Mammography morphology | |
| Microcalcifications | 3 (6.4%) |
| Mass | 34 (72%) |
| Mass and microcalcifications | 4 (8.5%) |
| Architectural distortion | 2 (4.3%) |
| Asymmetry (focal asymmetrical density) | 4 (8.5%) |
| Mammography of suspicious axillary lymph nodes | |
| No | 45 (96%) |
| Yes | 2 (4.3%) |
| CEM microcalcifications | |
| No | 40 (85%) |
| Yes | 7 (15%) |
| CEM lesion size (mm) | 20 (IQR 14, 29) |
| MRI lesion size (mm) | 20 (IQR 14, 28) |
| Skin Thickening | |
| No | 45 (96%) |
| Yes | 2 (4.3%) |
| Skin retraction | |
| No | 41 (87%) |
| Yes | 6 (13%) |
| Reticular subcutaneous tissue | |
| No | 44 (94%) |
| Yes | 3 (6.4%) |
| Surgical treatment | |
| SNSM | 29 (62%) |
| RM | 12 (26%) |
| Neoadjuvant therapy + SNSM | 3 (6.4%) |
| Neoadjuvant therapy + RM | 3 (6.4%) |
| Axillary intervention | |
| None | 1 (2.1%) |
| SLNB | 20 (43%) |
| Dissection | 26 (55%) |
| Pathohistological Diagnosis | |
| Invasive lobular Ca + LCIS | 7 (15%) |
| Invasive ductal Ca NST + DCIS | 22 (47%) |
| DCIS | 3 (6.4%) |
| Invasive ductal Ca NST | 8 (17%) |
| Invasive lobular Ca + DCIS | 1 (2.1%) |
| Invasive lobular Ca | 3 (6.4%) |
| Invasive mucinous Ca + DCIS | 1 (2.1%) |
| Invasive mucinous Ca | 1 (2.1%) |
| Invasive tubular Ca | 1 (2.1%) |
| Immunohistochemistry—ER | |
| No | 3 (6%) |
| Yes | 44 (94%) |
| Immunohistochemistry—PR | |
| No | 5 (11%) |
| Yes | 42 (89%) |
| Immunohistochemistry—HER2 | |
| No | 38 (81%) |
| Yes | 6 (13%) |
| N/A | 3 (6%) |
| Immunohistochemistry—Ki-67 | |
| Low proliferation (<10%) | 12 (25.5%) |
| Moderate proliferation (10–20%) | 12 (25.5%) |
| High proliferation (>20%) | 21 (45%) |
| N/A | 2 (4%) |
Disclaimer/Publisher’s Note: The statements, opinions and data contained in all publications are solely those of the individual author(s) and contributor(s) and not of MDPI and/or the editor(s). MDPI and/or the editor(s) disclaim responsibility for any injury to people or property resulting from any ideas, methods, instructions or products referred to in the content. |
© 2023 by the authors. Licensee MDPI, Basel, Switzerland. This article is an open access article distributed under the terms and conditions of the Creative Commons Attribution (CC BY) license (https://creativecommons.org/licenses/by/4.0/).
Share and Cite
Klarić, K.; Šribar, A.; Budisavljević, A.; Labinac, L.; Valković Zujić, P. Evaluation of Contrast-Enhanced Mammography and Development of Flowchart for BI-RADS Classification of Breast Lesions. Diagnostics 2023, 13, 1958. https://doi.org/10.3390/diagnostics13111958
Klarić K, Šribar A, Budisavljević A, Labinac L, Valković Zujić P. Evaluation of Contrast-Enhanced Mammography and Development of Flowchart for BI-RADS Classification of Breast Lesions. Diagnostics. 2023; 13(11):1958. https://doi.org/10.3390/diagnostics13111958
Chicago/Turabian StyleKlarić, Kristina, Andrej Šribar, Anuška Budisavljević, Loredana Labinac, and Petra Valković Zujić. 2023. "Evaluation of Contrast-Enhanced Mammography and Development of Flowchart for BI-RADS Classification of Breast Lesions" Diagnostics 13, no. 11: 1958. https://doi.org/10.3390/diagnostics13111958