
Explainable AI for Retinoblastoma Diagnosis: Interpreting Deep Learning Models with LIME and SHAP


Abstract
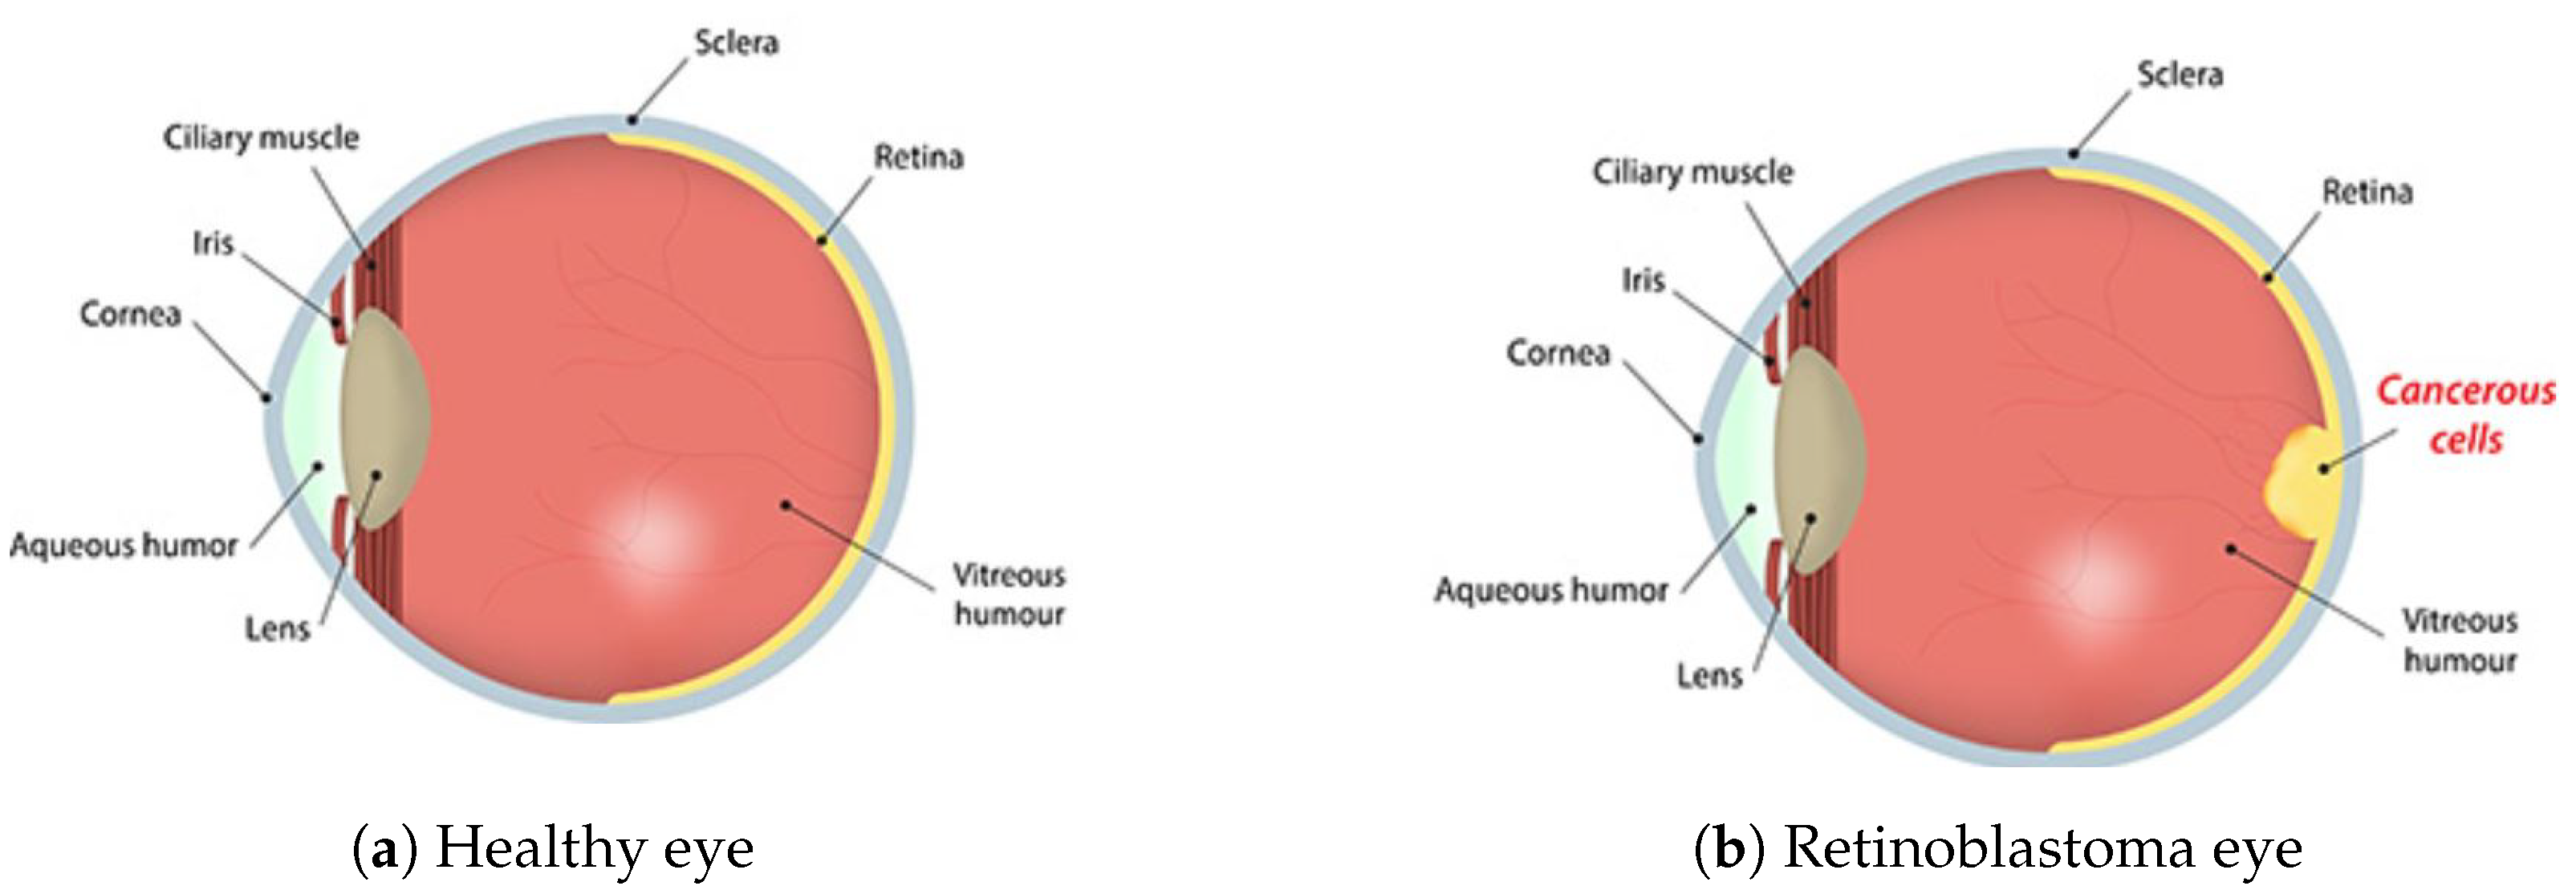
:1. Introduction
- We propose a novel approach to improve the interpretability of deep learning models for retinoblastoma detection.
- We apply LIME and SHAP, two popular explainable AI techniques, to generate saliency maps and identify the most important features contributing to the model’s decision.
- To the best of our knowledge, this is the first study to apply LIME and SHAP for the task of retinoblastoma detection.
- Our proposed approach provides insights into the decision-making process of the model and enables clinicians to better understand and trust the model’s predictions.
- Our work contributes to the growing body of literature on the application of explainable AI in medical image analysis, specifically in the context of retinoblastoma detection.
2. Literature Review
- In regions where access to specialized ophthalmologists is limited, AI-powered retinoblastoma screening systems can be deployed. Through non-invasive methods like smartphone-based fundus photography, these devices can automatically analyze retinal images. The retinoblastoma signs can be promptly and precisely identified by the AI algorithms, alerting medical professionals to possible cases that need additional investigation.
- AI can assist clinicians in distinguishing between benign and malignant retinal tumors. This capacity is especially useful in situations where differentiation is difficult based just on visual assessment. By analyzing various features within the retinal images, AI models can provide additional diagnostic information, aiding in appropriate treatment planning and reducing unnecessary invasive procedures.
- AI can also help medical personnel track the development of retinoblastoma and evaluate therapy effectiveness. By comparing sequential retinal images over time, AI algorithms can detect subtle changes in tumor size, shape, or characteristics, enabling early detection of tumor growth or recurrence. This timely information empowers clinicians to adjust treatment strategies promptly and optimize patient outcomes.
3. Materials and Methods
3.1. Gathering Data and Preprocessing
3.2. Deep Learning Model
3.2.1. Transfer Learning
3.2.2. InceptionV3
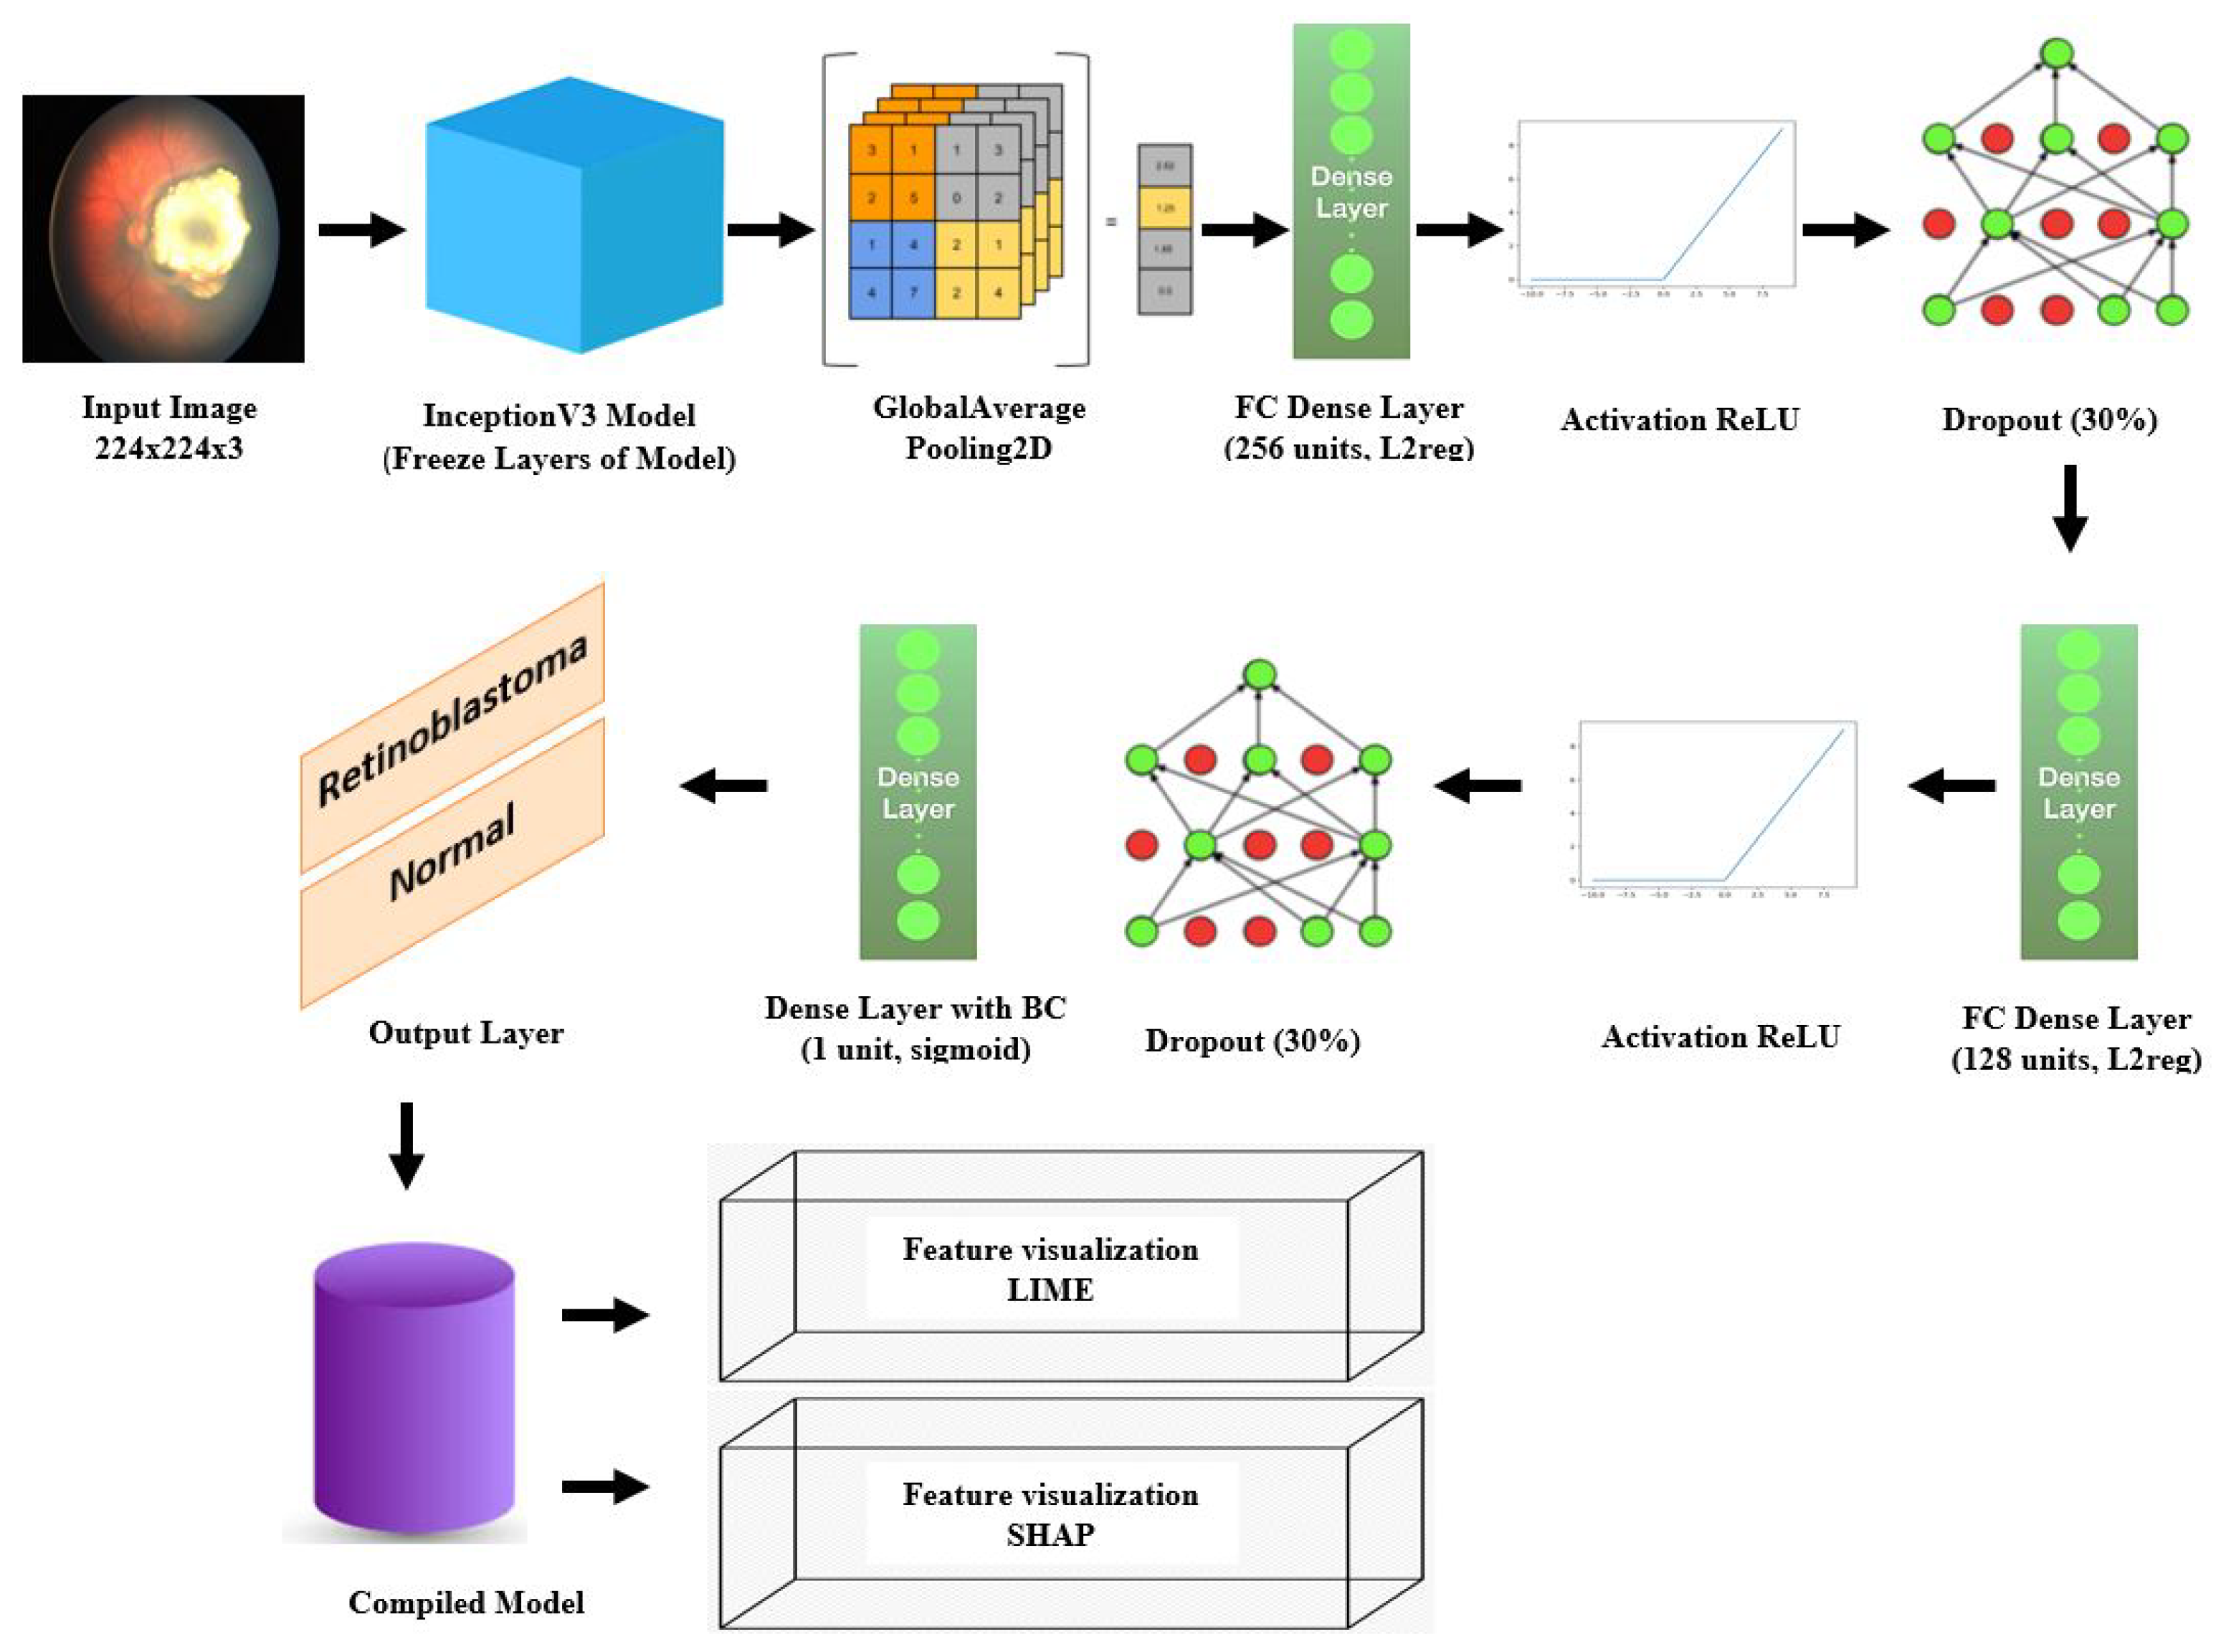
3.2.3. Model Architecture
3.3. Explainable AI Techniques
3.3.1. LIME
3.3.2. SHAP
3.4. Experimental Setup
3.5. Training Hyperparameter
4. Results
4.1. Results of Classification of Retinoblastoma and Normal Fundus
4.2. Evaluation Metrics
4.2.1. Accuracy
4.2.2. Precision
4.2.3. Recall
4.2.4. F1 Score
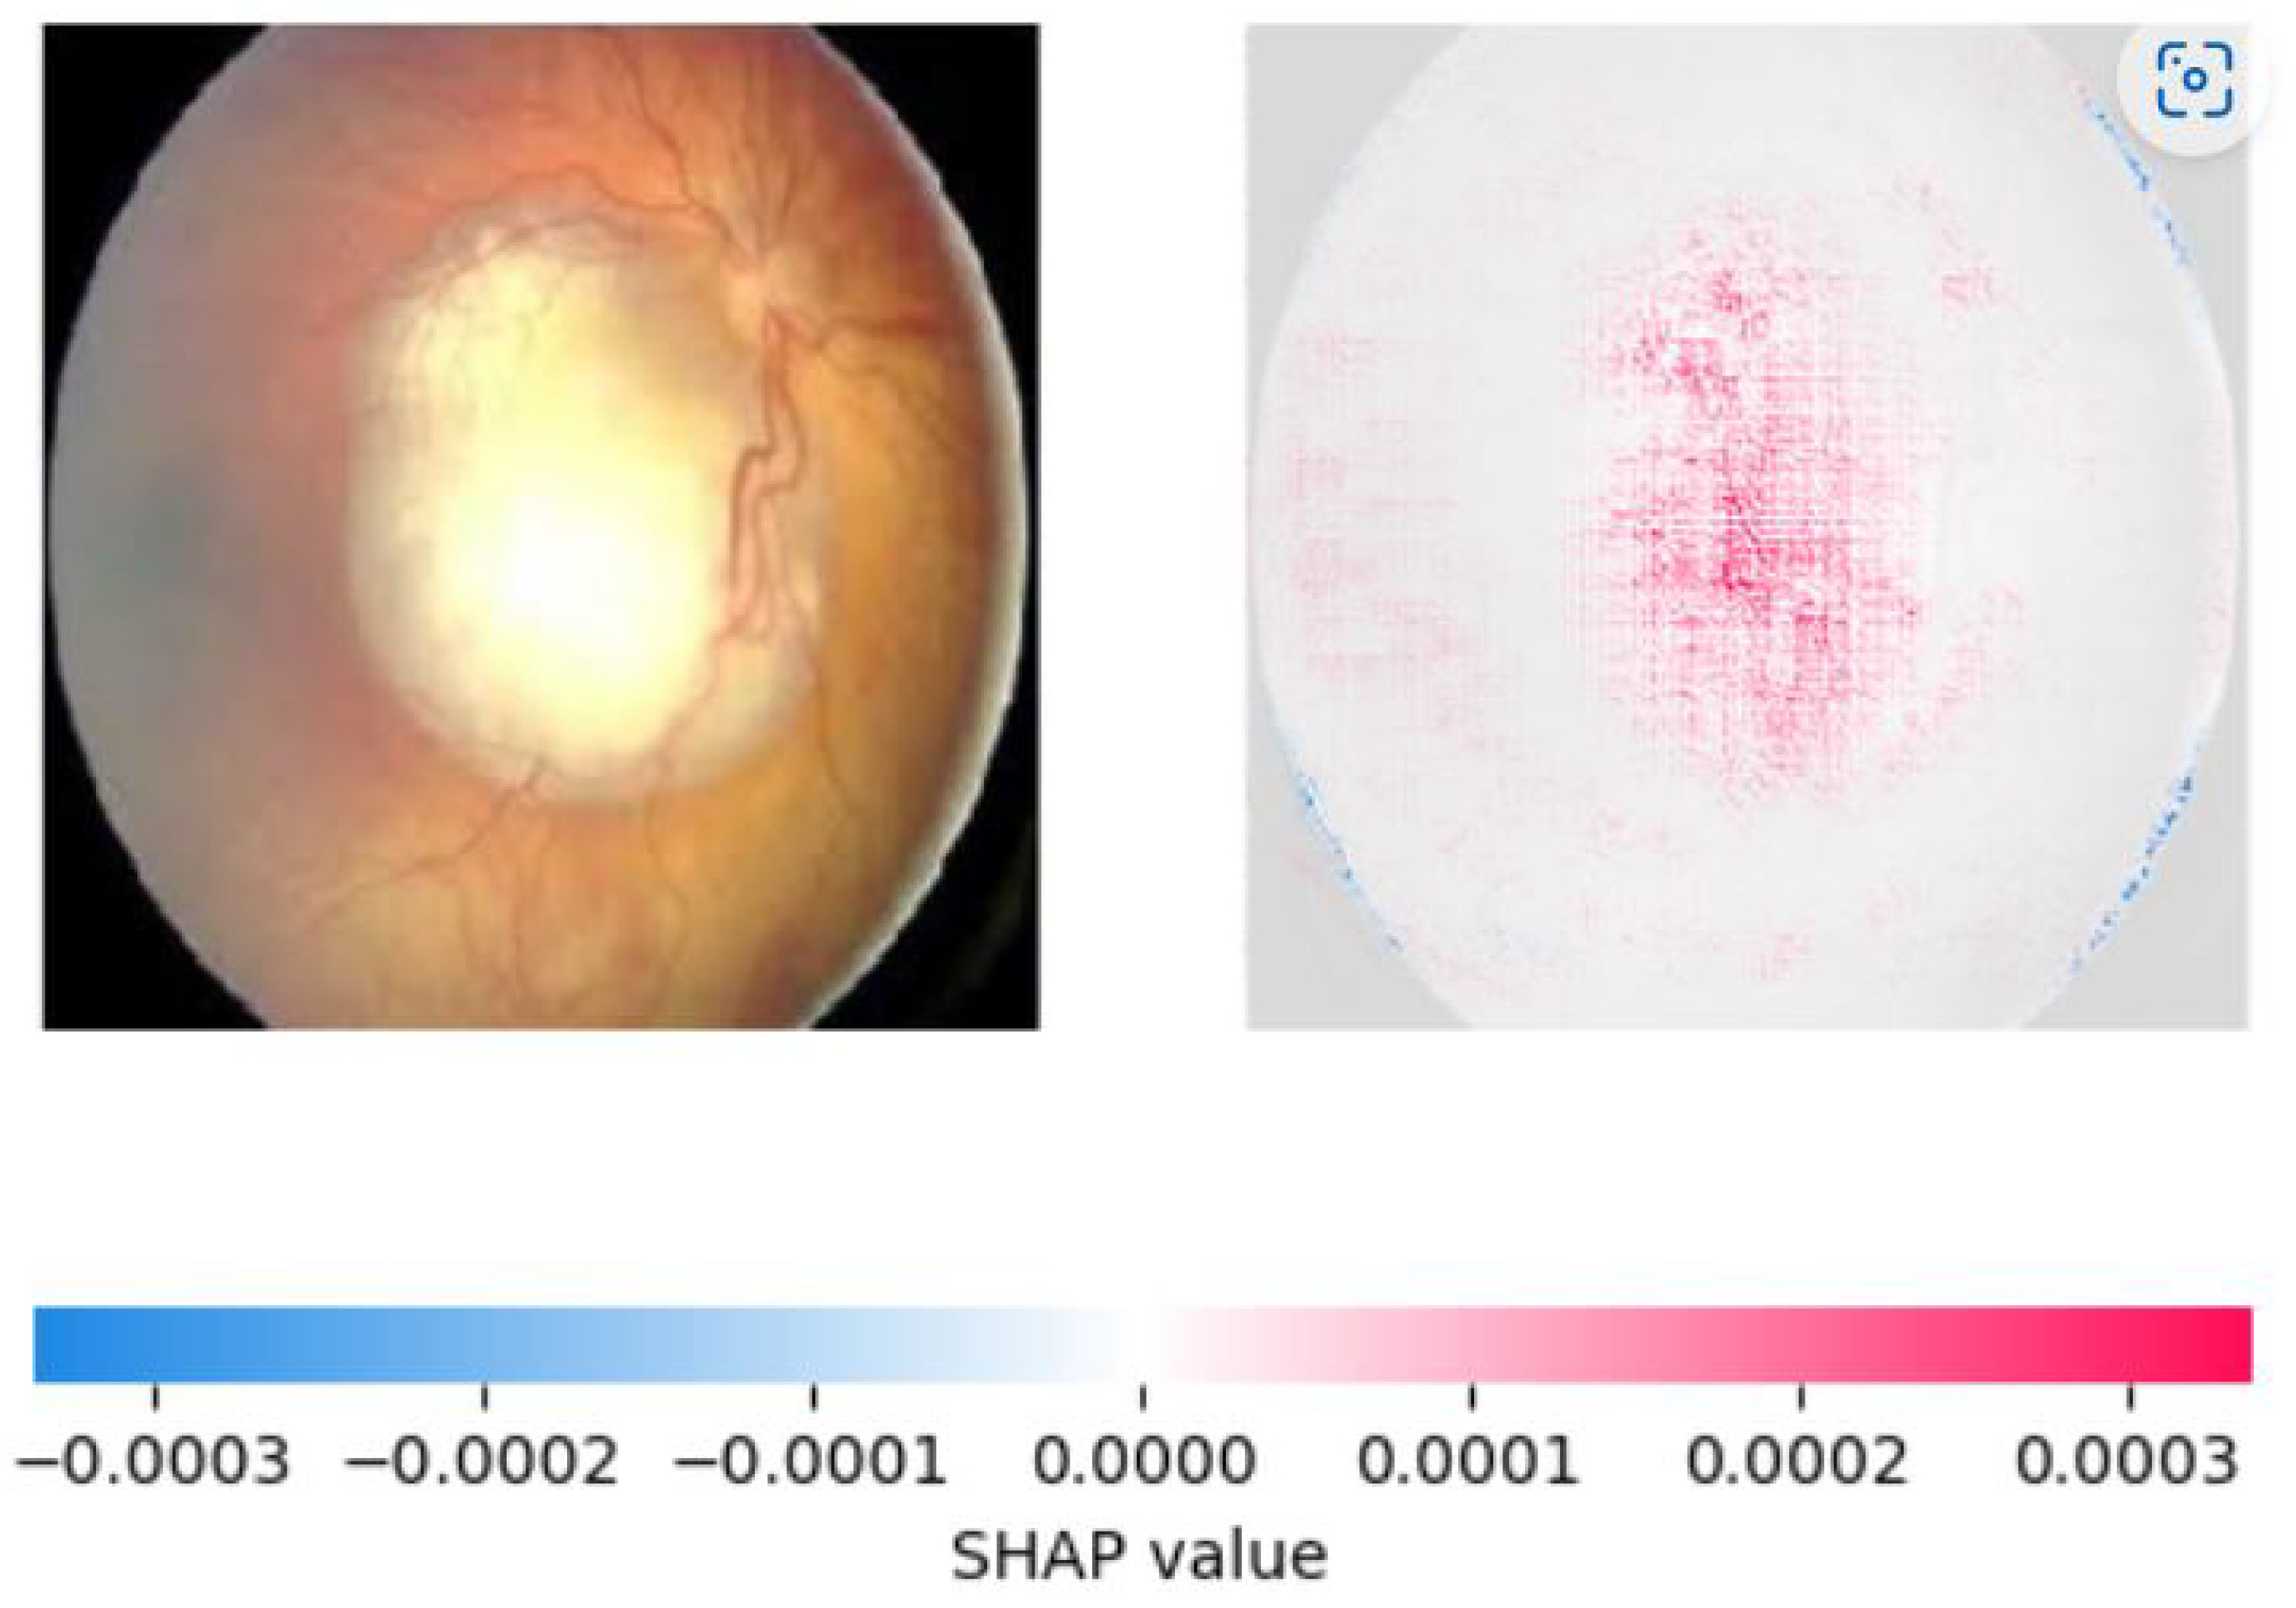
4.3. Visualization Results using LIME and SHAP
5. Discussion
6. Limitations
7. Conclusions
Author Contributions
Funding
Institutional Review Board Statement
Informed Consent Statement
Data Availability Statement
Acknowledgments
Conflicts of Interest
Abbreviations
| AI | Artificial Intelligence |
| LIME | Local Interpretable Model-Agnostic Explanations |
| SHAP | SHapley Additive exPlanations |
| InceptionV3 | Inception Version 3 |
| CNN | Convolutional Neural Network |
| DL | Deep Learning |
| RB | Retinoblastoma |
| IIRC | International Intraocular Retinoblastoma Classification |
| DLA-RB | Deep Learning Assistant for Retinoblastoma |
| FIESTA | Fast Imaging Employing Steady-State Acquisition |
| GMM | Gaussian Mixture Model |
| iRB | Intraocular Retinoblastoma |
| ML | Machine Learning |
| MRI | Magnetic Resonance Imaging |
| MV-CNN | Multi-View Convolutional Neural Network |
| TLR | Tumor-Like Region |
References
- Dimaras, H.; Kimani, K.; Dimba, E.A.; Gronsdahl, P.; White, A.; Chan, H.S.; Gallie, B.L. Retinoblastoma. Lancet 2012, 379, 1436–1446. [Google Scholar] [CrossRef] [PubMed]
- Association, A. Retinoblastoma. Available online: https://www.aoa.org/healthy-eyes/eye-and-vision-conditions/retinoblastoma?sso=y (accessed on 20 April 2023).
- Alwakid, G.; Gouda, W.; Humayun, M. Deep Learning-based prediction of Diabetic Retinopathy using CLAHE and ESRGAN for Enhancement. Healthcare 2023, 11, 863. [Google Scholar] [CrossRef] [PubMed]
- Berry, J.; Kim, J.; Damato, B.; Singh, A. Clinical Ophthalmic Oncology: Retinoblastoma; Springer: Cham, Switzerland, 2019. [Google Scholar]
- Ramírez-Ortiz, M.; Lansingh, V.; Eckert, K.; Haik, B.; Phillips, B.; Bosch-Canto, V.; González-Pérez, G.; Villavicencio-Torres, A.; Etulain-González, A. Systematic review of the current status of programs and general knowledge of diagnosis and management of retinoblastoma. BoletíN MéDico Del Hosp. Infant. MéXico (Engl. Ed.) 2017, 74, 41–54. [Google Scholar]
- Gallie, B.L.; Zhao, J.; Vandezande, K.; White, A.; Chan, H.S.L. Global issues and opportunities for optimized retinoblastoma care. Pediatr. Blood Cancer 2007, 49, 1083–1090. [Google Scholar] [CrossRef]
- Humayun, M.; Ashfaq, F.; Jhanjhi, N.Z.; Alsadun, M.K. Traffic management: Multi-scale vehicle detection in varying weather conditions using yolov4 and spatial pyramid pooling network. Electronics 2022, 11, 2748. [Google Scholar] [CrossRef]
- Humayun, M.; Alsayat, A. Prediction model for coronavirus pandemic using deep learning. Comput. Syst. Sci. Eng. 2022, 40, 947–961. [Google Scholar] [CrossRef]
- Ashfaq, F.; Ghoniem, R.M.; Jhanjhi, N.Z.; Khan, N.A.; Algarni, A.D. Using Dual Attention BiLSTM to Predict Vehicle Lane Changing Maneuvers on Highway Dataset. Systems 2023, 11, 196. [Google Scholar] [CrossRef]
- Humayun, M.; Khalil, M.I.; Alwakid, G.; Jhanjhi, N.Z. Superlative Feature Selection Based Image Classification Using Deep Learning in Medical Imaging. J. Healthc. Eng. 2022, 2022, 7028717. [Google Scholar] [CrossRef]
- Badar, M.; Haris, M.; Fatima, A. Application of deep learning for retinal image analysis: A review. Comput. Sci. Rev. 2019, 35, 100203. [Google Scholar] [CrossRef]
- Li, T.; Bo, W.; Hu, C.; Kang, H.; Liu, H.; Wang, K.; Fu, H. Applications of deep learning in fundus images: A review. Med. Image Anal. 2021, 69, 101971. [Google Scholar] [CrossRef]
- Sahlsten, J.; Jaskari, J.; Kivinen, J.; Turunen, L.; Jaanio, E.; Hietala, K.; Kaski, K. Deep learning fundus image analysis for diabetic retinopathy and macular edema grading. Sci. Rep. 2019, 9, 10750. [Google Scholar] [CrossRef] [PubMed]
- Barros, D.M.S.; Moura, J.C.C.; Freire, C.R.; Taleb, A.C.; Valentim, R.A.M.; Morais, P.S.G. Machine learning applied to retinal image processing for glaucoma detection: Review and perspective. Biomed. Eng. Online 2020, 19, 1–21. [Google Scholar] [CrossRef] [PubMed]
- Chalakkal, R.J.; Abdulla, W.H.; Thulaseedharan, S.S. Quality and content analysis of fundus images using deep learning. Comput. Biol. Med. 2019, 108, 317–331. [Google Scholar] [CrossRef] [PubMed]
- Li, Z.; Keel, S.; Liu, C.; He, Y.; Meng, W.; Scheetz, J.; Lee, P.; Shaw, J.; Ting, D.; Wong, T.; et al. An automated grading system for detection of vision-threatening referable diabetic retinopathy on the basis of color fundus photographs. Diabetes Care 2018, 41, 2509–2516. [Google Scholar] [CrossRef] [PubMed]
- Esteva, A.; Kuprel, B.; Novoa, R.A.; Ko, J.; Swetter, S.M.; Blau, H.M.; Thrun, S. Dermatologist-level classification of skin cancer with deep neural networks. Nature 2017, 542, 115–118. [Google Scholar] [CrossRef]
- Montavon, G.; Lapuschkin, S.; Binder, A.; Samek, W.; Müller, K.-R. Explaining nonlinear classification decisions with deep taylor decomposition. Pattern Recognit. 2017, 65, 211–222. [Google Scholar] [CrossRef]
- Ribeiro, M.; Singh, S.; Guestrin, C. “Why should i trust you?” Explaining the predictions of any classifier. In Proceedings of the 22nd ACM SIGKDD International Conference on Knowledge Discovery And Data Mining, San Francisco, CA, USA, 13–17 August 2016; pp. 1135–1144. [Google Scholar]
- Lundberg, S.; Lee, S. A unified approach to interpreting model predictions. Adv. Neural Inf. Process. Syst. 2017, 30, 4768–4777. [Google Scholar]
- Selvaraju, R.R.; Cogswell, M.; Das, A.; Vedantam, R.; Parikh, D.; Batra, D. Grad-cam: Visual explanations from deep networks via gradient-based localization. In Proceedings of the IEEE International Conference On Computer Vision, Venice, Italy, 22–29 October 2017; pp. 618–626. [Google Scholar]
- Adebayo, J.; Gilmer, J.; Goodfellow, I.; Kim, B. Local explanation methods for deep neural networks lack sensitivity to parameter values. arXiv 2018, arXiv:1810.03307. [Google Scholar]
- Zeiler, M.; Fergus, R. Visualizing and understanding convolutional networks. In Proceedings of the Computer Vision–ECCV 2014: 13th European Conference, Zurich, Switzerland, 6–12 September 2014; Proceedings, Part I 13. pp. 818–833. [Google Scholar]
- Chattopadhay, A.; Sarkar, A.; Howlader, P.; Balasubramanian, V. Grad-cam++: Generalized gradient-based visual explanations for deep convolutional networks. In Proceedings of the 2018 IEEE Winter Conference on Applications of Computer Vision (WACV), Lake Tahoe, NV, USA, 12–15 March 2018; pp. 839–847. [Google Scholar]
- Shrikumar, A.; Greenside, P.; Kundaje, A. Learning important features through propagating activation differences. In Proceedings of the International Conference On Machine Learning, Sydney, NSW, Australia, 6–11 August 2017; pp. 3145–3153. [Google Scholar]
- Jeba, J. Retinoblastoma Dataset. MATLAB Central File Exchange. 2023. Available online: https://www.mathworks.com/matlabcentral/fileexchange/99559-retinoblastoma-dataset (accessed on 10 April 2023).
- Lamard, M.; Biraben, A.; Dulaurent, T.; Chiquet, C. The MESSIDOR database of diabetic retinopathy images and structures. In Proceedings of the 19th IEEE International Symposium On Computer-Based Medical Systems (CBMS), Salt Lake City, UT, USA, 22–23 June 2006; pp. 497–500. Available online: https://ieeexplore.ieee.org/document/4577801 (accessed on 2 May 2023).
- Szegedy, C.; Vanhoucke, V.; Ioffe, S.; Shlens, J.; Wojna, Z. Rethinking the inception architecture for computer vision. In Proceedings of the IEEE Conference on Computer Vision and Pattern Recognition, Las Vegas, NV, USA, 27–30 June 2016; pp. 2818–2826. [Google Scholar]
- Langlotz, C.; Allen, B.; Erickson, B.; Kalpathy-Cramer, J.; Bigelow, K.; Cook, T.; Flanders, A.; Lungren, M.; Mendelson, D.; Rudie, J.; et al. A roadmap for foundational research on artificial intelligence in medical imaging: From the 2018 NIH/RSNA/ACR/The Academy Workshop. Radiology 2019, 291, 781–791. [Google Scholar] [CrossRef]
- Abramson, D.; Beaverson, K.; Sangani, P.; Vora, R.; Lee, T.; Hochberg, H.; Kirszrot, J.; Ranjithan, M. Screening for retinoblastoma: Presenting signs as prognosticators of patient and ocular survival. Pediatrics 2003, 112, 1248–1255. [Google Scholar] [CrossRef]
- Gombos, D. Retinoblastoma in the perinatal and neonatal child. Semin. Fetal Neonatal Med. 2012, 17, 239–242. [Google Scholar] [CrossRef] [PubMed]
- Khetan, V.; Sengupta, S.; Manjandavida, F.; Honavar, S. Retinoblastoma in the developing world. Future Med. 2013. [Google Scholar] [CrossRef]
- Honavar, S. The red reflex test-shadow conceals, light reveals. Indian J. Ophthalmol. 2021, 69, 1979. [Google Scholar] [CrossRef]
- Hull, S.; Tailor, V.; Balduzzi, S.; Rahi, J.; Schmucker, C.; Virgili, G.; Dahlmann-Noor, A.; Eyes, C.; Group, V. Tests for detecting strabismus in children aged 1 to 6 years in the community. Cochrane Database Syst. Rev. 2017, 2017, CD011221. [Google Scholar] [CrossRef] [PubMed]
- Pogosova, N. May Measurement Month: Beyond boosting hypertension awareness. Lancet Glob. Health 2022, 10, e1076–e1077. [Google Scholar] [CrossRef] [PubMed]
- Gündüz, A.K.; Tetik, D. Follow-up of retinoblastoma using RetCam fluorescein angiography and correlation with clinical findings. Eur. J. Ophthalmol. 2023, 11206721231163619. [Google Scholar] [CrossRef] [PubMed]
- Moothedath, A.W.; Seth, R.; Chawla, B.V. Orbital and Metastatic Retinoblastoma: Conquests and Challenges. In Global Perspectives in Ocular Oncology; Springer International Publishing: Cham, Switzerland, 2023; pp. 133–141. [Google Scholar]
- Manjandavida, F.; Xia, J.; Zhang, J.; Tang, X.; Yi, H. In-utero ultrasonography detection of fetal retinoblastoma and neonatal selective ophthalmic artery chemotherapy. Indian J. Ophthalmol. 2019, 67, 958. [Google Scholar] [CrossRef]
- Cho, S.; Kim, J.; Baik, S.; Sunwoo, L.; Bae, Y.; Choi, B. Diagnostic performance of MRI of post-laminar optic nerve invasion detection in retinoblastoma: A systematic review and meta-analysis. Neuroradiology 2021, 63, 499–509. [Google Scholar] [CrossRef]
- Lin, F.Y.; Chintagumpala, M.M. Neonatal retinoblastoma. Clin. Perinatol. 2021, 48, 53–70. [Google Scholar] [CrossRef]
- Ghose, N.; Kaliki, S. Liquid biopsy in Retinoblastoma: A review. Semin. Ophthalmol. 2022, 37, 813–819. [Google Scholar] [CrossRef]
- Jones, M. Neonatal retinoblastoma: Understanding the problem better. Malays. J. Ophthalmol. 2020, 2, 80–82. [Google Scholar] [CrossRef]
- Mandal, M.; Banerjee, I.; Mandal, M. Nanoparticle-mediated gene therapy as a novel strategy for the treatment of retinoblastoma. Colloids Surfaces Biointerfaces 2022, 220, 112899. [Google Scholar] [CrossRef] [PubMed]
- Atwany, M.Z.; Sahyoun, A.H.; Yaqub, M. Deep learning techniques for diabetic retinopathy classification: A survey. IEEE Access 2022, 10, 28642–28655. [Google Scholar] [CrossRef]
- Das, D.; Biswas, S.K.; Bandyopadhyay, S. A critical review on diagnosis of diabetic retinopathy using machine learning and deep learning. Multimedia Tools Appl. 2022, 81, 25613–25655. [Google Scholar] [CrossRef] [PubMed]
- Nawaz, M.; Nazir, T.; Javed, A.; Tariq, U.; Yong, H.-S.; Khan, M.A.; Cha, J. An efficient deep learning approach to automatic glaucoma detection using optic disc and optic cup localization. Sensors 2022, 22, 434. [Google Scholar] [CrossRef]
- Akter, N.; Fletcher, J.; Perry, S.; Simunovic, M.P.; Briggs, N.; Roy, M. Glaucoma diagnosis using multi-feature analysis and a deep learning technique. Sci. Rep. 2022, 12, 8064. [Google Scholar] [CrossRef]
- Jin, K.; Yan, Y.; Chen, M.; Wang, J.; Pan, X.; Liu, X.; Liu, M.; Lou, L.; Wang, Y.; Ye, J. Multimodal deep learning with feature level fusion for identification of choroidal neovascularization activity in age-related macular degeneration. Acta Ophthalmol. 2022, 100, e512–e520. [Google Scholar] [CrossRef]
- Kadry, S.; Rajinikanth, V.; Crespo, R.; Verdú, E. Automated detection of age-related macular degeneration using a pre-trained deep-learning scheme. J. Supercomput. 2022, 78, 7321–7340. [Google Scholar] [CrossRef]
- Bauskar, R.L.P.; Brahmapurkar, P.; Morogiri, O.; Sagane, G. Detection of Retinoblastoma and its Response to Treatment. 2020. Available online: https://ssrn.com/abstract=3590463 (accessed on 2 May 2023).
- Goswami, M. Deep learning models for benign and malign ocular tumor growth estimation. Comput. Med. Imaging Graph. 2021, 93, 101986. [Google Scholar] [CrossRef]
- Kaliki, S.; Vempuluru, V.; Ghose, N.; Patil, G.; Viriyala, R.; Dhara, K. Artificial intelligence and machine learning in ocular oncology: Retinoblastoma. Indian J. Ophthalmol. 2023, 71, 424–430. [Google Scholar] [CrossRef]
- Durai, C.; Jebaseeli, T.; Alelyani, S.; Mubharakali, A. Early Prediction and Diagnosis of Retinoblastoma Using Deep Learning Techniques. arXiv 2021, arXiv:2103.07622. [Google Scholar]
- Kumar, P.; Suganthi, D.; Valarmathi, K.; Swain, M.; Vashistha, P.; Buddhi, D.; Sey, E. A Multi-Thresholding-Based Discriminative Neural Classifier for Detection of Retinoblastoma Using CNN Models. BioMed Res. Int. 2023, 2023, 5803661. [Google Scholar] [CrossRef] [PubMed]
- Jebaseeli, T.; David, D. Diagnosis of ophthalmic retinoblastoma tumors using 2.75 D CNN segmentation technique. In Computational Methods and Deep Learning for Ophthalmology; Academic Press: Cambridge, MA, USA, 2023; pp. 107–119. [Google Scholar]
- Rahdar, A.; Ahmadi, M.; Naseripour, M.; Akhtari, A.; Sedaghat, A.; Hosseinabadi, V.; Yarmohamadi, P.; Hajihasani, S.; Mirshahi, R. Semi-Supervised Segmentation of Retinoblastoma Tumors in Fundus Images. Res. Sq. Prepr. 2023. [Google Scholar] [CrossRef]
- Strijbis, V.; Bloeme, C.; Jansen, R.; Kebiri, H.; Nguyen, H.; Jong, M.; Moll, A.; Bach-Cuadra, M.; Graaf, P.; Steenwijk, M. Multi-view convolutional neural networks for automated ocular structure and tumor segmentation in retinoblastoma. Sci. Rep. 2021, 11, 14590. [Google Scholar] [CrossRef]
- Henning, R.; Rivas-Perea, P.; Shaw, B.; Hamerly, G. A convolutional neural network approach for classifying leukocoria. In Proceedings of the 2014 Southwest Symposium On Image Analysis and Interpretation, San Diego, CA, USA, 6–8 April 2014; pp. 9–12. [Google Scholar]
- Subrahmanyeswara Rao, B. Accurate leukocoria predictor based on deep VGG-net CNN technique. IET Image Process. 2020, 14, 2241–2248. [Google Scholar] [CrossRef]
- Zhang, R.; Dong, L.; Li, R.; Zhang, K.; Li, Y.; Zhao, H.; Shi, J.; Ge, X.; Xu, X.; Jiang, L.; et al. Automatic Retinoblastoma Screening and Surveillance Using Deep Learning. medRxiv 2022. [Google Scholar] [CrossRef]


| Hyperparameter | Value |
|---|---|
| Learning rate | 0.001 |
| Number of epochs | 100 |
| Batch size | 32 |
| Dense layer 1 size | 256 |
| Dense layer 1 reg | L2 (0.001) |
| Dropout 1 | 0.3 |
| Dense layer 2 size | 128 |
| Dense layer 2 reg | L2 (0.001) |
| Dropout 1 | 0.3 |
| Optimizer | Adam |
| Loss function | Binary crossentropy |
| Study | Model | Dataset | Performance | XAI Used |
|---|---|---|---|---|
| Kaliki et al. [52] | AI model | 109 eyes, 771 fundus pictures | Sensitivity: 85%, Specificity: 99%, PPV: 99.6%, NPV: 67% | No |
| Kumar [54] | CNN-based ResNet50 | Not specified | Accuracy: 93.16% | No |
| Jebaseeli et al. [55] | Linear predictive decision-based median filter, 2.75D CNN | Not specified | Accuracy: 98.84%, Sensitivity: 97.96%, Specificity: 98.32% | No |
| Rahdar et al. [56] | Semi-supervised segmentation method | 80 fundus images | Not specified | No |
| Strijbis et al. [57] | Multi-view convolutional neural networks | 40 retinoblastoma and 20 healthy eyes | Not specified | No |
| Henning et al. [58] | CNNs | Flickr training images | Low error rates (<3%) | No |
| Subrahmanyeswara et al. [59] | Deep Visual Geometry Group-net CNN classifier | Not specified | Not specified | No |
| Zhang et al. [60] | CNN(ResNet) | Not specified | Not specified | Feature Heatmaps Grad-CAM |
| Our Model | Transfer learning Inceptionv3 | 800 fundus images | Testing accuracy: 97%, Precision: 98.8%, Recall: 99.6%, F1 score: 99.2% | Feature Heatmaps Grad-CAM |
Disclaimer/Publisher’s Note: The statements, opinions and data contained in all publications are solely those of the individual author(s) and contributor(s) and not of MDPI and/or the editor(s). MDPI and/or the editor(s) disclaim responsibility for any injury to people or property resulting from any ideas, methods, instructions or products referred to in the content. |
© 2023 by the authors. Licensee MDPI, Basel, Switzerland. This article is an open access article distributed under the terms and conditions of the Creative Commons Attribution (CC BY) license (https://creativecommons.org/licenses/by/4.0/).
Share and Cite
Aldughayfiq, B.; Ashfaq, F.; Jhanjhi, N.Z.; Humayun, M. Explainable AI for Retinoblastoma Diagnosis: Interpreting Deep Learning Models with LIME and SHAP. Diagnostics 2023, 13, 1932. https://doi.org/10.3390/diagnostics13111932
Aldughayfiq B, Ashfaq F, Jhanjhi NZ, Humayun M. Explainable AI for Retinoblastoma Diagnosis: Interpreting Deep Learning Models with LIME and SHAP. Diagnostics. 2023; 13(11):1932. https://doi.org/10.3390/diagnostics13111932
Chicago/Turabian StyleAldughayfiq, Bader, Farzeen Ashfaq, N. Z. Jhanjhi, and Mamoona Humayun. 2023. "Explainable AI for Retinoblastoma Diagnosis: Interpreting Deep Learning Models with LIME and SHAP" Diagnostics 13, no. 11: 1932. https://doi.org/10.3390/diagnostics13111932