
Prospective Evaluation of Fetal Hemoglobin Expression in Maternal Erythrocytes: An Analysis of a Cohort of 345 Parturients
 ,
,  , ,
, ,
Abstract
:1. Introduction
2. Materials and Methods
2.1. Parturients Selection
2.2. Study Procedures
2.3. Laboratory Evaluations and Measurement of Hemoglobin Components
2.4. Statistics
3. Results
3.1. Descriptive Statistics
3.2. F-Cells Percentage
3.3. Pearson Correlations and t-Tests
4. Discussion
5. Conclusions
Author Contributions
Funding
Institutional Review Board Statement
Informed Consent Statement
Data Availability Statement
Conflicts of Interest
References
- Manca, L.; Masala, B. Disorders of the synthesis of human fetal hemoglobin. IUBMB Life 2008, 60, 94–111. [Google Scholar] [CrossRef] [PubMed]
- Orneal, P.S.; Gantt, N.M.; Schwartz, J.D.; Bhanu, N.V.; Lee, Y.T.; Moroney, J.W.; Reed, C.H.; Schechter, A.N.; Luban, N.L.C.; Miller, J.L. Fetal haemoglobin silencing in humans. Blood 2006, 108, 2081–2086. [Google Scholar] [CrossRef]
- Clarke, G.M.; Higgins, T.N. Laboratory investigation of hemoglobinopathies and thalassemias: Review and update. Clin. Chem. 2000, 46, 1284–1290. [Google Scholar] [CrossRef] [PubMed]
- Schuman, J.E.; Tanser, C.L.; Péloquin, R.; de Leeuw, N.K.M. The erythropoietic response to pregnancy in β-thalassemia minor. Br. J. Haematol. 1973, 25, 249–260. [Google Scholar] [CrossRef]
- Dunn, D.T.; Poddar, D.; Serjeant, B.E.; Serjeant, G.R. Fetal haemoglobin and pregnancy in homozygous sickle cell disease. Br. J. Haematol. 1989, 72, 434–438. [Google Scholar] [CrossRef] [PubMed]
- Popat, N.; Wood, W.G.; Weatherall, D.J.; Turnbull, A.C. Pattern of maternal F-cell production during pregnancy. Lancet 1977, 2, 377–379. [Google Scholar] [CrossRef]
- De Ceulaer, K.; Hayes, R.; Gruber, C.; Serjeant, G.R. Medroxyprogesterone acetate and homozygous sickle-cell disease. Lancet 1982, 320, 229–231. [Google Scholar] [CrossRef]
- Weatherall, D.J.; Clegg, J.B. The Thalassemia Syndromes, 3rd ed.; Blackwell Scientific: Oxford, UK, 1981; pp. 76–77. [Google Scholar]
- Rucknagel, D.L.; Chernoff, A.I. Immunologic studies of hemoglobins. III. Fetal haemoglobin changes in the circulation of pregnant women. Blood 1955, 10, 1092. [Google Scholar] [CrossRef]
- Pembrey, M.E.; Weatherall, D.J.; Clegg, J.B. Maternal synthesis of haemoglobin F in pregnancy. Lancet 1973, 1, 1350–1354. [Google Scholar] [CrossRef]
- Lee, J.C.; Hayashi, R.H.; Shepard, M.K. Fetal hemoglobin in women with normal and with hydatidiform molar pregnancy. Am. J. Hematol. 1982, 13, 131–139. [Google Scholar] [CrossRef]
- Koskinen, L.K.; Lahtela, J.T.; Koivula, T.A. Fetal hemoglobin in diabetic patients. Diabetes Care 1994, 17, 828–831. [Google Scholar] [CrossRef]
- Kristoffersen, K. Foetal Haemoglobin in Maternal Blood During Pregnancy and Delivery. Acta Obstet. Gynecol. Scand. 1964, 42, 74–77. [Google Scholar] [CrossRef]
- Boyer, S.H.; Belding, T.K.; Margolet, L.; Noyes, A.N.; Burke, P.J.; Bell, W.R. Variations in the frequency of fetal haemoglobin-bearing erythrocytes (F-cell) in well adults, pregnant women, and adult leukemics. John Hopkins Med. J. 1975, 137, 105–115. [Google Scholar]
- Dover, G.J.; Boyer, S.H.; Zinkham, W.H. Production of erythrocytes that contain fetal haemoglobin in anemia. J. Clin. Investig. 1979, 63, 173–176. [Google Scholar] [CrossRef]
- Blau, C.; Constantoulakis, P.; Al-Khatti, A.; Spadacino, E.; Goldwasser, E.; Papayannopoulos, T.; Stamatoyannopoulos, G. Fetal hemoglobin in acute and chronic states of erythroid expansion. Blood 1993, 812, 227–233. [Google Scholar] [CrossRef]
- Ishikawa, Y.; Ito, T. Kinetics of hemopoietic stem cells in a hypoxic culture. Eur. J. Haematol. 1988, 40, 126–129. [Google Scholar] [CrossRef]
- Lu, L.; Broxmeyer, H.E. Comparative influences of phytohemagglutinin-stimulated leukocyte conditioned medium, hemin, prostaglandin E, and low oxygen tension on colony formation of erythroid precursor cells in normal human bone marrow. Exp. Hematol. 1985, 13, 989–993. [Google Scholar] [PubMed]
- Dover, G.J.; Chan, T.; Sieber, F. Fetal haemoglobin production in cultures of primitive and mature human erythroid progenitors: Differentiation affects the quantity of fetal haemoglobin produced per fetal-hemoglobin-containing cell. Blood 1983, 61, 1242–1246. [Google Scholar] [CrossRef] [PubMed]
- Halvorsen, S.; Bechensteen, A.G. Physiology of erythropoietin during mammalian development. Acta Paediatr. Suppl. 2002, 91, 17–26. [Google Scholar] [CrossRef]
- Kurtz, A.; Jelkmann, W.; Bauer, C. A new candidate for the regulation of erythropoiesis. Insulin-like growth factor I. FEBS Lett. 1982, 149, 105–108. [Google Scholar] [CrossRef]
- Correa, P.N.; Axelrad, A.A. Productio n of erythropoieti c bursts by progenitor cells from adult human peripheral blood in an improved serum-free medium: Role of insulinlike growth factor 1. Blood 1991, 78, 2823–2833. [Google Scholar] [CrossRef]
- Miyagawa, S.; Kobayashi, M.; Konishi, N.; Sato, T.; Ueda, K. Insulin and insulin-like growth factor I support the proliferation of erythroid progenitor cells in bone marrow through the sharing of receptors. Br. J. Haematol. 2000, 109, 555–562. [Google Scholar] [CrossRef] [PubMed]
- Pardini, V.C.; Victória, I.M.; Pieroni, F.B.; Milagres, G.; Nascimento, P.D.; Velho, G.; Purisch, S.; Pardini, H. Fetal hemoglobin levels are related to metabolic control in diabetic subjects. Braz. J. Med. Biol. Res. 1999, 32, 695–701. [Google Scholar] [CrossRef]
- Wise, J.E.; Sauder, S.E.; Weiss, A.E. Increased fetal hemoglobin production in a child with congenital hyperinsulinism. J. Pediatry 1987, 110, 912–914. [Google Scholar] [CrossRef] [PubMed]
- Perrine, S.P.; Greene, M.F.; Faller, D.V. Delay in the fetal globin switch in infants of diabetic mothers. N. Engl. J. Med. 1985, 312, 334–338. [Google Scholar] [CrossRef] [PubMed]
- Grey, V.; Wilkinson, M.; Phelan, L.; Hughes, C.; Bain, B.J. Inaccuracy of high-performance liquid chromatography estimation of haemoglobin F in the presence of increased haemoglobin A1C. Int. J. Lab. 2007, 29, 42–44. [Google Scholar] [CrossRef] [PubMed]


| Demographic Value | Detail | Number (%) SD |
|---|---|---|
| Age | Mean | 32.29 (NA) 4.11 |
| Minimum | 20 (NA) | |
| Maximum | 44 (NA) | |
| More than 35 years old | 255/345 (73.91) | |
| Less than 35 years old | 90/345 (26.09) | |
| History of smoking | Number of parturients | 124/345 (35.94) |
| Mean of years of smoking in parturients with smoking history | 3.28 (NA) 5.62 | |
| Mean of number of pregnancies | 2.00 (NA) 1.20 | |
| Mean of parity | 0.57 (NA) 0.72 | |
| Multiple pregnancy | 2/345 (0.58) | |
| History of anterior fertility clinic consultation | 41/345 (11.88) | |
| History of hypertension | 10/345 (2.90) | |
| Parturients with hypertension at first visit | 3/345 (0.87) | |
| Parturients with active preeclampsia at first visit | 0/345 (0) | |
| Parturients with gestational diabetes at first visit | 1/345 (0.29) | |
| History of type 2 diabetes | 0/345 (0) | |
| Use of progesterone before visit 1 | 23/345 (6.67) | |
| Value | n |
|---|---|
| Number of women screened | 879 |
| Number of women included in the study | 345 |
| Number of HbF-negative women at first visit selected for comparator group | 169 |
| Number of HbF-negative women who completed follow-up at time of analysis | 147 |
| Number of HbF-positive women at first visit | 176 |
| Number of HbF-positive women at anytime during evaluation | 198 |
| Number of HbF-positive women who completed follow-up at time of analysis | 155 |
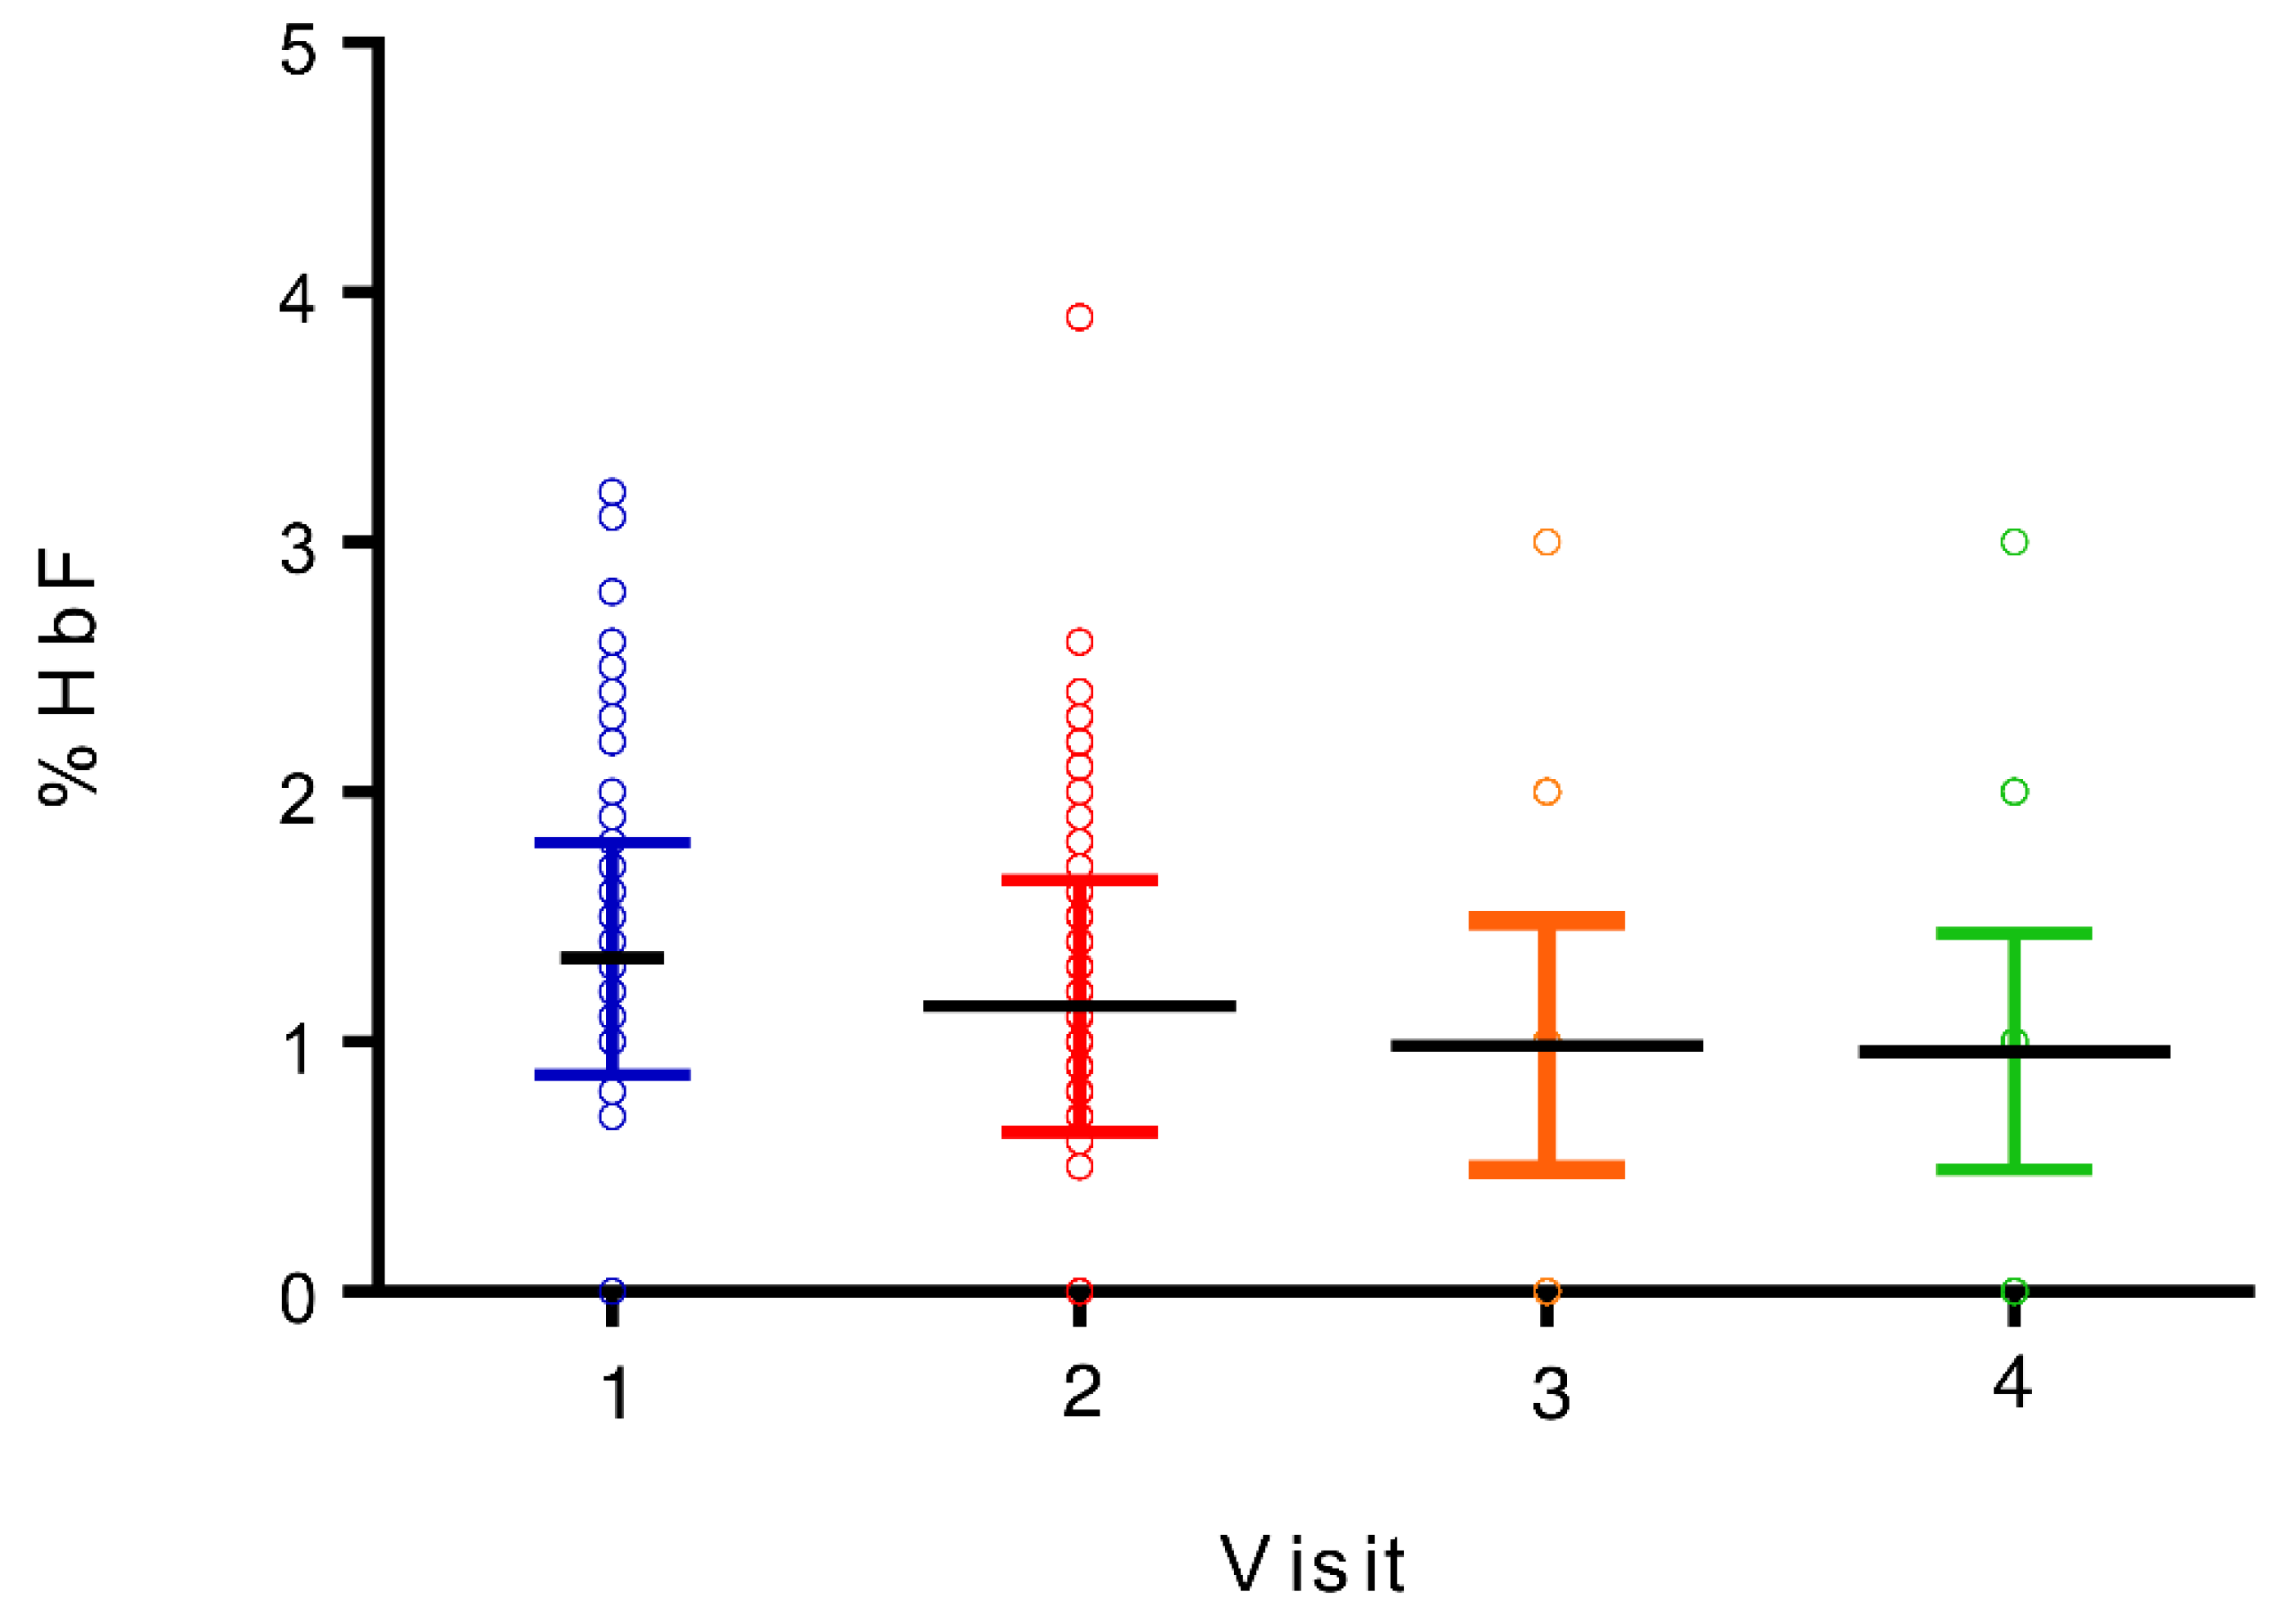
| Visit | Median Hb F Percentage (%) | Range (%) |
|---|---|---|
| 1 (weeks 8–12) | 1.2 | 0–3.2 |
| 2 (weeks 24–28) | 1.0 | 0–3.9 |
| 3 (week 36) | 0.8 | 0–3.2 |
| 4 (6 weeks postpartum) | 0.7 | 0–2.9 |
| Value | Visit 1 Mean (SD) | Visit 2 Mean (SD) | Visit 3 Mean (SD) | Visit 4 Mean (SD) |
|---|---|---|---|---|
| Hemoglobin (g/L) | 126.2 (8.3) | 117.4 (8.0) | 120.2 (10.1) | 132.2 (8.0) |
| Hematocrit (L/L) | 0.367 (0.022) | 0.349 (0.022) | 0.356 (0.026) | 0.397 (0.022) |
| RBC (×1012/L) | 4.15 (0.30) | 3.82 (0.28) | 3.95 (0.30) | 4.43 (0.30) |
| MCV (fL) | 88.8 (3.4) | 91.7 (3.7) | 90.5 (4.4) | 89.9 (3.9) |
| RDW (%) | 12.9 (0.7) | 13.3 (0.6) | 13.5 (0.8) | 13.2 (1.6) |
| MCHC (g/L) | 343.6 (7.9) | 336.4 (7.7) | 337.4 (9.2) | 332.7 (9.2) |
| MCH (pg) | 30.5 (1.3) | 30.8 (1.5) | 30.5 (1.9) | 29.9 (1.6) |
| Reticulocytes (×109/L) | 70.8 (20.7) | 82.9 (20.7) | 88.5 (19.0) | 55.5 (17.3) |
| Ferritin (ng/mL) | 72.2 (48.9) | 29.9 (81.2) | 20.7 (14.8) | 66.8 (47.5) |
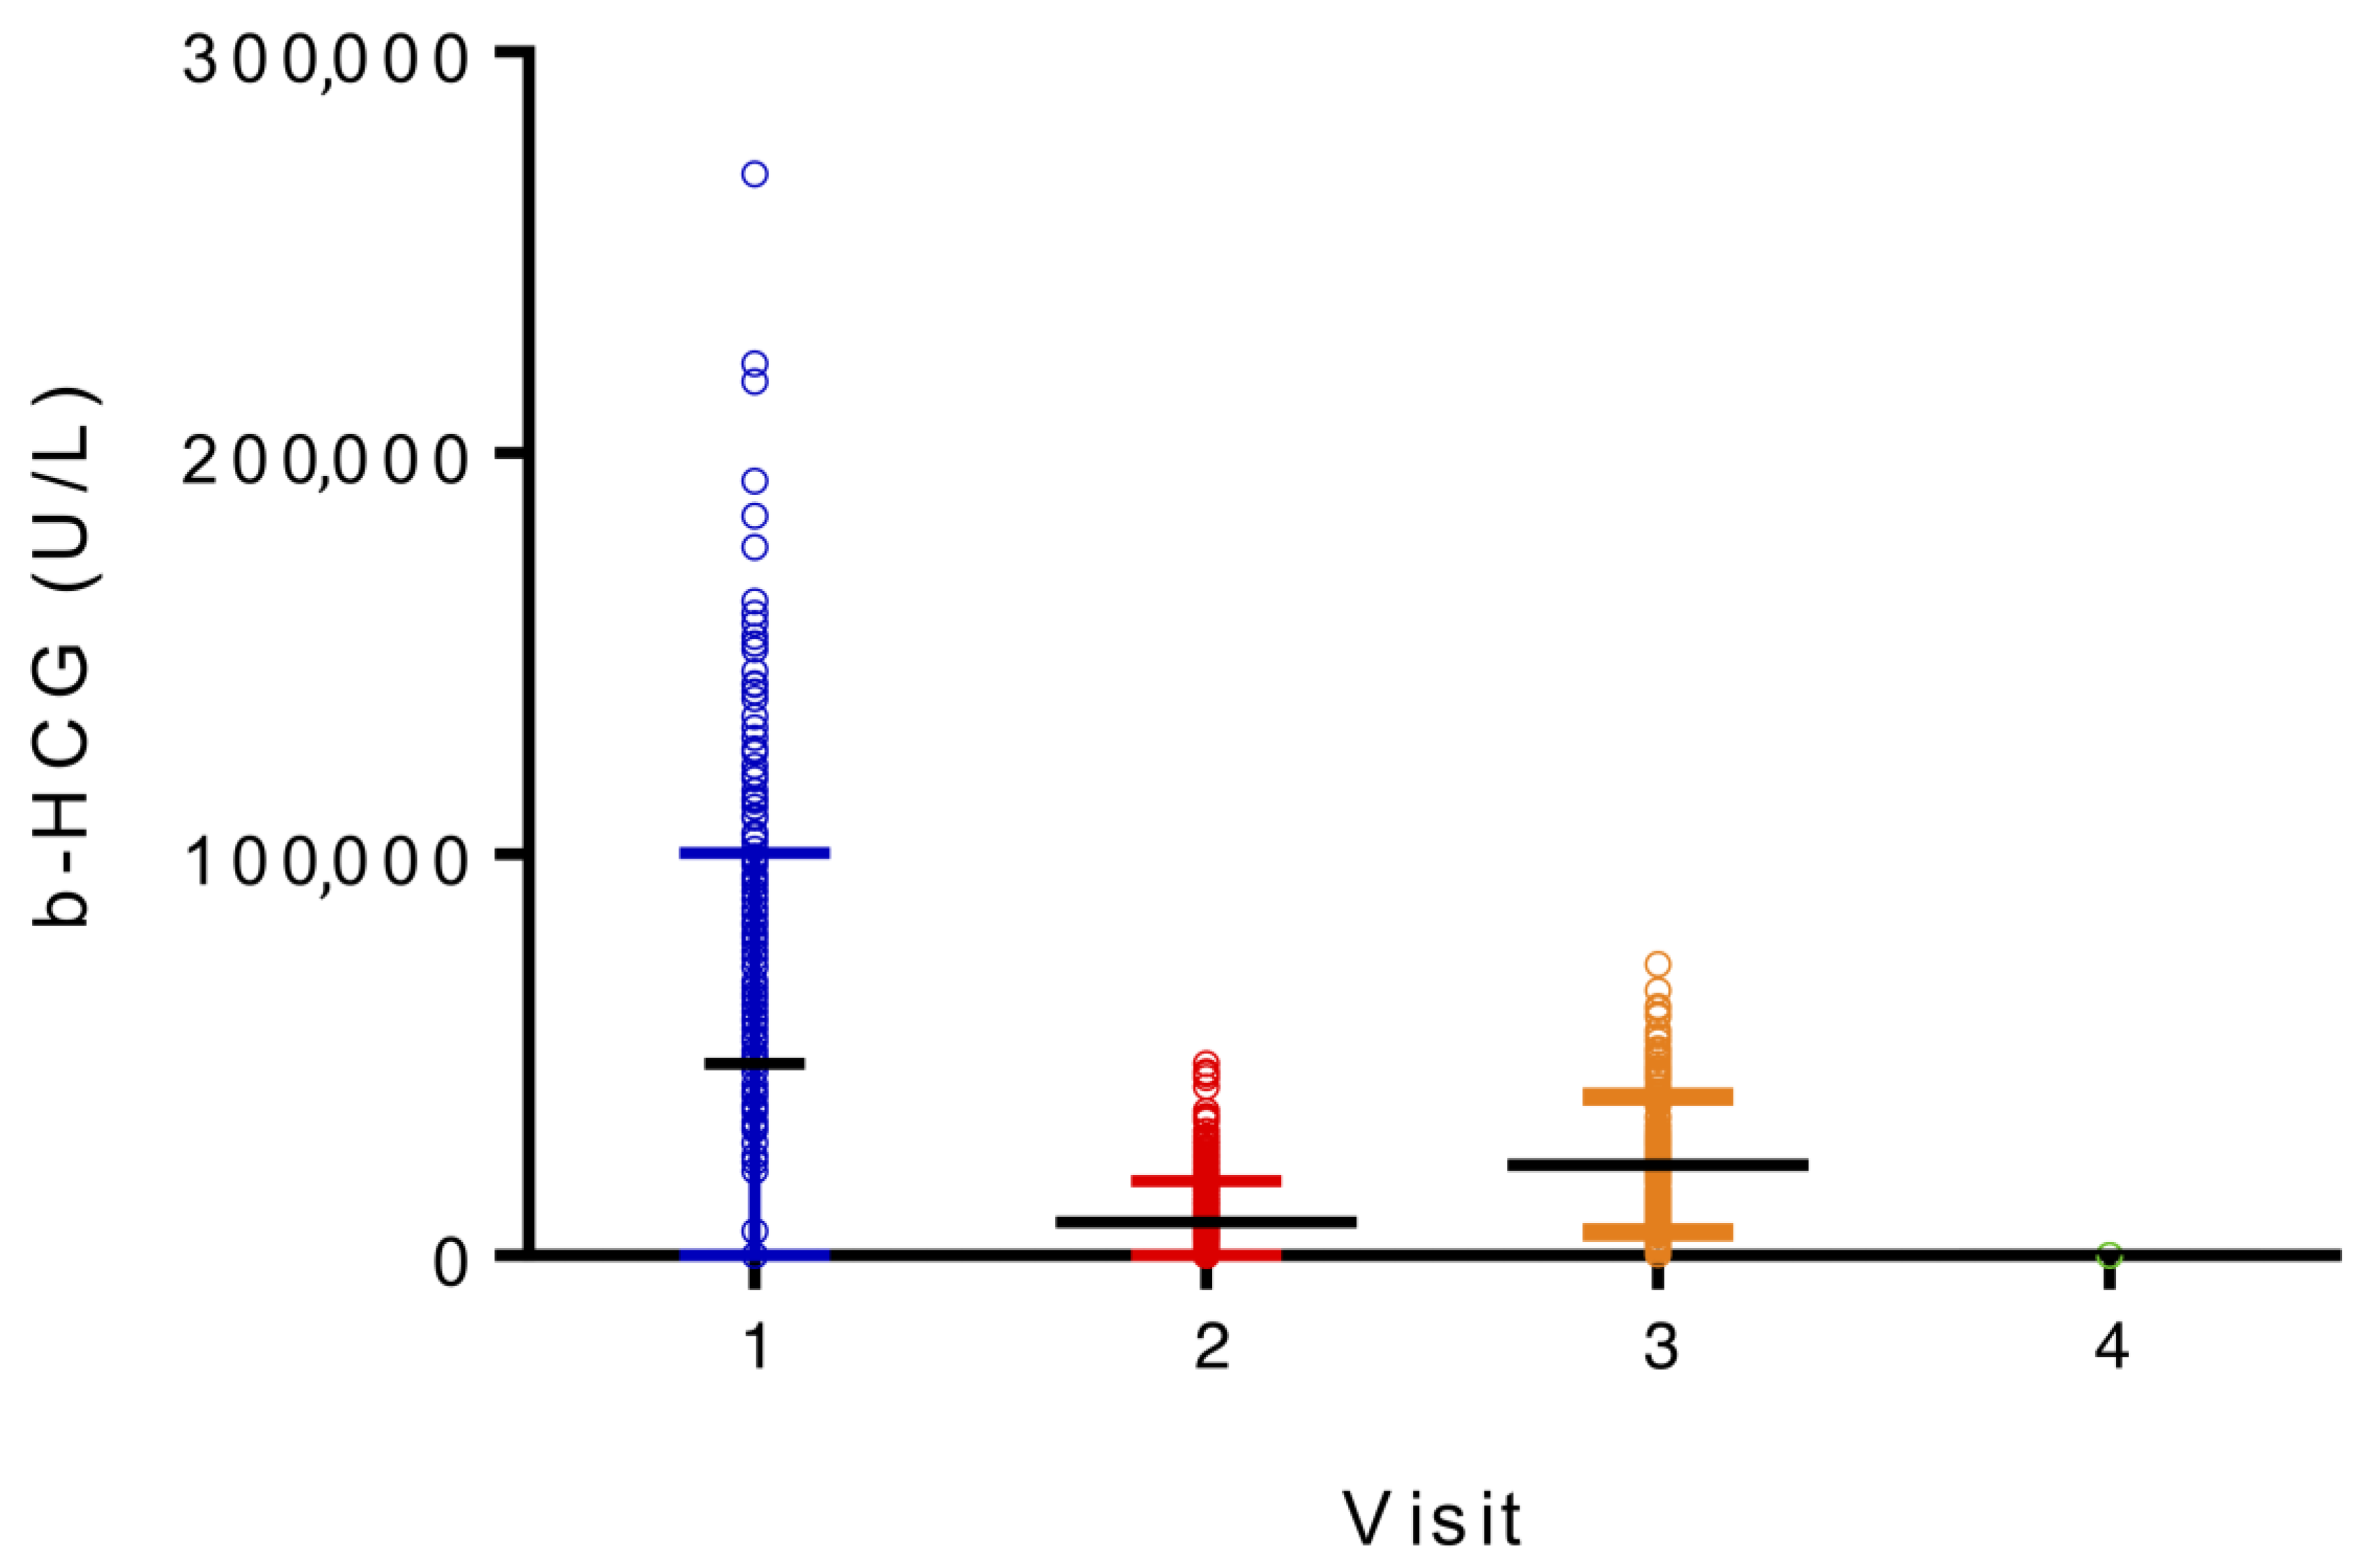
| β -HCG (mUI/mL) | 86,344 (41,388) | 15,151 (10,549) | 22,916 (17,840) | 225 (2831) |
| EPO (UI/L) | 9.1 (3.5) | 18.9 (11.4) | 26.6 (31.1) | 7.8 (3.9) |
| HbA1C (%) | 5.095 (2.99) | 4.911 (3.482) | 5.192 (3.934) | 5.318 (3.809) |
| Visit | Minimum (%) | Maximum (%) | Range (%) | Mean (%) |
|---|---|---|---|---|
| 1 (weeks 8–12) | 4.0 | 32.8 | 28.8 | 13.89 |
| 2 (weeks 24–28) | 4.0 | 30.2 | 26.2 | 13.48 |
| 3 (week 36) | 5.2 | 26.9 | 21.7 | 12.22 |
| 4 (6 weeks postpartum) | 4.8 | 22.8 | 18.0 | 11.48 |
| All visits | 4.0 | 32.8 | 28.8 | 13.30 |
| t-Tests Relation | t Value | p-Value |
|---|---|---|
| HbF-Positive/Negative women and total hemoglobin | NA | NS |
| Age (above or below 35 years-old) and HbF% | −0.114144 | 0.909190 |
| Smoking status and HbF% | 1.787341 | 0.074770 |
| Fertility clinic consultation and HbF% | 1.189824 | 0.234939 |
| Hypertension history and HbF% | −0.451676 | 0.651788 |
| Use of progesterone and HbF% | 0.916958 | 0.359809 |
| Pearson Correlations Relation | p-Value | |
| Weight and HbF% | 0.05 | |
| Number of years of smoking and HbF% | 0.05 | |
| Number of pregnancies and HbF% | 0.05 | |
| Ascending Stepwise Regression Variables (All Visits) | p-Value | Adjusted Correlation Coefficient (R2) |
|---|---|---|
| All parturients and all variables to predict HbF% | 0.0041 | 62.20% |
| All parturients and significant variables to predict HbF% | 0.0010 | 58.44% |
| All parturients and all variables to predict F-cells% | 0.0539 | 76.49% |
| All parturients and significant variables to predict F-cells% | 0.1139 | 68.29% |
| All parturients and all variables to predict F-cells intensity | 0.0141 | 64.99% |
| All parturients and significant variables to predict F-cells intensity | 0.0141 | 64.99% |
| HbF-positive parturients and all variables to predict HbF | 0.0013 | 16.14% |
| HbF-positive parturients and significant variables to predict HbF | 0.0000 | 15.18% |
| HbF-positive parturients and all variables to predict F-cells% | 0.0567 | 76.53% |
| HbF-positive parturients and significant variables to predict F-cells% | 0.9977 | 75.87% |
| HbF-positive parturients and all variables to predict F-cells intensity | 0.0140 | 64.98% |
| HbF-positive parturients and significant variables to predict F-cells intensity | 0.0140 | 64.98% |
Disclaimer/Publisher’s Note: The statements, opinions and data contained in all publications are solely those of the individual author(s) and contributor(s) and not of MDPI and/or the editor(s). MDPI and/or the editor(s) disclaim responsibility for any injury to people or property resulting from any ideas, methods, instructions or products referred to in the content. |
© 2023 by the authors. Licensee MDPI, Basel, Switzerland. This article is an open access article distributed under the terms and conditions of the Creative Commons Attribution (CC BY) license (https://creativecommons.org/licenses/by/4.0/).
Share and Cite
Blain, L.; Watier, C.; Weng, X.; Masse, A.; Bédard, M.-J.; Bettache, N.; Weber, F.; Mahone, M.; Forté, S.; Lavallée, V.-P.; et al. Prospective Evaluation of Fetal Hemoglobin Expression in Maternal Erythrocytes: An Analysis of a Cohort of 345 Parturients. Diagnostics 2023, 13, 1873. https://doi.org/10.3390/diagnostics13111873
Blain L, Watier C, Weng X, Masse A, Bédard M-J, Bettache N, Weber F, Mahone M, Forté S, Lavallée V-P, et al. Prospective Evaluation of Fetal Hemoglobin Expression in Maternal Erythrocytes: An Analysis of a Cohort of 345 Parturients. Diagnostics. 2023; 13(11):1873. https://doi.org/10.3390/diagnostics13111873
Chicago/Turabian StyleBlain, Laurence, Christian Watier, Xiaoduan Weng, Andre Masse, Marie-Josée Bédard, Nazila Bettache, Florence Weber, Michele Mahone, Stéphanie Forté, Vincent-Philippe Lavallée, and et al. 2023. "Prospective Evaluation of Fetal Hemoglobin Expression in Maternal Erythrocytes: An Analysis of a Cohort of 345 Parturients" Diagnostics 13, no. 11: 1873. https://doi.org/10.3390/diagnostics13111873