

Assessment of Image Quality of Coronary CT Angiography Using Deep Learning-Based CT Reconstruction: Phantom and Patient Studies
 , ,
, ,
Abstract
:1. Introduction
2. Materials and Methods
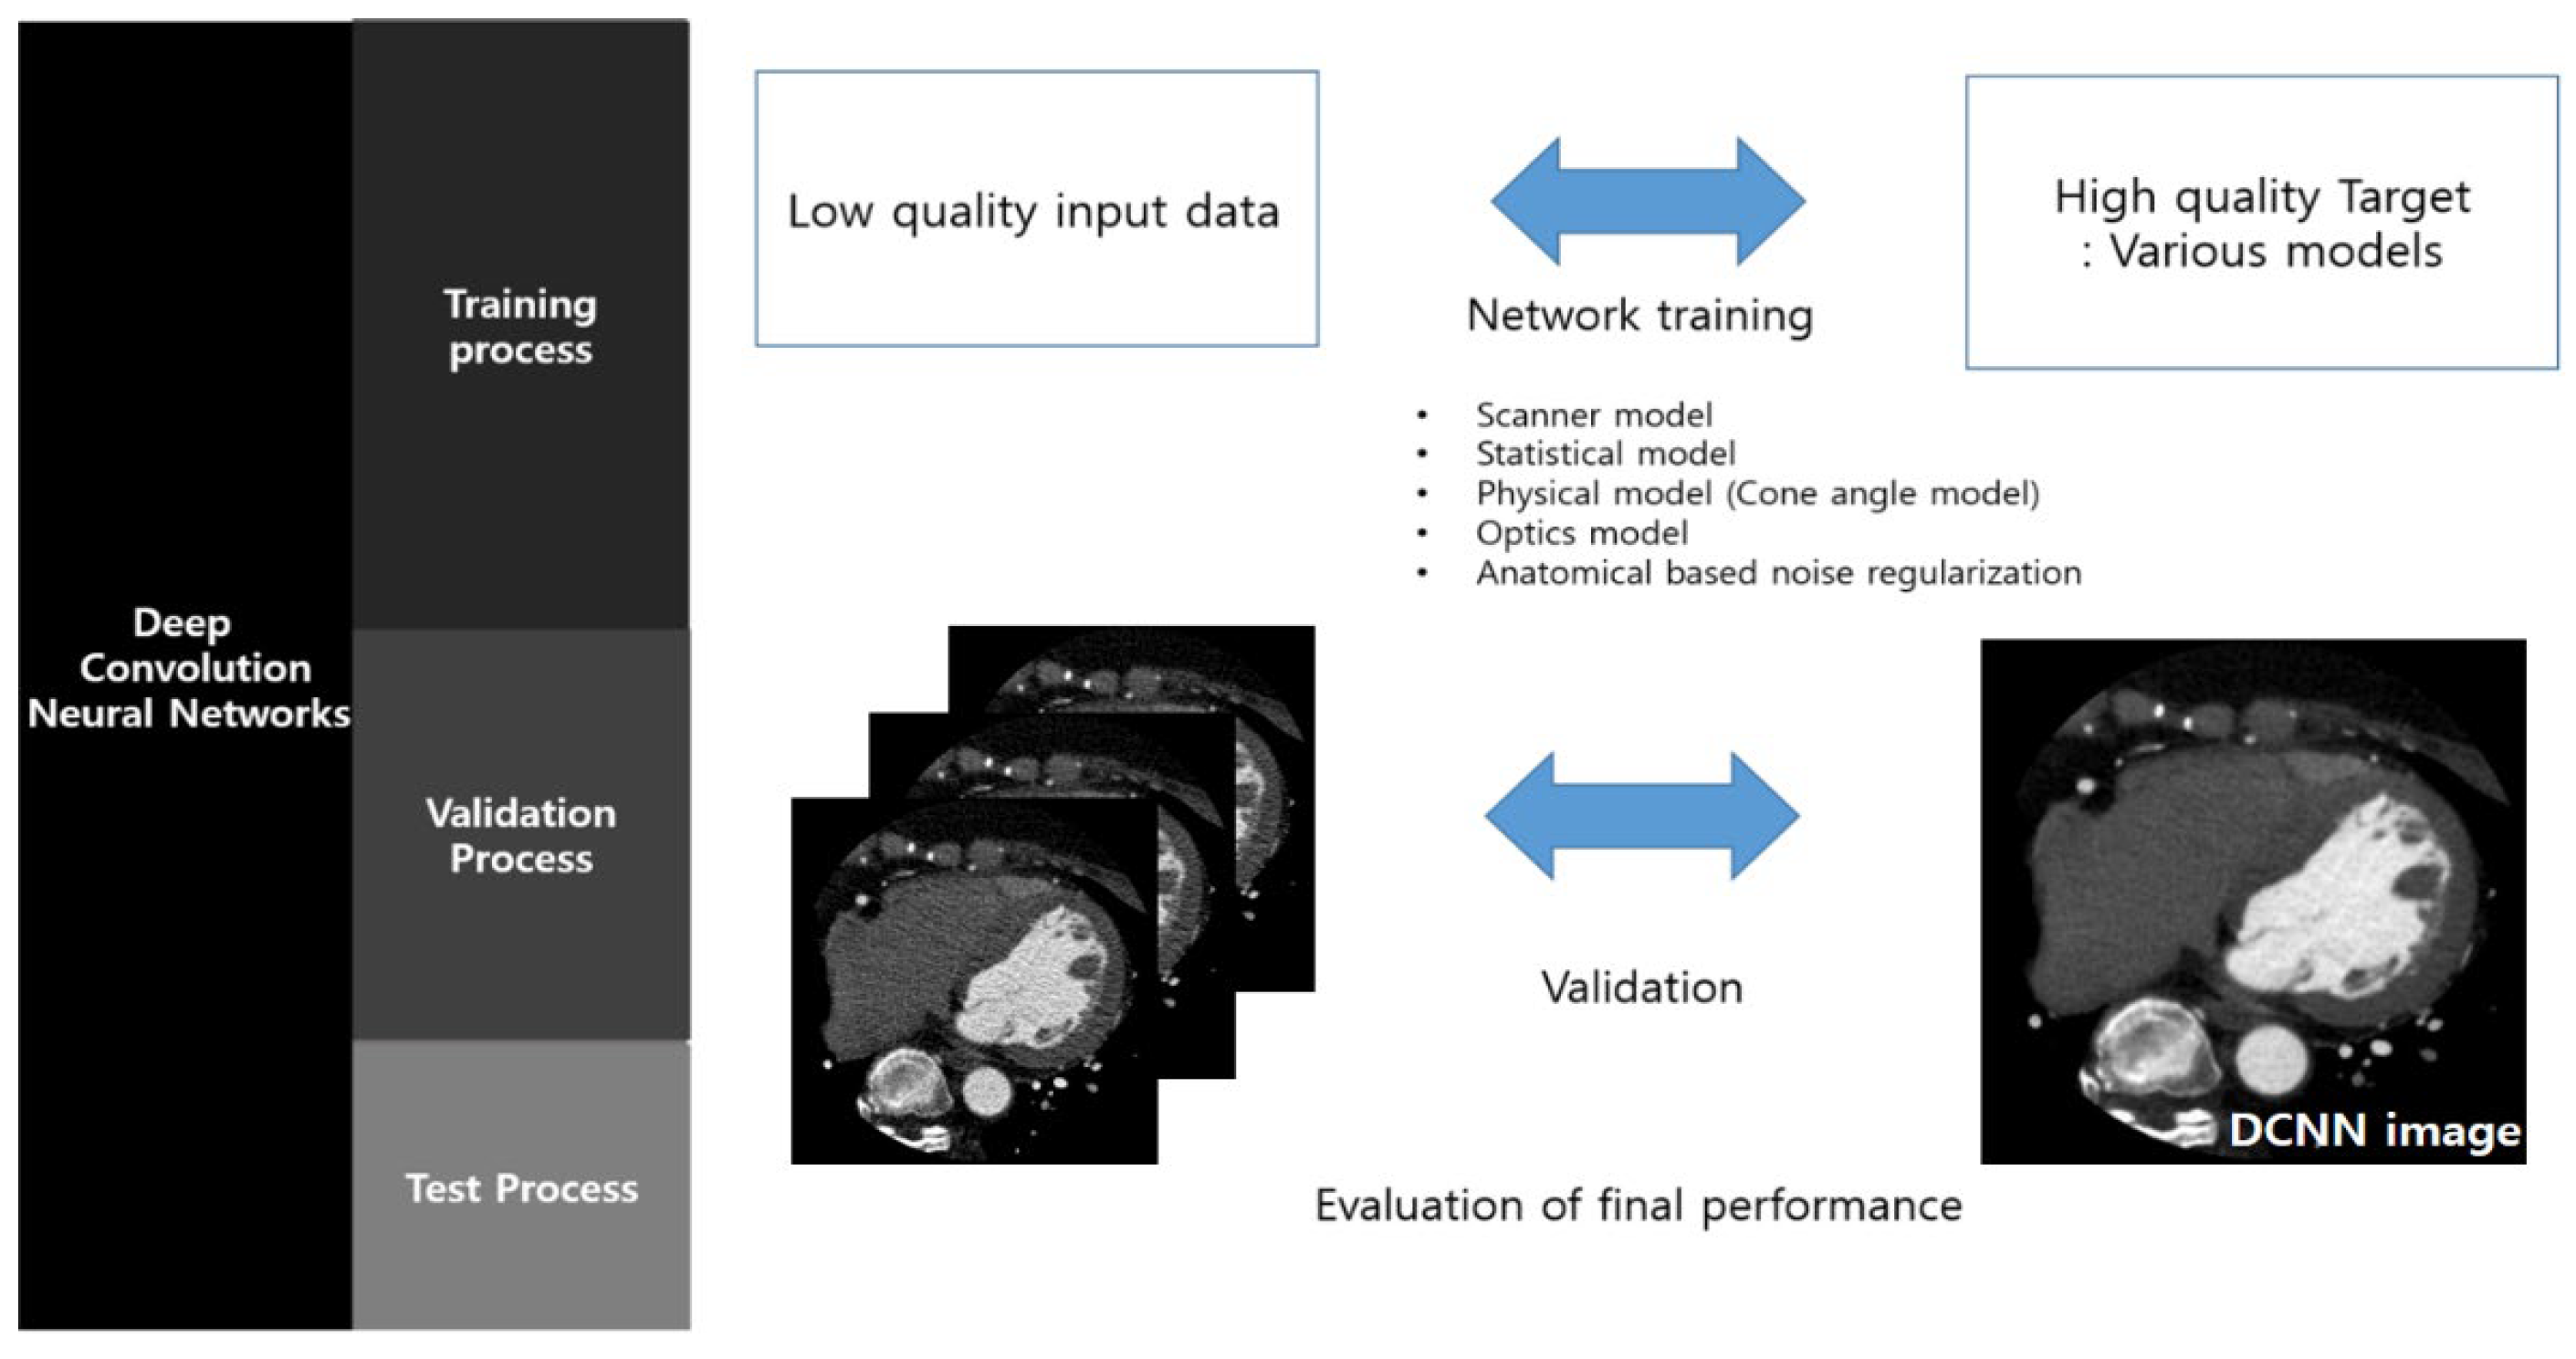
2.1. DLR
2.2. Experimental Setup
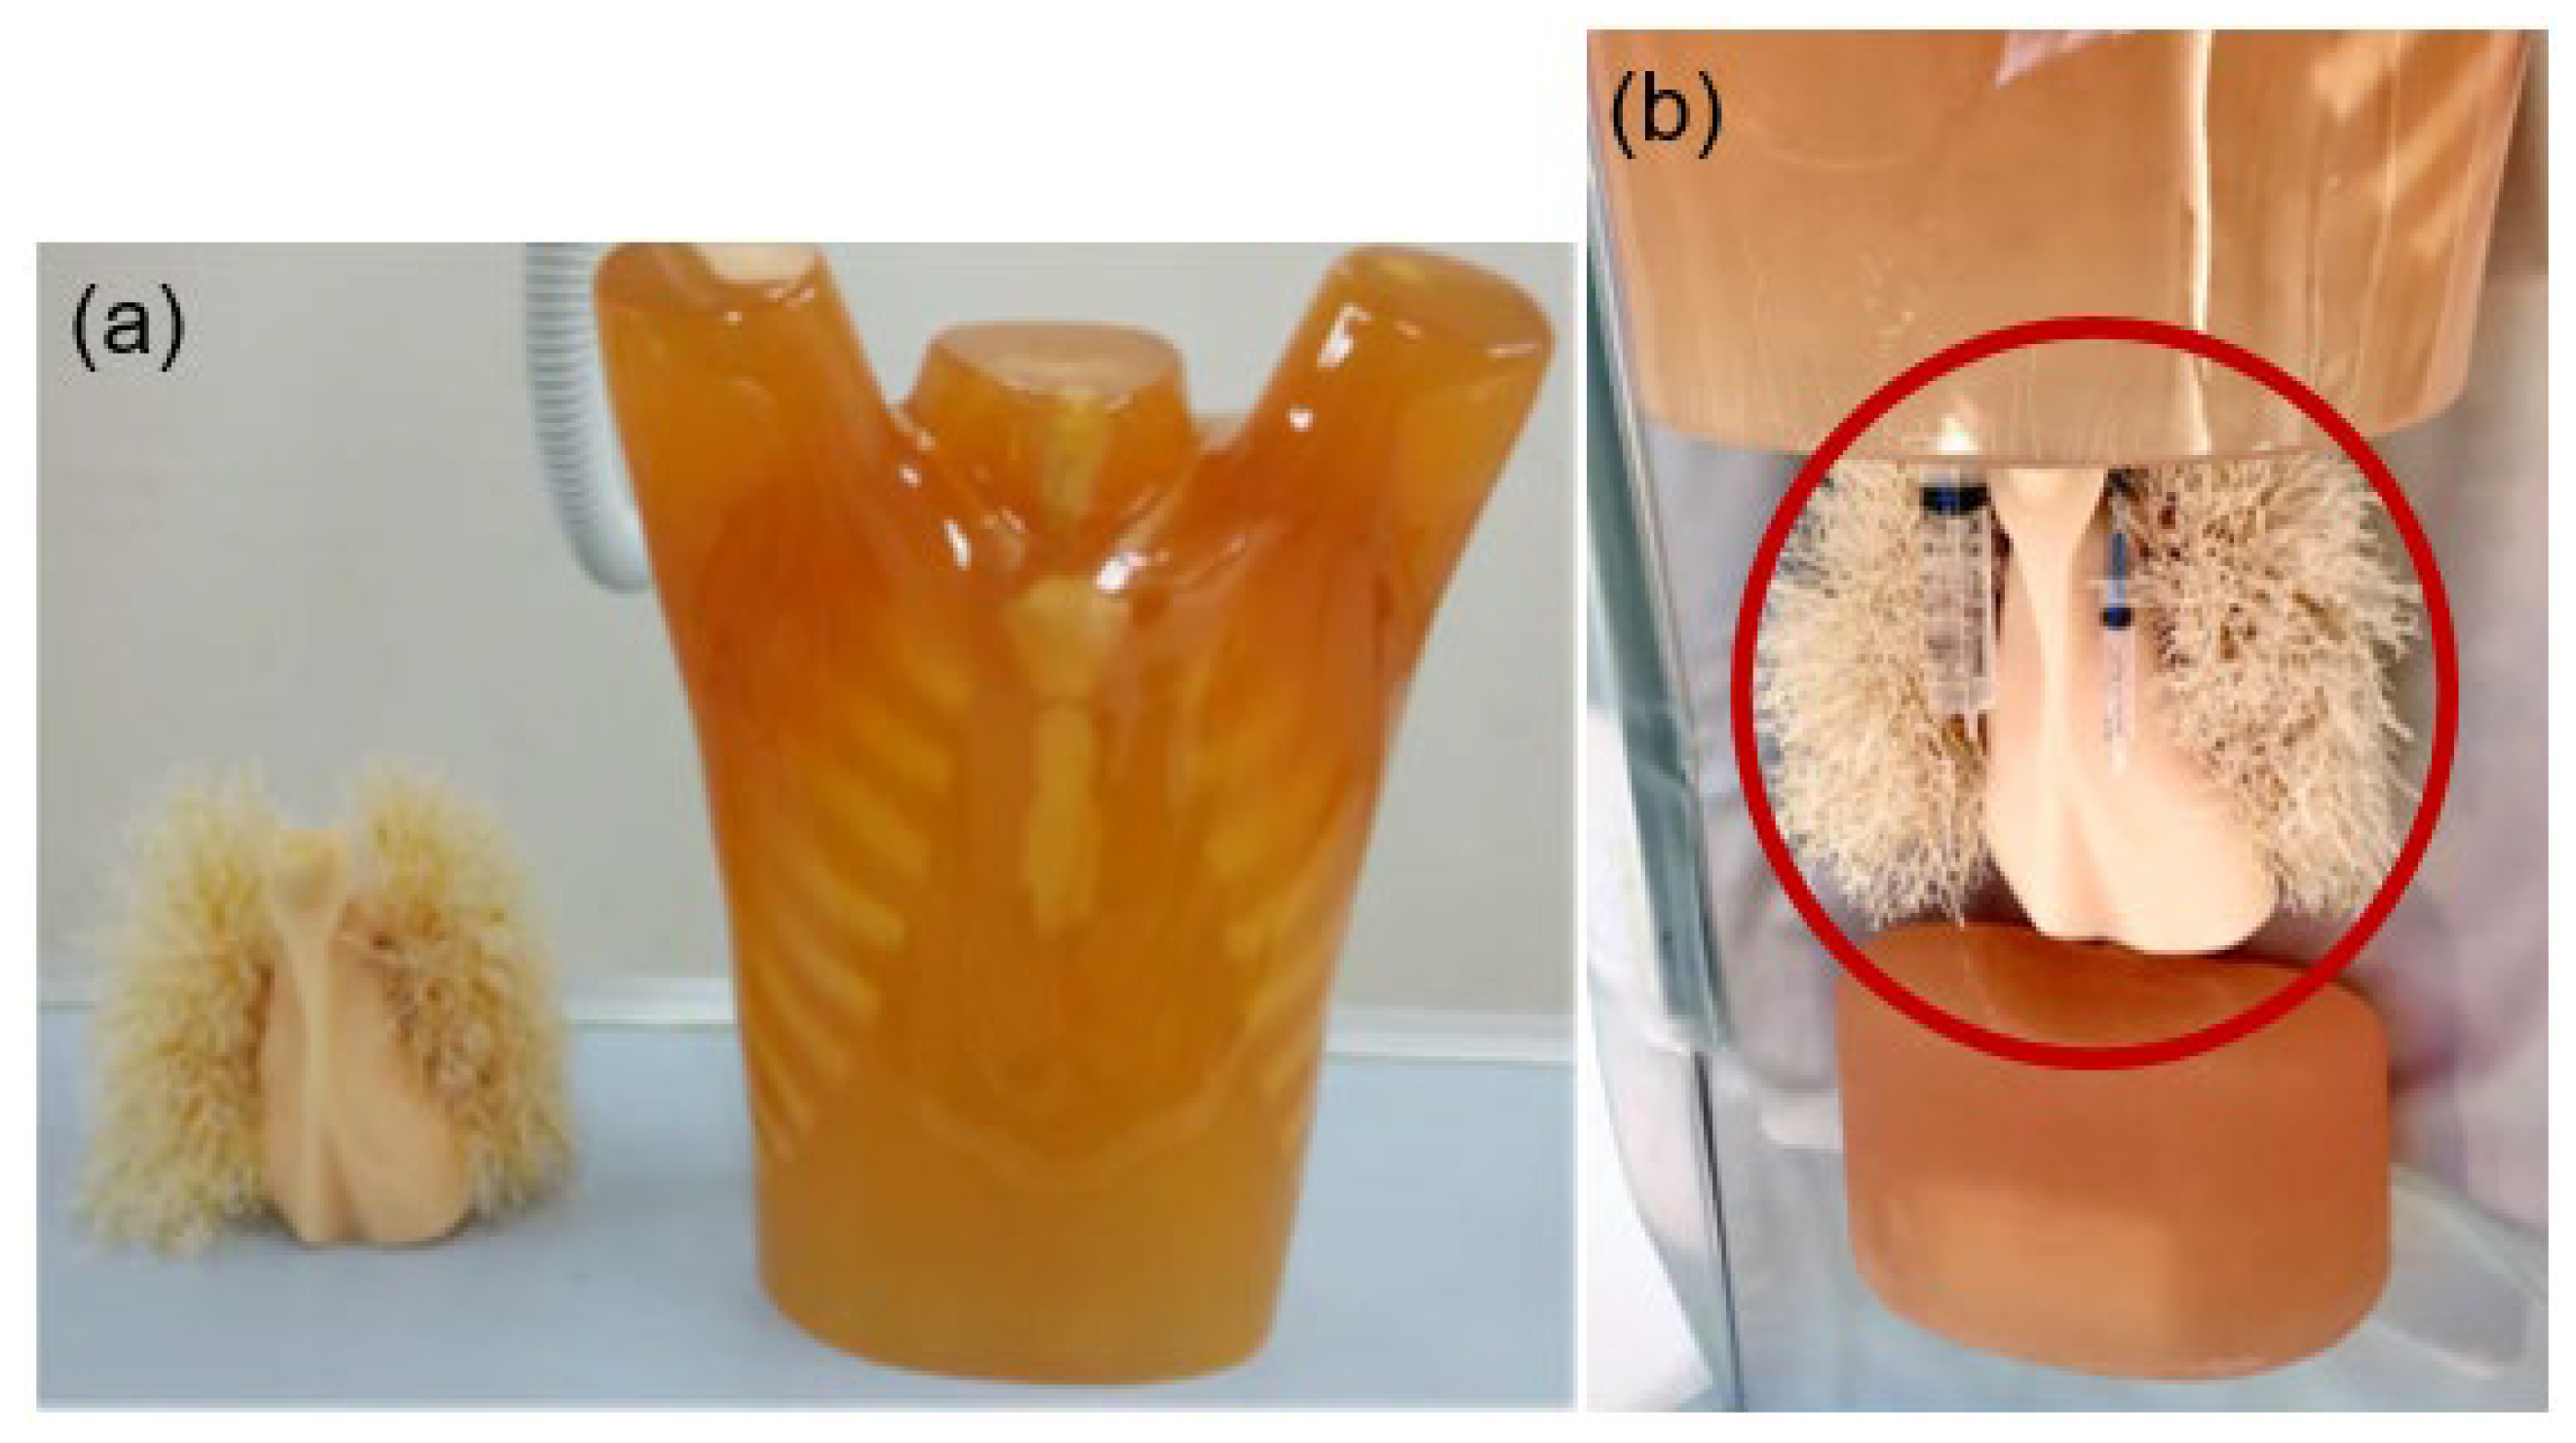
2.3. Phantom Study
2.4. Patient Setup
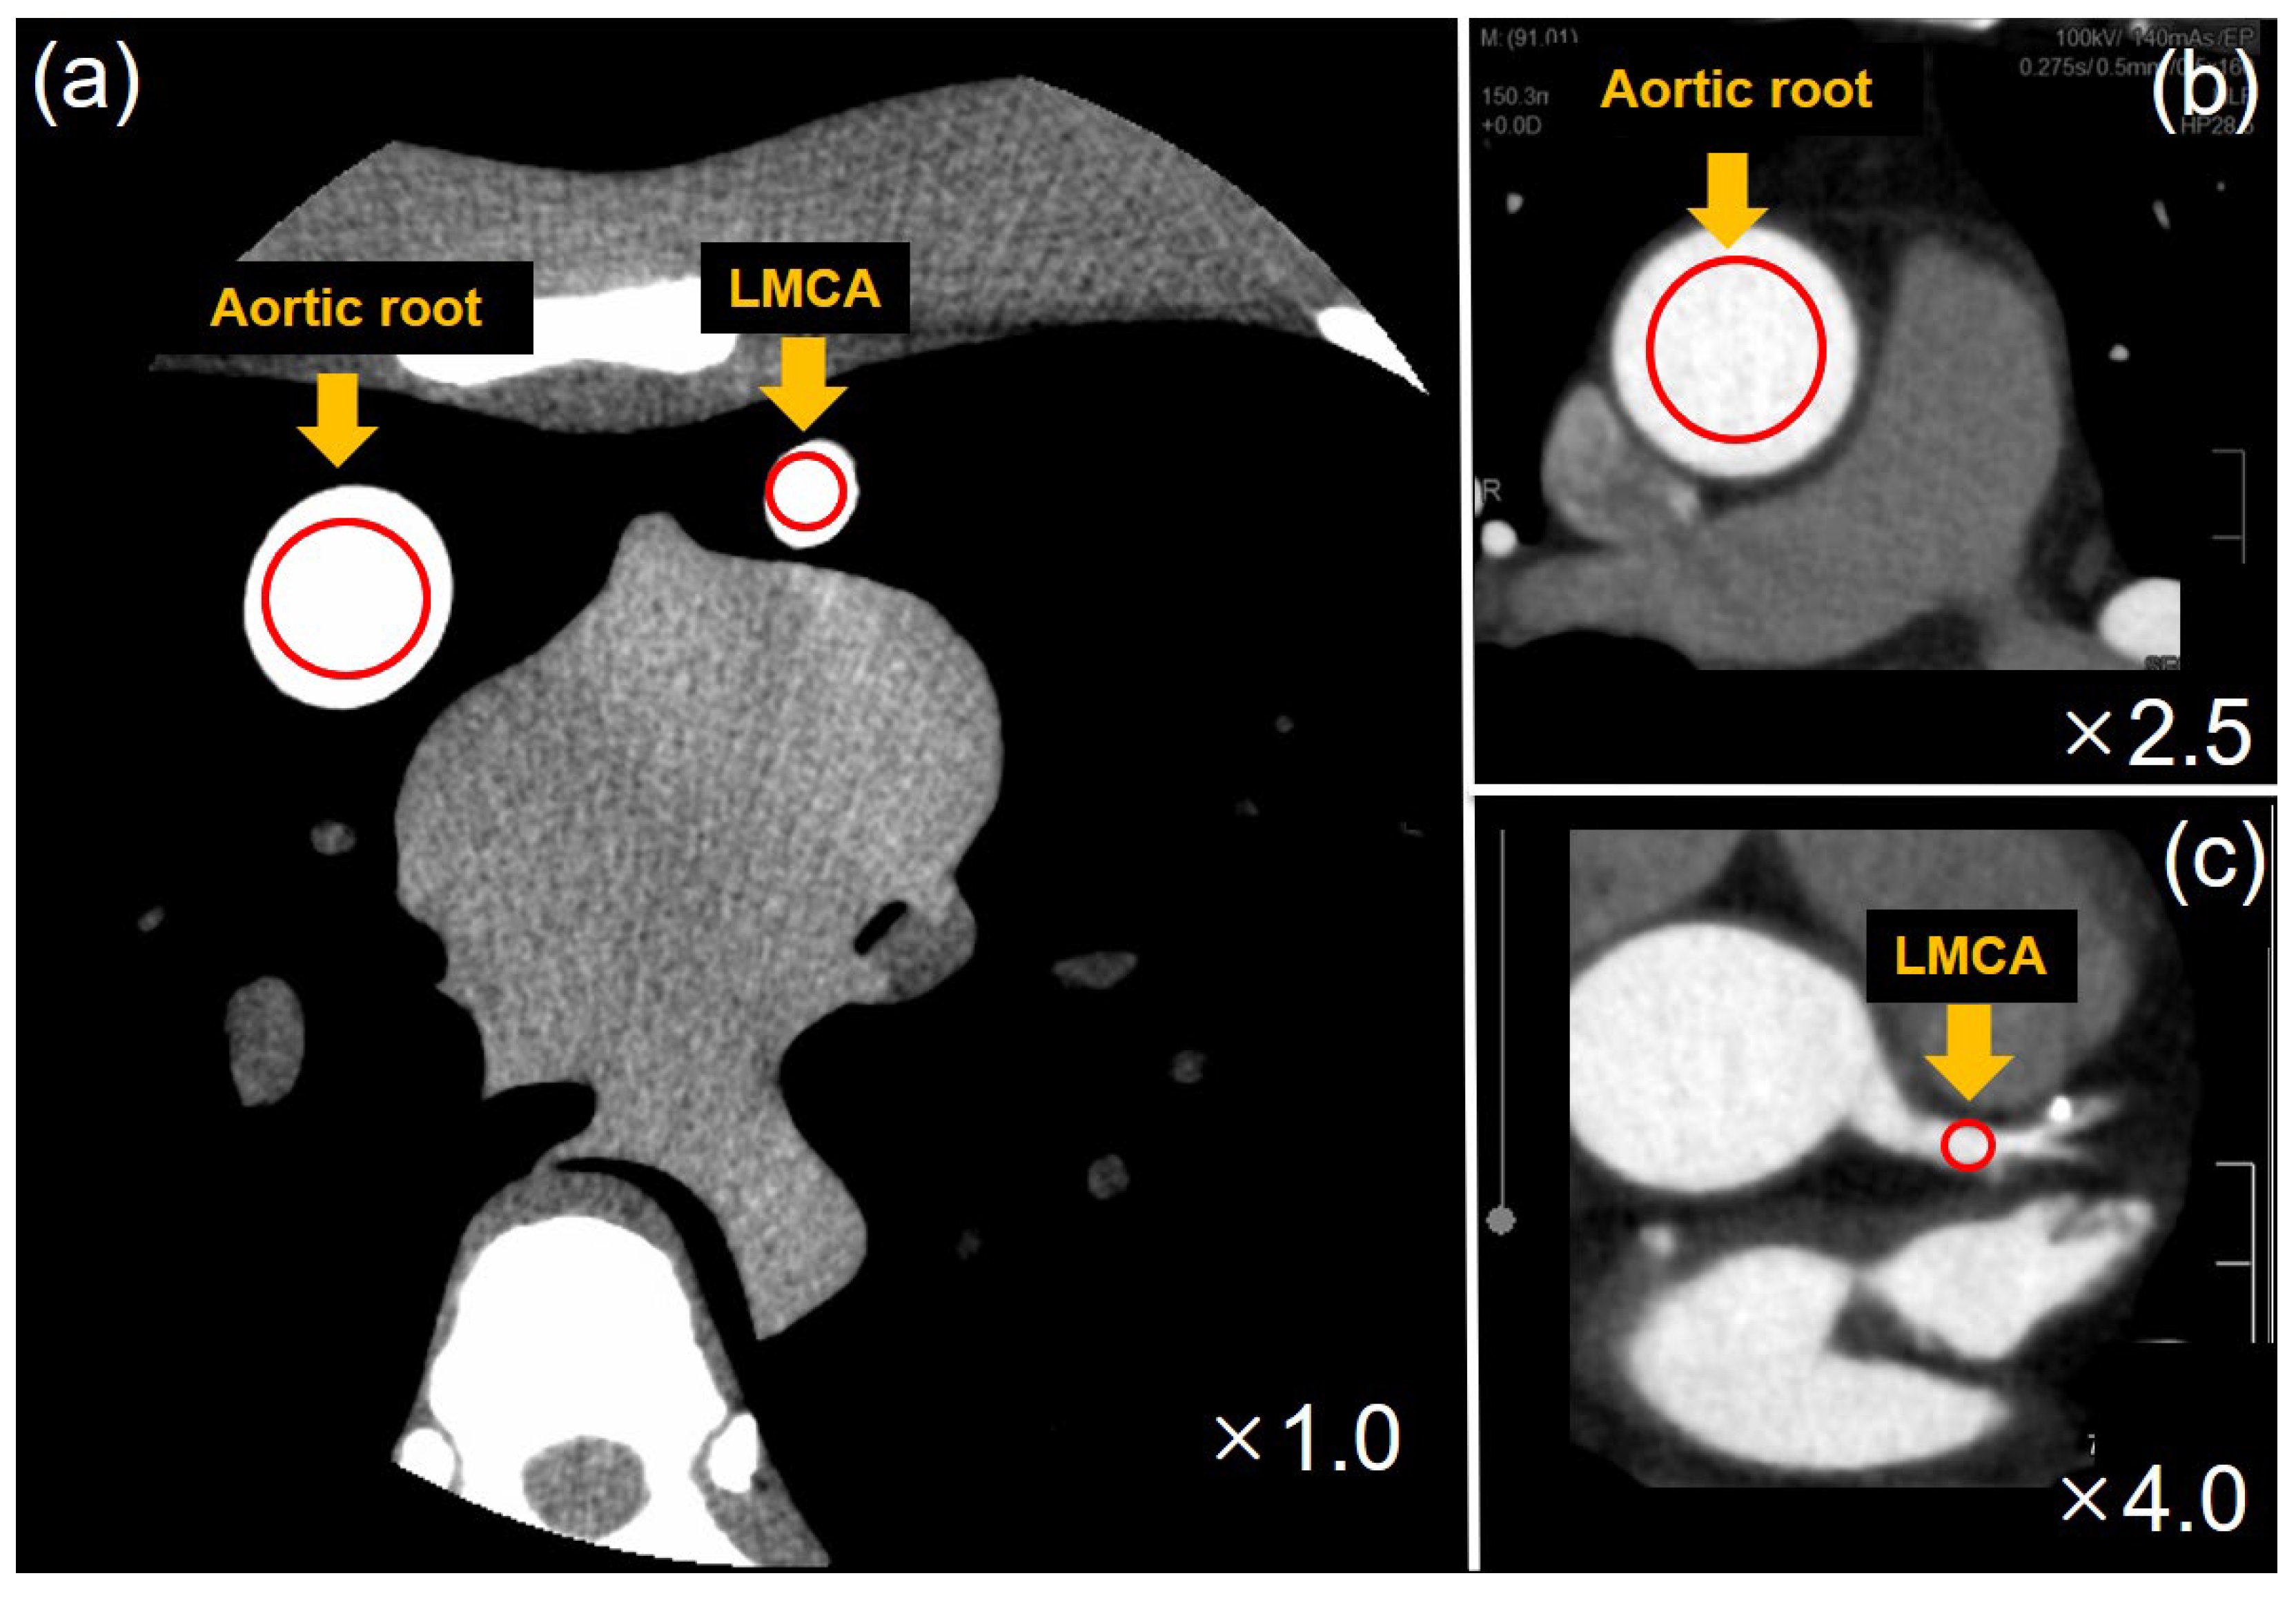
2.5. Image Analysis
2.6. Dose Analysis
2.7. Subjective Image Analysis
2.8. Statistical Analysis
3. Results
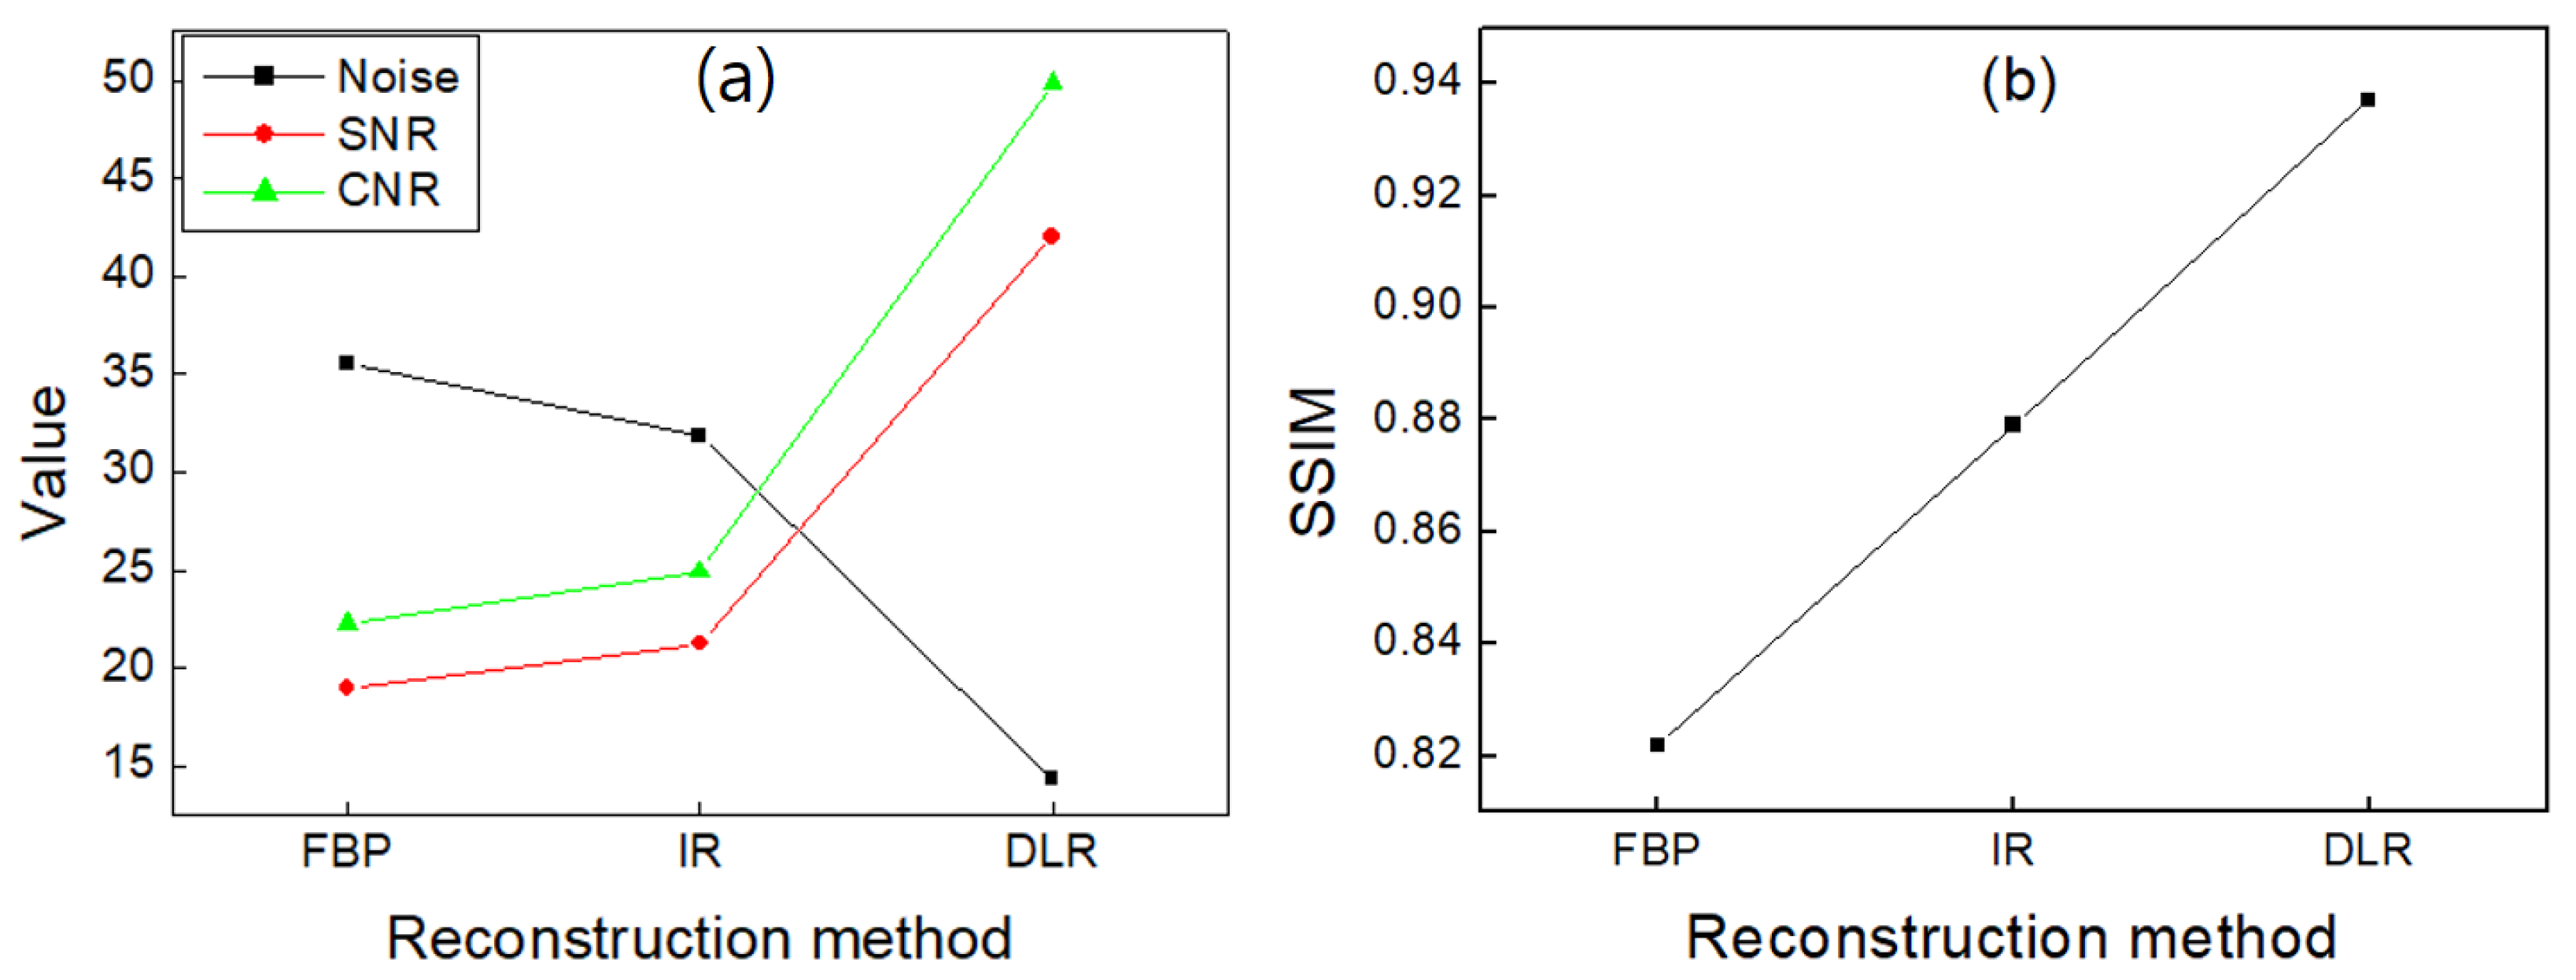
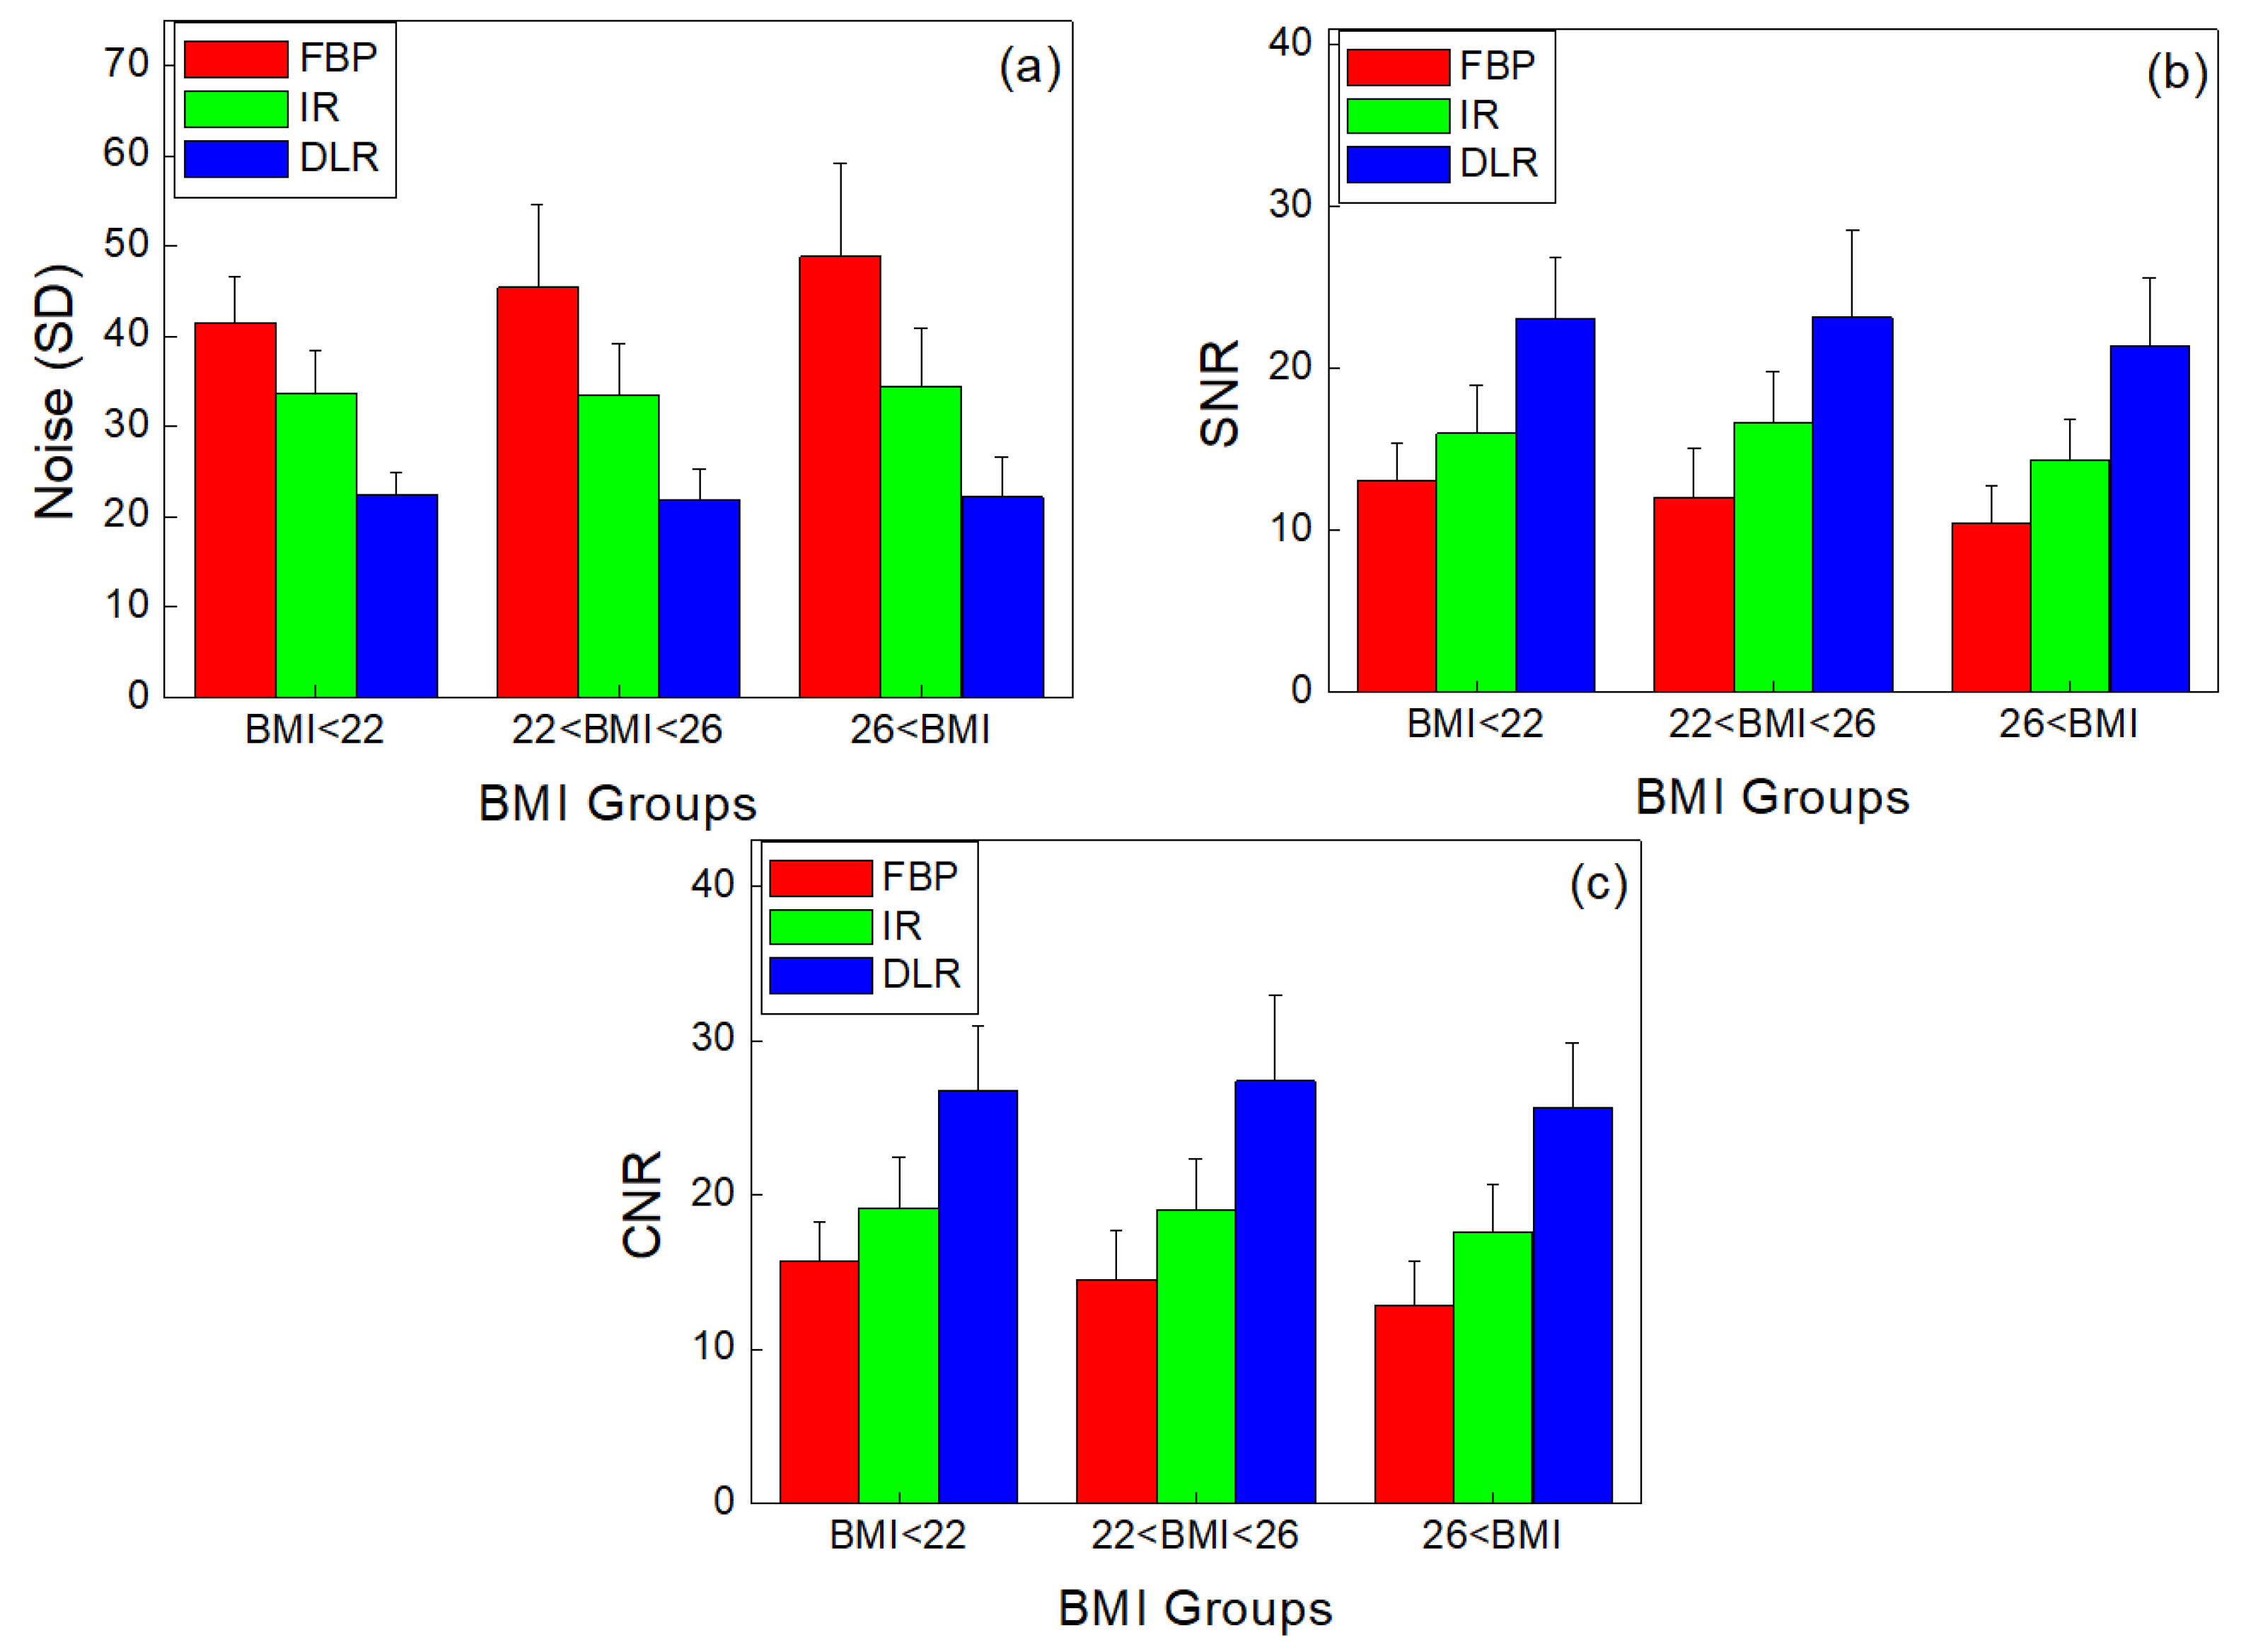
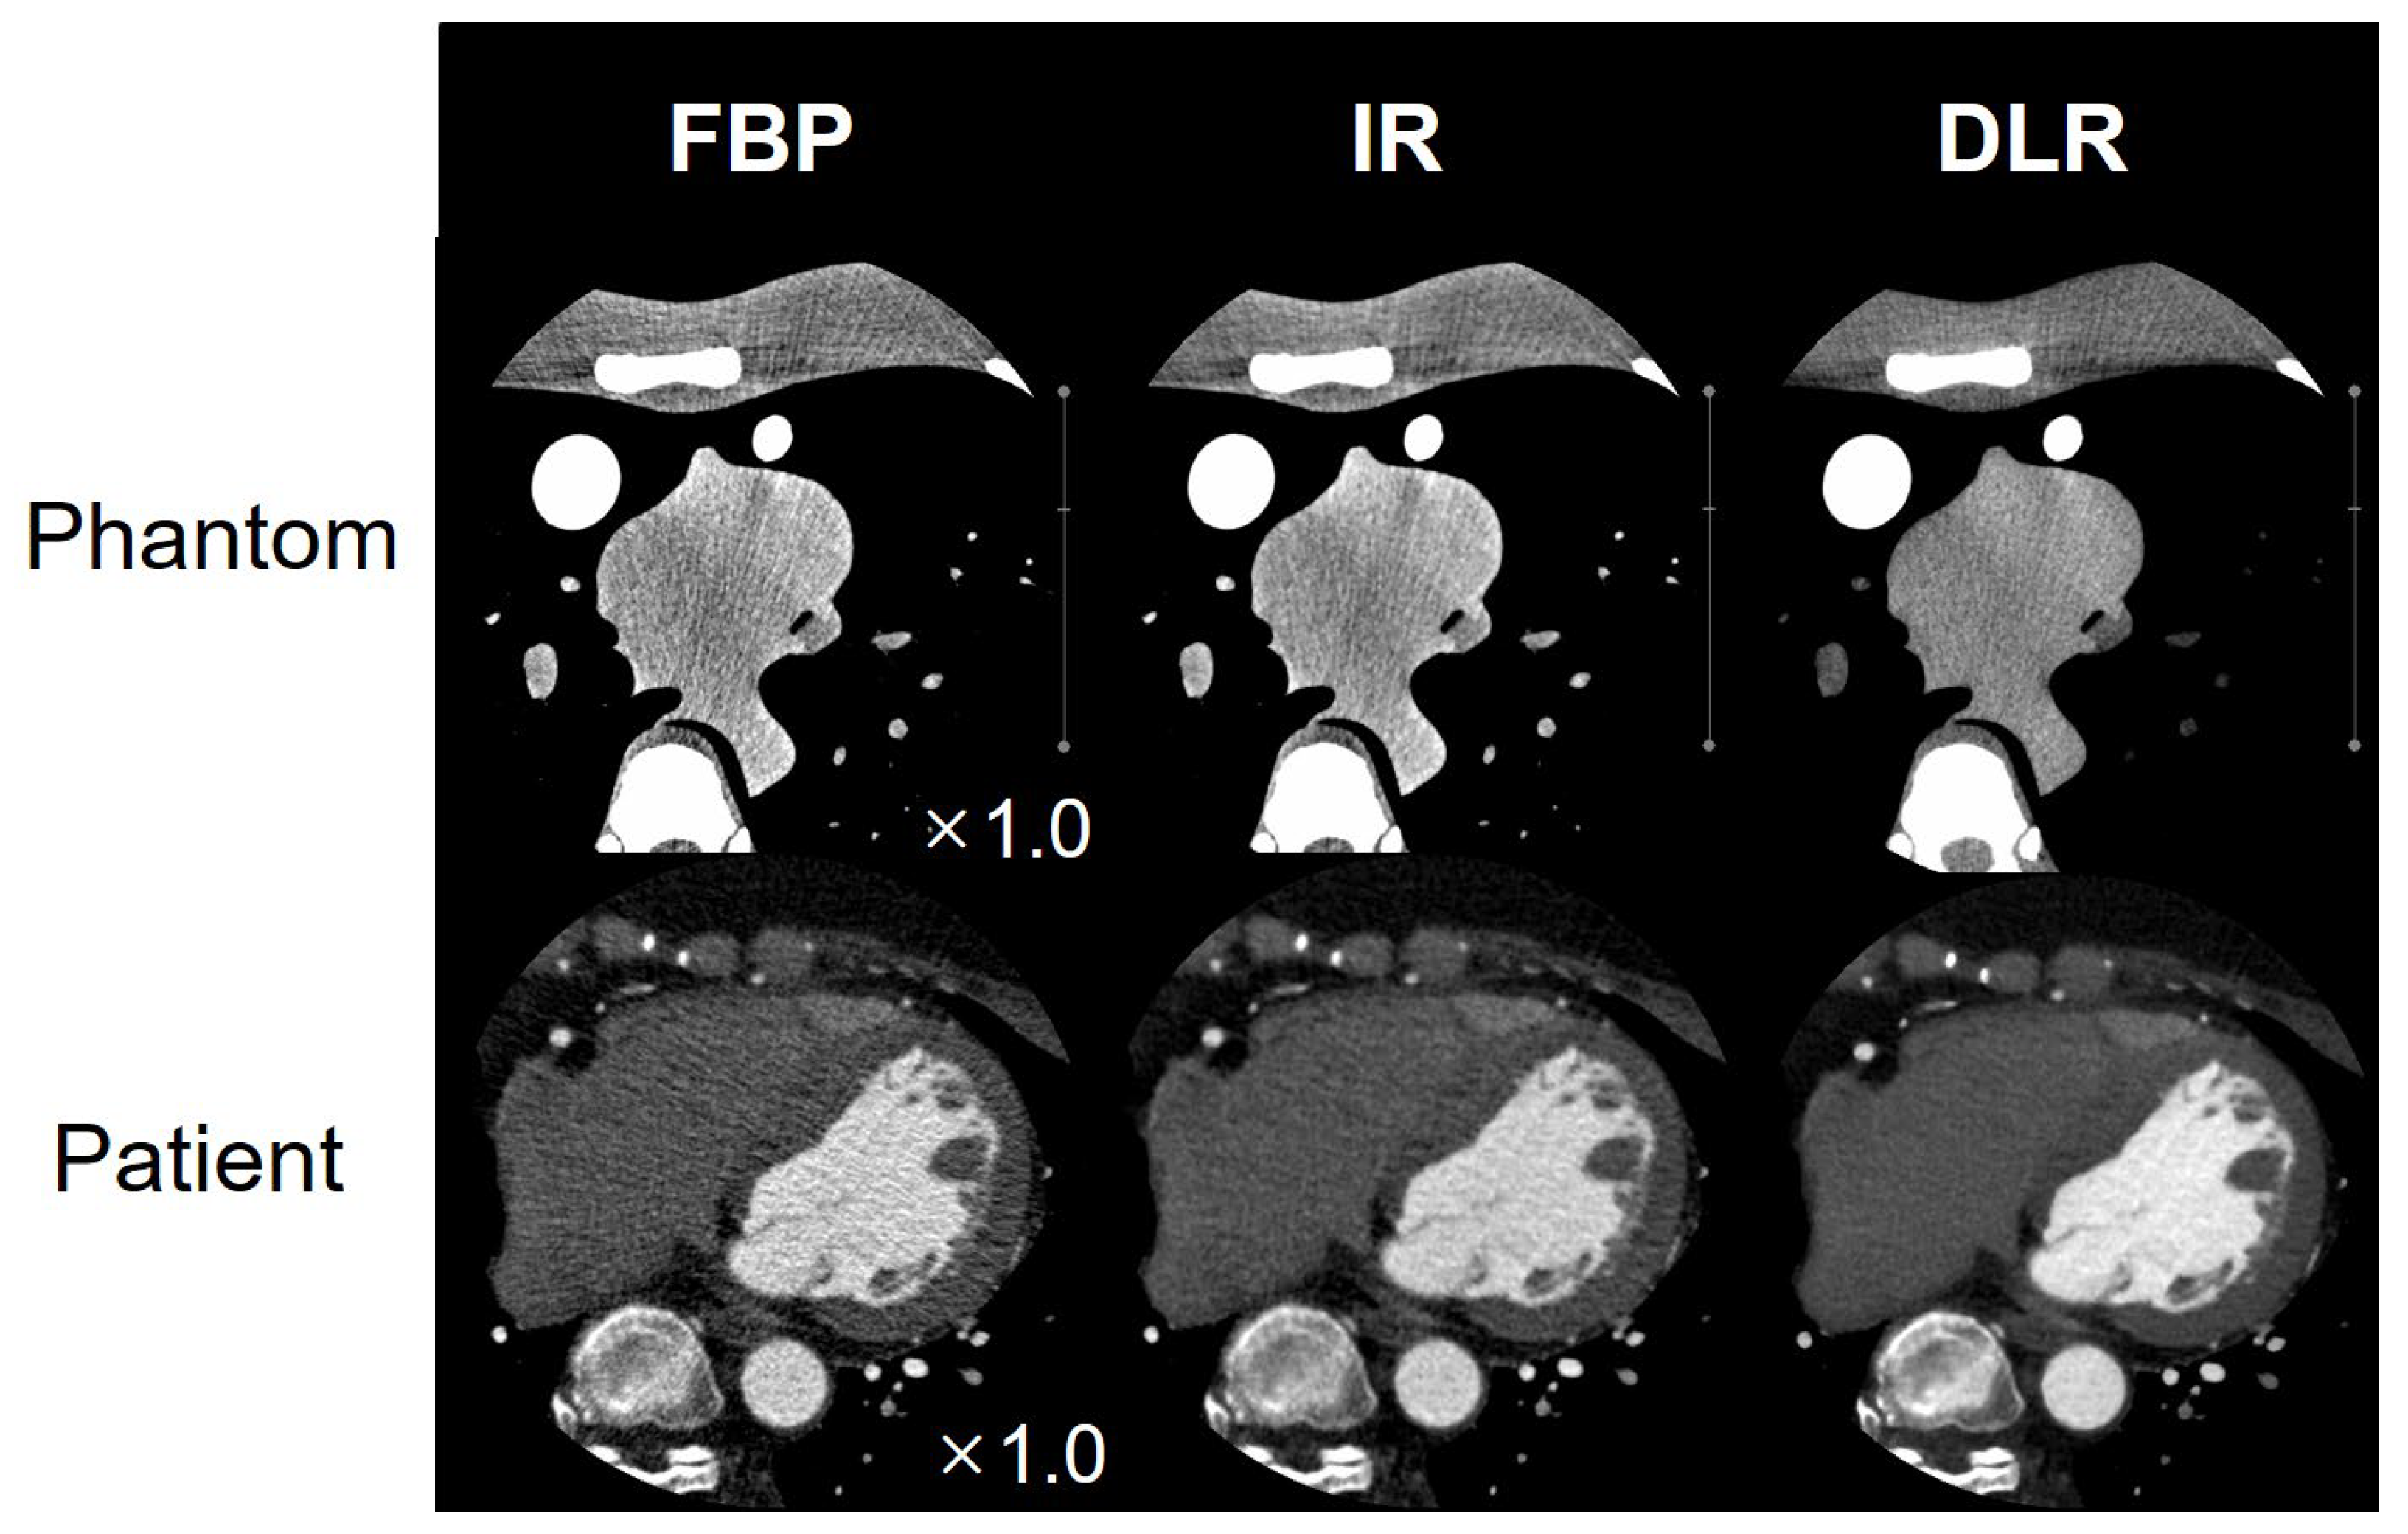
3.1. Phantom Study
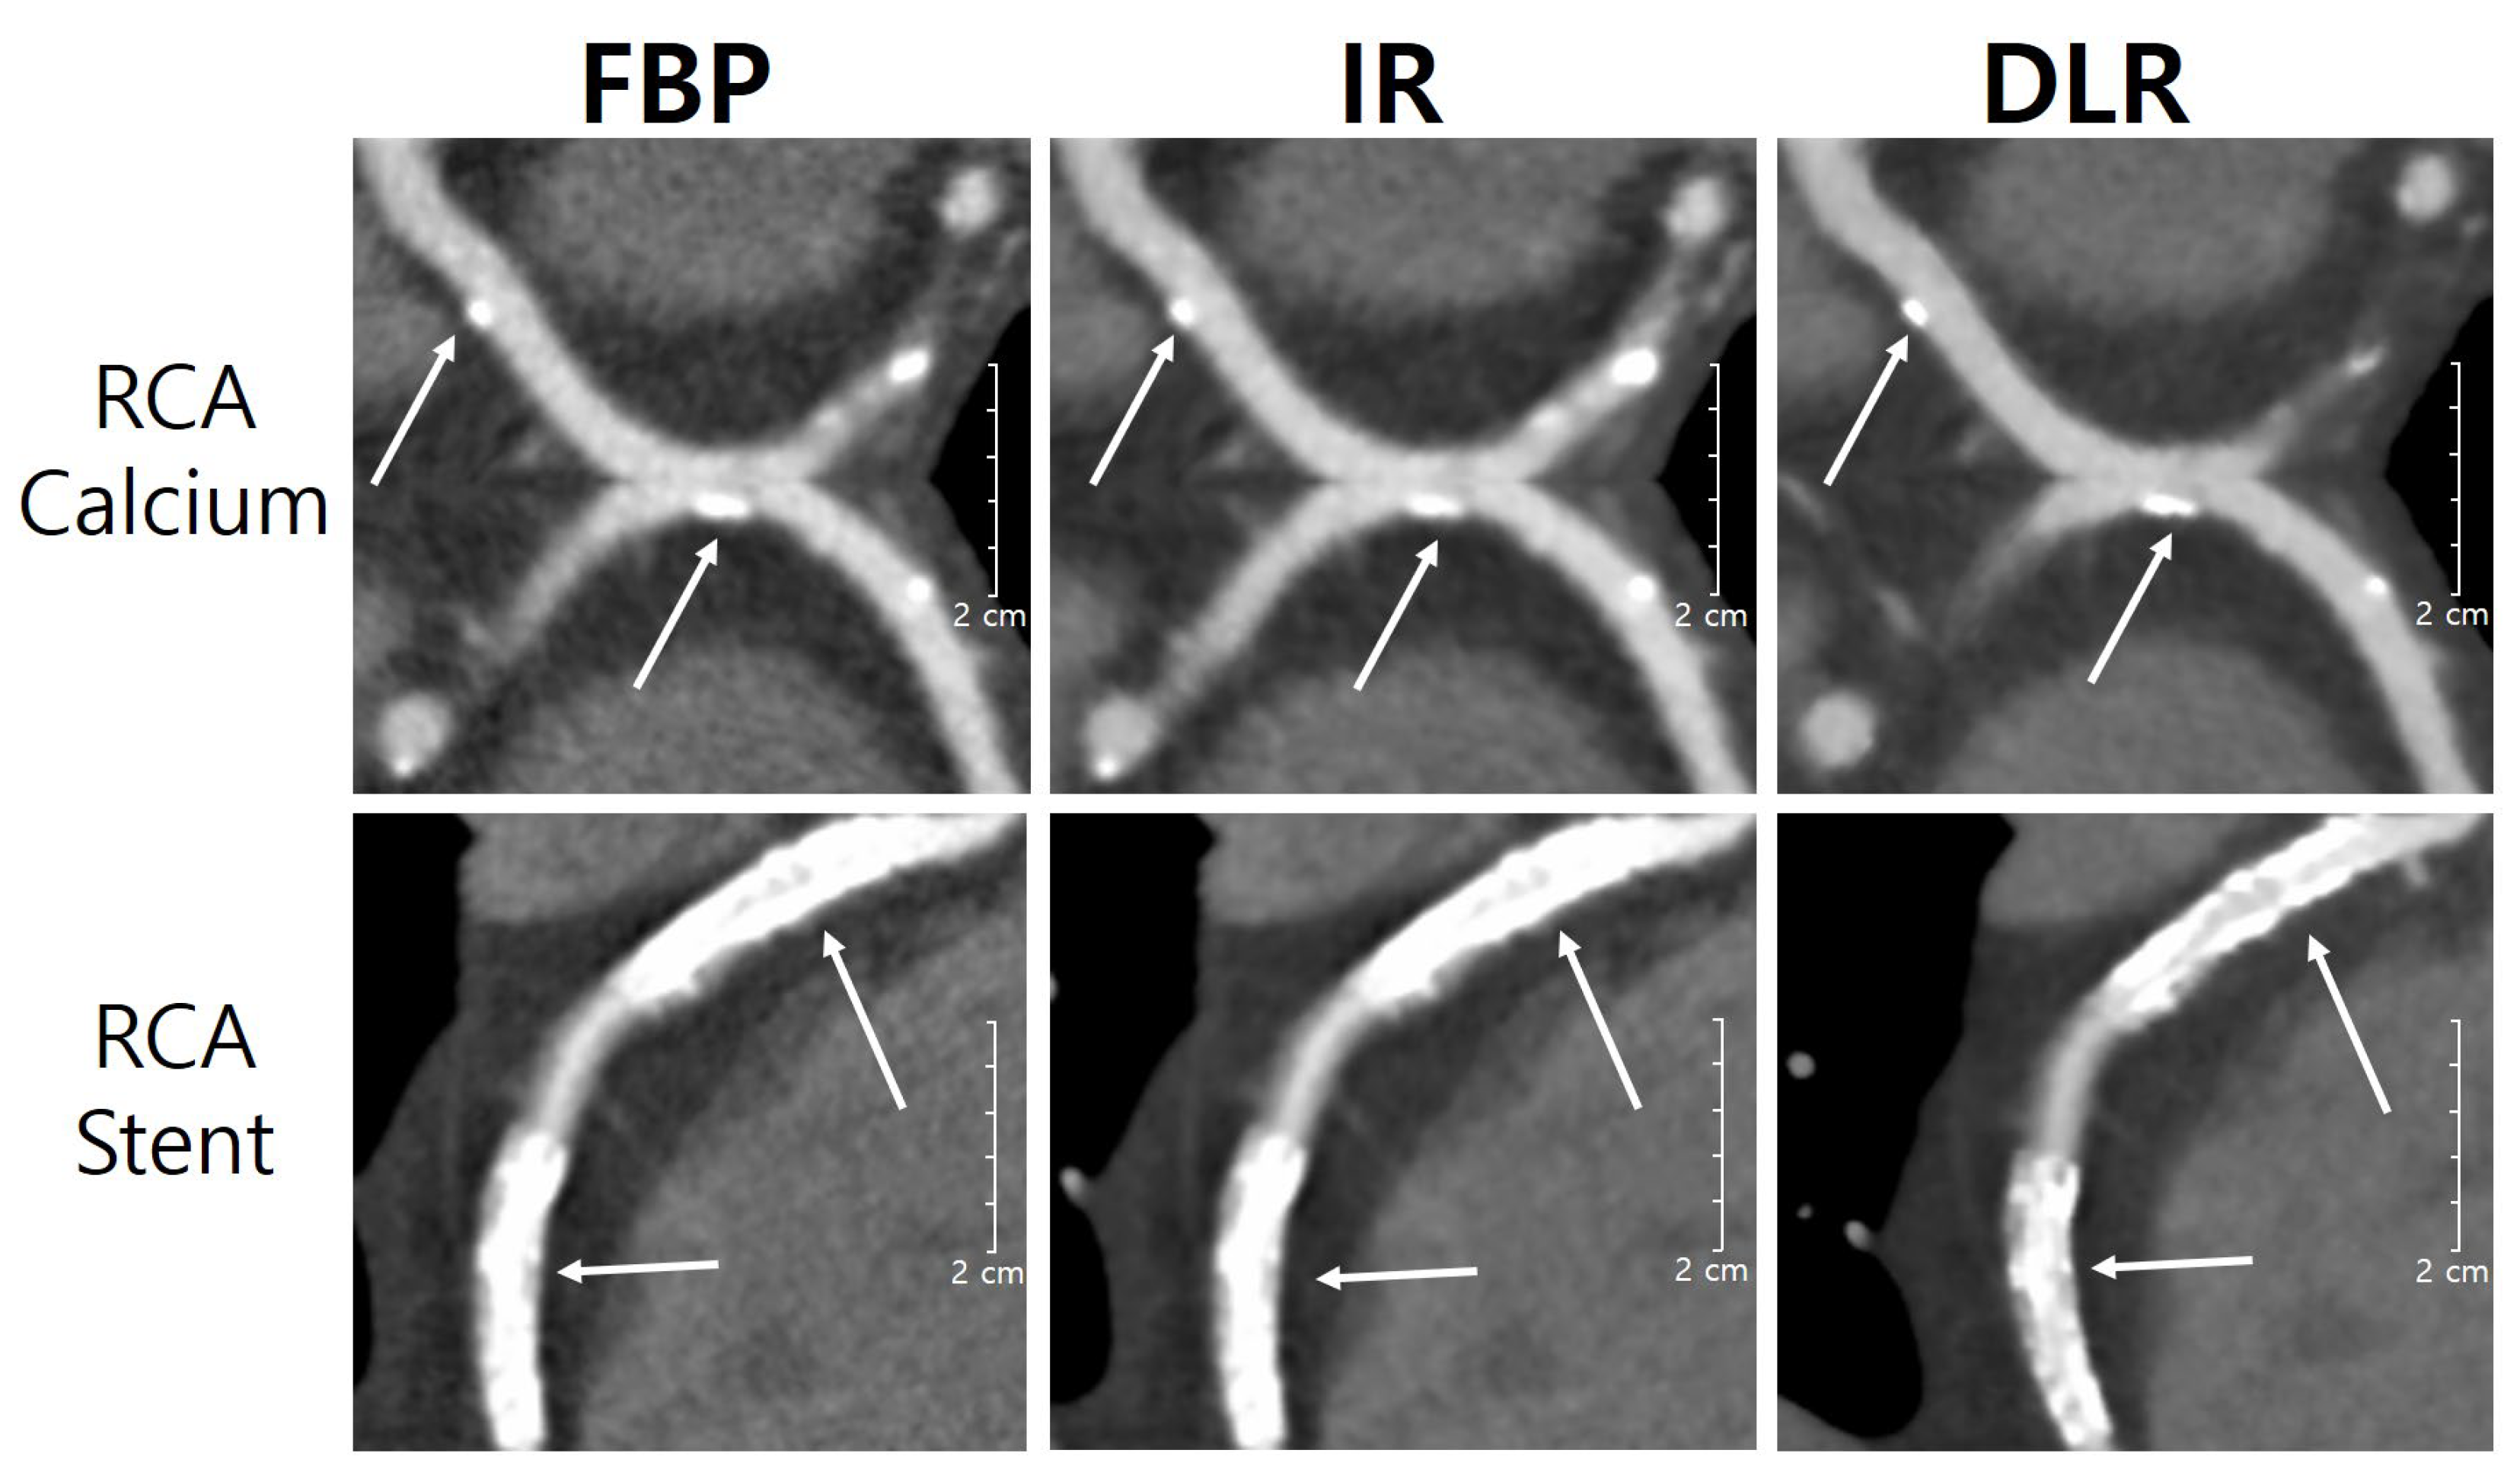
3.2. Patient Study
3.3. Subjective Image Analysis
4. Discussion
5. Conclusions
Author Contributions
Funding
Institutional Review Board Statement
Informed Consent Statement
Data Availability Statement
Conflicts of Interest
References
- Mozaffarian, D.; Benjamin, E.J.; Go, A.S.; Arnett, D.K.; Blaha, M.J.; Cushman, M.; Das, S.; de Ferranti, S.; Despres, J.P.; Fullerton, H.J.; et al. Executive summary: Heart disease and stroke statistics–2016 update. Circulation 2016, 133, 447–454. [Google Scholar] [CrossRef]
- Statistics Korea. Available online: https://kostat.go.kr/anse/ (accessed on 27 September 2022).
- Budoff, M.J.; Dowe, D.; Jollis, J.G.; Gitter, M.; Sutherland, J.; Halamert, E.; Scherer, M.; Bellinger, R.; Martin, A.; Benton, R.; et al. Diagnostic performance of 64-multidetector row coronary computed tomographic angiography for evaluation of coronary artery stenosis in individuals without known coronary artery disease: Results from the prospective multicenter ACCURACY (Assessment by Coronary Computed Tomographic Angiography of Individuals Undergoing Invasive Coronary Angiography) trial. J. Am. Coll. Cardiol. 2008, 52, 1724–1732. [Google Scholar]
- Gebhard, C.; Fuchs, T.A.; Fiechter, M.; Stehli, J.; Stahli, B.E.; Gaemperli, O.; Kaufmann, P.A. Image quality of low-dose CCTA in obese patients: Impact of high-definition computed tomography and adaptive statistical iterative reconstruction. Int. J. Cardiovasc. Imaging 2013, 29, 1565–1574. [Google Scholar] [CrossRef]
- Guo, W.; Tripathi, P.; Yang, S.; Qian, J.; Rai, B.; Zeng, M. Modified subtraction coronary CT angiography with a two-breathhold technique: Image quality and diagnostic accuracy in patients with coronary calcifications. Korean J. Radiol. 2019, 20, 1146–1155. [Google Scholar] [CrossRef]
- Al’Aref, S.; Pena, J.M.; Min, J.K. High-risk atherosclerotic plaque features for cardiovascular risk assessment in the prospective multicenter imaging study for evaluation of chest pain trial. Cardiovasc. Diagn. Ther. 2019, 9, 89–93. [Google Scholar] [CrossRef]
- Ebersberger, U.; Tricarico, F.; Schoepf, U.J.; Blanke, P.; Spears, J.R.; Rowe, G.W.; Halligan, W.T.; Henzler, T.; Bamberg, F.; Leber, A.W.; et al. CT evaluation of coronary artery stents with iterative image reconstruction: Improvements in image quality and potential for radiation dose. Eur. Radiol. 2013, 23, 125–132. [Google Scholar] [CrossRef]
- Sun, Z.; Almutairi, A.M. Diagnostic accuracy of 64 multislice CT angiography in the assessment of coronary in-stent restenosis: A meta-analysis. Eur. J. Radiol. 2010, 73, 266–273. [Google Scholar] [CrossRef]
- Oostveen, L.J.; Meijer, F.J.A.; Lange, F.; Smit, E.J.; Pegge, S.A.; Steens, S.C.A.; van Amerongen, M.J.; Prokop, M.; Sechopoulos, I. Deep learning-based reconstruction may improve non-contrast cerebral CT imaging compared to other current reconstruction algorithms. Eur. Radiol. 2021, 31, 5498–5506. [Google Scholar] [CrossRef]
- Kim, J.H.; Yoon, H.J.; Lee, E.; Kim, I.; Cha, Y.K.; Bak, S.H. Validation of deep-learning image reconstruction for low-dose chest computed tomography scan: Emphasis on image quality and noise. Korean J. Radiol. 2020, 22, 131–138. [Google Scholar] [CrossRef]
- Shin, Y.J.; Chang, W.; Ye, J.C.; Kang, E.; Oh, D.Y.; Lee, Y.J.; Park, J.H.; Kim, Y.H. Low-dose abdominal CT using a deep learning-based denoising algorithm: A comparison with CT reconstructed with filtered back projection or iterative reconstruction algorithm. Korean J. Radiol. 2020, 21, 356–364. [Google Scholar] [CrossRef]
- Bernard, A.; Comby, P.O.; Lemogne, B.; Haioun, K.; Ricolfi, F.; Chevallier, O.; Loffroy, R. Deep learning reconstruction versus iterative reconstruction for cardiac CT angiography in a stroke imaging protocol: Reduced radiation dose and improved image quality. Quant. Imaging Med. Surg. 2021, 11, 392–401. [Google Scholar] [CrossRef]
- Solomon, J.; Mileto, A.; Ramirez-Giraldo, J.C.; Samei, E. Diagnostic performance of an advanced modeled Iterative reconstruction algorithm for low-contrast detectability with a third-generation dual-source multidetector CT scanner: Potential for radiation dose reduction in a Multireader Study. Radiology 2015, 275, 735–745. [Google Scholar] [CrossRef]
- Fareed, A.; Vavere, A.L.; Zimmermann, E.; Tanami, Y.; Steveson, C.; Matheson, M.; Paul, N.; Clouse, M.; Cox, C.; Lima, J.A.C.; et al. Impact of iterative reconstruction vs. filtered back projection on image quality in 320-slice CT coronary angiography: Insights from the CORE320 multicenter study. Medicine 2017, 96, e8452. [Google Scholar] [CrossRef]
- Kim, M.; Lee, J.M.; Yoon, J.H.; Son, H.; Choi, J.W.; Han, J.K.; Choi, B.I. Adaptive Iterative Dose Reduction Algorithm in CT: Effect on Image Quality Compared with Filtered Back Projection in Body Phantoms of Different Sizes. Korean J. Radiol. 2014, 15, 195–204. [Google Scholar] [CrossRef]
- Volders, D.; Bols, A.; Haspeslagh, M.; Coenegrachts, K. Model based iterative reconstruction and adaptive statistical iterative reconstruction techniques in abdominal CT: Comparison of image quality in the detection of colorectal liver metastases. Radiology 2013, 269, 469–474. [Google Scholar] [CrossRef]
- Chang, W.; Lee, J.M.; Lee, K.; Yoon, J.H.; Yu, M.H.; Han, J.K.; Choi, B.I. Assessment of a model based, iterative reconstruction algorithm (MBIR) regarding image quality and dose reduction in liver computed tomography. Investig. Radiol. 2013, 48, 598–606. [Google Scholar] [CrossRef]
- Nishizawa, M.; Tanaka, H.; Watanabe, Y.; Kunitomi, Y.; Tsukabe, A.; Tomiyama, N. Model-based iterative reconstruction for detection of subtle hypoattenuation in early cerebral infarction: A phantom study. Jpn. J. Radiol. 2015, 33, 26–32. [Google Scholar] [CrossRef]
- Li, T.; Tang, T.; Yang, L.; Zhang, X.; Li, X.; Luo, C. Coronary CT Angiography with Knowledge-Based Iterative Model Reconstruction for Assessing Coronary Arteries and Non-Calcified Predominant Plaques. Korean J. Radiol. 2019, 20, 729–738. [Google Scholar] [CrossRef]
- Chen, L.; Li, S.; Bai, Q.; Yang, J.; Jiang, S.; Miao, Y. Review of Image Classification Algorithms Based on Convolutional Neural Networks. Remote Sens. 2021, 13, 4712. [Google Scholar] [CrossRef]
- Shan, H.; Padole, A.; Homayounieh, F.; Kruger, U.; Khera, R.D.; Nitiwarangkul, C.; Kalra, M.K.; Wang, G. Competitive performance of a modularized deep neural network compared to commercial algorithms for low-dose CT image reconstruction. Nat. Mach. Intell. 2019, 1, 269–276. [Google Scholar] [CrossRef]
- Brady, S.L.; Trout, A.T.; Somasundaram, E.; Anton, C.G.; Li, Y.; Dillman, J.R. Improving Image Quality and Reducing Radiation Dose for Pediatric CT by Using Deep Learning Reconstruction. Radiology 2021, 298, 180–188. [Google Scholar] [CrossRef]
- Boedeker, K. AiCE Deep Learning Reconstruction: Bringing the power of ultra-high Resolution CT to routine imaging. Canon Med. Syst. 2019. Available online: https://global.medical.canon/publication/ct/2019WP_AiCE_Deep_Learning (accessed on 29 January 2023).
- Wang, M.; Fan, J.; Shi, X.; Qin, L.; Yan, F.; Yang, W. A deep-learning reconstruction algorithm that improves the image quality of low-tube-voltage coronary CT angiography. Eur. J. Radiol. 2022, 146, 110070. [Google Scholar] [CrossRef]
- Abdullah, K.A.; McEntee, M.F.; Reed, W.M.; Kench, P.L. Increasing iterative reconstruction strength at low tube voltage in coronary CT angiography protocols using 3D-printed and Catphan® 500 phantoms. J. Appl. Clin. Med. Phys. 2020, 21, 209–214. [Google Scholar] [CrossRef]
- Nagayama, Y.; Sakabe, D.; Goto, M.; Emoto, T.; Oda, S.; Nakaura, T.; Kidoh, M.; Uetani, H.; Funama, Y.; Hirai, T. Deep learning-based reconstruction for lower-dose pediatric CT: Technical principles, image characteristics, and clinical implementations. RadioGraphics 2021, 41, 1936–1953. [Google Scholar] [CrossRef]
- Tatsugami, F.; Higaki, T.; Nakamura, Y.; Yu, Z.; Zhou, J.; Lu, Y.; Fujioka, C.; Kitagawa, T.; Kihara, Y.; Iida, M.; et al. Deep learning-based image restoration algorithm for coronary CT angiography. Eur. Radiol. 2019, 29, 5322–5329. [Google Scholar] [CrossRef]
- Conte, E.; Mushtaq, S.; Pontone, G.; Li Piani, L.; Ravagnani, P.; Galli, S.; Collet, C.; Sonck, J.; Di Odoardo, L.; Guglielmo, M.; et al. Plaque quantification by coronary computed tomography angiography using intravascular ultrasound as a reference standard: A comparison between standard and last generation computed tomography scanners. Eur. Heart J. Cardiovasc. Imaging 2020, 21, 191–201. [Google Scholar] [CrossRef]
- Otgonbaatar, C.; Ryu, J.K.; Shin, J.; Woo, J.Y.; Seo, J.W.; Shim, H.; Hwang, D.H. Improvement in Image Quality and Visibility of Coronary Arteries, Stents, and Valve Structures on CT Angiography by Deep Learning Reconstruction. Korean J. Radiol. 2022, 23, 1044–1054. [Google Scholar] [CrossRef]
- Lee, J.E.; Park, H.M.; Lim, Y.; Jeong, W.G.; Kim, Y.H. Pathophysiology and Role of Coronary CT Angiography in Stable Angina. J. Korean Soc. Radiol. 2022, 83, 42–53. [Google Scholar] [CrossRef]
Disclaimer/Publisher’s Note: The statements, opinions, and data contained in all publications are solely those of the individual author(s) and contributor(s) and not of MDPI and/or the editor(s). MDPI and/or the editor(s) disclaim responsibility for any injury to people or property resulting from any ideas, methods, instructions, or products referred to in the content. |


| Patient Characteristics | Group A * BMI < 22 | Group B 22 ≤ BMI ≤ 26 | Group C BMI > 26 |
|---|---|---|---|
| No. of Patients | 24 | 31 | 35 |
| No. of Females/Males | 10/14 | 18/13 | 24/11 |
| Age (Years) | 54.80 | 64.41 | 63.53 |
| BMI (kg/m2) | 20.11 | 24.42 | 28.33 |
| Scan Parameters | Scan Conditions |
|---|---|
| Tube voltage (kV) | 100 |
| Tube current (mA) | 400–900 |
| Slice thickness (mm) | 0.5 |
| Pitch | 0.813 |
| Time resolution (s) | 0.135 |
| R–R interval (%) | 70–80 |
| Image matrix | 512 × 512 |
| Reconstruction method | 1 FBP, 2 IR, 3 DLR |
| Plaque Distribution/ Stenosis Severity | 1~25% | 26~50% | 21~75% | 76~100% | p Value |
|---|---|---|---|---|---|
| RCA | 71 | 19 | 7 | 3 | 0.001 |
| LM | 75 | 21 | 5 | 2 | 0.001 |
| LCA | 70 | 18 | 4 | 1 | 0.001 |
| LCX | 76 | 11 | 3 | 0 | 0.001 |
| Calcium Score | 0 (Absent) | 1~100 (Discrete) | 100~400 (Moderate) | 401 or Higher (Accentuated) | p Value |
|---|---|---|---|---|---|
| RCA | 48 | 29 | 10 | 3 | 0.001 |
| LM | 43 | 30 | 15 | 2 | 0.001 |
| LCA | 52 | 28 | 16 | 4 | 0.001 |
| LCX | 60 | 21 | 8 | 1 | 0.001 |
| Score | Overall Image Quality | Image Noise | Proximal Vessel |
|---|---|---|---|
| 5 | Excellent | Minimal | High vessel attenuation and clear vessel wall |
| 4 | Good | Average | Good vessel attenuation and well preserved vessel wall |
| 3 | Moderate | Moderate | Adequate vessel attenuation and moderate vessel wall |
| 2 | Poor | Marked | Low vessel attenuation and blurring of vessel wall |
| 1 | Bad | Severe | Inadequate vessel attenuation and poor vessel wall |
| Dose Parameters | Group A BMI < 22 | Group B 22 < BMI < 26 | Group C 26 < BMI | p Value |
|---|---|---|---|---|
| CTDIvol (mGy) | 16.38 | 18.2 | 34.8 | 0.001 |
| DLP (mGy*cm) | 273.4 | 338.1 | 446.8 | 0.001 |
| Effective dose (mSv) | 4.6 | 5.8 | 7.6 | 0.001 |
| Overall Image Quality | Image Noise | Proximal Vessels | |
|---|---|---|---|
| FBP | 3.6 ± 0.6 | 3.5 ± 0.6 | 3.8 ± 0.5 |
| IR | 4.3 ± 0.5 | 4.3 ± 0.6 | 4.3 ± 0.5 |
| DLR | 4.8 ± 0.4 | 4.8 ± 0.4 | 4.9 ± 0.4 |
| p value | 0.001 | 0.001 | 0.001 |
Disclaimer/Publisher’s Note: The statements, opinions and data contained in all publications are solely those of the individual author(s) and contributor(s) and not of MDPI and/or the editor(s). MDPI and/or the editor(s) disclaim responsibility for any injury to people or property resulting from any ideas, methods, instructions or products referred to in the content. |
© 2023 by the authors. Licensee MDPI, Basel, Switzerland. This article is an open access article distributed under the terms and conditions of the Creative Commons Attribution (CC BY) license (https://creativecommons.org/licenses/by/4.0/).
Share and Cite
Jeon, P.-H.; Jeon, S.-H.; Ko, D.; An, G.; Shim, H.; Otgonbaatar, C.; Son, K.; Kim, D.; Ko, S.M.; Chung, M.-A. Assessment of Image Quality of Coronary CT Angiography Using Deep Learning-Based CT Reconstruction: Phantom and Patient Studies. Diagnostics 2023, 13, 1862. https://doi.org/10.3390/diagnostics13111862
Jeon P-H, Jeon S-H, Ko D, An G, Shim H, Otgonbaatar C, Son K, Kim D, Ko SM, Chung M-A. Assessment of Image Quality of Coronary CT Angiography Using Deep Learning-Based CT Reconstruction: Phantom and Patient Studies. Diagnostics. 2023; 13(11):1862. https://doi.org/10.3390/diagnostics13111862
Chicago/Turabian StyleJeon, Pil-Hyun, Sang-Hyun Jeon, Donghee Ko, Giyong An, Hackjoon Shim, Chuluunbaatar Otgonbaatar, Kihong Son, Daehong Kim, Sung Min Ko, and Myung-Ae Chung. 2023. "Assessment of Image Quality of Coronary CT Angiography Using Deep Learning-Based CT Reconstruction: Phantom and Patient Studies" Diagnostics 13, no. 11: 1862. https://doi.org/10.3390/diagnostics13111862