1. Introduction
The natural visual world is autocorrelated: objects do not spontaneously pop into or out of existence in the typical visual experience, and what was present a moment ago tends to still be present at this moment. The human visual system has developed adaptive mechanisms that take advantage of these natural autocorrelations by introducing serial dependence in perceptual interpretations. Due to this mechanism, objects recognized at one moment appear more like similar objects seen in the last several seconds. The result of this serial dependence is that perceptual experience seems smoother and more stable than it should be. This is beneficial because without it, the visual world would look jittery and unstable; object identities would appear to fluctuate due to changes in lighting, viewpoint, blinks, and myriad sources of internal and external noise [
1,
2].
It is intuitive that human vision benefits from recycling visual history, smoothing and stabilizing perceptual experience in the natural world. However, the benefit of serial dependence has limits because the visual world is not always natural. In certain artificial, human-designed visual tasks, such as medical image perception or randomized laboratory experiments, visual stimuli are no longer naturally autocorrelated. Visual images in these situations can vary randomly from one moment to the next. If the visual system imposes serial dependence, smoothing or reusing previous visual history, this could introduce systematic errors by attracting current perception towards previous visual history.
Studies have shown that this is exactly what happens. Serial dependence systematically biases current perception toward visual history in many tasks, such as perception of orientation [
1], attractiveness [
3,
4], and emotional expression [
5]. Serial dependence also introduces systematic perceptual errors in medical image perception tasks [
6]. However, these studies were conducted under lab conditions with highly artificial stimuli and experimental designs that are not typical in clinical practice [
6]. More recently, progress in Generative Adversarial Networks (GANs) affords the opportunity to generate more realistic simulated medical images as stimuli [
7,
8]. However, even in these studies, the relatively complex psychophysical tasks were not comparable to realistic, clinically relevant scenarios.
In this study, we address several of the shortcomings in prior work and we test whether serial dependence occurs in a teledermatology setting, one of the most important and commonly employed subsets of telemedicine [
9,
10]. Remote store-and-forward teledermatology, which involves sequential judgments of static images, is an especially fast growing area of telemedicine [
11,
12,
13,
14], and it requires the involvement of clinicians because automated systems are not sufficient to make accurate diagnostic classifications [
15,
16,
17]. The question in the present study is whether sequential judgments of dermatological lesions in a remote store-and-forward setting result in serial dependence.
We analyzed 758,139 skin cancer diagnostic judgments from 1137 participants collected from an app developed by Centaur Labs, a US medical Artificial Intelligence (AI) company based in Boston. The task was a straightforward 2AFC (two-alternative forced choice) (yes/no) discrimination, with a goal of diagnosing whether an actual skin cancer image was nevus (benign) or melanoma (malignant). This is comparable to a realistic, remote store-and-forward teledermatology task, with a more natural two-alternative forced choice (yes/no) design.
We found that there was statistically significant serial dependence in discrimination judgments that was tuned to the sequential similarity in the malignancy of the lesions. The consequence of the serial dependence was a statistically significant reduction in metrics of sensitivity and specificity, including reduced d-prime (d′) and increased error rates. Additionally, using a recent Learned Perceptual Image Patch Similarity (LPIPS) computer vision model, we quantified serial dependence as a function of the semantic similarity between sequential images and found that serial dependence varied as a function of the patchwise similarity between sequential images.
Together, our results suggest that serial dependence in perceptual decisions may impact realistic dermatological judgments, at least under certain circumstances akin to those in remote store-and-forward teledermatology [
18,
19].
2. Materials and Methods
2.1. Experiment Stimuli
All skin cancer images utilized in the trials on the app were subsampled from ISIC 2019 Challenge Datasets [
20,
21,
22]. This set of images contains two types of lesion, i.e., nevus and melanoma, indicating benign and malignant cases. The images were dermoscopy images after manual correction of color hue, luminance, and alignment and were taken by different devices using polarized and non-polarized dermatoscopy. Samples of skin cancer image stimuli are shown in
Figure 1. In summary, for all the skin cancer images that were shown, 57.3% were benign and 42.7% were malignant.
2.2. Participants
The users of the app are predominantly medical students, with some medical residents. Individual participant information such as age, sex, and demographics that are typically gathered in scientific experiments are not known for this group of observers because this information is saved in the user profile of the app and was not available to us. However, it is known that all users had normal or corrected-to-normal vision. Since the use of the app does not work outside of the United States, users must be located in the U.S. at the time of app usage. Before using the app, users gave consent to have Centaur Labs use the data they provide through app usage. Users received earnings from a predefined money pool (around US$ 50) for each task they participated in.
2.3. Experiment Design
For the dermatological classification task that was investigated in this study, users first completed a training session of 10 trials with 10 separate stimuli. This training explained the procedure of the task and prepared users for the actual classification task, which was identical to the training.
In each trial, a random skin cancer image was selected and presented to the participant. Below the image, they were prompted to choose one of the two possible responses, “benign” or “malignant”. Feedback was provided after every trial to inform users if their response was correct or incorrect. Afterward, users voluntarily moved on to the next trial at their own pace. Users were told they could end the task at any time.
We were provided with 758,139 data points across 13 variables, which were collected between 4 September 2020 and 21 June 2021. Each data point corresponded to one decision of a user, classifying a dermatological image as either benign or malignant. After pre-processing, 756,001 data points from 1137 users were used for further analyses (pre-processing steps and exclusion criteria are illustrated in
Appendix A).
2.4. Serial Dependence
Serial Dependence has three main kinds of tuning. First, feature tuning: serial dependence occurs most strongly between relatively similar features and not between identical ones or highly dissimilar ones [
1,
23]. For example, when two identical images are seen in succession, serial dependence does not bias judgments in any direction because the images are identical; likewise, if the two successive images are extremely different from each other (e.g., apples and oranges), then serial dependence does not bias judgments either. Only when two successive images are moderately similar is there a serial dependence in perceptual judgments. Serial dependence is also temporally tuned: the magnitude of serial dependence gradually decays over time or with intervening visual information [
1,
24]. Third, spatial tuning: serial dependence occurs only within a limited spatial region, and it is strongest when previous and current objects are presented at the same location [
1,
25]. In general, we can utilize feature and temporal tuning as the most important metrics to probe the serial dependence effect and to rule out other artifacts, such as simply repeating the same response or lapsing.
To measure the presence of feature tuning, we measured serial dependence as a function of the similarity in sequential stimuli. In this study, we adopt two metrics of similarity. One is malignancy similarity, where malignancy is estimated based on a popularity vote. The “similarity” in this respect is an abstracted concept based on behavioral judgments of independent observers. What counts as similar is not necessarily in the image or pixel domain but in the degree of malignancy (
Figure 2). The second form of “similarity” that we quantified is semantic similarity, using a popular Learned Perceptual Image Patch Similarity (LPIPS) metric [
26] approach borrowed from computer vision.
2.5. Malignancy Similarity
The malignancy of each stimulus was estimated based on a popularity vote: −100 means all users classified the lesion as benign; 100 means all users classified the lesion as malignant.
Figure 2 shows the distribution of malignancy over all stimuli. “Malignancy similarity,” used in subsequent analyses of serial dependence, was computed as the malignancy difference between any two sequential stimuli. Any two adjacent stimuli on the abscissa of
Figure 2 have high similarity; conversely, any two distantly separated stimuli have low similarity.
2.6. Semantic Similarity
The semantic similarity is computed via the Learned Perceptual Image Patch Similarity (LPIPS) metric [
26]. This is a popular nonlinear similarity metric utilized in computer vision. For deep learning models, there are deep features after each convolutional layer [
27,
28,
29]. The semantic similarity is computed as a sum of weighted differences between the corresponding deep features at different layers. If the semantic similarity is small, two images would share more patch-wise similarity in the pixel domain, with 0 representing identical. In particular, we utilized AlexNet [
27] as the backbone of the LPIPS metric.
Figure 3 shows two groups of similar and dissimilar skin cancer images based on LPIPS metric. A similar pair is defined as a pair of images whose similarity is less than the mean similarity of all image pairs, and vice versa.
2.7. Diagnostic Performance Evaluation
To measure the presence of serial dependence, we analyzed users’ performance in the dermatological classification task. Multiple metrics from signal detection theory were utilized, including
,
, and
, where “Positive” (P) represents the malignant case, and “Negative” (N) represents the benign case. Then, TP (True Positive), FN (False Negative), FP (False Positive), and TN (True Negative) can be defined accordingly. We also utilized d-prime (
) and the criterion (c) to evaluate observers’ discrimination and bias. These can be computed as follows:
where
is the inverse cumulative distribution function of the standard normal distribution, and
.
2.8. Feature Tuning Analysis
We evaluated the diagnostic performance metrics described above while taking into account the sequential similarity between successive images that each observer saw. There were two types of similarity that we evaluated. In the first one, the malignancy similarity, we computed the n-back similarity as , where represents the malignancy of the current trial image and represents the malignancy of the n-back trial image. We used the absolute value of the difference because the sign of the malignancy does not matter. Then, we grouped the malignancy similarities with a group range of 10, resulting in a total of 20 similarity groups. Performance metrics were computed within each group. In the end, we obtained the sensitivity, specificity, d′, c, and error rate in relation to the n-back malignancy similarity.
The n-back semantic similarity can be obtained directly from the LPIPS metric [
26],
, where
represents the current trial image,
represents the n-back trial image, and
is the LPIPS model. Then, the semantic similarities were grouped with a group range of 0.02, with groups that have insufficient trials excluded. We analyzed groups in the semantic similarity range of
. Performance metrics were also computed within each group. In the end, we obtained the performance metrics in relation to the n-back semantic similarity.
In order to probe the impact of serial dependence on diagnostic performance, we measured the net change of those metrics relative to what is expected by chance. To conservatively estimate this “chance” baseline, we used the future trial (N + 1) stimulus because this stimulus is not predictable and cannot influence the past. Essentially, because the stimuli are randomly ordered, the current response is only predictive of the future stimulus about half of the time, which gives a baseline estimate of chance performance. If the current judgment is pulled toward the previous stimulus (serial dependence), then the current trial accuracy will decrease relative to that chance performance. By using the future (N + 1) accuracy as a baseline, we control for any systematic response biases that observers might have [
30,
31]. For example, simply pressing the same button on every trial results in a response bias, but this will not show up as measured serial dependence because the serial dependence is normalized relative to the N + 1 trial.
Finally, we computed the net change in sensitivity, specificity, d′, criterion, and error rate as a function of the sequential similarity between successive images. As serial dependence only occurs for relatively similar features, we expected the serial dependence effect, if present, to be maximal when sequential stimuli are moderately similar.
2.9. Temporal Tuning Analysis
After checking the feature tuning characteristics, we fit Gaussian curves (Equation (
1)) on top of the net change graphs to quantify the magnitude of the serial dependence effect (as shown in
Section 3).
where
x is the data variable,
and
are the mean and standard deviation of the Gaussian distribution, and
a is an amplitude modulation parameter. Here,
a,
, and
will be optimized during curve fitting. After fitting, we report the peak value of the fitted Gaussian curve as the amplitude of the serial dependence effect.
We analyzed the serial dependence effect magnitude of 1-back (N-1), 2-back (N-2), 3-back (N-3), and 4-back (N-4) trials. Then, we obtained the relation between the serial dependence effect magnitude and intervening time between trials.
3. Results
Overall summary statistics revealed that observers were highly sensitive to the malignancy discrimination task. Across the user population, sensitivity was , specificity was , d′ was , c was , and the error rate was . These metrics indicate that observers were able to perform the dermatological judgment task, consistent with the observers having some degree of expertise. These overall metrics, however, do not reveal whether dermatological judgments on a given image are impacted by sequential dependencies.
Our primary goal was to measure whether serial dependence was present in dermatological judgments. To do this, we calculated the performance metrics above on a trial-wise basis, as a function of the sequential similarity between successive images, as illustrated in
Section 2.8.
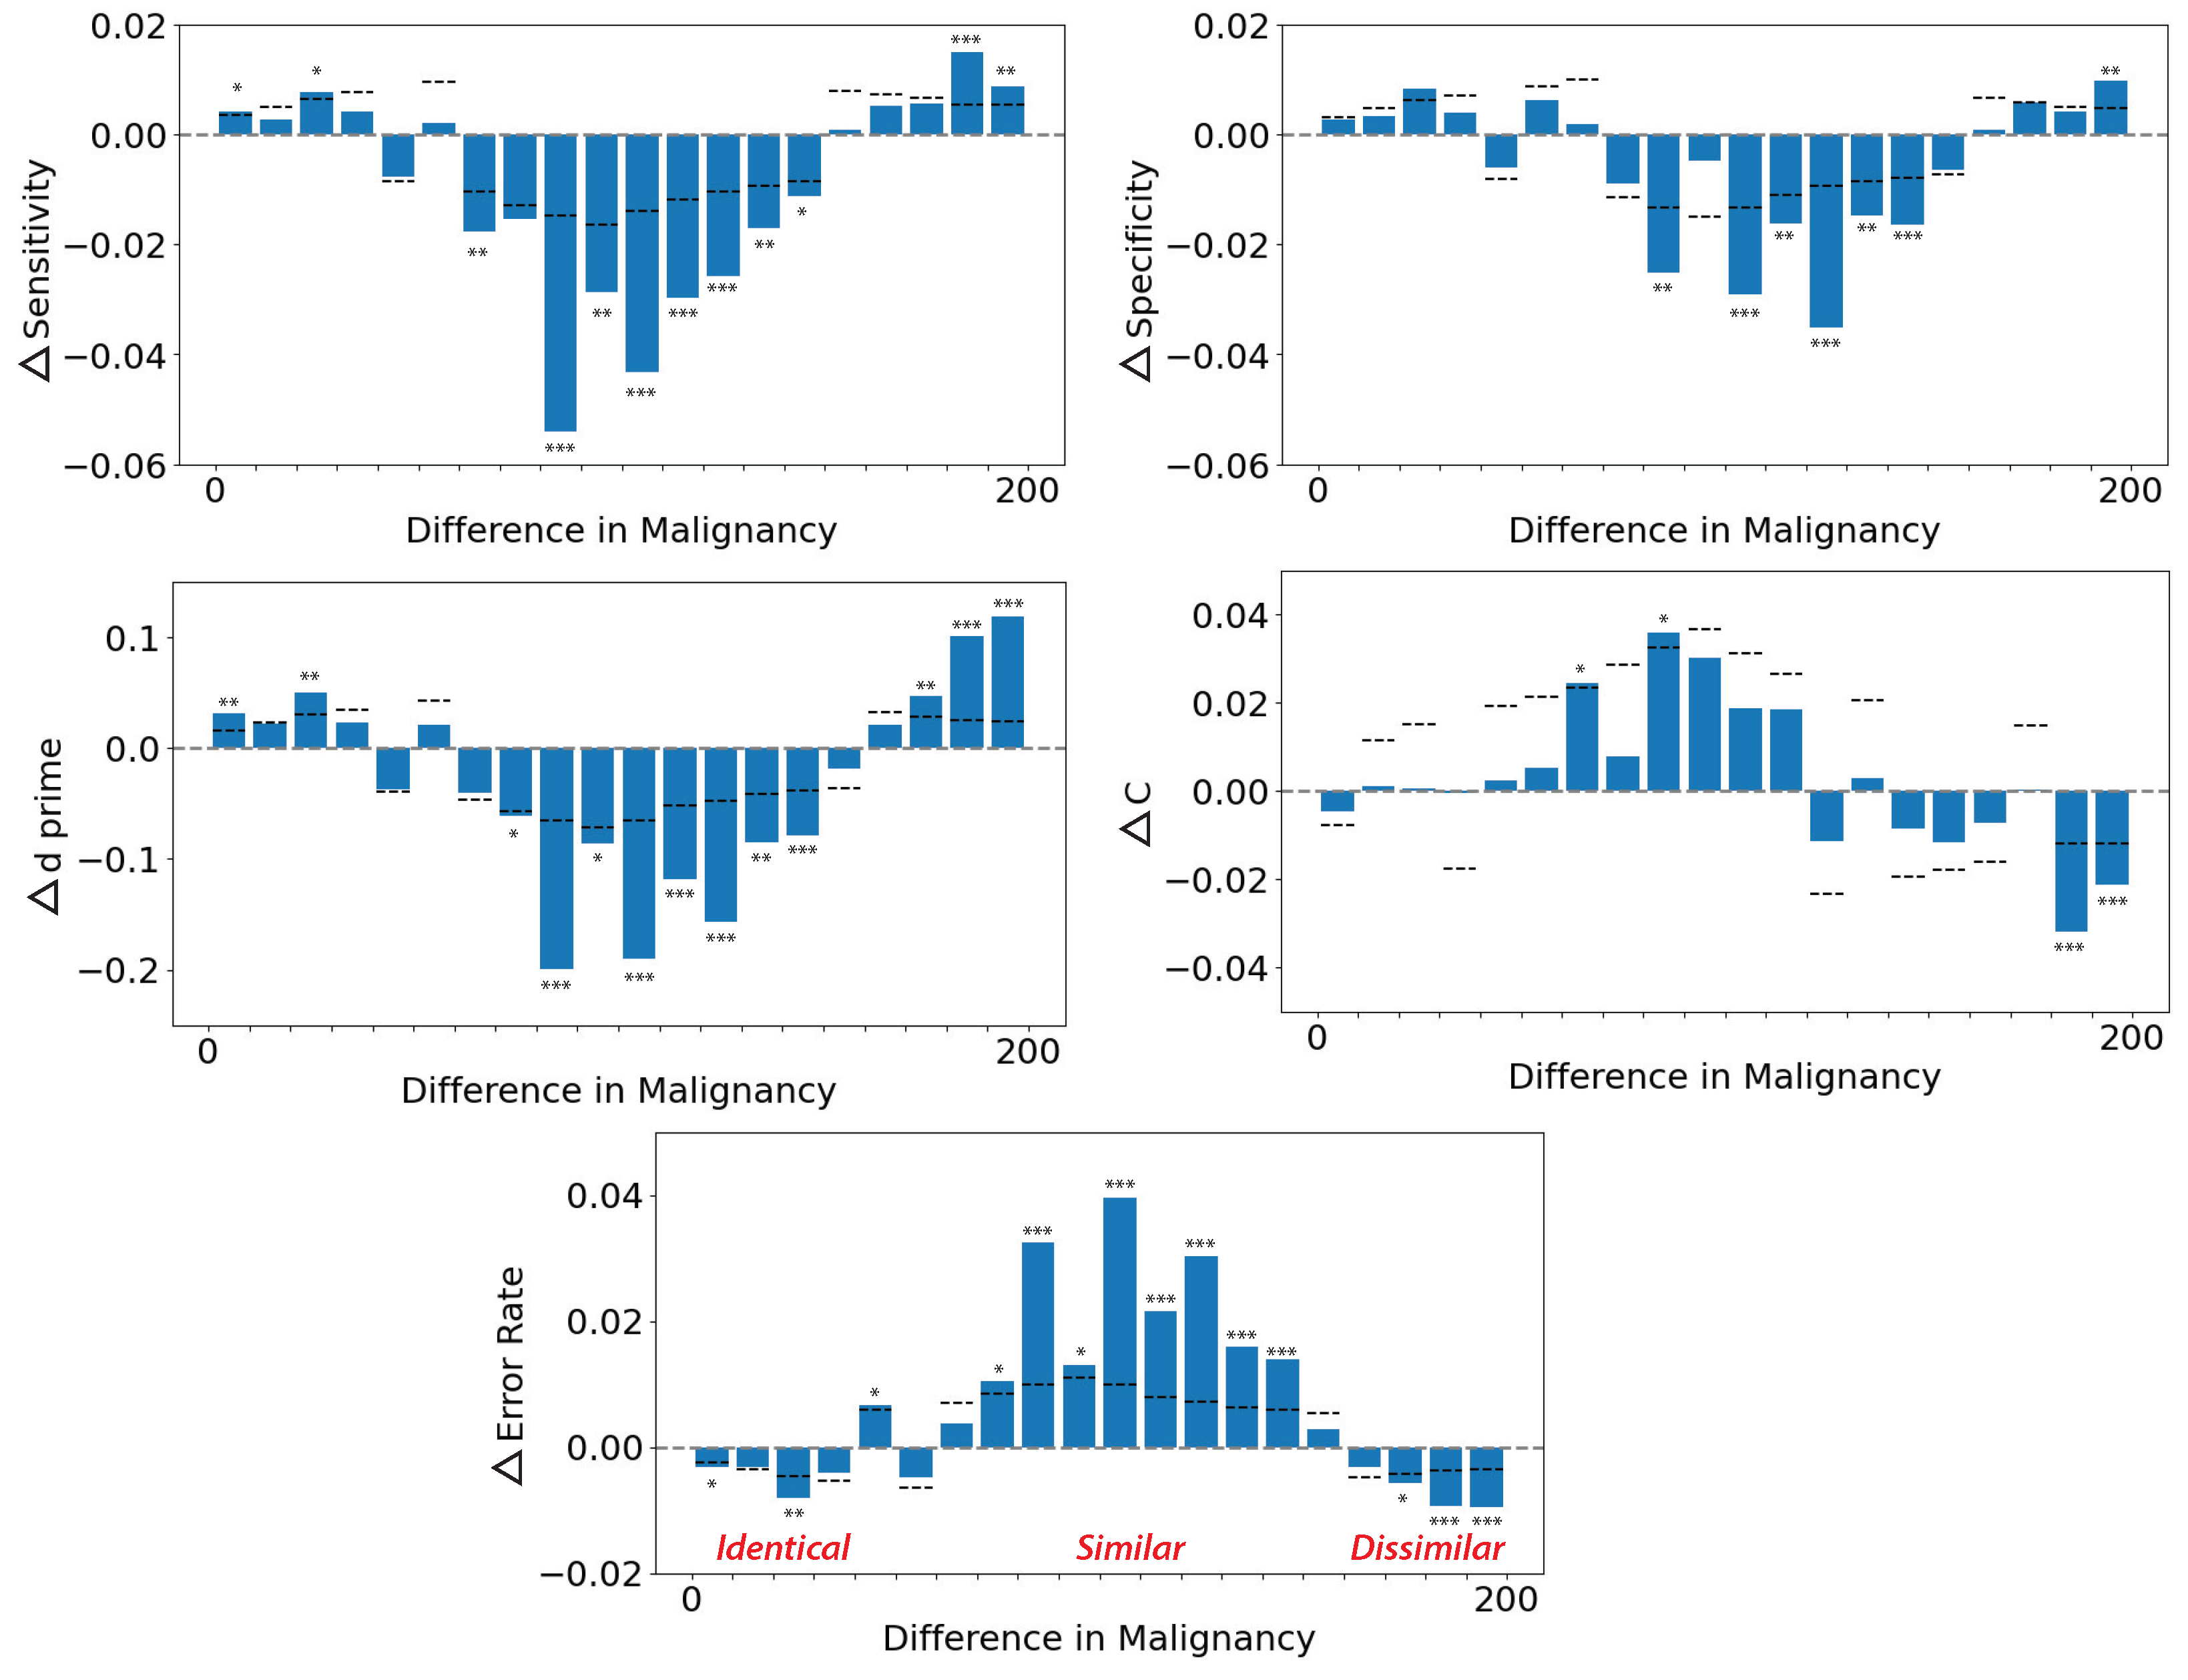
Figure 4 shows the net change in sensitivity, specificity, d′, criterion (c), and error rate as a function of the malignancy similarity between current and previous images (1-back or N-1 trial image). The abscissa of each graph shows the similarity in the rated malignancy (
Figure 2) of successive pairs of images; 0 represents identical successive images, 200 represents very different sequential images, and the middle range represents similar images. When the previous stimulus was moderately similar (central regions on the abscissa), all performance metrics dropped, indicating worse performance. The worst case occurred when the uncertainty reached the maximum. This is consistent with the findings in previous studies [
1,
6]. In summary, sensitivity decreased up to
on the current trial, specificity was decreased up to
on the current trial, d′ was decreased up to
on the current trial, criterion (c) was biased up to
on the current trial, and the error rate was increased up to
on the current trial. Horizontal dashed lines indicate the upper
boundary of the permuted null distribution for each bar. Asterisks indicate statistical significance (
).
As the semantic similarity via the LPIPS metric is nonlinear, we clustered the performance metrics within small groups into two super-groups, i.e., groups of similar and dissimilar images. The 1-back (N-1) net change in performance for similar and dissimilar sequential images is shown in
Figure 5. When similar sequential images were viewed by participants (“similar” on the abscissa), participants had higher error rates, lower specificity, and biased criterion. In particular, the net change in the error rate from similar to dissimilar groups was up to
, the net change in the specificity from similar to dissimilar groups was up to
, and the net change in the criterion from similar to dissimilar groups was up to
. The was not a significant change in d′ or sensitivity between similar and dissimilar groups. Overall, there was a negative impact of serial dependence on performance measured by most metrics, including, crucially, the error rate.
After analyzing 1-back (N-1) serial dependence via malignancy similarity, we conducted the same analysis for 2-back (N-2), 3-back (N-3), and 4-back (N-4) trials. Then, Gaussian curves (as described in Equation (
1)) were fitted onto the intermediate results of feature tuning as shown in
Figure 6A,B. The amplitude was taken as a measure of the impact of serial dependence on error rates and d′. As shown in
Figure 6C, the amplitude of the Gaussian was the strongest for the N-1 stimulus and weaker for the following N-2, N-3, and N-4 stimuli, indicating that serial dependence is temporally tuned—stronger for more recent similar stimuli. In particular, the serial dependence (SD) amplitude for error rates decreased from
to
, and the SD amplitude for d′ decreased from
to
.
4. Discussion
The goal of this study was to test if there is serial dependence in the perceptual judgments of real skin lesions in a relatively realistic situation akin to remote store-and-forward teledermatology [
11,
13,
32,
33]. We found that there was significant serial dependence in observer judgments of malignancy, and this effect was tuned to the similarity in the sequential images. Moreover, the effects were temporally tuned, strongest for more recent similar stimuli, consistent with the diagnostic criteria of serial dependence.
Serial dependence is a specific process in which the brain smooths perceptual interpretations over time to improve efficiency and accuracy and stabilizes the appearance of the natural world [
1,
2]. Serial dependence has been found in many perceptual tasks ranging from low-level [
34] to high-level cognition [
35]. It has also been reported in some clinically relevant domains but with less realistic stimuli and tasks [
6]. Serial dependence is not a generalized repetition of responses, and it is not just lapsing, central tendency biases, or other artitfacts [
1,
2,
31].
The serial dependence effect we found here is not due to artifacts such as lapsing, central tendency, repeated button presses, or perseverating on the same response. Those kinds of artifacts are problematic, and they can have a serious detrimental influence on dermatological judgments, but they are not serial dependence, per se. As in previous studies [
1,
23,
31], here, we dissociated serial dependence from these other artifacts using three approaches. First, we confirmed that the measured serial dependence effect here was tuned to the sequential similarity between images. A perseverating or stereotyped response (e.g., pressing the same button over and over again for any number of reasons) does not result in biases that are tuned to the similarity between sequential images. Instead, it simply results in a uniform and stable shift in criterion. Second, we dissociated serial dependence from lapsing, stereotyping, and other artifacts by controlling for any biases that seem to depend on the future. Serial dependence is mainly a bias of the current perceptual decision toward past experience. The future stimulus is unpredictable and random, and therefore cannot influence the current decision. However, if there are stereotyped responses (e.g., simply repeating the same button press or central tendency biases), this will result in what seems like the future being predictive of the present. By subtracting out this future bias, we isolated the 1-trial back effect. This approach—measuring and controlling artifacts by using the future—is a common control in studies of serial dependence [
6,
8,
30,
31]. Finally, in a third control, we created permuted and shuffled null distributions. These control for overall biases, lapsing, and stereotyped responses among other potential artifacts as well. All of these controls together demonstrate that serial dependence genuinely impacted performance in dermatology judgments.
Previous studies have tried to measure criterion and d′ in dermatological judgments over time [
36,
37,
38], but they did not examine trial-wise effects. Serial dependence is a trial-by-trial effect [
1,
2,
6,
8]: sometimes it happens in random sequences (when sequential stimuli are coincidentally similar) and sometimes it does not happen (when sequential stimuli happen to be different). In typical vision science experiments, stimuli are random and their sequential similarity is not measured, considered, or controlled. Serial dependence will therefore not show up in typical analyses because (1) responses are pooled or collapsed across blocks of trials and (2) sequential similarity is unknown or ignored. So, it is not surprising that serial dependence was not found in a previous study [
39] because that study did not measure sequential stimulus similarity and it pooled trials together in blocks, washing out any serial dependence that may have been present. The results of the large data set here confirm that serial dependence is likely to be present in other similar data sets, such as [
39]. Serial dependence does not show up in simple signal detection metrics such as d′ and criterion unless one takes into account the trial-wise nature of the effect. Serial dependence is not just a shift in the criterion, and it is not just a change in d′. It can result in both shifts in criterion and d′, as we found here, but these are dynamic over time–they fluctuate from trial to trial. We were able to measure changes in SDT (Signal Detection Theory) metrics including d′ and criterion because we analyzed the data in a trial-wise manner and, more importantly, conditioned the analysis on the sequential similarity between stimuli. We found that d′ decreases for similar (non-identical) stimuli. However, if the stimuli are nearly identical or are very different, then there is no decrease in d′. Likewise, we found that criterion changed depending on the sequential similarity between successive stimuli. Both of these results are important: they indicate that standard SDT metrics including d′ and criterion should not be treated as rigid and fixed over time but should be considered as dynamic features that can reflect the fluctuations of stimuli in the world. Future studies of clinician perception and performance should consider the dynamic nature of signal detection metrics.
Serial dependence is a phenomenon that has been observed in many domains, from low-level perception to high-level cognition [
1,
2,
34,
35,
40]. An outstanding question in the literature on the basic mechanisms of serial dependence is whether feedback might modulate it. For example, one might speculate that trial-wise feedback could reduce or eliminate serial dependence. The results here speak to this question because observers did receive feedback during the task. Despite that feedback, there was still a significant serial dependence that was tuned to both feature similarity and time. This suggests that feedback (even where it is possible) is not a panacea to eliminate serial dependence. Pragmatically, of course, feedback is not possible in clinically relevant settings because there is no prior ground truth in medical image perception. Nevertheless, it is theoretically and practically valuable to know that feedback is not enough to overcome the visual system’s built-in smoothing operations that cause serial dependence.
There are several limitations in this study. First, this study only investigated one source of perceptual bias–serial dependence. Of course, there are other sources of bias, individual observer differences, attentional differences, lapsing, and myriad other sources of error. We controlled these because our goal was to isolate one particular operationally defined source of perceptual bias: serial dependence. Whether there are interactions among serial dependence and other types of perceptual bias is an open question for future research. A second limitation of this study is that the skin cancer images utilized in the experiment contained only two types of lesion, i.e., nevus (benign) and melanoma (malignant). Though the dermatological classification task is similar to realistic skin cancer diagnostic scenarios in some teledermatology settings, it does not fully capture the range or variety of various skin cancer disease types. Moreover, for the images presented to participants, were benign and were malignant. This deviates from a realistic distribution, where malignant cases are typically much rarer than benign cases. That said, serial dependence does not hinge on the rate of malignancy—it impacts d′ independent of target frequency, and it is, therefore, likely to occur even for rare target situations. However, the issue of disease prevalence remains a very important and open question for future research.
Another limitation is that this study is restricted to store-and-forward teledermatology, which is naturally different from office-based dermatology clinics in several ways, such as available resources and diagnostic procedures. For example, office-based clinicians have multi-modal information about the lesion available, not just photographs, and clinical decisions are more complex than binary ones as in our study. However, during the COVID-19 pandemic, we witnessed a rapid shift from office-based dermatology clinics into teledermatology [
41,
42]. In line with these recent developments, the teledermatology market size is forecasted to be
$67.43 billion in 2030 [
43,
44]. Accordingly, we chose to investigate remote store-and-forward teledermatology, as it is a highly scalable and increasingly employed form of telemedicine. Finally, it is important to mention that most participants recruited in this study were medical students rather than experts. However, clinicians are not always more accurate than medical students or residents [
39]. The reasons for this difference in performance might be the recency of training, attention, or other factors. The simple assumption that trained (older) clinicians are better than less trained (younger) ones is not clear for remote store-and-forward teledermatology, in particular. Future research is needed to explore how expertise might interact with remote teledermatology [
39].
There are several additional important avenues of future investigation. Future work should test whether the serial dependence found here is spatially tuned. For example, if sequential images were viewed on different screens (rather than a single mobile device), would there be a reduction in serial dependence? Moreover, how does attention to the task modulate the serial dependence in dermatological judgments? Future studies should address these questions, along with designs that incorporate a larger variety of lesions and a more realistic distribution of malignancy. Finally, future studies should also focus on how to utilize serial dependence tuning functions, i.e., feature tuning and temporal tuning that we found here to potentially alleviate the biases reported here.


