
An Automatic Premature Ventricular Contraction Recognition System Based on Imbalanced Dataset and Pre-Trained Residual Network Using Transfer Learning on ECG Signal

 ,
,  , , , , , ,
Abstract
:1. Introduction
- Identify PVCs of unknown patients using patient-specific classification strategy.
- In most cases, the proposed method suppresses the performance of state-of-the-art methods on imbalanced datasets.
2. Methods & Materials
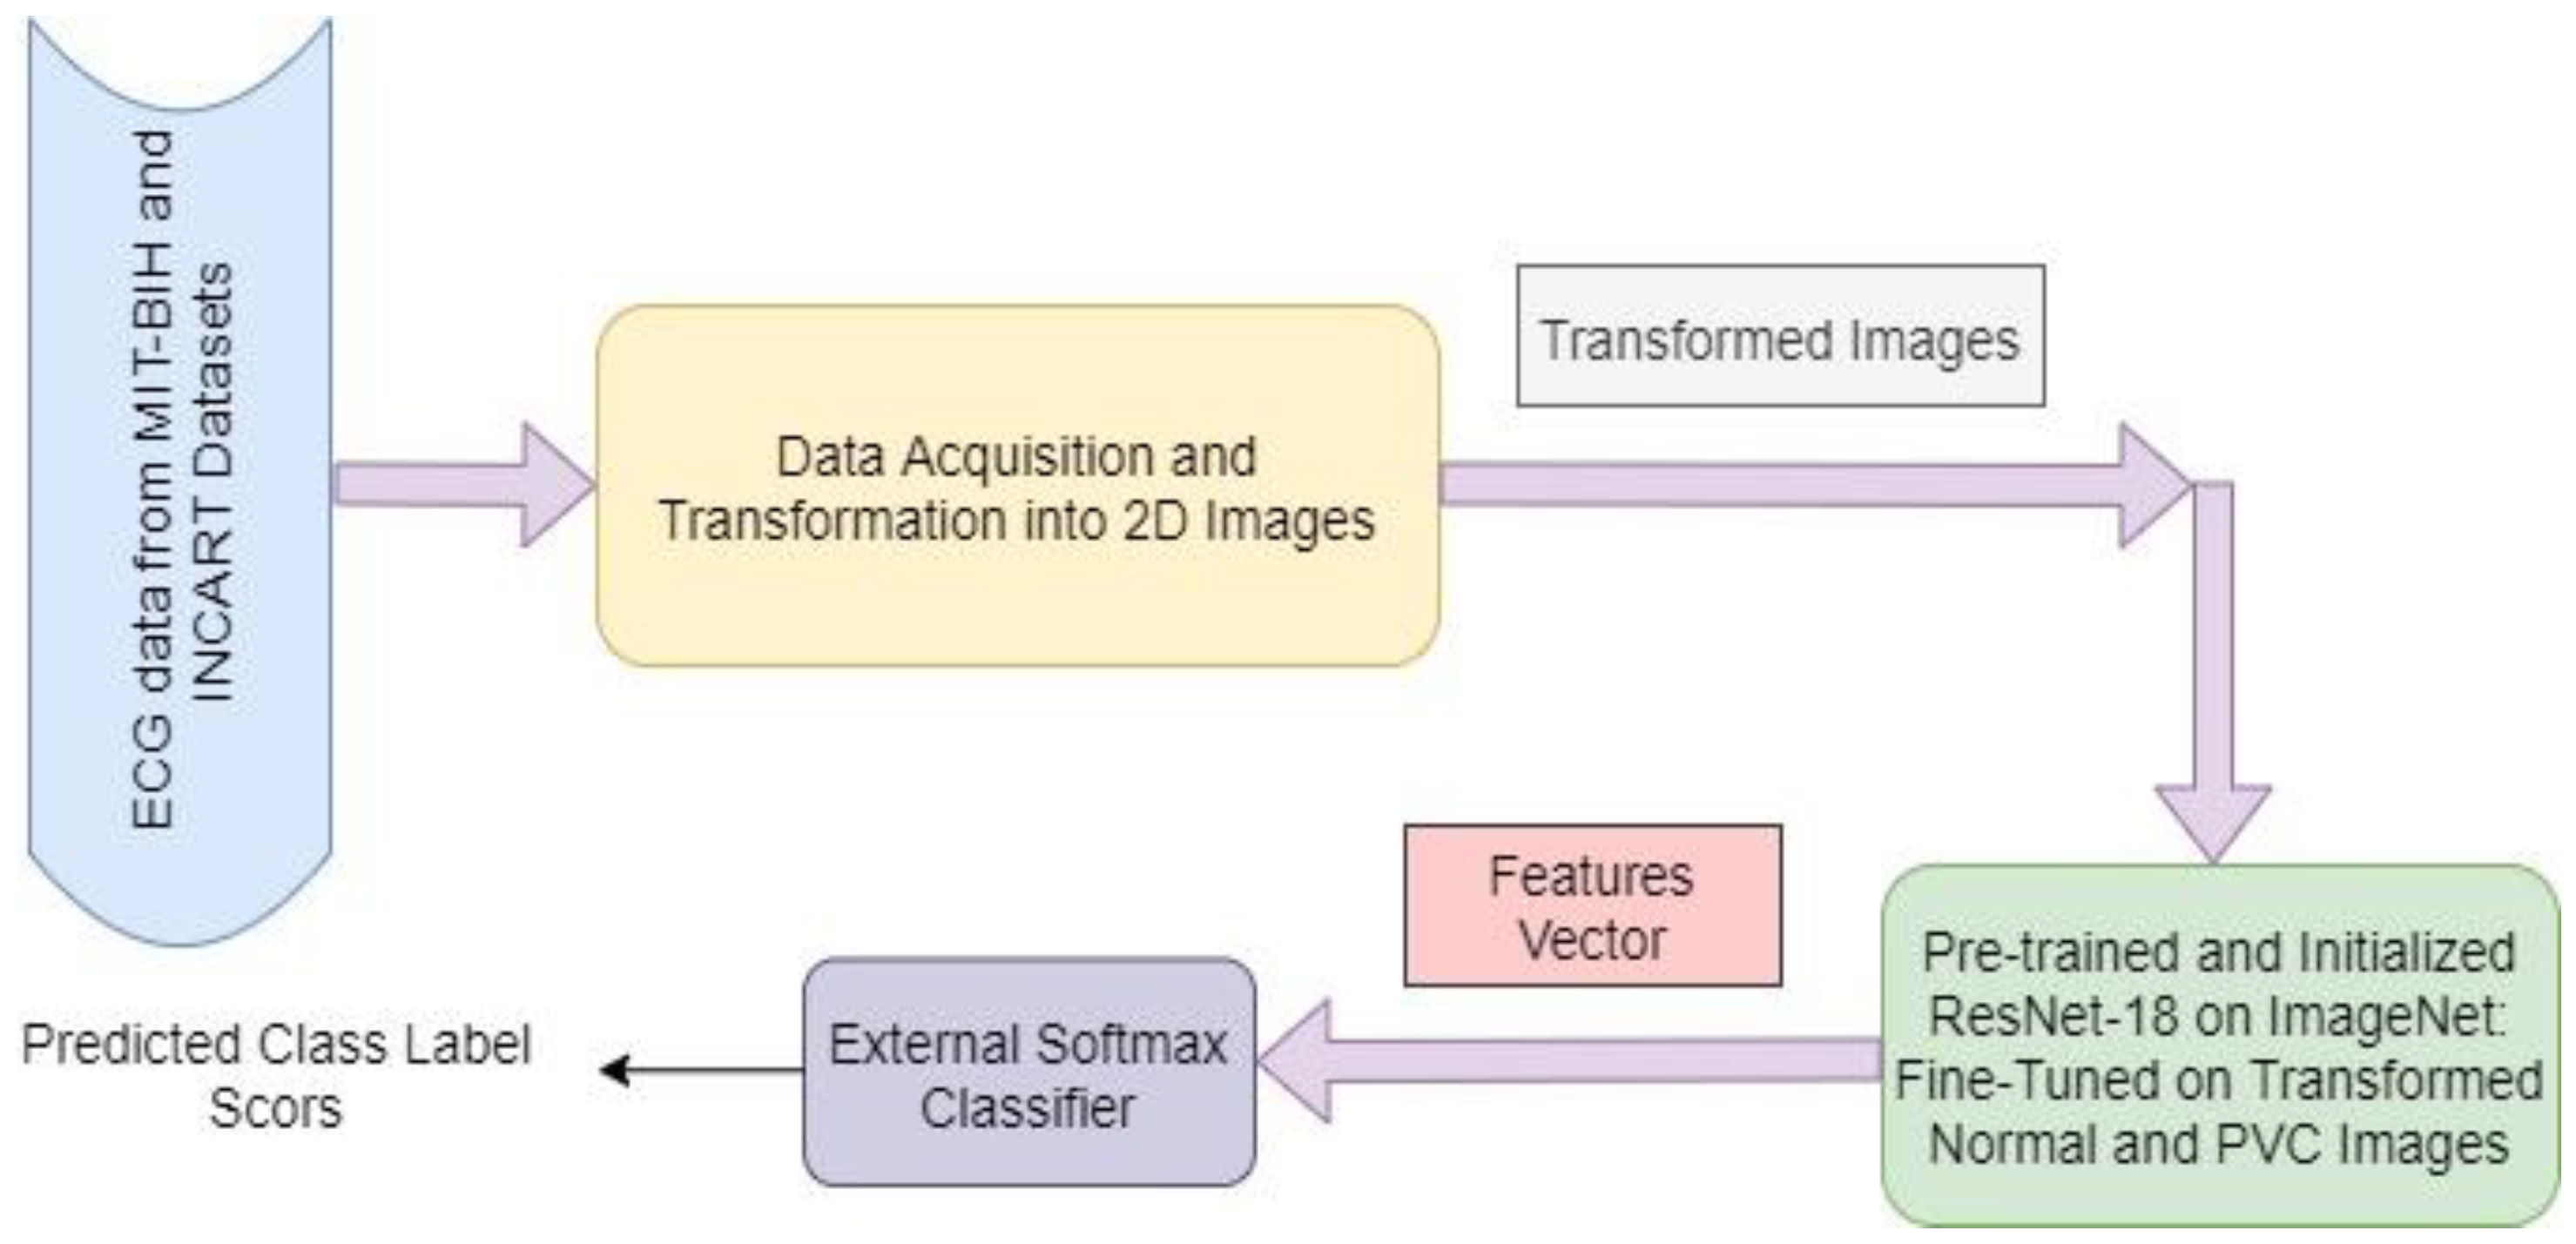
2.1. Method Overview
2.2. Dataset Details and Data Collection
2.3. Data Pre-Processing
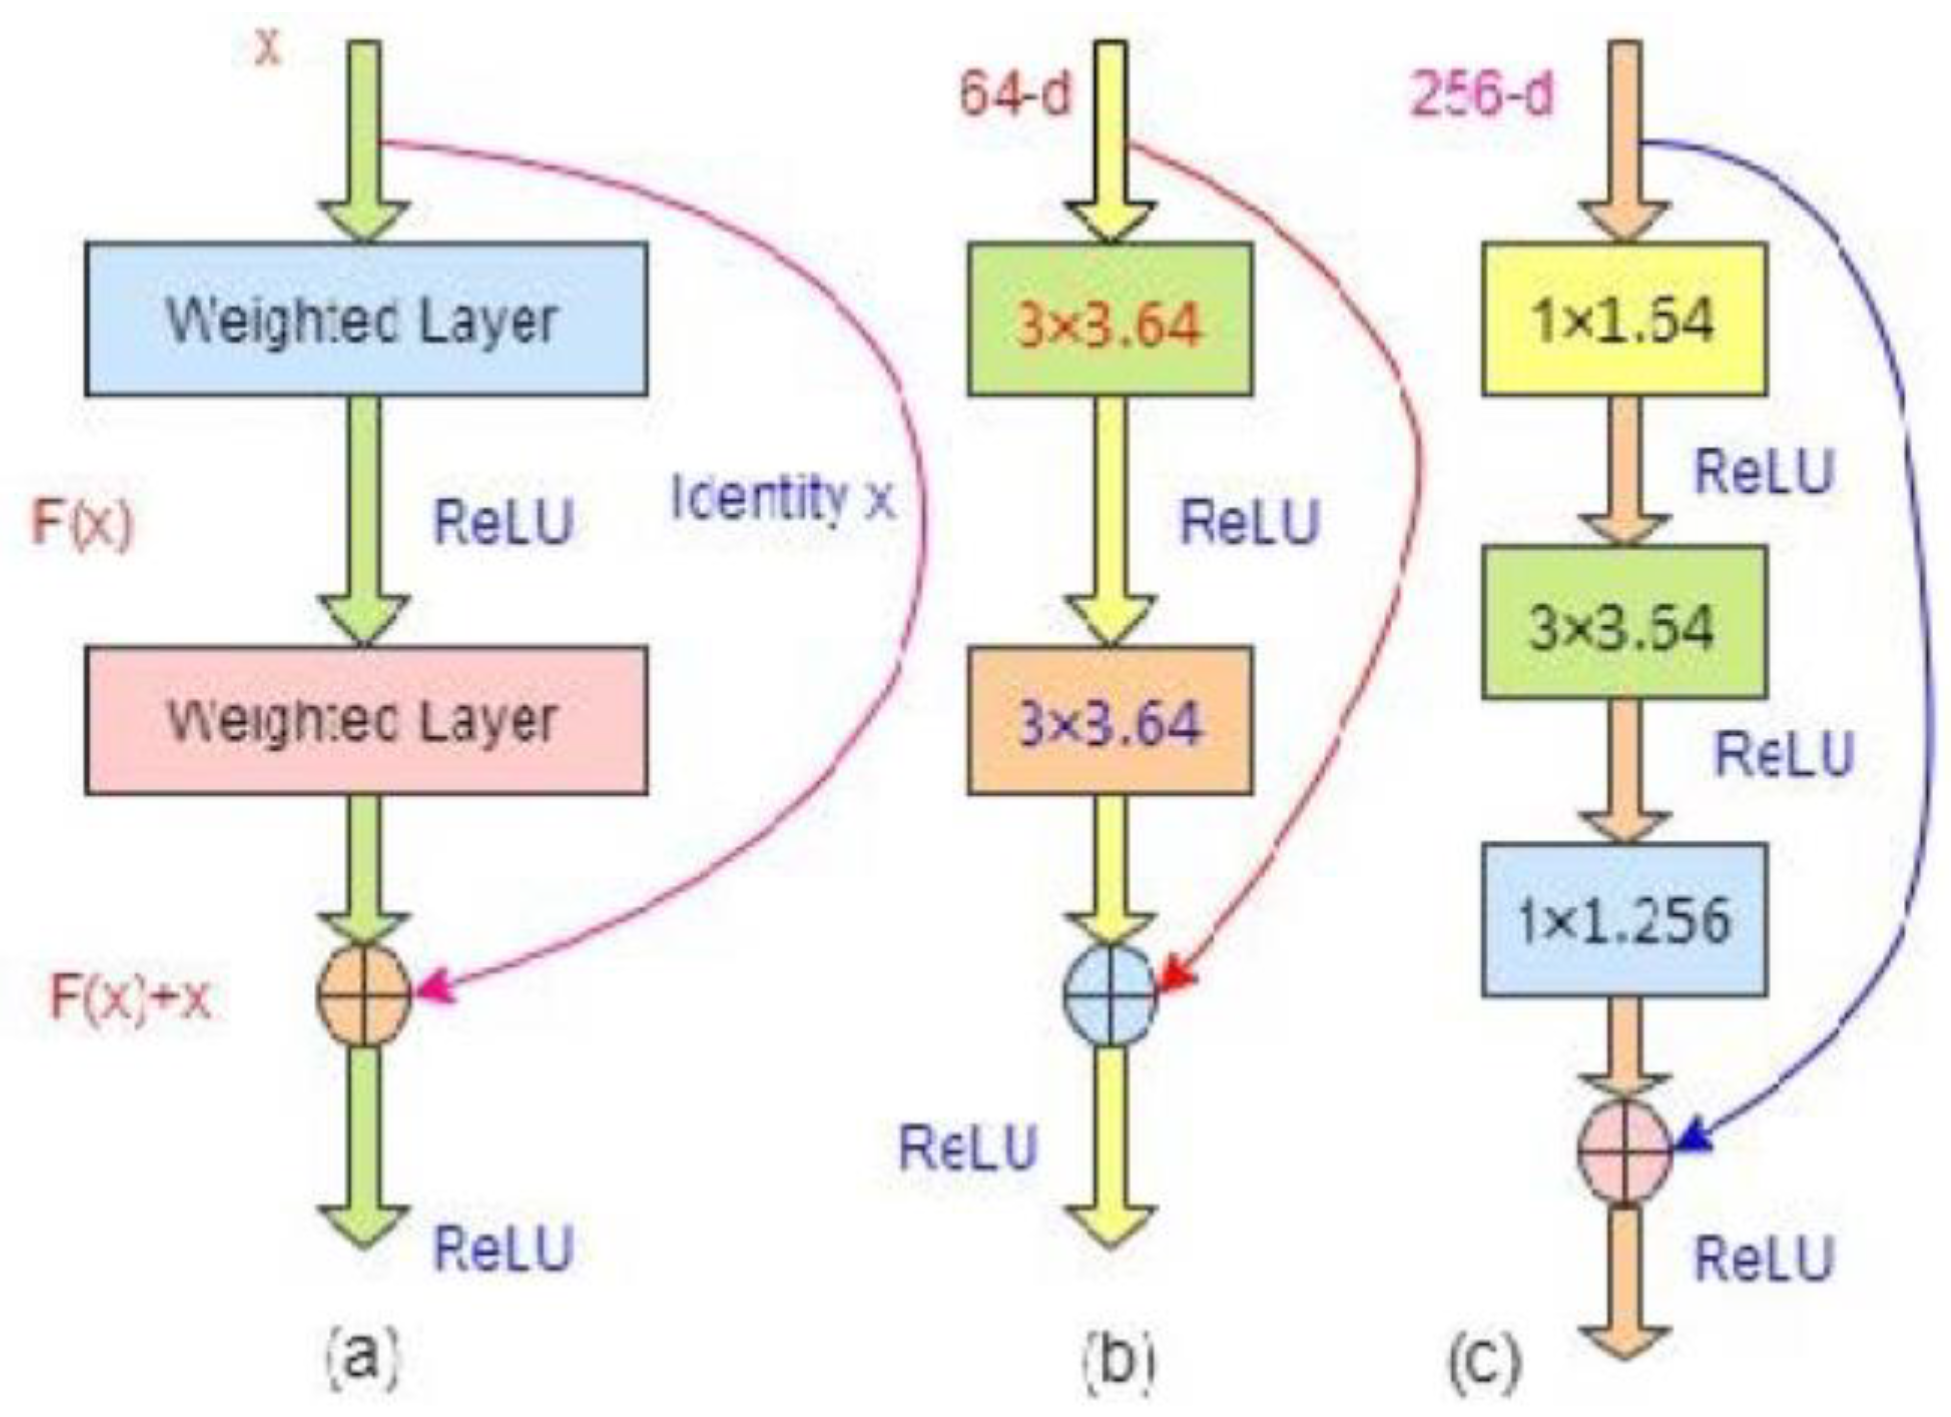
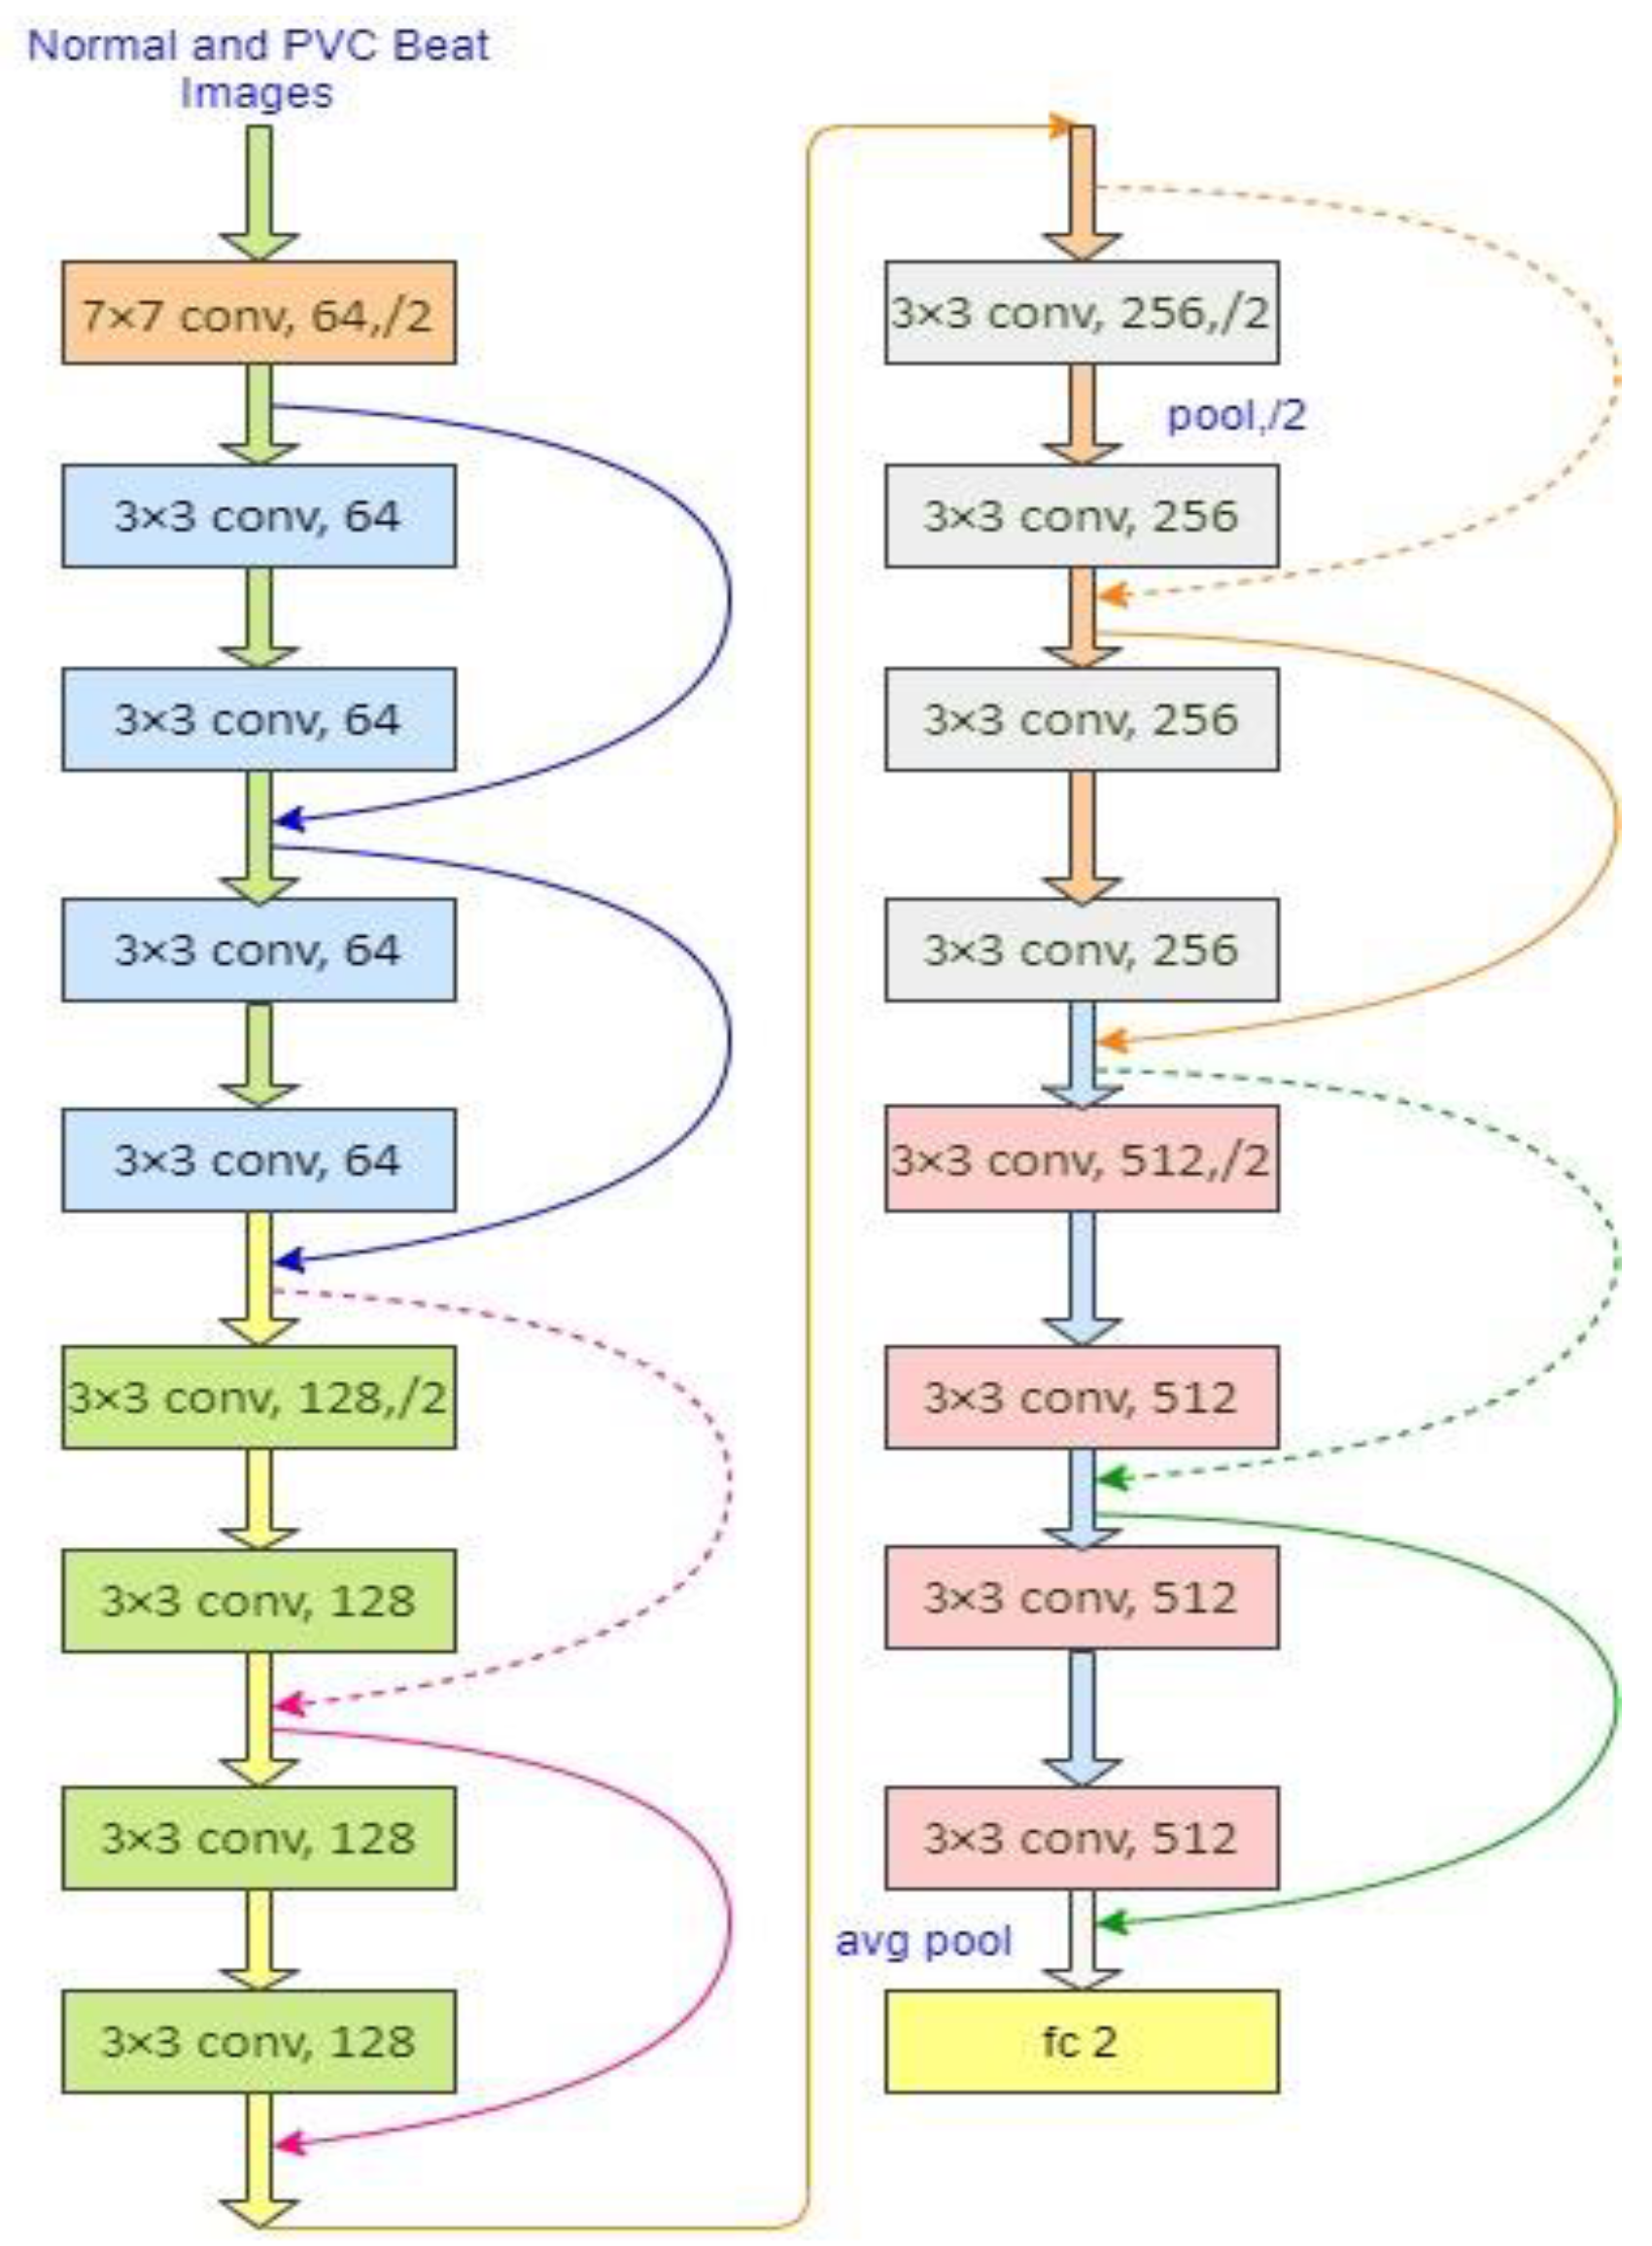
2.4. ResNets/Residual Networks
2.5. Weighted Binary Cross-Entropy Loss
3. Experimental Results and Discussions
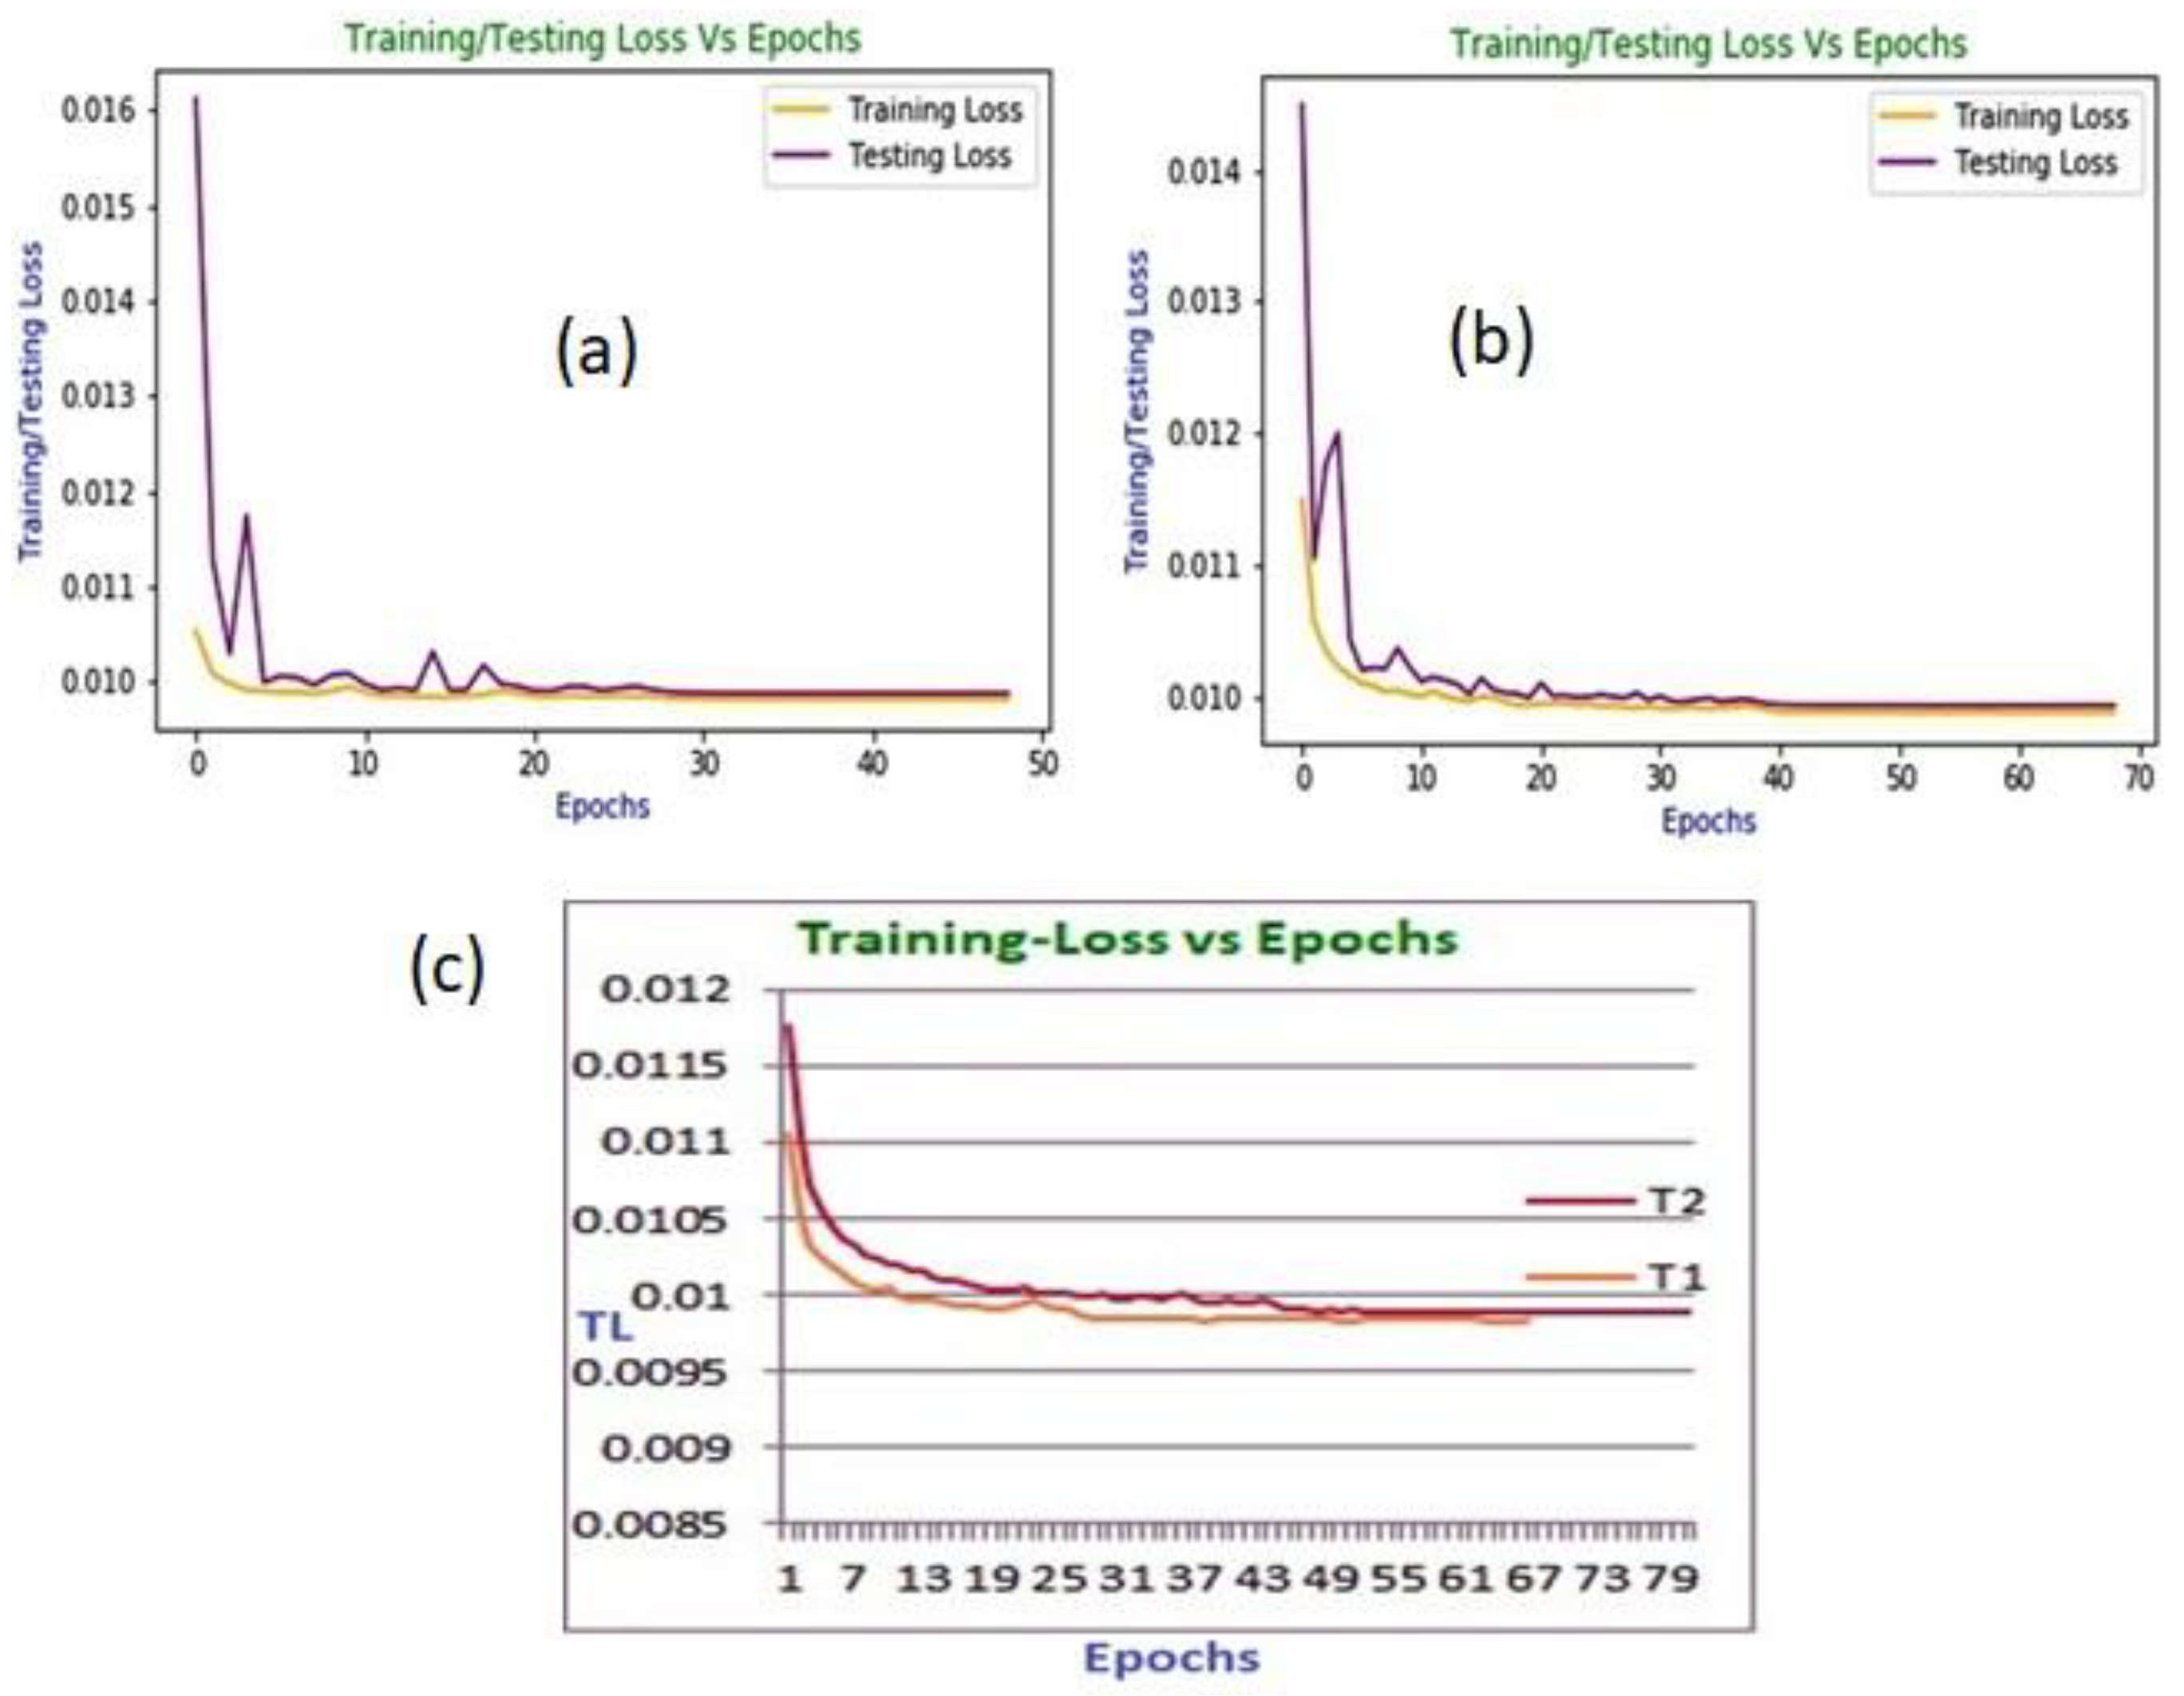
3.1. Classification Results
3.2. Comparison with the State-of-the-Art Works and Discussions
4. Conclusions and Future Directions
Author Contributions
Funding
Institutional Review Board Statement
Informed Consent Statement
Data Availability Statement
Acknowledgments
Conflicts of Interest
References
- Ullah, H.; Bin Heyat, M.B.; Akhtar, F.; Sumbul; Muaad, A.Y.; Islam, M.S.; Abbas, Z.; Pan, T.; Gao, M.; Lin, Y.; et al. An End-to-End Cardiac Arrhythmia Recognition Method with an Effective DenseNet Model on Imbalanced Datasets Using ECG Signal. Comput. Intell. Neurosci. 2022, 2022, 9475162. [Google Scholar] [CrossRef]
- Bin Heyat, M.B.; Akhtar, F.; Ansari, M.A.; Khan, A.; Alkahtani, F.; Khan, H.; Lai, D. Progress in Detection of Insomnia Sleep Disorder: A Comprehensive Review. Curr. Drug Targets 2020, 22, 672–684. [Google Scholar] [CrossRef]
- Bin Heyat, M.B.; Akhtar, F.; Khan, M.H.; Ullah, N.; Gul, I.; Khan, H.; Lai, D. Detection, Treatment Planning, and Genetic Predisposition of Bruxism: A Systematic Mapping Process and Network Visualization Technique. CNS Neurol. Disord. Drug Targets 2020, 20, 755–775. [Google Scholar] [CrossRef]
- Lai, D.; Bin Heyat, M.B.; Khan, F.I.; Zhang, Y. Prognosis of Sleep Bruxism Using Power Spectral Density Approach Applied on EEG Signal of Both EMG1-EMG2 and ECG1-ECG2 Channels. IEEE Access 2019, 7, 82553–82562. [Google Scholar] [CrossRef]
- Sayadi, O.; Shamsollahi, M.B.; Clifford, G.D. Robust Detection of Premature Ventricular Contractions Using a Wave-Based Bayesian Framework. IEEE Trans. Biomed. Eng. 2010, 57, 353–362. [Google Scholar] [CrossRef] [Green Version]
- Allami, R. Premature Ventricular Contraction Analysis for Real-Time Patient Monitoring. Biomed. Signal Process. Control 2019, 47, 358–365. [Google Scholar] [CrossRef]
- De Oliveira, B.R.; de Abreu, C.C.E.; Duarte, M.A.Q.; Vieira Filho, J. Geometrical Features for Premature Ventricular Contraction Recognition with Analytic Hierarchy Process Based Machine Learning Algorithms Selection. Comput. Methods Programs Biomed. 2019, 169, 59–69. [Google Scholar] [CrossRef]
- Mazidi, M.H.; Eshghi, M.; Raoufy, M.R. Detection of Premature Ventricular Contraction (PVC) Using Linear and Nonlinear Techniques: An Experimental Study. Clust. Comput. 2019, 23, 759–774. [Google Scholar] [CrossRef]
- Ullah, H.; Kiber, A.; Huq, A.; Arif, M.; Bhuiyan, S. Computing the Performance of FFNN for Classifying Purposes. Malays. J. Appl. Sci. 2018, 3, 8–20. [Google Scholar]
- Demir, N.; Kuncan, M.; Kaya, Y.; Kuncan, F. Multi-Layer Co-Occurrence Matrices for Person Identification from ECG Signals. Trait. Signal 2022, 39, 431–440. [Google Scholar] [CrossRef]
- Kaplan Berkaya, S.; Uysal, A.K.; Sora Gunal, E.; Ergin, S.; Gunal, S.; Gulmezoglu, M.B. A Survey on ECG Analysis. Biomed. Signal Process. Control 2018, 43, 216–235. [Google Scholar] [CrossRef]
- Zhao, W.; Zhu, R.; Zhang, J.; Mao, Y.; Chen, H.; Ju, W.; Li, M.; Yang, G.; Gu, K.; Wang, Z.; et al. Machine Learning for Distinguishing Right from Left Premature Ventricular Contraction Origin Using Surface Electrocardiogram Features. Heart Rhythm 2022, 19, 1781–1789. [Google Scholar] [CrossRef]
- Sraitih, M.; Jabrane, Y.; El Hassani, A.H. An Automated System for ECG Arrhythmia Detection Using Machine Learning Techniques. J. Clin. Med. 2021, 10, 5450. [Google Scholar] [CrossRef]
- Han, D.; Bashar, S.K.; Mohagheghian, F.; Ding, E.; Whitcomb, C.; McManus, D.D.; Chon, K.H. Premature Atrial and Ventricular Contraction Detection Using Photoplethysmographic Data from a Smartwatch. Sensors 2020, 20, 5683. [Google Scholar] [CrossRef]
- Nawabi, A.K.; Jinfang, S.; Abbasi, R.; Iqbal, M.S.; Bin Heyat, M.B.; Akhtar, F.; Wu, K.; Twumasi, B.A. Segmentation of Drug-Treated Cell Image and Mitochondrial-Oxidative Stress Using Deep Convolutional Neural Network. Oxid. Med. Cell. Longev. 2022, 2022, 5641727. [Google Scholar] [CrossRef]
- Ullah, H.; Bin Heyat, M.B.; Alsalman, H.; Khan, H.M.; Akhtar, F.; Gumaei, A.; Mehdi, A.; Muaad, A.Y.; Islam, M.S.; Ali, A.; et al. An Effective and Lightweight Deep Electrocardiography Arrhythmia Recognition Model Using Novel Special and Native Structural Regularization Techniques on Cardiac Signal. J. Healthc. Eng. 2022, 2022, 3408501. [Google Scholar] [CrossRef]
- Ali, L.; He, Z.; Cao, W.; Rauf, H.T.; Imrana, Y.; Bin Heyat, M.B. MMDD-Ensemble: A Multimodal Data–Driven Ensemble Approach for Parkinson’s Disease Detection. Front. Neurosci. 2021, 15, 754058. [Google Scholar] [CrossRef]
- Ukwuoma, C.C.; Qin, Z.; Belal Bin Heyat, M.; Akhtar, F.; Bamisile, O.; Muaad, A.Y.; Addo, D.; Al-antari, M.A. A Hybrid Explainable Ensemble Transformer Encoder for Pneumonia Identification from Chest X-Ray Images. J. Adv. Res. 2022; in press. [Google Scholar] [CrossRef]
- Bengio, Y.; Courville, A.; Vincent, P. Representation Learning: A Review and New Perspectives. IEEE Trans. Pattern Anal. Mach. Intell. 2012, 35, 1798–1828. [Google Scholar] [CrossRef] [Green Version]
- Guragai, B.; Alshorman, O.; Masadeh, M.; Heyat, M.B. Bin A Survey on Deep Learning Classification Algorithms for Motor Imagery. In Proceedings of the 2020 32nd International Conference on Microelectronics (ICM), Aqaba, Jordan, 14–17 December 2020. [Google Scholar] [CrossRef]
- Lai, D.; Zhang, X.; Zhang, Y.; Bin Heyat, M.B. Convolutional Neural Network Based Detection of Atrial Fibrillation Combing R-R Intervals and F-Wave Frequency Spectrum. In Proceedings of the Annual International Conference of the IEEE Engineering in Medicine and Biology Society, EMBS, Berlin, Germany, 23–27 July 2019; IEEE: Hoboken, NJ, USA, 2019; pp. 4897–4900. [Google Scholar]
- Acharya, U.R.; Fujita, H.; Oh, S.L.; Raghavendra, U.; Tan, J.H.; Adam, M.; Gertych, A.; Hagiwara, Y. Automated Identification of Shockable and Non-Shockable Life-Threatening Ventricular Arrhythmias Using Convolutional Neural Network. Futur. Gener. Comput. Syst. 2018, 79, 952–959. [Google Scholar] [CrossRef]
- Hemanth, D.J.; Deperlioglu, O.; Kose, U. An Enhanced Diabetic Retinopathy Detection and Classification Approach Using Deep Convolutional Neural Network. Neural Comput. Appl. 2019, 32, 707–721. [Google Scholar] [CrossRef]
- Naz, M.; Shah, J.H.; Khan, M.A.; Sharif, M.; Raza, M.; Damaševičius, R. From ECG signals to images: A transformation based approach for deep learning. PeerJ Comput. Sci. 2021, 7, e386. [Google Scholar] [CrossRef] [PubMed]
- Hannun, A.Y.; Rajpurkar, P.; Haghpanahi, M.; Tison, G.H.; Bourn, C.; Turakhia, M.P.; Ng, A.Y. Cardiologist-Level Arrhythmia Detection and Classification in Ambulatory Electrocardiograms Using a Deep Neural Network. Nat. Med. 2019, 25, 65–69. [Google Scholar] [CrossRef] [PubMed]
- Yildirim, Ö. A Novel Wavelet Sequences Based on Deep Bidirectional LSTM Network Model for ECG Signal Classification. Comput. Biol. Med. 2018, 96, 189–202. [Google Scholar] [CrossRef] [PubMed]
- Awais, M.; Raza, M.; Singh, N.; Bashir, K.; Manzoor, U.; Islam, S.U.; Rodrigues, J.J.P.C. LSTM-Based Emotion Detection Using Physiological Signals: IoT Framework for Healthcare and Distance Learning in COVID-19. IEEE Internet Things J. 2021, 8, 16863–16871. [Google Scholar] [CrossRef]
- Chen, C.; Hua, Z.; Zhang, R.; Liu, G.; Wen, W. Automated Arrhythmia Classification Based on a Combination Network of CNN and LSTM. Biomed. Signal Process. Control 2020, 57, 101819. [Google Scholar] [CrossRef]
- Khamparia, A.; Pandey, B.; Tiwari, S.; Gupta, D.; Khanna, A.; Rodrigues, J.J.P.C. An Integrated Hybrid CNN–RNN Model for Visual Description and Generation of Captions. Circuits, Syst. Signal Process. 2020, 39, 776–788. [Google Scholar] [CrossRef]
- Akdağ, S.; Kuncan, F.; Kaya, Y. A New Approach for Congestive Heart Failure and Arrhythmia Classification Using Downsampling Local Binary Patterns with LSTM. Turkish J. Electr. Eng. Comput. Sci. 2022, 30, 2145–2164. [Google Scholar] [CrossRef]
- Kaya, Y.; Kuncan, F.; Tekin, R. A New Approach for Congestive Heart Failure and Arrhythmia Classification Using Angle Transformation with LSTM. Arab. J. Sci. Eng. 2022, 47, 10497–10513. [Google Scholar] [CrossRef]
- Ihsanto, E.; Ramli, K.; Sudiana, D.; Gunawan, T.S. Fast and Accurate Algorithm for ECG Authentication Using Residual Depthwise Separable Convolutional Neural Networks. Appl. Sci. 2020, 10, 3304. [Google Scholar] [CrossRef]
- Yu, J.; Wang, X.; Chen, X.; Guo, J. Searching for Premature Ventricular Contraction from Electrocardiogram by Using One-Dimensional Convolutional Neural Network. Electronics 2020, 9, 1790. [Google Scholar] [CrossRef]
- Yu, J.; Wang, X.; Chen, X.; Guo, J. Automatic Premature Ventricular Contraction Detection Using Deep Metric Learning and Knn. Biosensors 2021, 11, 69. [Google Scholar] [CrossRef]
- Yildirim, O.; Talo, M.; Ay, B.; Baloglu, U.B.; Aydin, G.; Acharya, U.R. Automated Detection of Diabetic Subject Using Pre-Trained 2D-CNN Models with Frequency Spectrum Images Extracted from Heart Rate Signals. Comput. Biol. Med. 2019, 113, 103387. [Google Scholar] [CrossRef]
- He, K.; Zhang, X.; Ren, S.; Sun, J. Deep Residual Learning for Image Recognition. In Proceedings of the IEEE Computer Society Conference on Computer Vision and Pattern Recognition; IEEE Computer Society, Las Vegas, NV, USA, 27–30 June 2016; pp. 770–778. [Google Scholar]
- Krawczyk, B. Learning from Imbalanced Data: Open Challenges and Future Directions. Prog. Artif. Intell. 2016, 5, 221–232. [Google Scholar] [CrossRef] [Green Version]
- Rajesh, K.N.V.P.S.; Dhuli, R. Classification of Imbalanced ECG Beats Using Re-Sampling Techniques and AdaBoost Ensemble Classifier. Biomed. Signal Process. Control 2018, 41, 242–254. [Google Scholar] [CrossRef]
- Beritelli, F.; Capizzi, G.; Lo Sciuto, G.; Napoli, C.; Woźniak, M. A novel training method to preserve generalization of RBPNN classifiers applied to ECG signals diagnosis. Neural Netw. 2018, 108, 331–338. [Google Scholar] [CrossRef]
- Ai, M.T.; Sumiati, S.; Rosalina, V. A predictive model for heart disease diagnosis based on multinomial logistic regression. Inf. Technol. Control 2021, 50, 308–318. [Google Scholar] [CrossRef]
- Jothi Prakash, V.; Karthikeyan, N.K. Dual-layer deep ensemble techniques for classifying heart disease. Inf. Technol. Control 2022, 51, 158–179. [Google Scholar] [CrossRef]
- Tayyib, M.; Amir, M.; Yousufi, M.; Abdullah, S.; Maqsood, S.; Irfan, M. Modified block compressed sensing for extraction of fetal electrocardiogram from mother electrocardiogram using block compressed sensing based guided focuss and fast-independent component. Inf. Technol. Control 2021, 50, 123–137. [Google Scholar] [CrossRef]
- Jang, J.H.; Kim, T.Y.; Yoon, D. Effectiveness of Transfer Learning for Deep Learning-Based Electrocardiogram Analysis. Healthc. Inform. Res. 2021, 27, 19–28. [Google Scholar] [CrossRef]
- Kim, H.; Kim, S.; Van Helleputte, N.; Artes, A.; Konijnenburg, M.; Huisken, J.; Van Hoof, C.; Yazicioglu, R.F. A Configurable and Low-Power Mixed Signal SoC for Portable ECG Monitoring Applications. IEEE Trans. Biomed. Circuits Syst. 2014, 8, 257–267. [Google Scholar] [CrossRef]
- Ullah, H.; Wahab, M.A.; Will, G.; Karim, M.R.; Pan, T.; Gao, M.; Lai, D.; Lin, Y.; Miraz, M.H. Recent Advances in Stretchable and Wearable Capacitive Electrophysiological Sensors for Long-Term Health Monitoring. Biosensensors 2022, 12, 630. [Google Scholar] [CrossRef] [PubMed]
- Allam, J.P.; Samantray, S.; Ari, S. SpEC: A System for Patient Specific ECG Beat Classification Using Deep Residual Network. Biocybern. Biomed. Eng. 2020, 40, 1446–1457. [Google Scholar] [CrossRef]
- Kiranyaz, S.; Ince, T.; Gabbouj, M. Personalized Monitoring and Advance Warning System for Cardiac Arrhythmias. Sci. Rep. 2017, 7, 9270. [Google Scholar] [CrossRef] [PubMed] [Green Version]
- Lodwich, A.; Rangoni, Y.; Breuel, T. Evaluation of Robustness and Performance of Early Stopping Rules with Multi Layer Perceptrons. In Proceedings of the 2009 International Joint Conference on Neural Networks, Atlanta, GA, USA, 14–19 June 2009; pp. 1877–1884. [Google Scholar] [CrossRef]
- Efraimidis, P.; Spirakis, P. Weighted Random Sampling. In Encyclopedia of Algorithms; Springer: Boston, MA, USA, 2008; pp. 1024–1027. [Google Scholar] [CrossRef]
- Kingma, D.P.; Ba, J. Adam: A Method for Stochastic Optimization. arXiv 2014. [Google Scholar] [CrossRef]
- Pan, J.; Tompkins, W.J. A Real-Time QRS Detection Algorithm. IEEE Trans. Biomed. Eng. 1985, BME-32, 230–236. [Google Scholar] [CrossRef] [PubMed]
- De Chazal, P.; O’Dwyer, M.; Reilly, R.B. Automatic Classification of Heartbeats Using ECG Morphology and Heartbeat Interval Features. IEEE Trans. Biomed. Eng. 2004, 51, 1196–1206. [Google Scholar] [CrossRef] [Green Version]
- Lam, T.K.; Ohta, M.; Schamoni, S.; Riezler, S. On-the-Fly Aligned Data Augmentation for Sequence-to-Sequence ASR. In Proceedings of the 22nd Annual Conference of the International Speech Communication Association (INTERSPEECH 2021), Brno, Czech Republic, 30 August–3 September 2021; Volume 6, pp. 4481–4485. [Google Scholar] [CrossRef]
- Krizhevsky, A.; Sutskever, I.; Hinton, G.E. ImageNet Classification with Deep Convolutional Neural Networks. Commun. ACM 2017, 60, 84–90. [Google Scholar] [CrossRef] [Green Version]
- Simonyan, K.; Zisserman, A. Very Deep Convolutional Networks for Large-Scale Image Recognition. In Proceedings of the 3rd International Conference on Learning Representations, ICLR 2015—Conference Track Proceedings, ICLR, San Diego, CA, USA, 7–9 May 2015. [Google Scholar]
- He, K.; Zhang, X.; Ren, S.; Sun, J. Identity Mappings in Deep Residual Networks. In Computer Vision—ECCV 2016; Lecture Notes in Computer Science; Springer: Cham, Switzerland, 2016; Volume 9908, pp. 630–645. [Google Scholar]
- Nair, V.; Hinton, G.E. Rectified Linear Units Improve Restricted Boltzmann Machines. Available online: https://openreview.net/forum?id=rkb15iZdZB (accessed on 5 October 2022).
- Paszke, A.; Gross, S.; Massa, F.; Lerer, A.; Bradbury Google, J.; Chanan, G.; Killeen, T.; Lin, Z.; Gimelshein, N.; Antiga, L.; et al. PyTorch: An Imperative Style, High-Performance Deep Learning Library. Adv. Neural Process. Syst. 2019, 32, 1–12. [Google Scholar]
- Chetlur, S.; Woolley, C.; Vandermersch, P.; Cohen, J.; Tran, J.; Catanzaro, B.; Shelhamer, E. CuDNN: Efficient Primitives for Deep Learning. arXiv 2014. [Google Scholar] [CrossRef]
- Bin Heyat, M.B.; Akhtar, F.; Khan, A.; Noor, A.; Benjdira, B.; Qamar, Y.; Abbas, S.J.; Lai, D. A Novel Hybrid Machine Learning Classification for the Detection of Bruxism Patients Using Physiological Signals. Appl. Sci. 2020, 10, 7410. [Google Scholar] [CrossRef]
- Ukwuoma, C.C.; Qin, Z.; Bin Heyat, M.B.; Akhtar, F.; Smahi, A.; Jackson, J.K.; Furqan Qadri, S.; Muaad, A.Y.; Monday, H.N.; Nneji, G.U. Automated Lung-Related Pneumonia and COVID-19 Detection Based on Novel Feature Extraction Framework and Vision Transformer Approaches Using Chest X-Ray Images. Bioengineering 2022, 9, 709. [Google Scholar] [CrossRef]
- Chola, C.; Muaad, A.Y.; Bin Heyat, M.B.; Benifa, J.V.B.; Naji, W.R.; Hemachandran, K.; Mahmoud, N.F.; Samee, N.A.; Al-Antari, M.A.; Kadah, Y.M.; et al. BCNet: A Deep Learning Computer-Aided Diagnosis Framework for Human Peripheral Blood Cell Identification. Diagnostics 2022, 12, 2815. [Google Scholar] [CrossRef]
- Tripathi, P.; Ansari, M.A.; Gandhi, T.K.; Mehrotra, R.; Bin Heyat, M.B.; Akhtar, F.; Ukwuoma, C.C.; Muaad, A.Y.; Kadah, Y.M.; Al-Antari, M.A.; et al. Ensemble Computational Intelligent for Insomnia Sleep Stage Detection via the Sleep ECG Signal. IEEE Access 2022, 10, 108710–108721. [Google Scholar] [CrossRef]
- Pedregosa, F.; Michel, V.; Grisel, O.; Blondel, M.; Prettenhofer, P.; Weiss, R.; Vanderplas, J.; Cournapeau, D.; Pedregosa, F.; Varoquaux, G.; et al. Scikit-Learn: Machine Learning in Python. J. Mach. Learn. Res. 2011, 12, 2825–2830. [Google Scholar]
- Hoekema, R.; Uijen, G.J.H.; Van Oosterom, A. Geometrical Aspects of the Interindividual Variability of Multilead ECG Recordings. IEEE Trans. Biomed. Eng. 2001, 48, 551–559. [Google Scholar] [CrossRef]
- Talbi, M.L.; Charef, A. PVC Discrimination Using the QRS Power Spectrum and Self-Organizing Maps. Comput. Methods Programs Biomed. 2009, 94, 223–231. [Google Scholar] [CrossRef]
- Walker, H.K.; Hall, W.D.; Hurst, J.W. Clinical Methods. Geriatr. Psychiatry 1990, 77–121. [Google Scholar]
- Malek, A.S.; Elnahrawy, A.; Anwar, H.; Naeem, M. Automated Detection of Premature Ventricular Contraction in ECG Signals Using Enhanced Template Matching Algorithm. Biomed. Phys. Eng. Express 2020, 6, 015024. [Google Scholar] [CrossRef]
- Ge, D.; Srinivasan, N.; Krishnan, S.M. Cardiac Arrhythmia Classification Using Autoregressive Modeling. Biomed. Eng. Online 2002, 1, 5. [Google Scholar] [CrossRef]
- Zhao, Z.; Wang, X.; Cai, Z.; Li, J.; Liu, C. PVC Recognition for Wearable ECGs Using Modified Frequency Slice Wavelet Transform and Convolutional Neural Network. In Proceedings of the 2019 Computing in Cardiology (CinC), Singapore, 8–11 September 2019. [Google Scholar] [CrossRef]
- Li, Q.; Liu, C.; Li, Q.; Shashikumar, S.P.; Nemati, S.; Shen, Z.; Clifford, G.D. Ventricular Ectopic Beat Detection Using a Wavelet Transform and a Convolutional Neural Network. Physiol. Meas. 2019, 40, 055002. [Google Scholar] [CrossRef]
- Hoang, T.; Fahier, N.; Fang, W.C. Multi-Leads ECG Premature Ventricular Contraction Detection Using Tensor Decomposition and Convolutional Neural Network. In Proceedings of the 2019 IEEE Biomedical Circuits and Systems Conference (BioCAS), Nara, Japan, 17–19 October 2019. [Google Scholar] [CrossRef]
- Jun, T.J.; Park, H.J.; Minh, N.H.; Kim, D.; Kim, Y.-H. Premature Ventricular Contraction Beat Detection with Deep Neural Networks. In Proceedings of the 2016 15th IEEE International Conference on Machine Learning and Applications (ICMLA), Anaheim, CA, USA, 18–20 December 2017; pp. 859–864. [Google Scholar] [CrossRef]
- Junior, E.A.; Valentim, R.A.D.M.; Brandão, G.B. Real-Time Premature Ventricular Contractions Detection Based on Redundant Discrete Wavelet Transform. Res. Biomed. Eng. 2018, 34, 187–197. [Google Scholar] [CrossRef]
- Somani, S.; Russak, A.J.; Richter, F.; Zhao, S.; Vaid, A.; Chaudhry, F.; De Freitas, J.K.; Naik, N.; Miotto, R.; Nadkarni, G.N.; et al. Deep Learning and the Electrocardiogram: Review of the Current State-of-the-Art. EP Eur. 2021, 23, 1179–1191. [Google Scholar] [CrossRef] [PubMed]
- Lecun, Y.; Bengio, Y.; Hinton, G. Deep Learning. Nature 2015, 521, 436–444. [Google Scholar] [CrossRef] [PubMed]
- Ullah, H.; Bu, Y.; Pan, T.; Gao, M.; Islam, S.; Lin, Y.; Lai, D. Cardiac Arrhythmia Recognition Using Transfer Learning with a Pre-Trained DenseNet. In Proceedings of the 2021 IEEE 2nd International Conference on Pattern Recognition and Machine Learning (PRML), Chengdu, China, 16–18 July 2021; pp. 347–353. [Google Scholar] [CrossRef]
- Ullah, H.; Mahmud, S.; Chowhury, R.H. Identification of Brain disorders by Sub-band Decomposition of EEG signals and Measurement of Signal to Noise Ratio. Indones. J. Electr. Eng. Comput. Sci. 2016, 4, 568–579. [Google Scholar] [CrossRef]
- Komolovaitė, D.; Maskeliūnas, R.; Damaševičius, R. Deep convolutional neural Network-based visual stimuli classification using electroencephalography signals of healthy and Alzheimer’s disease subjects. Life 2022, 12, 374. [Google Scholar] [CrossRef]
- Tamulis, Ž.; Vasiljevas, M.; Damaševičius, R.; Maskeliunas, R.; Misra, S. Affective computing for eHealth using low-cost remote internet of things-based EMG platform. In Intelligent Internet of Things for Healthcare and Industry: Internet of Things; Ghosh, U., Chakraborty, C., Garg, L., Srivastava, G., Eds.; Springer: Cham, Switzerland, 2022. [Google Scholar] [CrossRef]


| T1 | T2 | T3 | T4 | ||||||||||||
|---|---|---|---|---|---|---|---|---|---|---|---|---|---|---|---|
| PL | PL | PL | PL | ||||||||||||
| TL | N | PVC | TL | N | PVC | TL | N | PVC | TL | N | PVC | ||||
| N | 105,999 | 240 | N | 44,060 | 43 | N | 44,070 | 33 | N | 33,556 | 66 | ||||
| PVC | 62 | 9925 | PVC | 13 | 6410 | PVC | 04 | 6419 | PVC | 29 | 8287 | ||||
| Experiments | Accuracy | Precision | Recall | F1-Score |
|---|---|---|---|---|
| T1 | 0.9974 | 0.9764 | 0.9938 | 0.9918 |
| T2 | 0.9989 | 0.9933 | 0.9980 | 0.9975 |
| T3 | 0.9993 | 0.9949 | 0.9993 | 0.9984 |
| T4 | 0.9977 | 0.9921 | 0.9965 | 0.9964 |
| Exp. | Accuracy (%) | Precision (%) | Recall (%) | F1-Score (%) | Specificity (%) | |||||
|---|---|---|---|---|---|---|---|---|---|---|
| T1 | N | 99.74 | N | 99.94 | N | 99.77 | N | 99.86 | N | 99.38 |
| PVC | 99.74 | PVC | 97.64 | PVC | 99.38 | PVC | 98.51 | PVC | 99.77 | |
| Average | 99.74 | 98.79 | 99.58 | 99.19 | 99.58 | |||||
| T2 | N | 99.89 | N | 99.94 | N | 99.90 | N | 99.92 | N | 99.80 |
| PVC | 99.89 | PVC | 99.33 | PVC | 99.80 | PVC | 99.57 | PVC | 99.90 | |
| Average | 99.89 | 99.64 | 99.85 | 99.75 | 99.85 | |||||
| T3 | N | 99.93 | N | 99.99 | N | 99.93 | N | 99.96 | N | 99.94 |
| PVC | 99.93 | PVC | 99.49 | PVC | 99.94 | PVC | 99.72 | PVC | 99.93 | |
| Average | 99.93 | 99.74 | 99.94 | 99.84 | 99.94 | |||||
| T4 | N | 99.77 | N | 99.82 | N | 99.80 | N | 99.81 | N | 99.65 |
| PVC | 99.77 | PVC | 99.21 | PVC | 99.65 | PVC | 99.43 | PVC | 99.80 | |
| Average | 99.77 | 99.51 | 99.73 | 99.62 | 99.73 | |||||
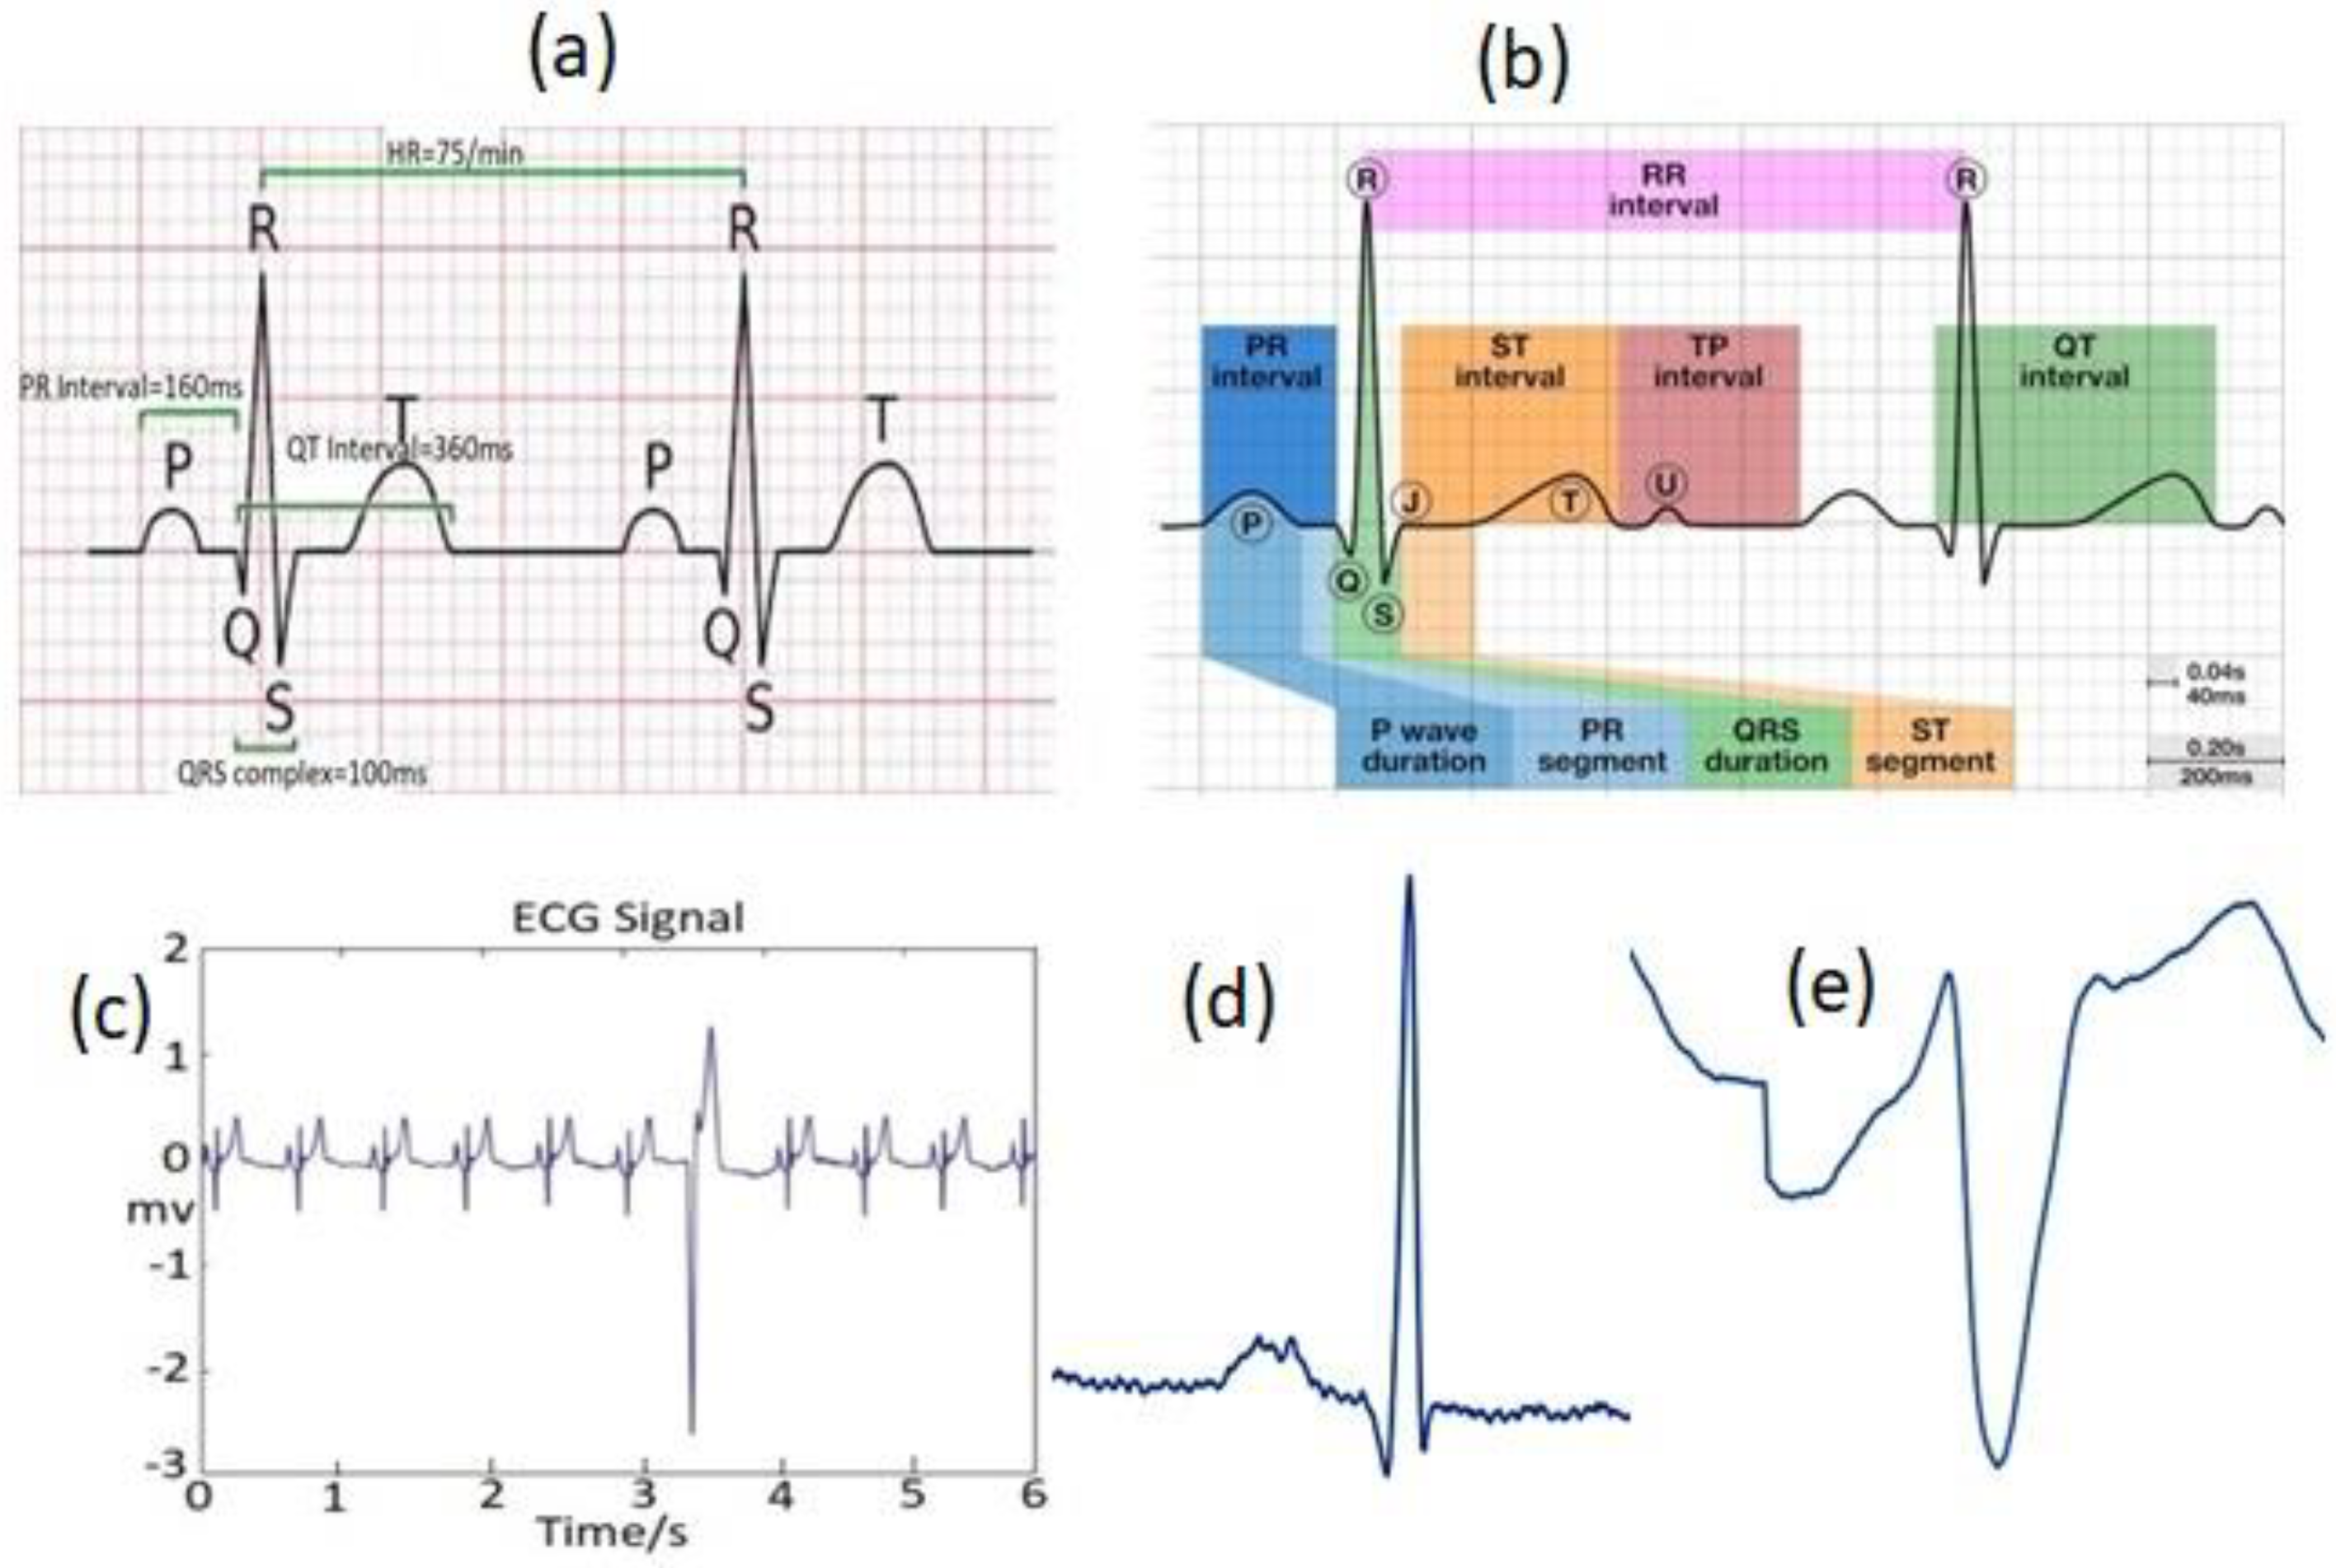
| Phase | Description | Duration/Amplitude |
|---|---|---|
| P | The first upwards wave of the ECG | <80 ms |
| RR | The time interval between RR peaks | 0.6–1.2 s |
| PR | The time between the P and the R wave | 120–200 ms |
| QRS | The time between Q and S beats | 80–120 ms |
| ST | The time between S and T beats | 320 ms |
| Classifier Type/Approach | Features | Acc. (%) | Spec. (%) | Pre. (%) | Rec. (%) | F1-Score (%) |
|---|---|---|---|---|---|---|
| 2D CNN (Proposed-T1) 2D CNN (Proposed-T2) 2D CNN (Proposed-T3) 2D CNN (Proposed-T4) | Transformation of time-series ECG data/signal into the respective 2D beat images | 99.74 99.89 99.93 99.77 | 99.58 99.85 99.94 99.73 | 97.64 99.33 99.49 99.21 | 99.38 99.80 99.93 99.65 | 99.18 99.75 99.84 99.64 |
| 2D CNN [70] | Time frequency images | 97.89 | 97.17 | 98.58 | --- | --- |
| 2D CNN [71] | Wavelet power spectrums | 97.96 | 99.11 | 82.60 | --- | --- |
| 2D CNN [72] | Wavelet fusion method, Tucker-decomposition | 90.84 | 99.86 | 78.60 | --- | --- |
| DNN [73] | R-peak amplitude, S-peak amplitude, R-R interval time, Q-peak amplitude, ventricular activation time, QRS duration time | 99.41 | --- | 96.08 | --- | --- |
| DNN [6] | Seven statistical and three morphological features | 98.60 | --- | 98.70 | --- | --- |
| Adaptive Thresholding [74] | Energy wavelet coefficients | --- | 99.94 | 99.18 | --- | --- |
| Artificial Immune Systems (AIS) [7] | Geometrical features | 98.04 | 98.65 | 91.08 | --- | --- |
| SVM [8] | Extraction of six features with several methodologies | 99.78 | 99.37 | 99.91 | --- | --- |
Disclaimer/Publisher’s Note: The statements, opinions and data contained in all publications are solely those of the individual author(s) and contributor(s) and not of MDPI and/or the editor(s). MDPI and/or the editor(s) disclaim responsibility for any injury to people or property resulting from any ideas, methods, instructions or products referred to in the content. |
© 2022 by the authors. Licensee MDPI, Basel, Switzerland. This article is an open access article distributed under the terms and conditions of the Creative Commons Attribution (CC BY) license (https://creativecommons.org/licenses/by/4.0/).
Share and Cite
Ullah, H.; Heyat, M.B.B.; Akhtar, F.; Muaad, A.Y.; Ukwuoma, C.C.; Bilal, M.; Miraz, M.H.; Bhuiyan, M.A.S.; Wu, K.; Damaševičius, R.; et al. An Automatic Premature Ventricular Contraction Recognition System Based on Imbalanced Dataset and Pre-Trained Residual Network Using Transfer Learning on ECG Signal. Diagnostics 2023, 13, 87. https://doi.org/10.3390/diagnostics13010087
Ullah H, Heyat MBB, Akhtar F, Muaad AY, Ukwuoma CC, Bilal M, Miraz MH, Bhuiyan MAS, Wu K, Damaševičius R, et al. An Automatic Premature Ventricular Contraction Recognition System Based on Imbalanced Dataset and Pre-Trained Residual Network Using Transfer Learning on ECG Signal. Diagnostics. 2023; 13(1):87. https://doi.org/10.3390/diagnostics13010087
Chicago/Turabian StyleUllah, Hadaate, Md Belal Bin Heyat, Faijan Akhtar, Abdullah Y. Muaad, Chiagoziem C. Ukwuoma, Muhammad Bilal, Mahdi H. Miraz, Mohammad Arif Sobhan Bhuiyan, Kaishun Wu, Robertas Damaševičius, and et al. 2023. "An Automatic Premature Ventricular Contraction Recognition System Based on Imbalanced Dataset and Pre-Trained Residual Network Using Transfer Learning on ECG Signal" Diagnostics 13, no. 1: 87. https://doi.org/10.3390/diagnostics13010087