
Dynamic Brain Connectivity in Resting-State FMRI Using Spectral ICA and Graph Approach: Application to Healthy Controls and Multiple Sclerosis


Abstract
:1. Introduction
2. Material and Methods
2.1. Data Acquisition
2.2. Preprocessing
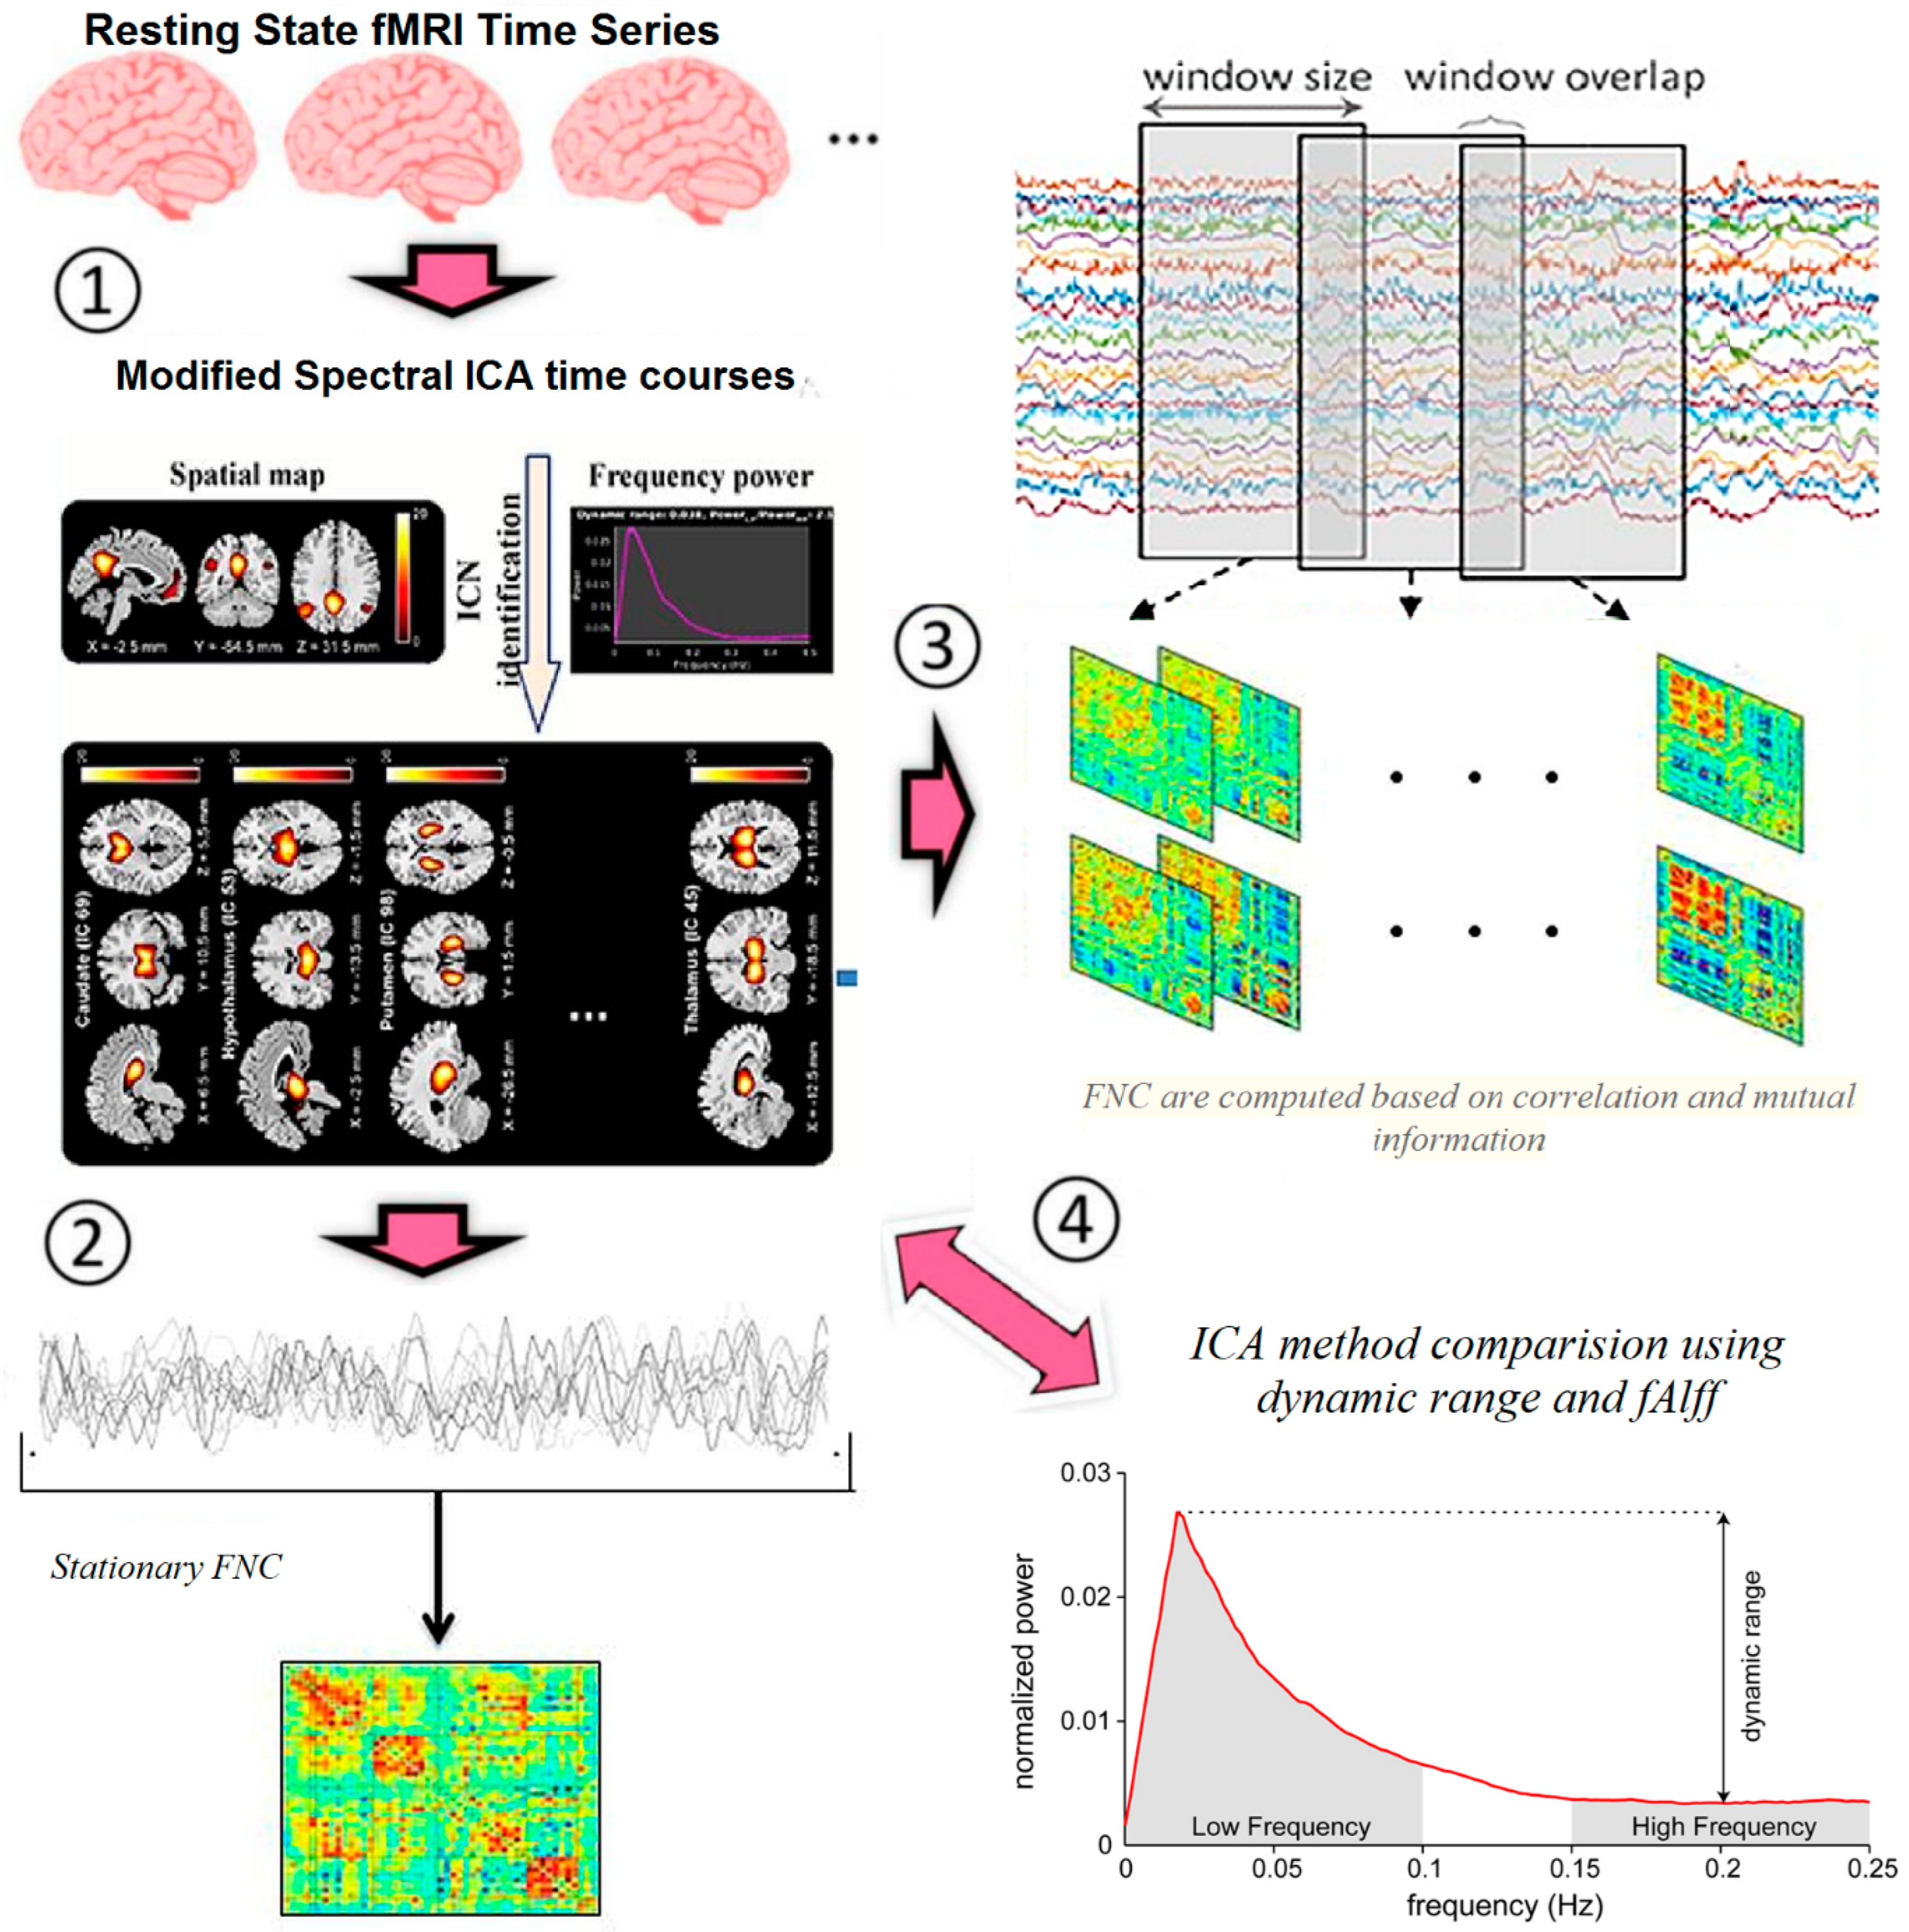
2.3. Methods
- Extraction of ICs (nodes) using proposed ICA method
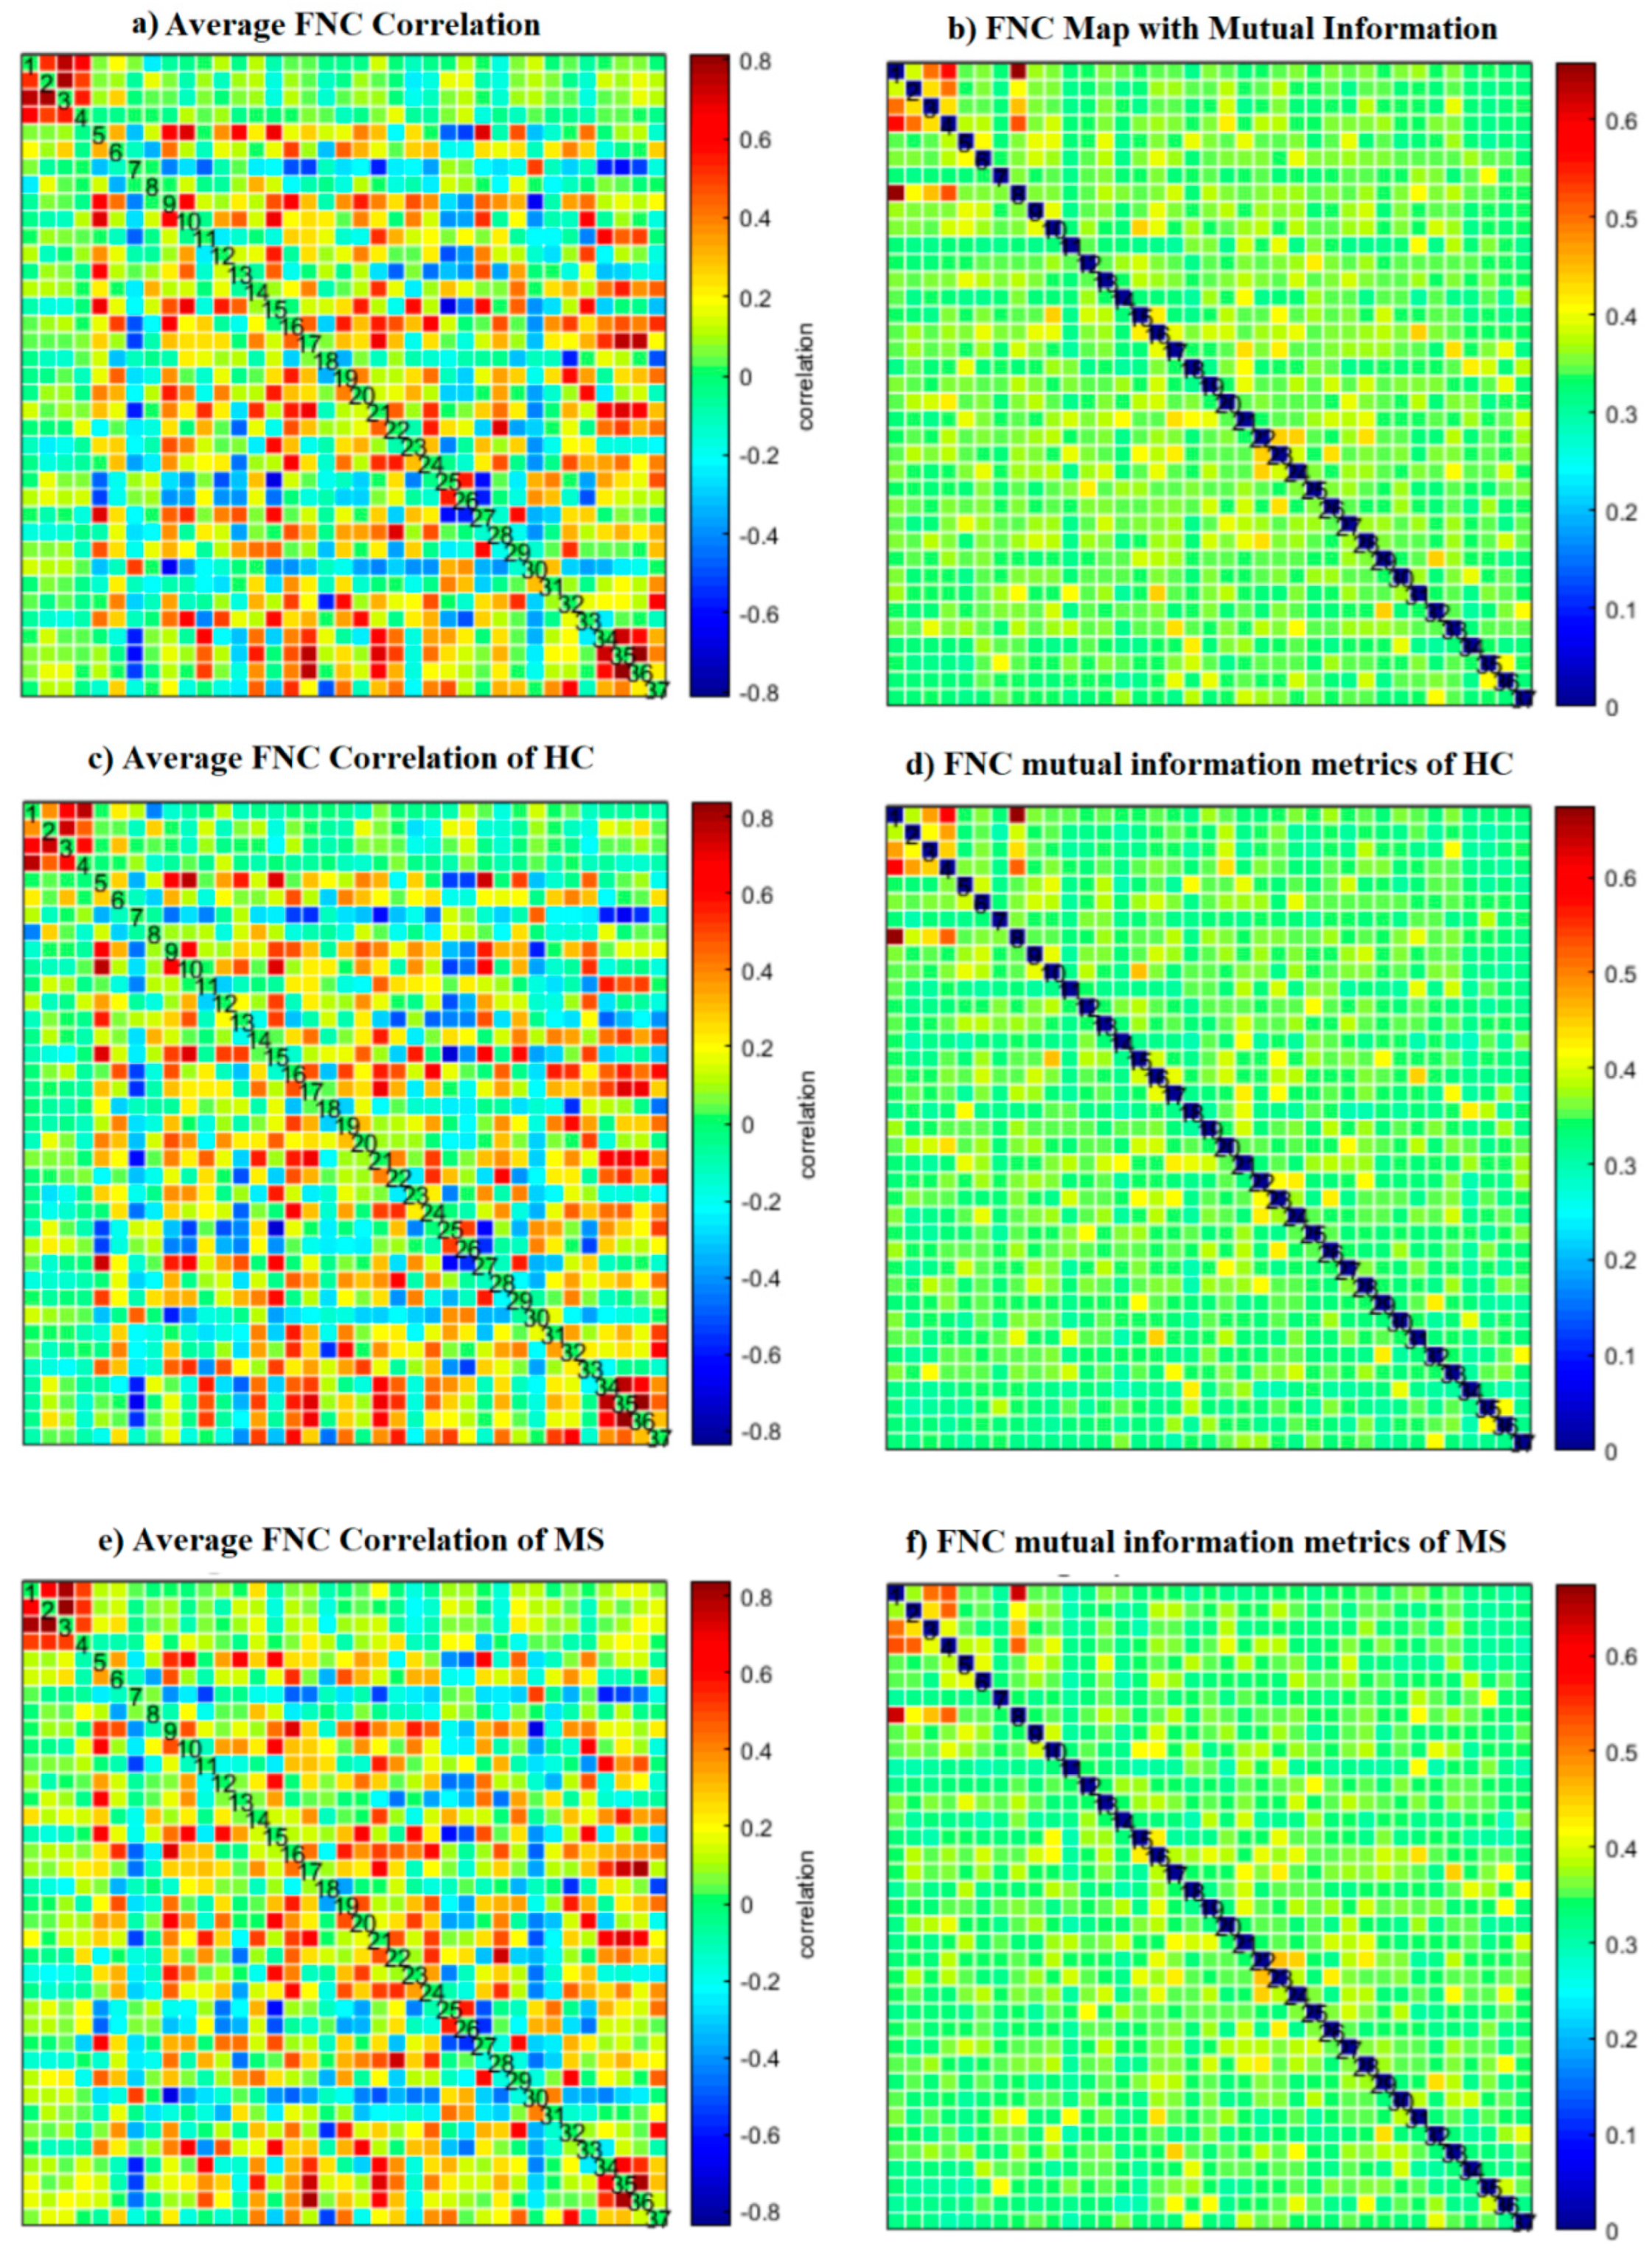
- Calculation of connectivity map for all datasets and all ICs, as well as extracting connectivity maps for MS and HC.
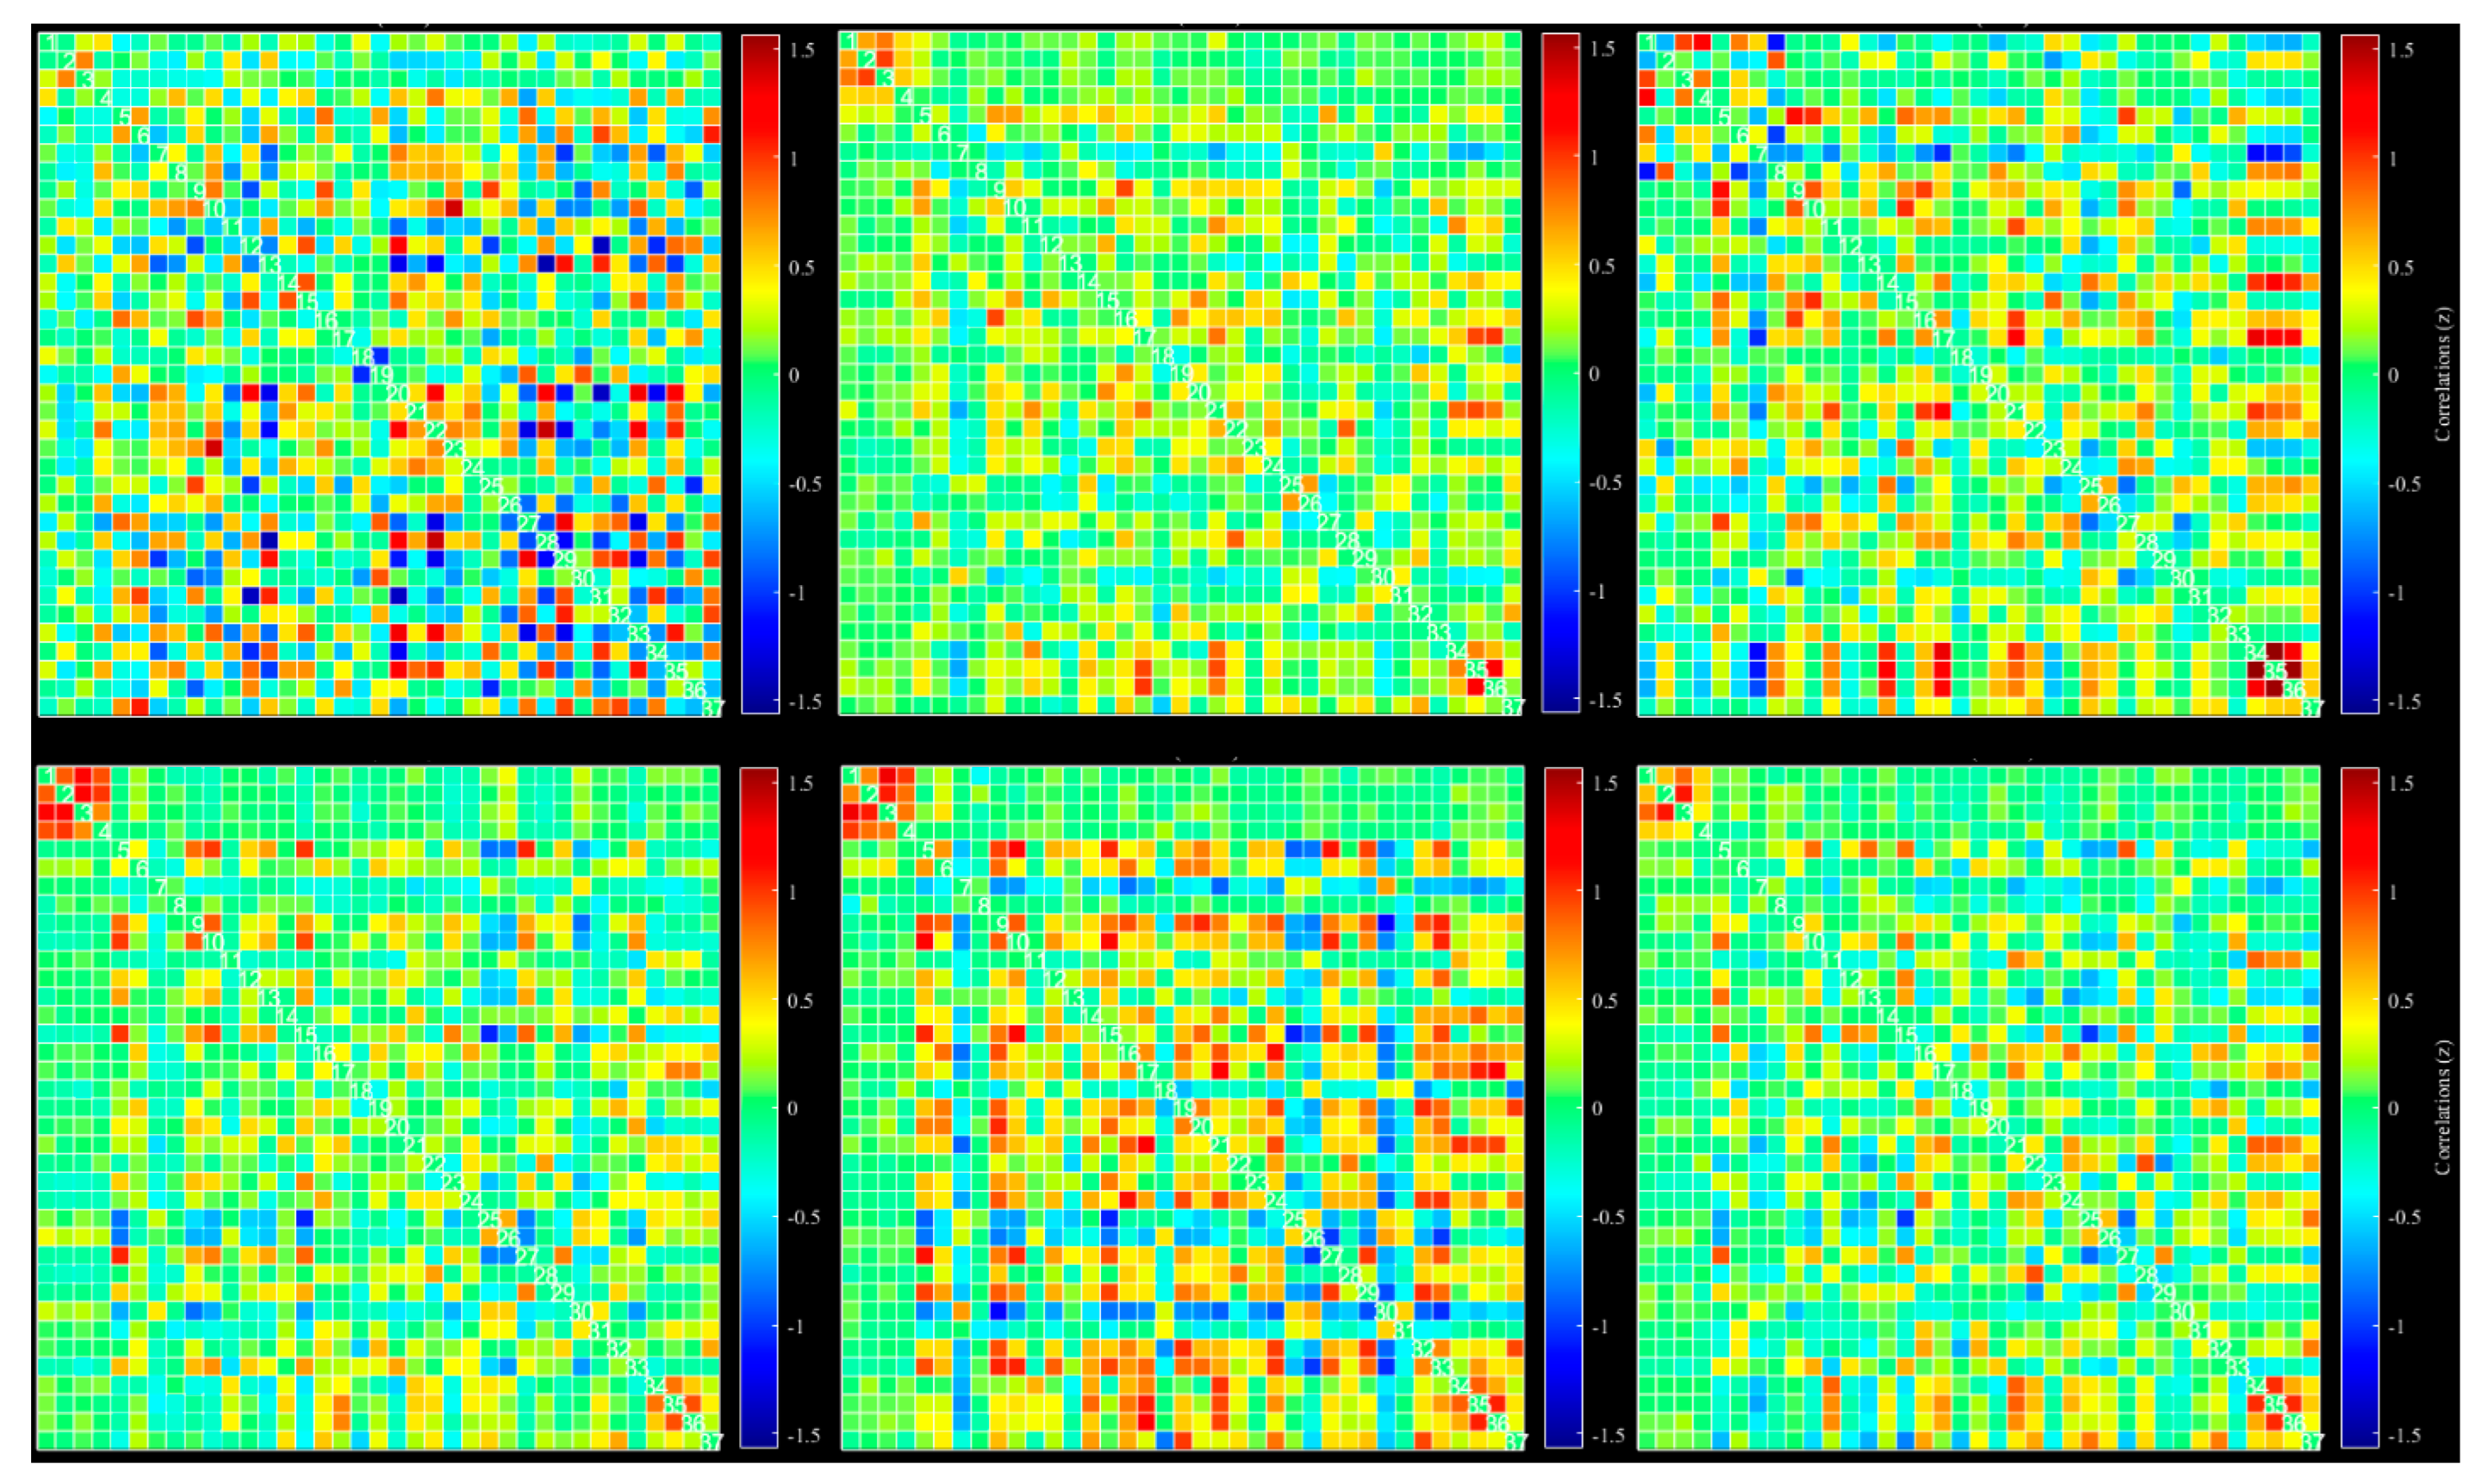
- Calculation of static and dynamic connectivity
- Calculation of standard deviation between windows for MS and HC
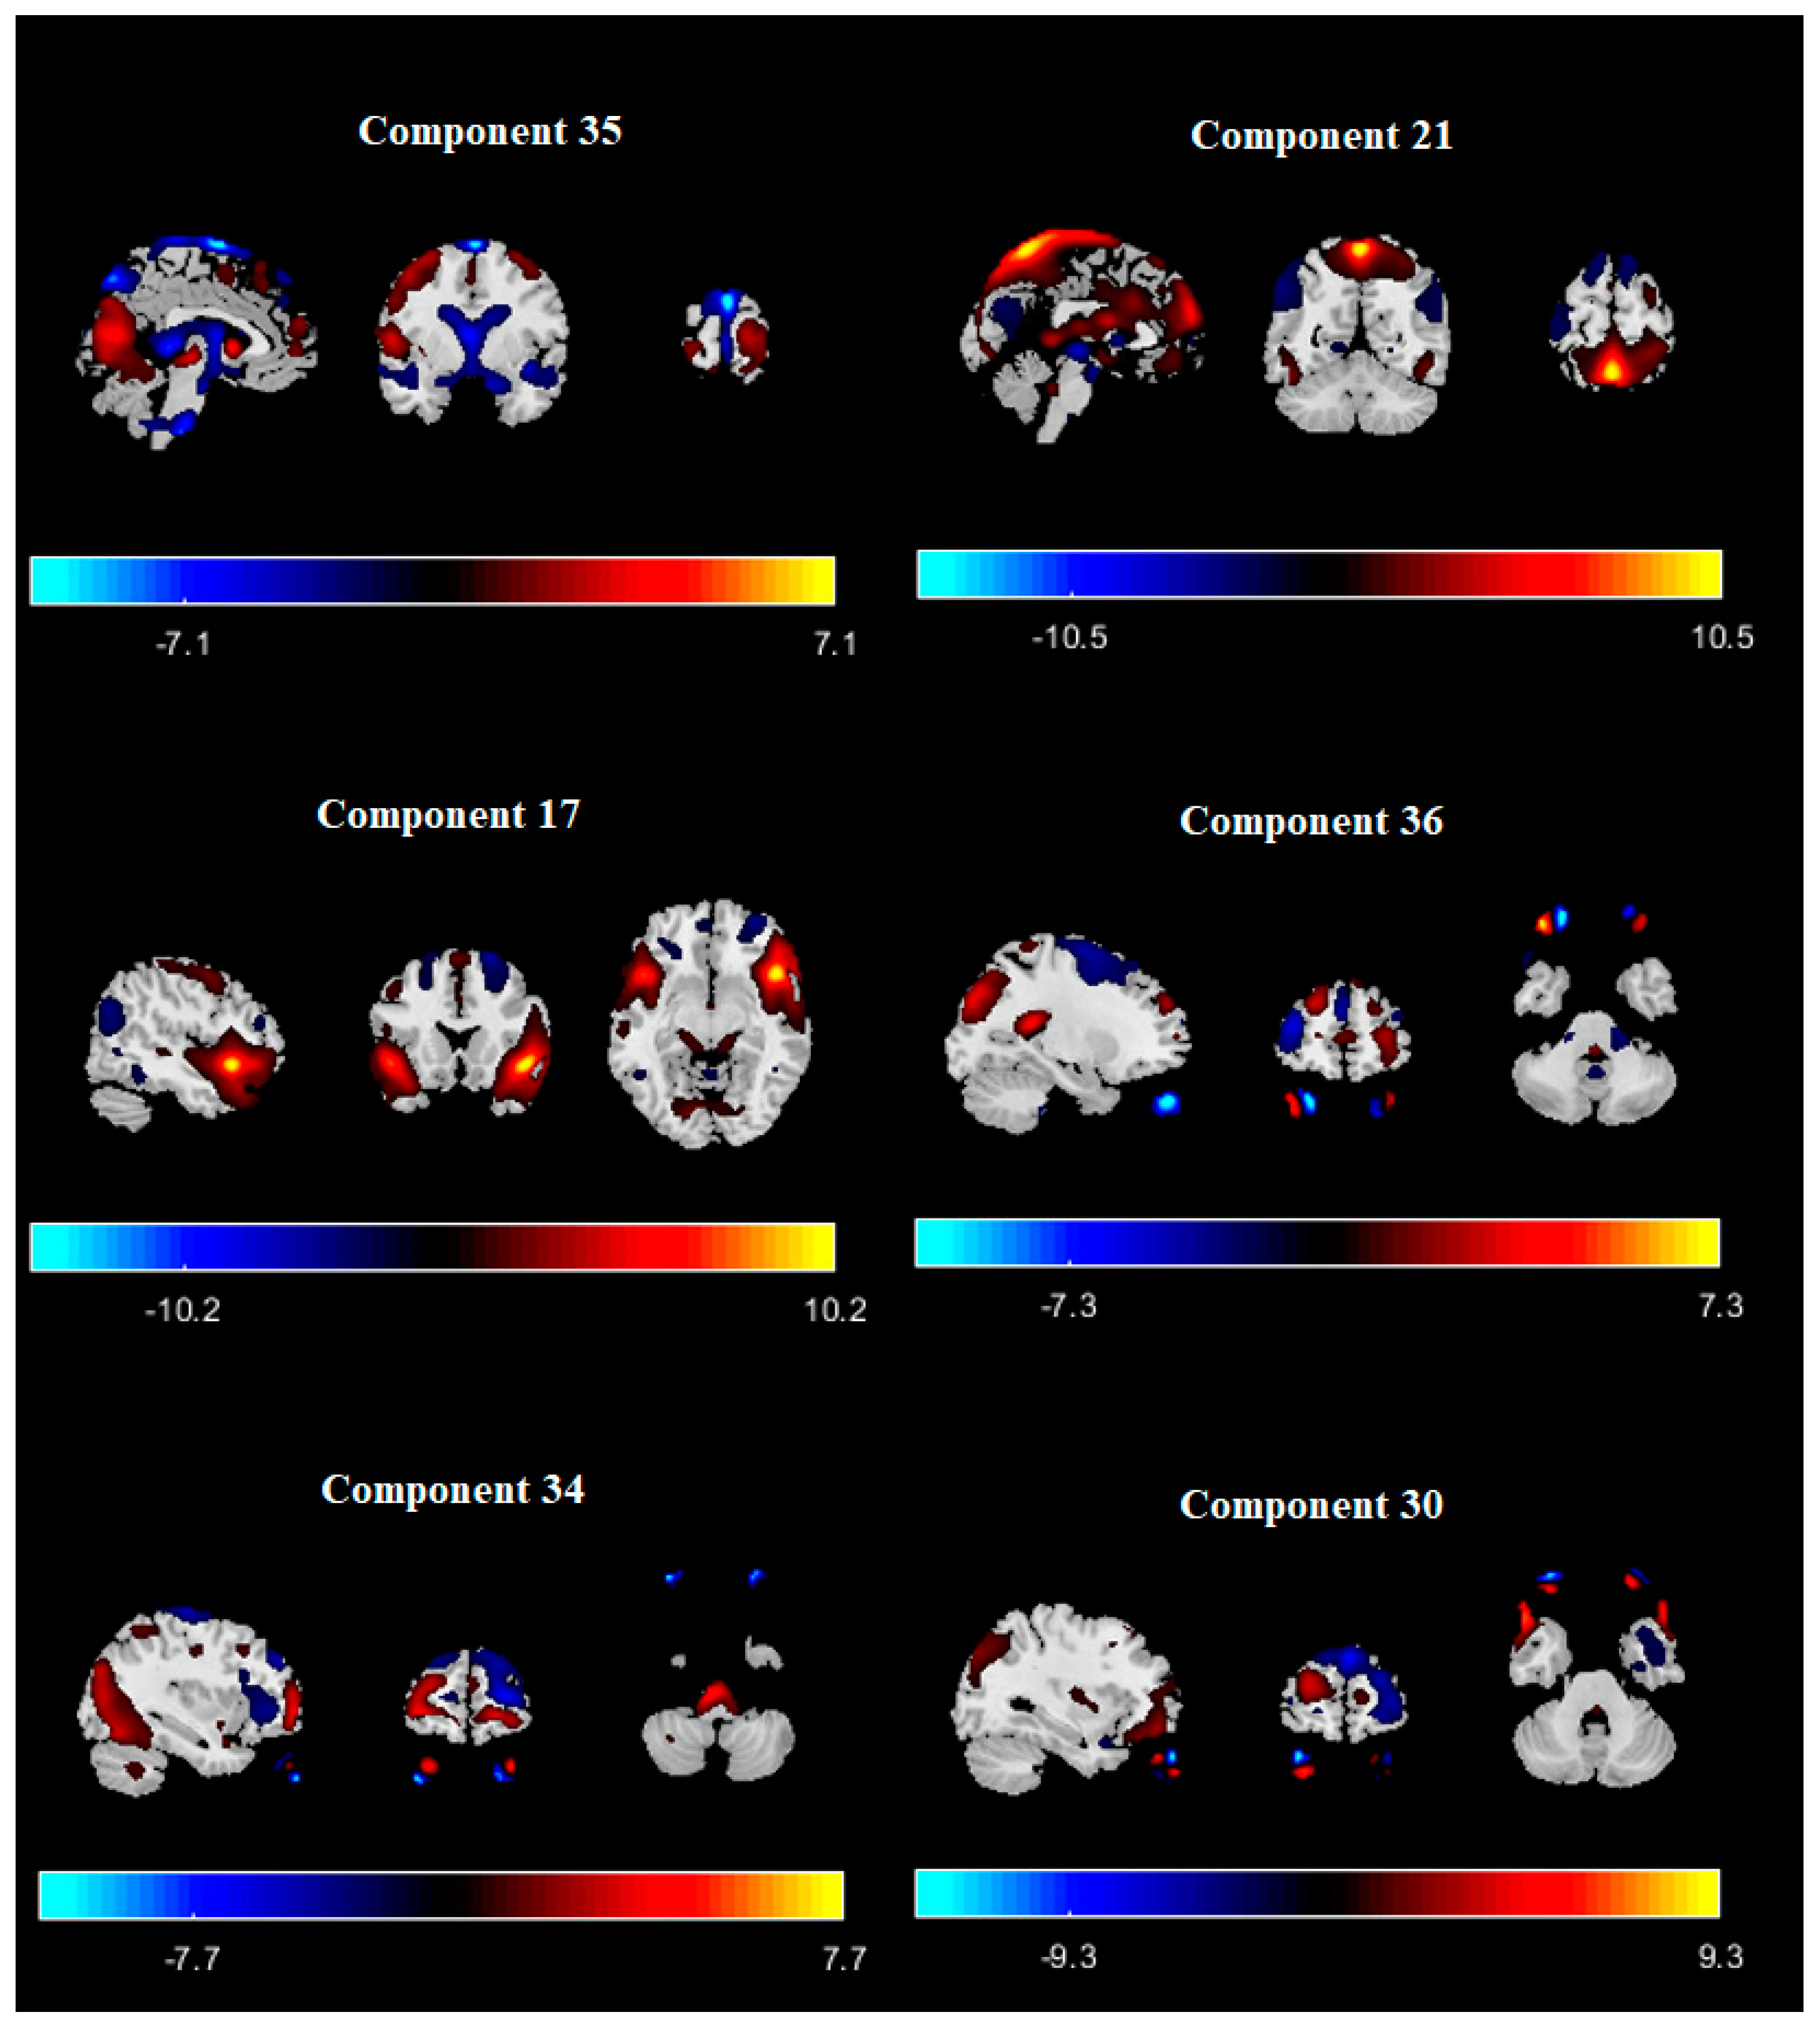
- Calculation of different connections between the graph nodes. Most discriminative nodes are temporal gyrus and frontal gyrus. All main nodes listed in Table 2.
2.3.1. Conventional Independent Component Analysis (ICA)
2.3.2. Spectral ICA
2.3.3. Proposed Modified Spectral ICA Method
2.3.4. Proposed Method for Extraction of Static and Dynamic Brain Connectivity
3. Results
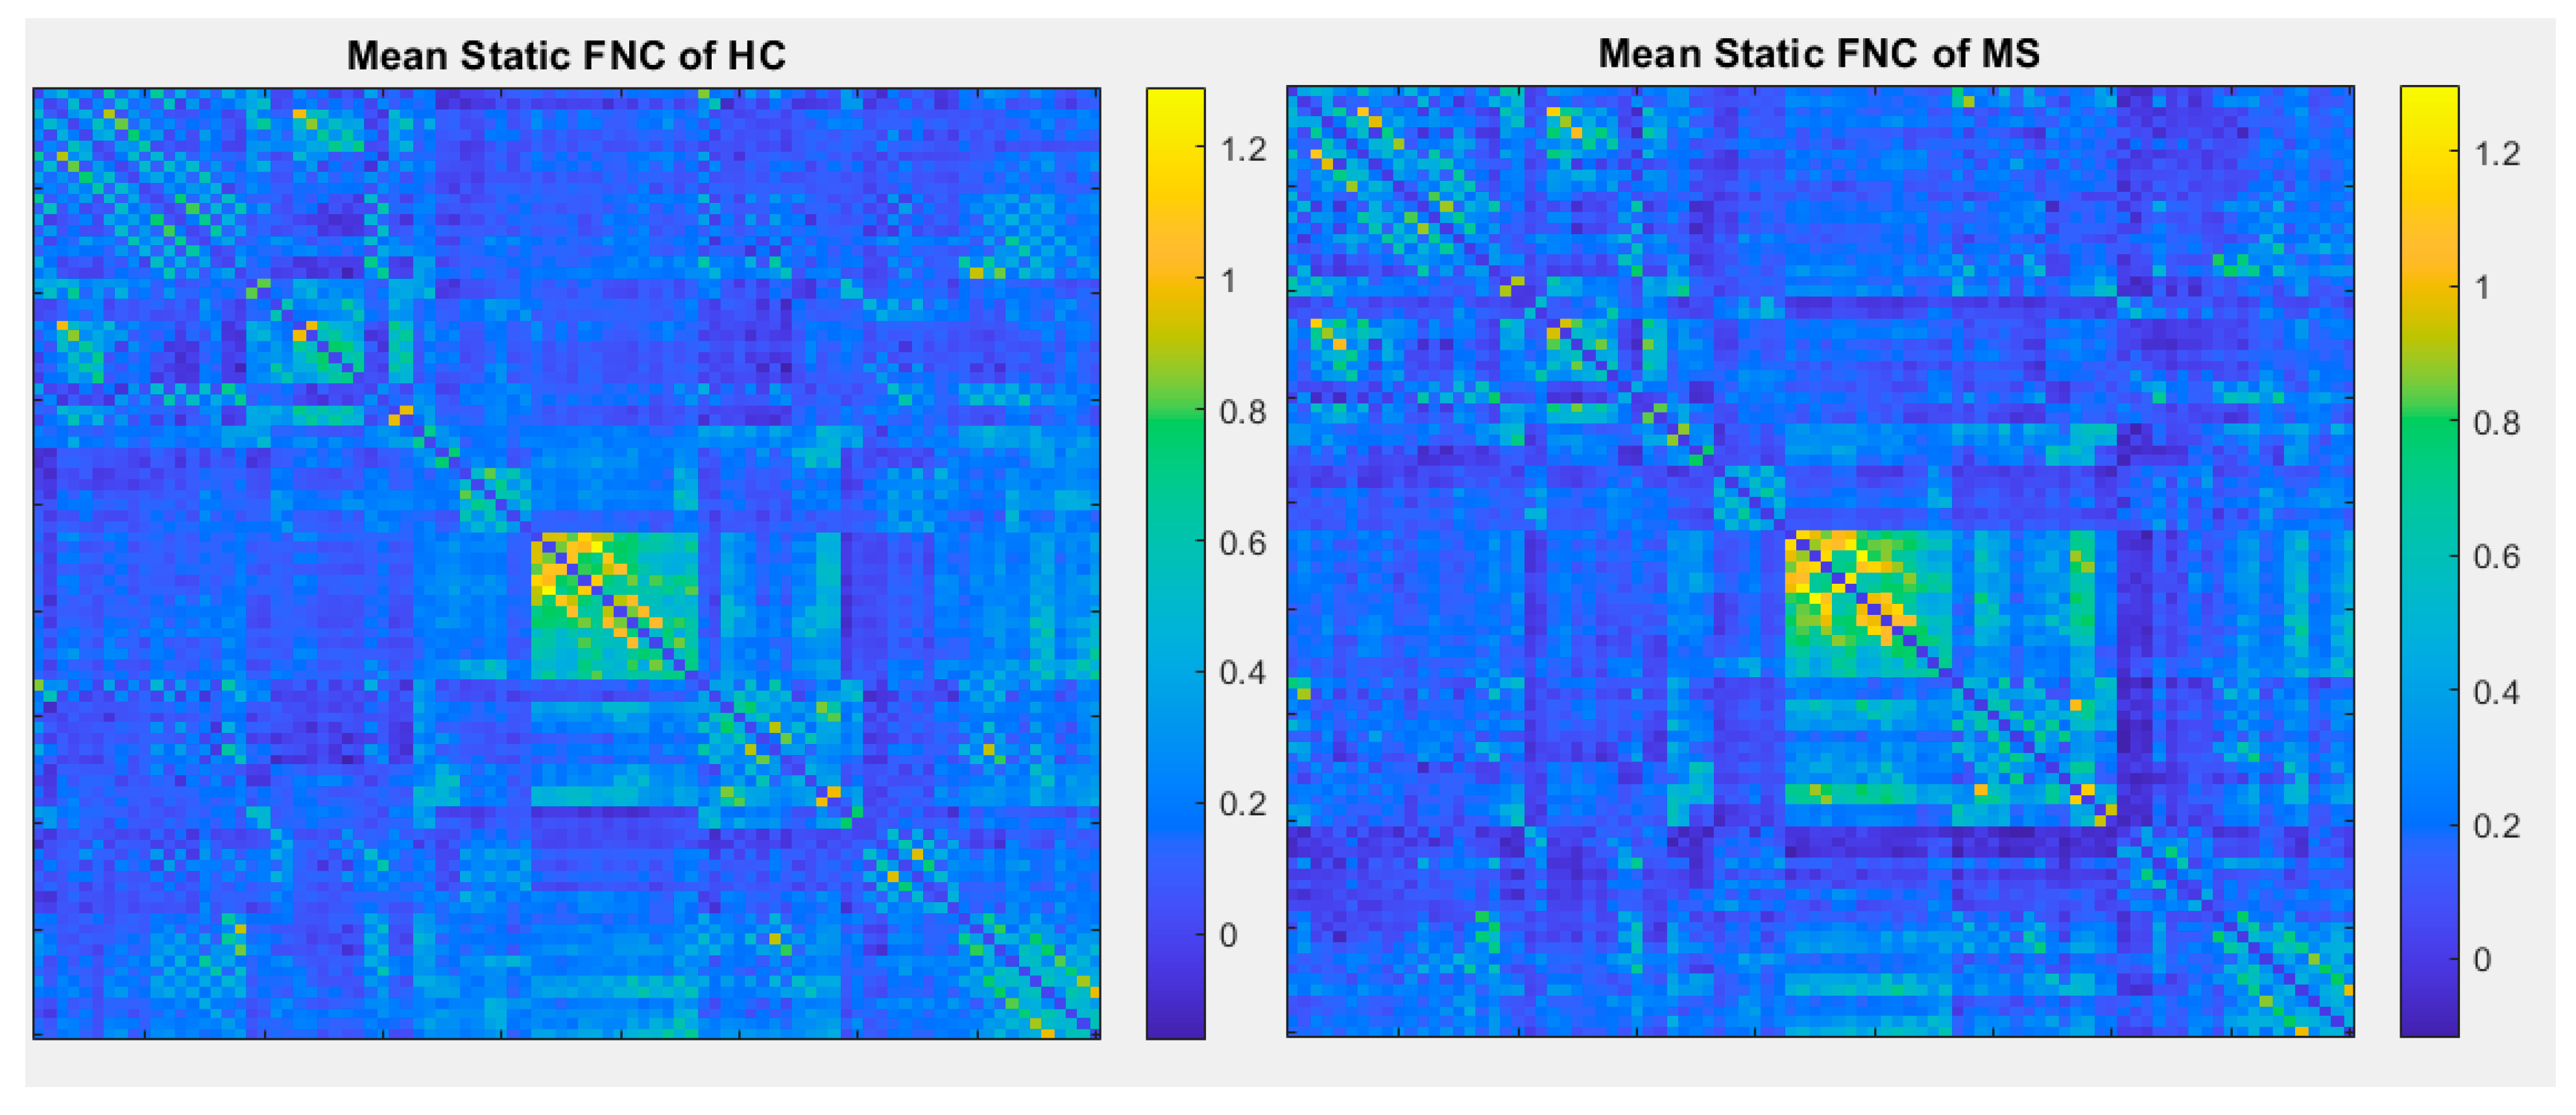
3.1. Modified Spectral ICA and Stationary Connectivity
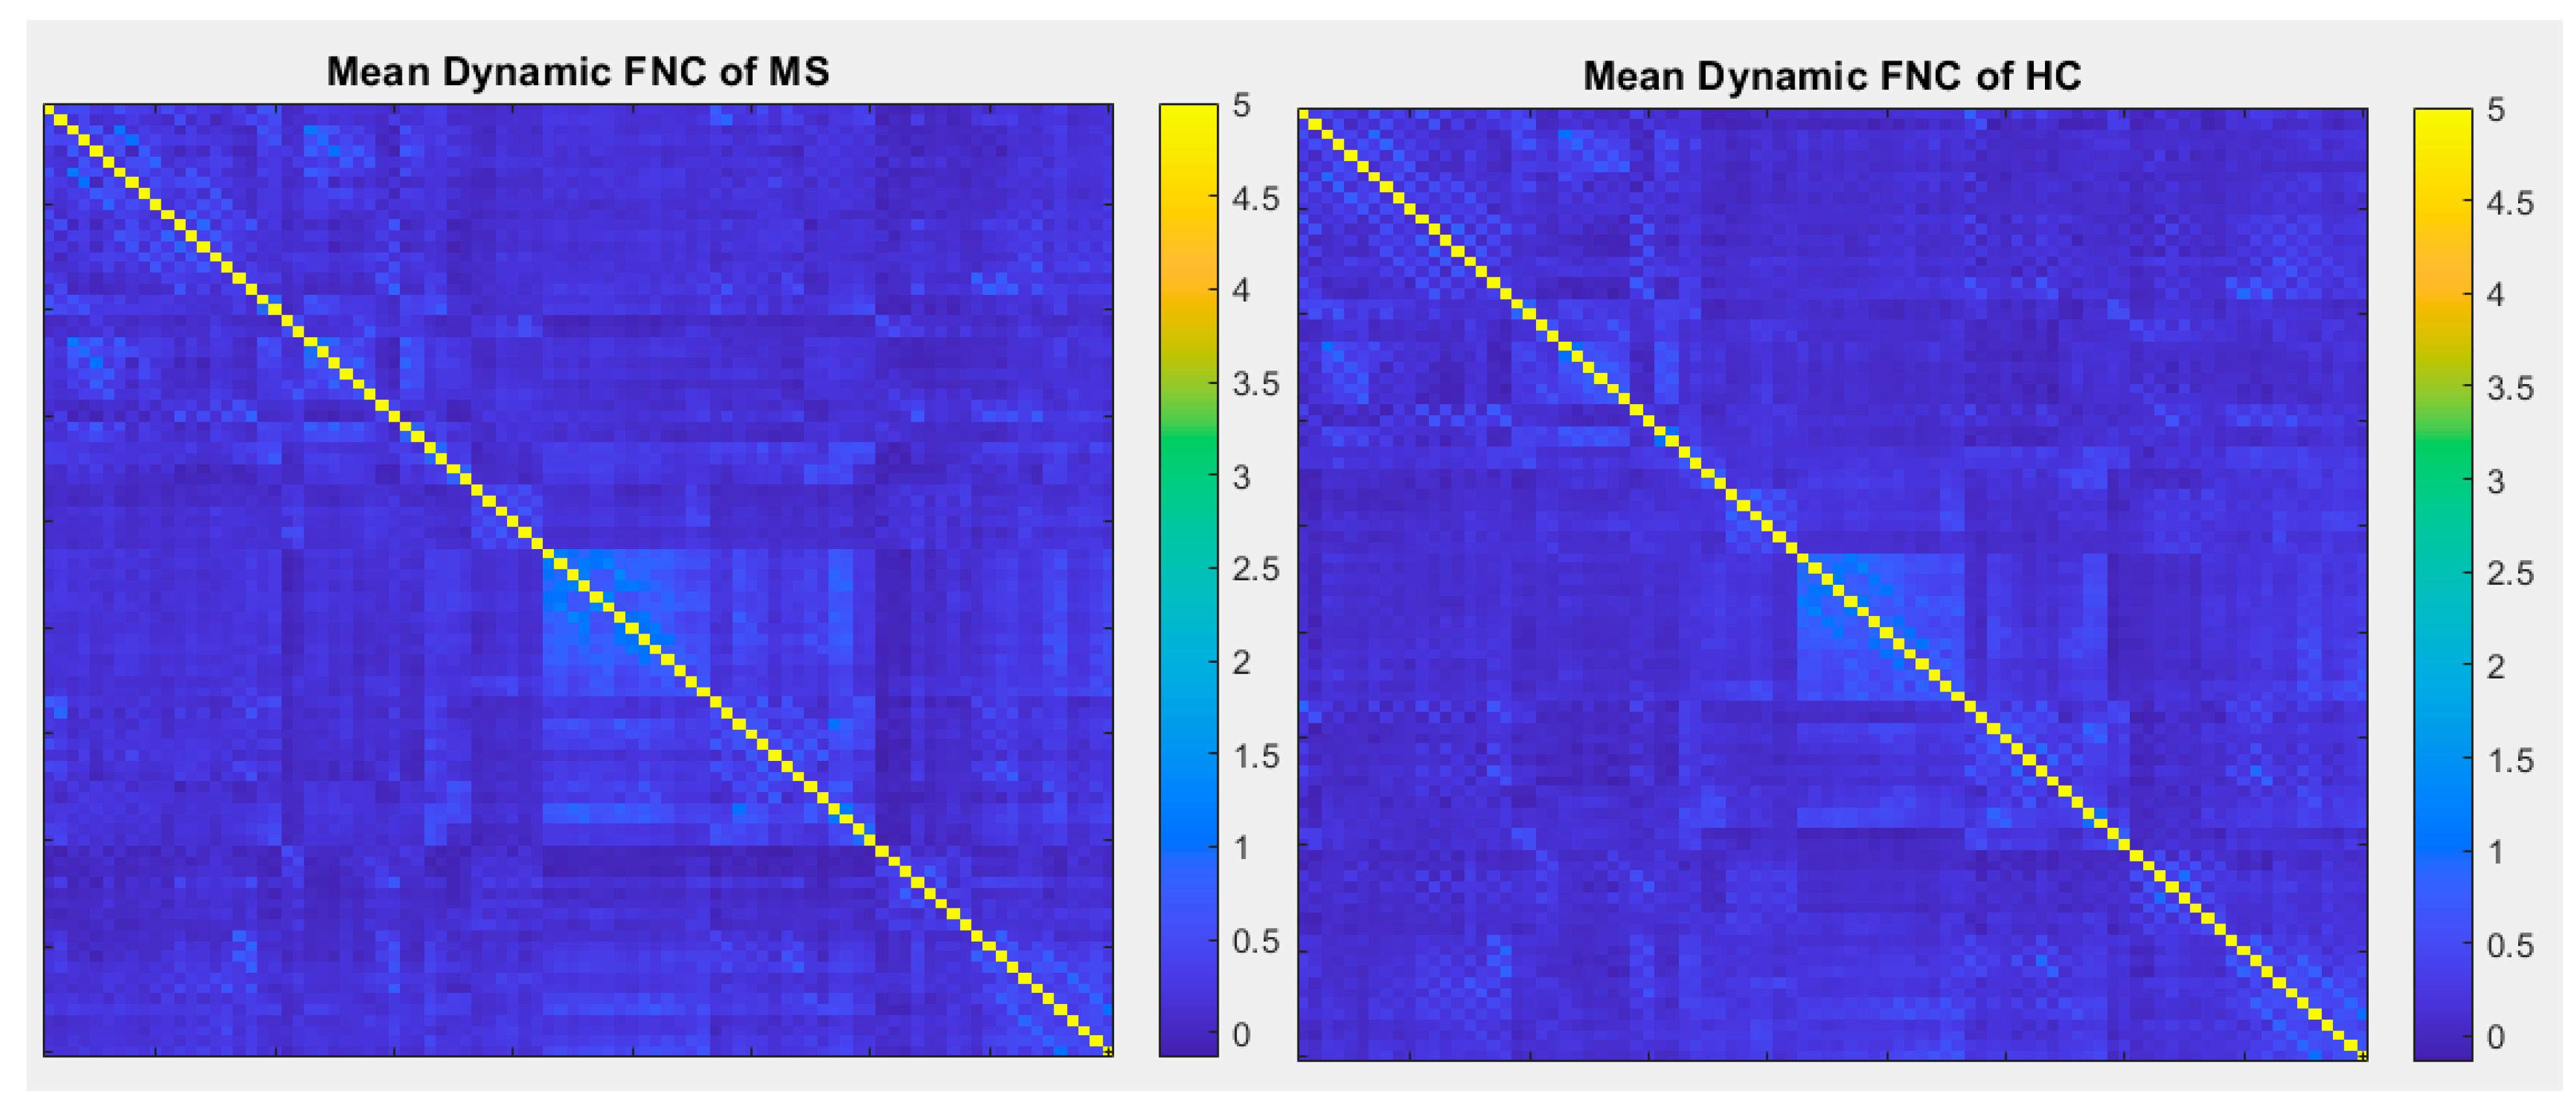
3.2. Dynamic Connectivity and Graph Properties
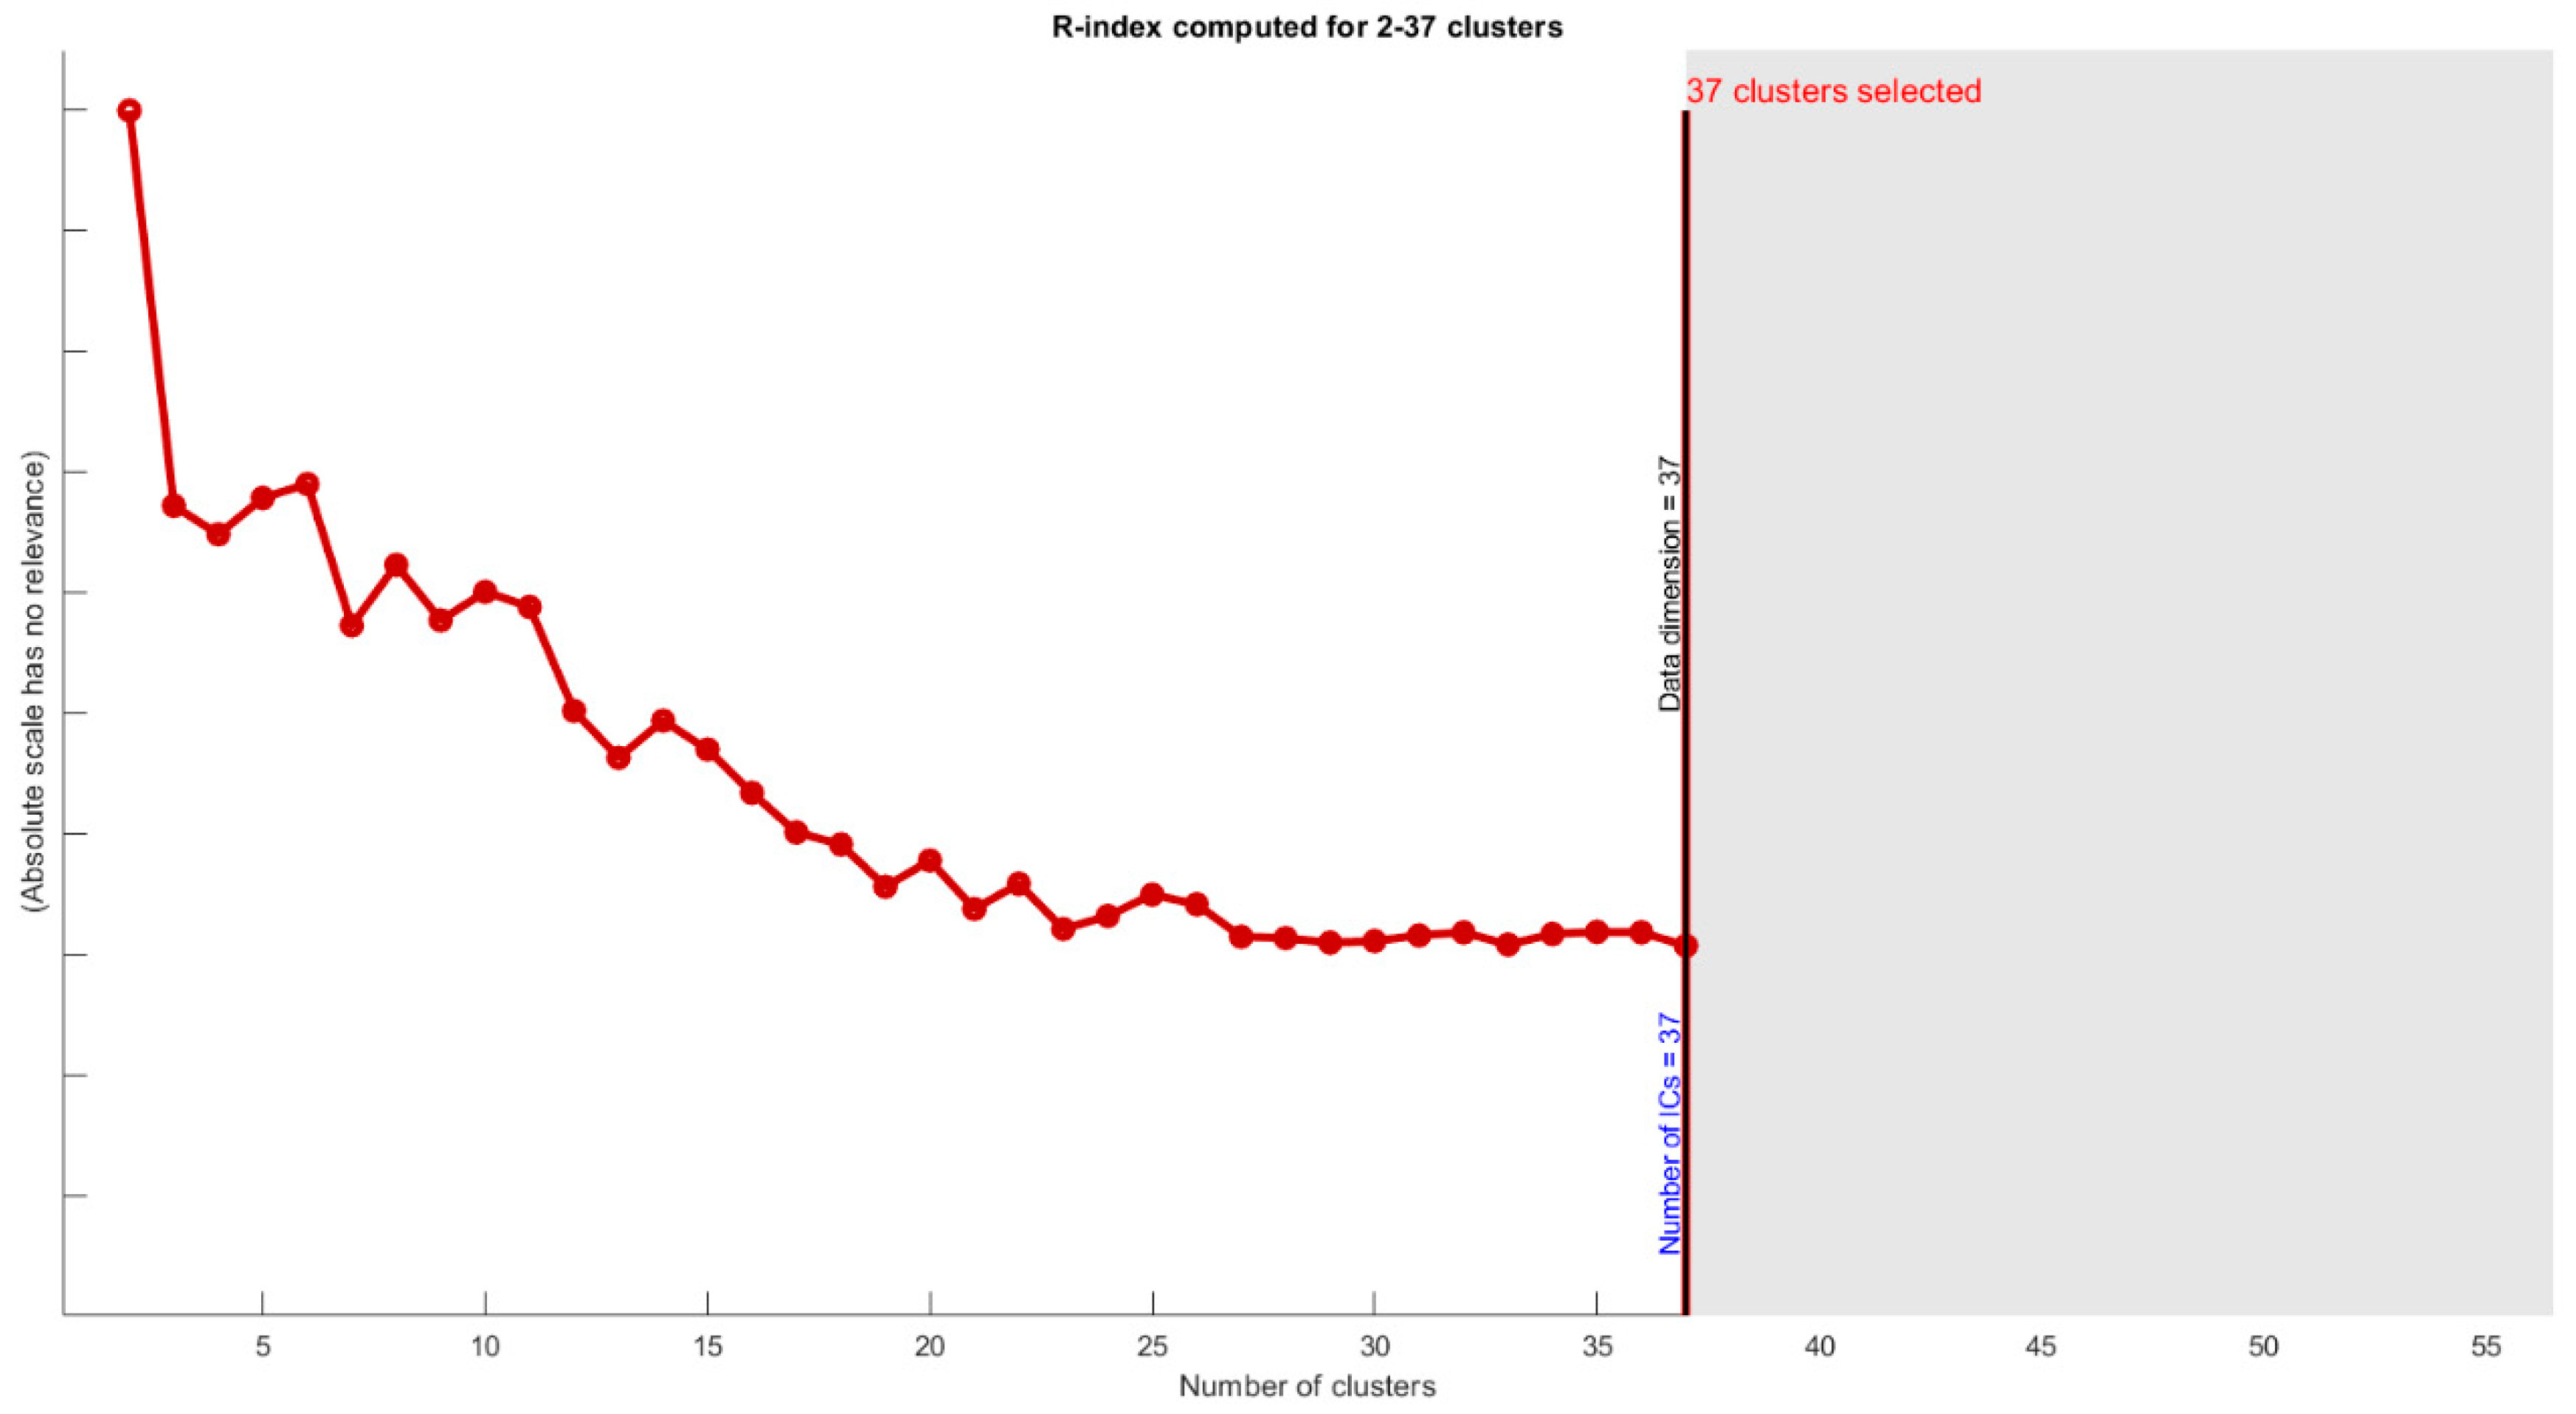
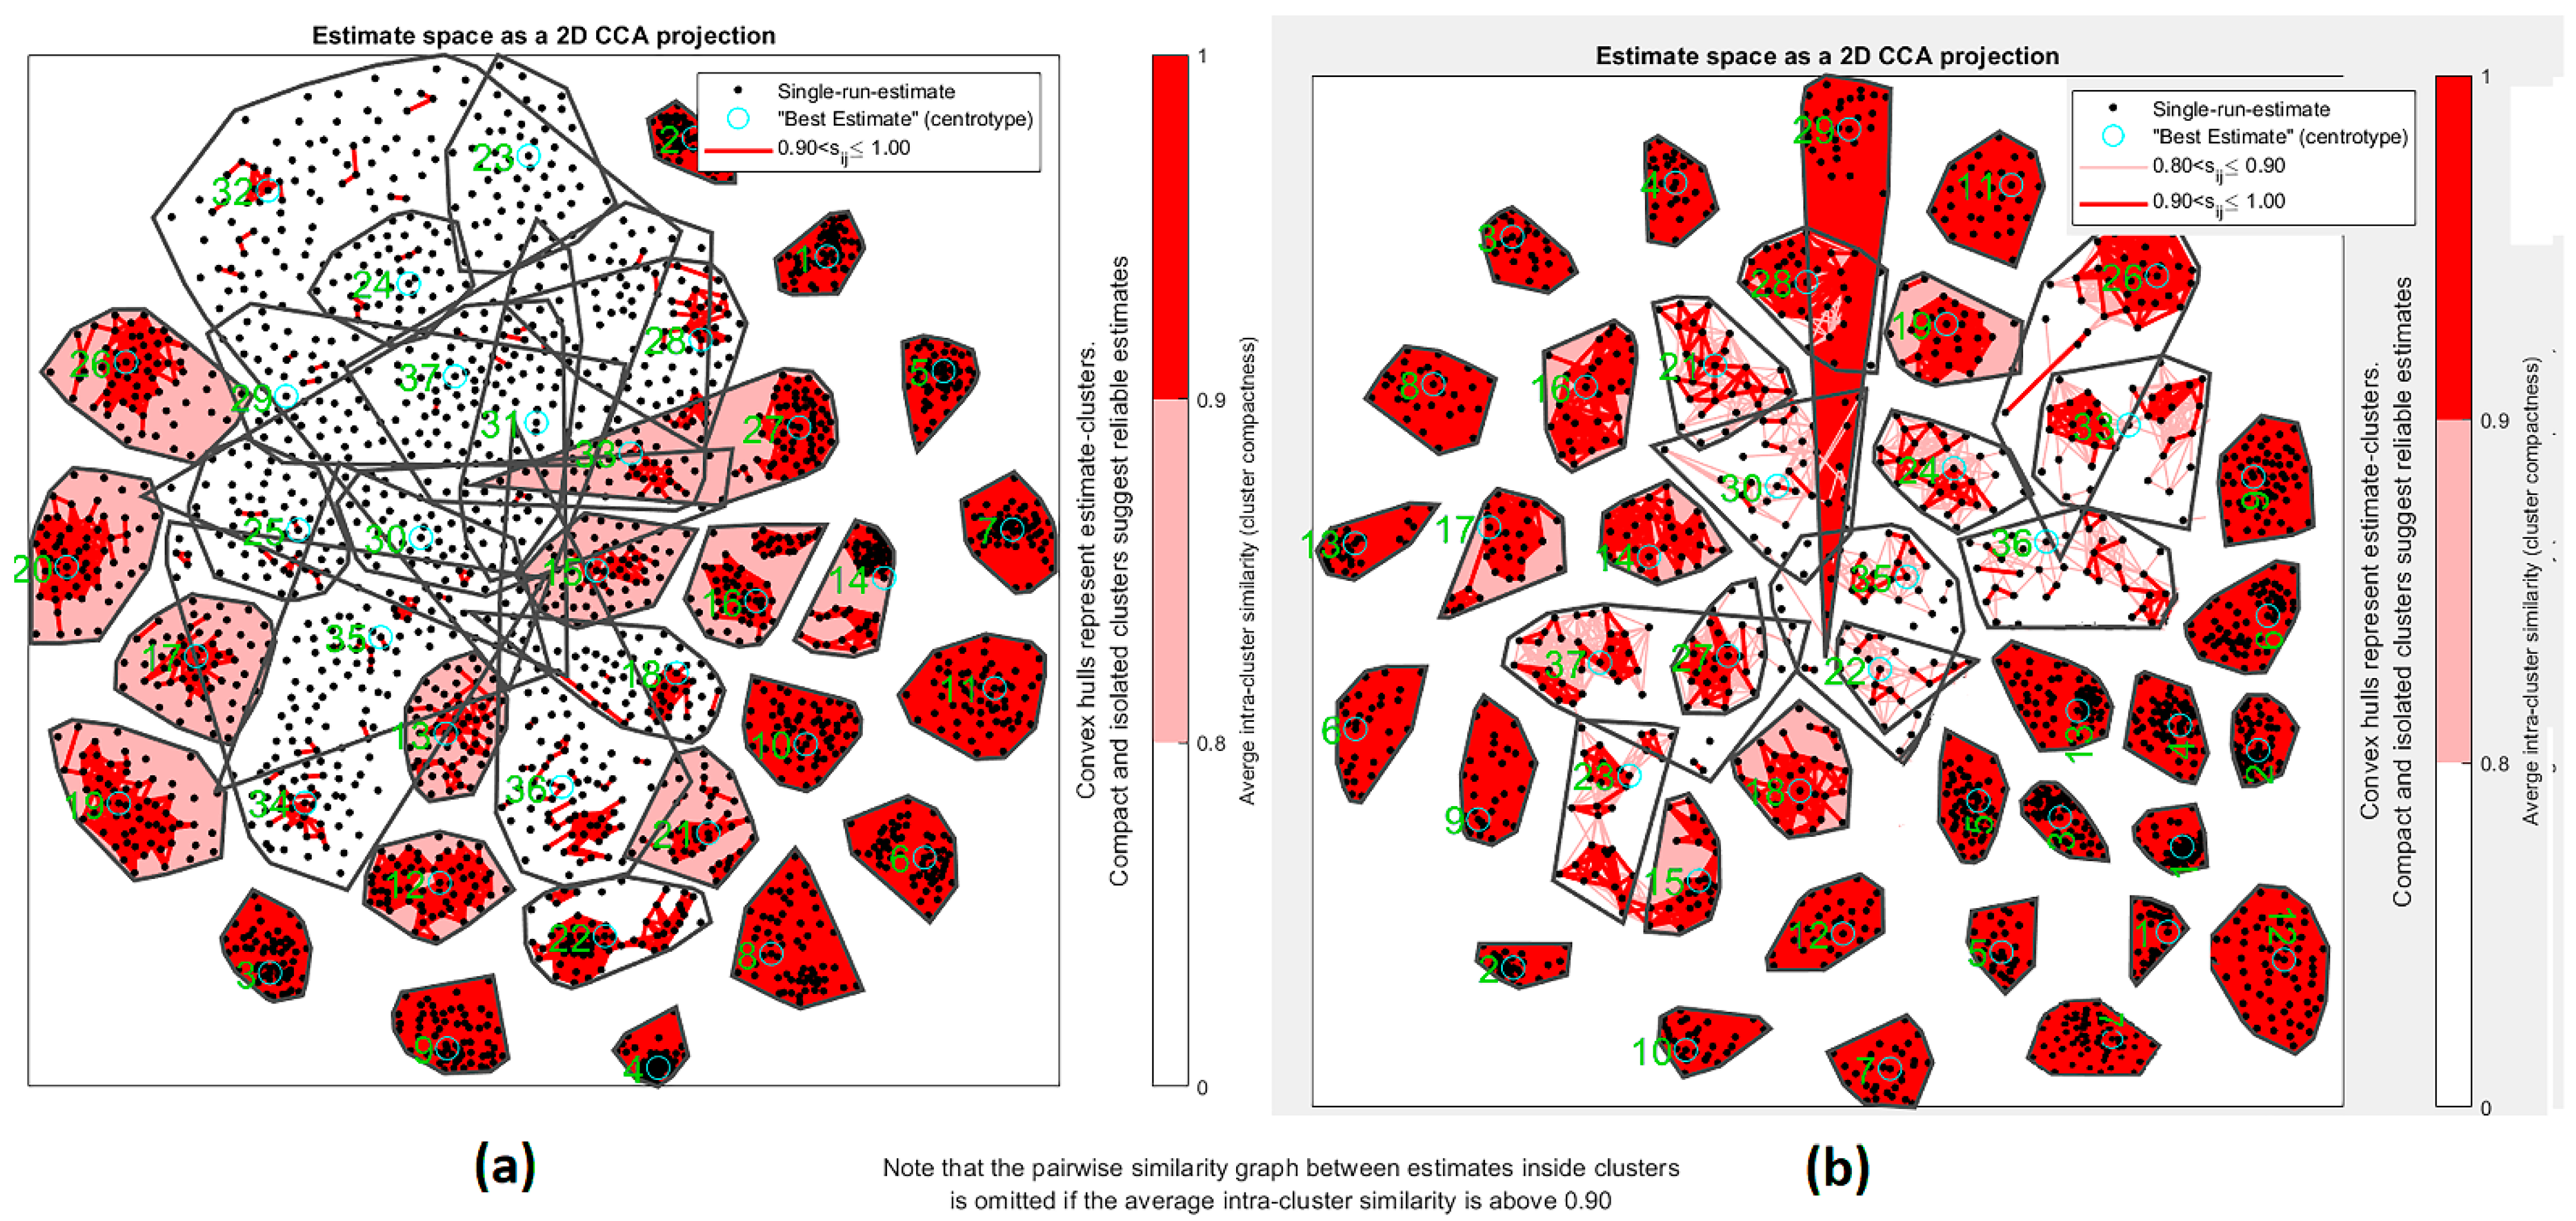
3.3. Assessing Reliability and Stability in ICA for fMRI Data
4. Discussion
Author Contributions
Funding
Institutional Review Board Statement
Informed Consent Statement
Data Availability Statement
Acknowledgments
Conflicts of Interest
Code Availability
References
- Beckmann, C.F.; DeLuca, M.; Devlin, J.T.; Smith, S.M. Investigations into resting-state connectivity using independent component analysis. Philos. Trans. R. Soc. B Biol. Sci. 2005, 360, 1001–1013. [Google Scholar] [CrossRef] [PubMed]
- Pantano, P.; Mainero, C.; Lenzi, D.; Caramia, F.; Iannetti, G.D.; Piattella, M.C.; Pestalozza, I.; Di Legge, S.; Bozzao, L.; Pozzilli, C. A longitudinal fMRI study on motor activity in patients with multiple sclerosis. Brain 2005, 128, 2146–2153. [Google Scholar] [CrossRef] [PubMed]
- Lowe, M.J.; Beall, E.B.; Sakaie, K.E.; Koenig, K.A.; Stone, L.; Marrie, R.A.; Phillips, M.D. Resting state sensorimotor functional connectivity in multiple sclerosis inversely correlates with transcallosal motor pathway transverse diffusivity. Hum. Brain Mapp. 2008, 29, 818–827. [Google Scholar] [CrossRef]
- Audoin, B.; Reuter, F.; Duong, M.V.A.; Malikova, I.; Confort-Gouny, S.; Cherif, A.A.; Cozzone, P.K.; Pelletier, J.; Ranjeva, J.P. Efficiency of cognitive control recruitment in the very early stage of multiple sclerosis: A one-year fMRI follow-up study. Mult. Scler. J. 2008, 14, 786–792. [Google Scholar] [CrossRef] [PubMed]
- Filippi, M.; Riccitelli, G.; Mattioli, F.; Capra, R.; Stampatori, C.; Pagani, E.; Valsasina, P.; Copetti, M.; Falini, A.; Comi, G.; et al. Multiple sclerosis: Effects of cognitive rehabilitation on structural and functional MR imaging measures—An explorative study. Radiology 2012, 262, 932–940. [Google Scholar] [CrossRef]
- Bonavita, S.; Gallo, A.; Sacco, R.; Della Corte, M.; Bisecco, A.; Docimo, R.; Lavorgna, L.; Corbo, D.; Di Costanzo, A.; Tortora, F.; et al. Distributed changes in default-mode resting-state connectivity in multiple sclerosis. Mult. Scler. J. 2011, 17, 411–422. [Google Scholar] [CrossRef] [PubMed]
- Hawellek, D.J.; Hipp, J.F.; Lewis, C.M.; Corbetta, M.; Engel, A.K. Increased functional connectivity indicates the severity of cognitive impairment in multiple sclerosis. Proc. Natl. Acad. Sci. USA 2011, 108, 19066–19071. [Google Scholar] [CrossRef]
- Loitfelder, M.; Filippi, M.; Rocca, M.; Valsasina, P.; Ropele, S.; Jehna, M.; Fuchs, S.; Schmidt, R.; Neuper, C.; Fazekas, F.; et al. Abnormalities of resting state functional connectivity are related to sustained attention deficits in MS. PLoS ONE 2012, 7, e42862. [Google Scholar]
- Faivre, A.; Rico, A.; Zaaraoui, W.; Crespy, L.; Reuter, F.; Wybrecht, D.; Soulier, E.; Malikova, I.; Confort-Gouny, S.; Cozzone, P.J.; et al. Assessing brain connectivity at rest is clinically relevant in early multiple sclerosis. Mult. Scler. J. 2012, 18, 1251–1258. [Google Scholar] [CrossRef]
- Richiardi, J.; Gschwind, M.; Simioni, S.; Annoni, J.-M.; Greco, B.; Hagmann, P.; Schluep, M.; Vuilleumier, P.; Van De Ville, D. Classifying minimally disabled multiple sclerosis patients from resting state functional connectivity. Neuroimage 2012, 62, 2021–2033. [Google Scholar] [CrossRef]
- Rocca, M.A.; Valsasina, P.; Absinta, M.; Moiola, L.; Ghezzi, A.; Veggiotti, P.; Amato, M.P.; Horsfield, M.A.; Falini, A.; Comi, G.; et al. Intranetwork and internetwork functional connectivity abnormalities in pediatric multiple sclerosis. Hum. Brain Mapp. 2014, 35, 4180–4192. [Google Scholar] [CrossRef] [PubMed]
- Tona, F.; Petsas, N.; Sbardella, E.; Prosperini, L.; Carmellini, M.; Pozzilli, C.; Pantano, P. Multiple sclerosis: Altered thalamic resting-state functional connectivity and its effect on cognitive function. Radiology 2014, 271, 814–821. [Google Scholar] [CrossRef] [PubMed]
- Eshaghi, A.; Riyahi-Alam, S.; Saeedi, R.; Roostaei, T.; Nazeri, A.; Aghsaei, A.; Doosti, R.; Ganjgahi, H.; Bodini, B.; Shakourirad, A.; et al. Classification algorithms with multi-modal data fusion could accurately distinguish neuromyelitis optica from multiple sclerosis. NeuroImage Clin. 2015, 7, 306–314. [Google Scholar] [CrossRef]
- Zhong, J.; Nantes, J.C.; Holmes, S.A.; Gallant, S.; Narayanan, S.; Koski, L. Abnormal functional connectivity and cortical integrity influence dominant hand motor disability in multiple sclerosis: A multimodal analysis. Hum. Brain Mapp. 2016, 37, 4262–4275. [Google Scholar] [CrossRef]
- Bonavita, S.; Sacco, R.; Della Corte, M.; Esposito, S.; Sparaco, M.; D’Ambrosio, A.; Docimo, R.; Bisecco, A.; Lavorgna, L.; Corbo, D.; et al. Computer-aided cognitive rehabilitation improves cognitive performances and induces brain functional connectivity changes in relapsing remitting multiple sclerosis patients: An exploratory study. J. Neurol. 2015, 262, 91–100. [Google Scholar] [CrossRef] [PubMed]
- Pfaff, L.; Lamy, J.; Noblet, V.; Gounot, D.; Chanson, J.-B.; de Seze, J.; Blanc, F. Emotional disturbances in multiple sclerosis: A neuropsychological and fMRI study. Cortex 2019, 117, 205–216. [Google Scholar] [CrossRef] [PubMed]
- Fleischer, V.; Muthuraman, M.; Anwar, A.R.; Gonzalez-Escamilla, G.; Radetz, A.; Gracien, R.-M.; Bittner, S.; Luessi, F.; Meuth, S.G.; Zipp, F.; et al. Continuous reorganization of cortical information flow in multiple sclerosis: A longitudinal fMRI effective connectivity study. Sci. Rep. 2020, 10, 806. [Google Scholar] [CrossRef]
- Temniy, A.; Markin, K.; Poplyak, M.; Trufanov, A.; Tarumov, D.; Litvinenko, I. Depression in multiple sclerosis: RS-FMRI research. Eur. Psychiatry 2021, 64, S90. [Google Scholar] [CrossRef]
- Adalı, T.; Anderson, M.; Fu, G. Diversity in independent component and vector analyses: Identifiability, algorithms, and applications in medical imaging. IEEE Signal Process. Mag. 2014, 31, 18–33. [Google Scholar] [CrossRef]
- Lee, J.-H.; Lee, T.-W.; Jolesz, F.A.; Yoo, S.-S. Independent vector analysis (IVA): Multivariate approach for fMRI group study. Neuroimage 2008, 40, 86–109. [Google Scholar] [CrossRef]
- Anderson, M.; Li, X.-L.; Adalı, T. Complex-valued independent vector analysis: Application to multivariate Gaussian model. Signal Process. 2012, 92, 1821–1831. [Google Scholar] [CrossRef]
- Droby, A.; Lukas, C.; Schänzer, A.; Spiwoks-Becker, I.; Giorgio, A.; Gold, R.; De Stefano, N.; Kugel, H.; Deppe, M.; Wiendl, H.; et al. A human post-mortem brain model for the standardization of multi-centre MRI studies. Neuroimage 2015, 110, 11–21. [Google Scholar] [CrossRef] [PubMed]
- Penner, I.-K.; Raselli, C.; Stöcklin, M.; Opwis, K.; Kappos, L.; Calabrese, P. The Fatigue Scale for Motor and Cognitive Functions (FSMC): Validation of a new instrument to assess multiple sclerosis-related fatigue. Mult. Scler. J. 2009, 15, 1509–1517. [Google Scholar] [CrossRef] [PubMed]
- Comon, P. Independent component analysis, a new concept? Signal Process. 1994, 36, 287–314. [Google Scholar] [CrossRef]
- Singer, A. Spectral independent component analysis. Appl. Comput. Harmon. Anal. 2006, 21, 135–144. [Google Scholar] [CrossRef]
- Bell, A.J.; Sejnowski, T.J. An information-maximization approach to blind separation and blind deconvolution. Neural Comput. 1995, 7, 1129–1159. [Google Scholar] [CrossRef]
- Rachakonda, S.; Egolf, E.; Correa, N.; Calhoun, V. Group ICA of fMRI toolbox (GIFT) manual. Dostupnez; [cit 2011-11-5]; GIFTS Software, Inc.: New York, NY, USA, 2007. [Google Scholar]
- Allen, E.A.; Damaraju, E.; Plis, S.M.; Erhardt, E.B.; Eichele, T.; Calhoun, V.D. Tracking whole-brain connectivity dynamics in the resting state. Cereb. Cortex 2014, 24, 663–676. [Google Scholar] [CrossRef]
- Rubinov, M.; Kötter, R.; Hagmann, P.; Sporns, O. Brain connectivity toolbox: A collection of complex network measurements and brain connectivity datasets. NeuroImage 2009, 47, S169. [Google Scholar] [CrossRef]
- Himberg, J.; Hyvarinen, A. Icasso: Software for investigating the reliability of ICA estimates by clustering and visualization. In Proceedings of the 2003 IEEE XIII Workshop on Neural Networks for Signal Processing (IEEE Cat. No. 03TH8718), Toulouse, France, 17–19 September 2003; IEEE: Pistacaway, NJ, USA, 2003; pp. 259–268. [Google Scholar]
- Yu, Q.; Erhardt, E.B.; Sui, J.; Du, Y.; He, H.; Hjelm, D.; Cetin, M.S.; Rachakonda, S.; Miller, R.L.; Pearlson, G.; et al. Assessing dynamic brain graphs of time-varying connectivity in fMRI data: Application to healthy controls and patients with schizophrenia. Neuroimage 2015, 107, 345–355. [Google Scholar] [CrossRef]
- De Reus, M.A.; Van den Heuvel, M.P. The parcellation-based connectome: Limitations and extensions. Neuroimage 2013, 80, 397–404. [Google Scholar] [CrossRef]
- Fornito, A.; Zalesky, A.; Breakspear, M. Graph analysis of the human connectome: Promise, progress, and pitfalls. Neuroimage 2013, 80, 426–444. [Google Scholar] [CrossRef] [PubMed]
- Liu, Y.; Liang, M.; Zhou, Y.; He, Y.; Hao, Y.; Song, M.; Yu, C.; Liu, H.; Liu, Z.; Jiang, T. Disrupted small-world networks in schizophrenia. Brain 2008, 131, 945–961. [Google Scholar] [CrossRef] [PubMed]
- Bassett, D.S.; Nelson, B.G.; Mueller, B.A.; Camchong, J.; Lim, K.O. Altered resting state complexity in schizophrenia. Neuroimage 2012, 59, 2196–2207. [Google Scholar] [CrossRef] [PubMed]
- M.-Lynall, E.; Cammoun, L.; Gigandet, X.; Meuli, R.; Honey, C.; Wedeen, V.J.; Sporns, O. Functional connectivity and brain networks in schizophrenia. J. Neurosci. 2010, 30, 9477–9487. [Google Scholar] [CrossRef] [PubMed]
- Fornito, A.; Zalesky, A.; Bullmore, E.T. Network scaling effects in graph analytic studies of human resting-state FMRI data. Front. Syst. Neurosci. 2010, 4, 22. [Google Scholar] [CrossRef]
- Hagmann, P.; Cammoun, L.; Gigandet, X.; Meuli, R.; Honey, C.; Wedeen, V.J.; Sporns, O. Mapping the structural core of human cerebral cortex. PLoS Biol. 2008, 6, e159. [Google Scholar] [CrossRef]
- Buckner, R.L.; Sepulcre, J.; Talukdar, T.; Krienen, F.M.; Liu, H.; Hedden, T.; Andrews-Hanna, J.R.; Sperling, R.A.; Johnson, K.A. Cortical hubs revealed by intrinsic functional connectivity: Mapping, assessment of stability, and relation to Alzheimer’s disease. J. Neurosci. 2009, 29, 1860–1873. [Google Scholar] [CrossRef]
- Eguiluz, V.M.; Chialvo, D.R.; Cecchi, G.A.; Baliki, M.; Apkarian, A.V. Scale-free brain functional networks. Phys. Rev. Lett. 2005, 94, 018102. [Google Scholar] [CrossRef]
- Craddock, R.C.; James, G.A.; Holtzheimer, P.E., III; Hu, X.P.; Mayberg, H.S. A whole brain fMRI atlas generated via spatially constrained spectral clustering. Hum. Brain Mapp. 2012, 33, 1914–1928. [Google Scholar] [CrossRef]
- Shirer, W.R.; Ryali, S.; Rykhlevskaia, E.; Menon, V.; Greicius, M.D. Decoding subject-driven cognitive states with whole-brain connectivity patterns. Cereb. Cortex 2012, 22, 158–165. [Google Scholar] [CrossRef]
- Smith, S.M.; Miller, K.L.; Salimi-Khorshidi, G.; Webster, M.; Beckmann, C.F.; Nichols, T.E.; Ramsey, J.D.; Woolrich, M.W. Network modelling methods for FMR. Neuroimage 2011, 54, 875–891. [Google Scholar] [CrossRef] [PubMed]
- Sui, J.; Huster, R.; Yu, Q.; Segall, J.M.; Calhoun, V.D. Function–structure associations of the brain: Evidence from multimodal connectivity and covariance studies. NeuroImage 2014, 102, 11–23. [Google Scholar] [CrossRef] [PubMed]
- Calhoun, V.D.; Eichele, T.; Adalı, T.; Allen, E.A. Decomposing the brain: Components and modes, networks and nodes. Trends Cogn. Sci. 2012, 16, 255–256. [Google Scholar] [CrossRef]
- Yu, Q.; Plis, S.M.; Erhardt, E.B.; Allen, E.A.; Sui, J.; Kiehl, K.A.; Pearlson, G.; Calhoun, V.D. Modular Organization of Functional Network Connectivity in Healthy Controls and Patients with Schizophrenia during the Resting State. Front. Syst. Neurosci. Orig. Res. 2012, 5, 103. [Google Scholar] [CrossRef]
- Yu, Q.; Sui, J.; Rachakonda, S.; He, H.; Pearlson, G.; Calhoun, V. Altered Small-World Brain Networks in Temporal Lobe in Patients with Schizophrenia Performing an Auditory Oddball Task. Front. Syst. Neurosci. Orig. Res. 2011, 5, 7. [Google Scholar] [CrossRef] [PubMed]
- Allen, E.A.; Erhardt, E.B.; Damaraju, E.; Gruner, W.; Segall, J.M.; Silva, R.F.; Havlicek, M.; Rachakonda, S.; Fries, J.; Kalyanam, R.; et al. A Baseline for the Multivariate Comparison of Resting-State Networks. Front. Syst. Neurosci. Orig. Res. 2011, 5, 2. [Google Scholar] [CrossRef]
- Fu, Z.; Di, X.; Chan, S.; Hung, Y.; Biswal, B.B.; Zhang, Z. Time-varying correlation coefficients estimation and its application to dynamic connectivity analysis of fMRI. In Proceedings of the 35th Annual International Conference of the IEEE Engineering in Medicine and Biology Society (EMBC), Osaka, Japan, 3–7 July 2013; IEEE: Pistacaway, NJ, USA, 2013; pp. 2944–2947. [Google Scholar]
- Hutchison, R.M.; Womelsdorf, T.; Allen, E.A.; Bandettini, P.A.; Calhoun, V.D.; Corbetta, M.; Della Penna, S.; Duyn, J.H.; Glover, G.H.; Gonzalez-Castillo, J.; et al. Dynamic functional connectivity: Promise, issues, and interpretations. NeuroImage 2013, 80, 360–378. [Google Scholar] [CrossRef]
- Sakoğlu, U.; Pearlson, G.D.; Kiehl, K.A.; Wang, Y.M.; Michael, A.M.; Calhoun, V.D. A method for evaluating dynamic functional network connectivity and task-modulation: Application to schizophreni. Magn. Reson. Mater. Phys. Biol. Med. 2010, 23, 351–366. [Google Scholar] [CrossRef]
- Jones, D.T.; Vemuri, P.; Murphy, M.C.; Gunter, J.L.; Senjem, M.L.; Machulda, M.M.; Przybelski, S.A.; Gregg, B.E.; Kantarci, K.; Knopman, D.S.; et al. Non-Stationarity in the “Resting Brain’s” Modular Architecture. PLoS ONE 2012, 7, e39731. [Google Scholar] [CrossRef]
- Wee, C.-Y.; Yang, S.; Yap, P.-T.; Shen, D. Sparse temporally dynamic resting-state functional connectivity networks for early MCI identification. Brain Imaging Behav. 2016, 10, 342–356. [Google Scholar] [CrossRef] [Green Version]


| Group Study | Number of Subjects | Dataset | Method | Follow-Up | Year |
|---|---|---|---|---|---|
| RRMS and MS | 16 patients with RRMS and 2 patients with possible MS 9 HC | Task fMRI T2-LL T1-LL | Simple motor task | 15–26 months | Pantano 2014 [2] |
| MS | MS (11 cases) HC (9 cases) | rs-fMRI Task fMRI DTI | Cross-correlation Fiber tracking | --- | Mark J. Lowe 2008 [3] |
| RRMS | 13 patients with early RRMS 19 HC | rs-fMRI T1, T2 | PASAT | 12 months | B. Audoin 2008 [4] |
| RRMS | 20 patients with RRMS | rs-fMRI GM volumes and WM architecture | Stroop task and rs-fMRI | 12 weeks | M. Filippi 2012 [5] |
| RRMS | MS (18 cases) HC (18 cases) | rs-fMRI | VBM SEINA 1 | --- | Bonavita 2011 [6] |
| MS | MS (16 cases) HC (16 cases) | rs-fMRI DTI | SIENA TBSS 2 | --- | Hawellek 2011 [7] |
| MS | MS (31 cases) HC (31 cases) | rs-fMRI | FEW 3 | --- | Loitfelder 2012 [8] |
| Early RRMS | MS (13 cases) HC (14 cases) | rs-fMRI | ICA | --- | Faivre 2012 [9] |
| First-stage MS | MS (22 cases) HC (14 cases) | rs-fMRI | Graph connectivity | --- | Richiardi 2012 [10] |
| Different MS | MS (42 cases) HC (42 cases) | Task fMRI | Correlation | 6 months | Rocca 2014 [11] |
| RRMS | MS (55 cases) HC (24 cases) | rs-fMRI | Correlation | 12 months | Tona 2014 [12] |
| MS and NMO | NMO (30 cases) MS (25 cases) HC (35 cases) | rs-fMRI DTI T1, T2 | Cross-correlation FA analysis Cortical thickness Analysis | --- | Eshaghi 2015 [13] |
| MS | MS (43 cases) HC (20 cases) | rs-fMRI T1, T2 | Correlation Lesion segmentation | --- | Zhong 2016 [14] |
| RRMS and MS | 18 cognitively impaired patients with RRMS Control group: 14 cognitively impaired patients with MS | NBV T2-LL rs-fMRI | FSL | 8 weeks | S Bonavita 2015 [15] |
| MS | MS (27 cases) HC (27 cases) | Task fMRI | SPM | --- | L Pfaff 2019 [16] |
| RRMS | MS (12 cases) HC (12 cases) | RS fMRI | CONN toolbox | 12 months | V Fleischer 2020 [17] |
| RRMS and SPMS | 40 patients with RRMS and 28 patients with possible SPMS 4 | RS fMRI | CONN toolbox | --- | A Temniy 2021 [18] |
| Brain Areas | BA | Max t-Score | (x, y, z) |
|---|---|---|---|
| MS < HCs | |||
| Inferior Temporal Gyrus | 20 | 4.6 | (−57, −36, −21) |
| Superior Parietal Lobule | 7 | 3.6 | (36, −57, 51) |
| Middle Temporal Gyrus | 21, 22 | 5.1 | (63, −45, 3) |
| Inferior Parietal Lobule | 40 | 3.7 | (51, −39, 60) |
| Lingual Gyrus | 18 | 3.8 | (3, −90, −6) |
| MS > HCs | |||
| Medial Frontal Gyrus | 10 | 17.1 | (−6, 63, 6) |
| Superior Frontal Gyrus | 10 | 8.1 | (−12, 69, 3) |
| Anterior Cingulate | 25 | 3.7 | (−3, 18, −3) |
| Caudate | - | 10.4 | (−6, 12, 9) |
| Lateral Ventricle | - | 8.6 | (−3, 6, 9) |
| Medial Frontal Gyrus | 10, 11 | 9.8 | (−6, 60, −12) |
| Superior Temporal Gyrus | 38 | 6.7 | (−45, 21, −27) |
| Inferior Temporal Gyrus and Fusiform Gyrus | 37 | 4.3 | (−54, −60, −12) |
| Cuneus | 18 | 4.7 | (−9, −96, 15) |
| Inferior Frontal Gyrus | 10, 46 | 4.5 | (−54, 21, 24) |
| Proposed ICA | Infomax ICA | |||
|---|---|---|---|---|
| Component Number | Dynamic Range | fALFF | Dynamic Range | fALFF |
| 1 | 0.038 | 1.642 | 0.040 | 2.133 |
| 2 | 0.033 | 1.226 | 0.040 | 1.540 |
| 3 | 0.033 | 1.166 | 0.038 | 1.926 |
| 4 | 0.029 | 0.923 | 0.049 | 2.541 |
| 5 | 0.040 | 1.862 | 0.033 | 1.235 |
| 6 | 0.033 | 1.248 | 0.034 | 1.241 |
| 7 | 0.034 | 1.402 | 0.039 | 1.857 |
| 8 | 0.034 | 1.344 | 0.041 | 1.953 |
| 9 | 0.038 | 1.653 | 0.032 | 1.166 |
| 10 | 0.035 | 1.423 | 0.029 | 0.958 |
| 11 | 0.039 | 1.951 | 0.037 | 1.368 |
| 12 | 0.030 | 1.098 | 0.032 | 1.073 |
| 13 | 0.038 | 1.523 | 0.031 | 0.993 |
| 14 | 0.039 | 1.934 | 0.042 | 2.033 |
| 15 | 0.036 | 1.650 | 0.033 | 1.247 |
| 16 | 0.040 | 1.775 | 0.033 | 1.251 |
| 17 | 0.039 | 2.239 | 0.028 | 0.824 |
| 18 | 0.036 | 1.314 | 0.036 | 1.333 |
| 19 | 0.038 | 1.473 | 0.037 | 1.748 |
| 20 | 0.033 | 1.113 | 0.039 | 1.948 |
| 21 | 0.040 | 2.305 | 0.033 | 1.204 |
| 22 | 0.037 | 1.507 | 0.039 | 1.536 |
| 23 | 0.038 | 1.788 | 0.034 | 1.298 |
| 24 | 0.039 | 1.821 | 0.041 | 2.146 |
| 25 | 0.036 | 1.497 | 0.042 | 2.341 |
| 26 | 0.034 | 1.346 | 0.040 | 1.955 |
| 27 | 0.036 | 1.524 | 0.037 | 1.207 |
| 28 | 0.041 | 1.792 | 0.039 | 1.914 |
| 29 | 0.038 | 1.607 | 0.043 | 2.217 |
| 30 | 0.045 | 2.056 | 0.029 | 0.869 |
| 31 | 0.039 | 1.748 | 0.037 | 1.632 |
| 32 | 0.036 | 1.517 | 0.040 | 1.726 |
| 33 | 0.039 | 1.719 | 0.033 | 1.265 |
| 34 | 0.041 | 2.131 | 0.043 | 2.347 |
| 35 | 0.043 | 2.977 | 0.037 | 1.738 |
| 36 | 0.042 | 2.221 | 0.040 | 1.972 |
| 37 | 0.038 | 1.512 | 0.035 | 1.536 |
Publisher’s Note: MDPI stays neutral with regard to jurisdictional claims in published maps and institutional affiliations. |
© 2022 by the authors. Licensee MDPI, Basel, Switzerland. This article is an open access article distributed under the terms and conditions of the Creative Commons Attribution (CC BY) license (https://creativecommons.org/licenses/by/4.0/).
Share and Cite
Riazi, A.H.; Rabbani, H.; Kafieh, R. Dynamic Brain Connectivity in Resting-State FMRI Using Spectral ICA and Graph Approach: Application to Healthy Controls and Multiple Sclerosis. Diagnostics 2022, 12, 2263. https://doi.org/10.3390/diagnostics12092263
Riazi AH, Rabbani H, Kafieh R. Dynamic Brain Connectivity in Resting-State FMRI Using Spectral ICA and Graph Approach: Application to Healthy Controls and Multiple Sclerosis. Diagnostics. 2022; 12(9):2263. https://doi.org/10.3390/diagnostics12092263
Chicago/Turabian StyleRiazi, Amir Hosein, Hossein Rabbani, and Rahele Kafieh. 2022. "Dynamic Brain Connectivity in Resting-State FMRI Using Spectral ICA and Graph Approach: Application to Healthy Controls and Multiple Sclerosis" Diagnostics 12, no. 9: 2263. https://doi.org/10.3390/diagnostics12092263