
Potential Use of Exhaled Breath Condensate for Diagnosis of SARS-CoV-2 Infections: A Systematic Review and Meta-Analysis


Abstract
:1. Introduction
2. Materials and Methods
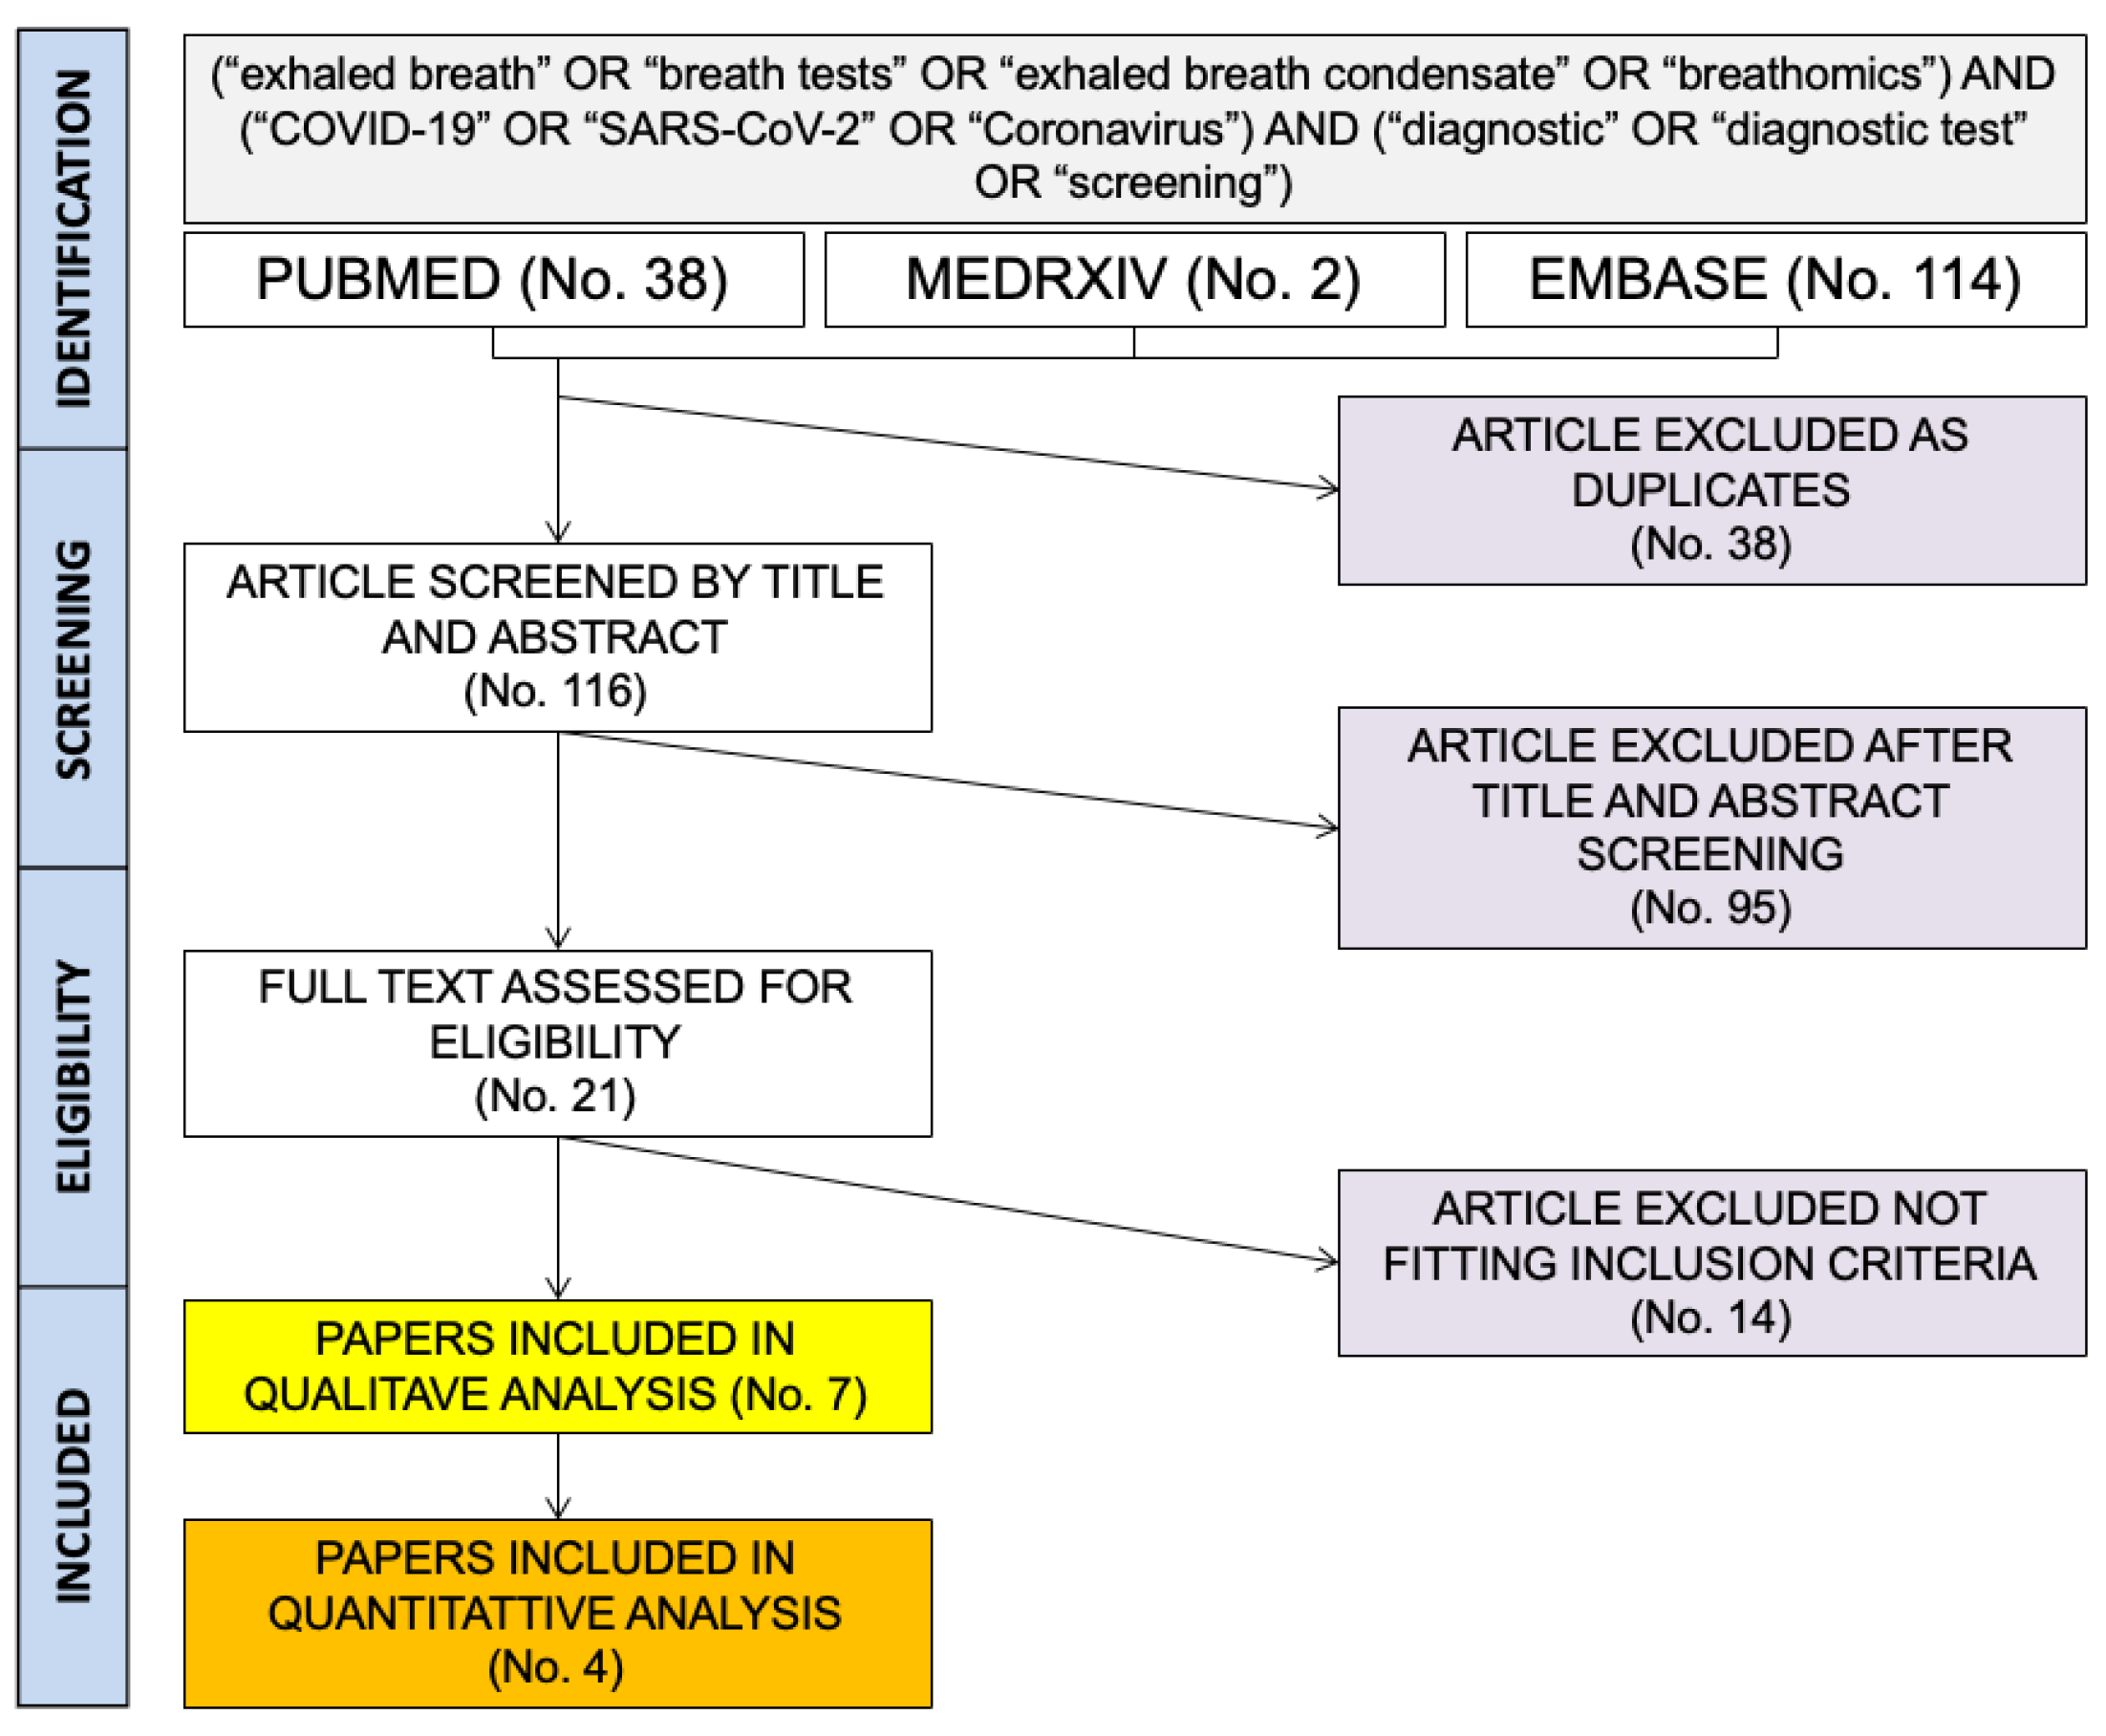
2.1. Search Strategy
2.2. Eligibility Criteria
- Written in Italian, English, German, French or Spanish, i.e., the languages spoken by the investigators;
- Reporting on original results, with the exclusion of reports, case series, meeting reports and conference abstracts;
- Reporting data on human samples;
- Dealing with COVID-19 cases diagnosed by means of conventional RT-qPCR tests on nasopharyngeal swabs [27];
- Reporting the raw number of true positive/true negative, and false positive/false negative results;
- Assessing the diagnostic accuracy of EBC in the diagnosis of SARS-CoV-2 infection.
2.3. Study Selection and Data Extration
- Settings of the study;
- Characteristics of reference cases;
- Characteristics of the EBC collecting device;
- Total number of true positive, true negative, false positive, false negative cases.
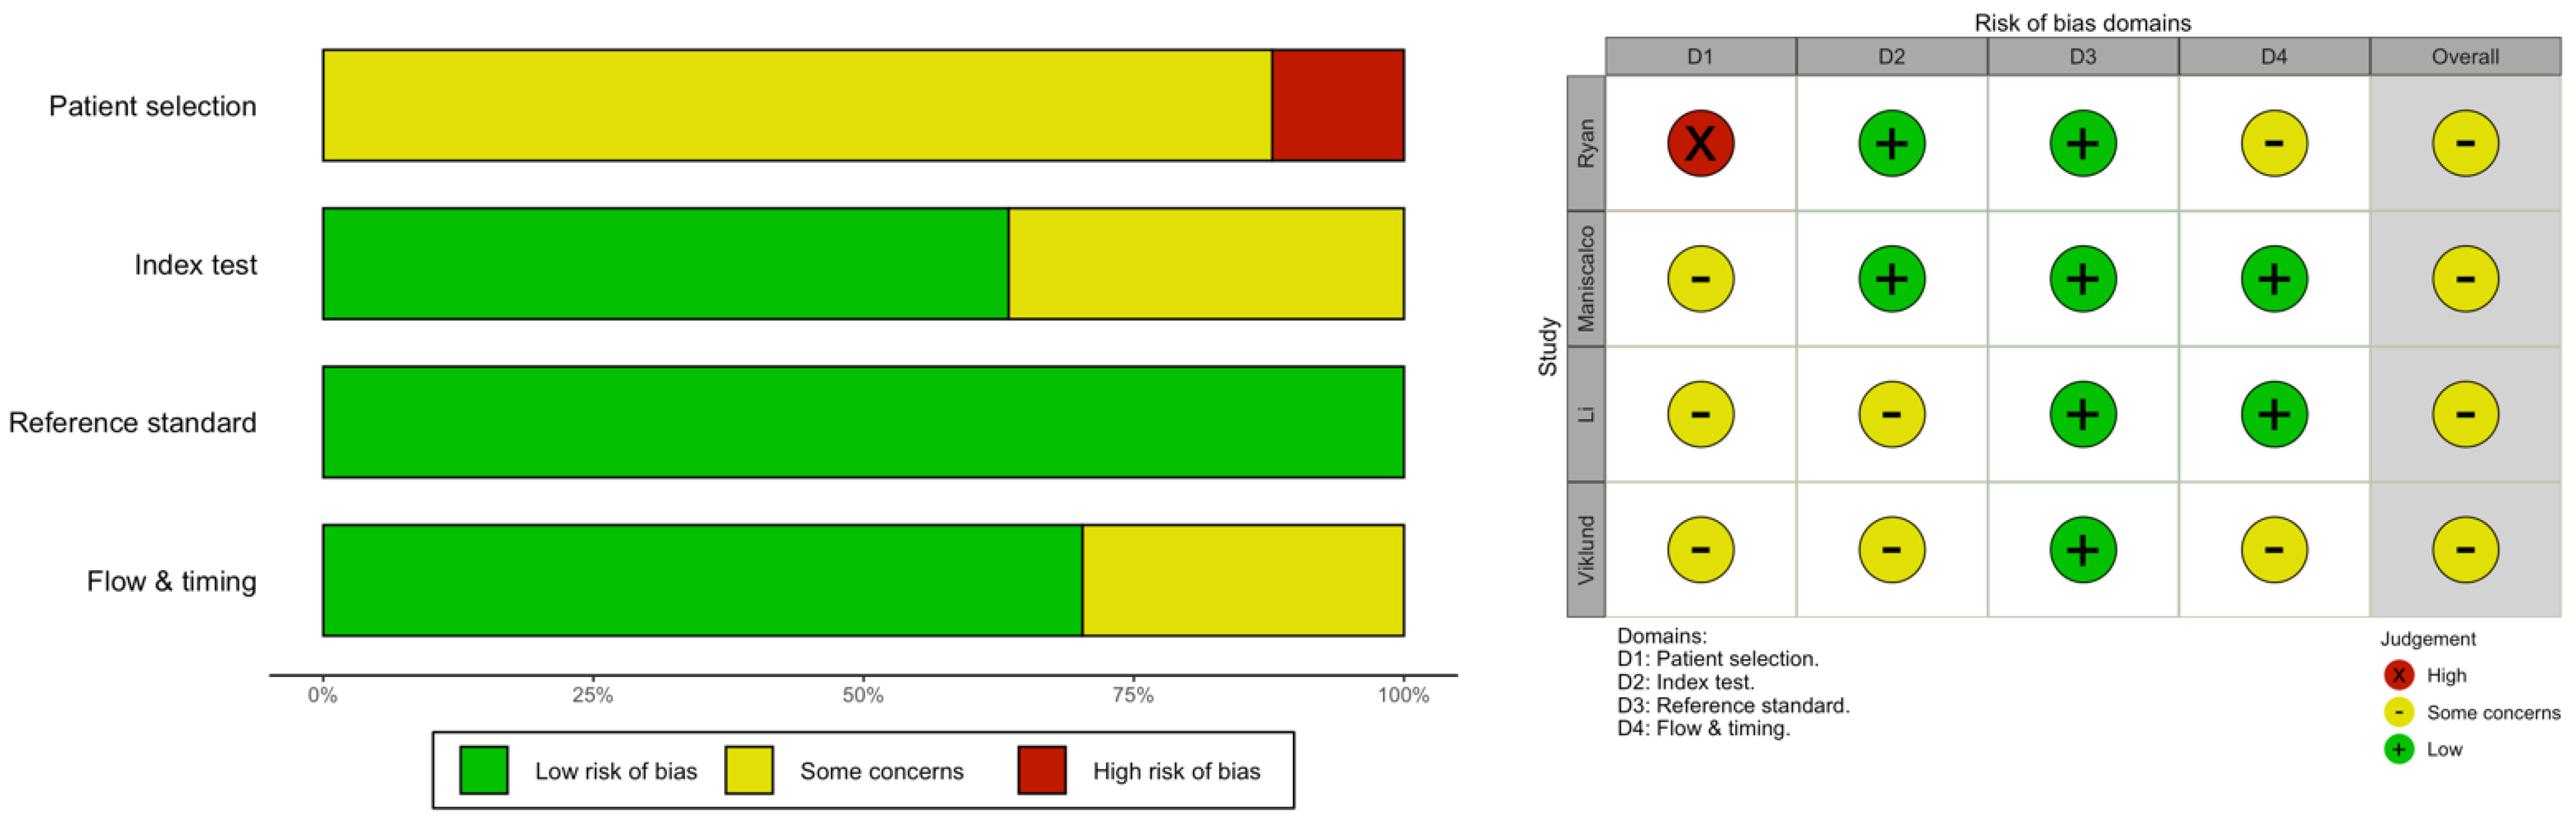
2.4. Quality Assessment
2.5. Quantitative Analysis
3. Results
4. Discussion
5. Conclusions
Author Contributions
Funding
Institutional Review Board Statement
Informed Consent Statement
Data Availability Statement
Acknowledgments
Conflicts of Interest
References
- Horváth, I.; Barnes, P.J.; Loukides, S.; Sterk, P.J.; Högman, M.; Olin, A.C.; Amann, A.; Antus, B.; Baraldi, E.; Bikov, A.; et al. A European Respiratory Society Technical Standard: Exhaled Biomarkers in Lung Disease. Eur. Respir. J. 2017, 49, 1600965. [Google Scholar] [CrossRef] [PubMed]
- Davis, M.D.; Montpetit, A.J. Exhaled Breath Condensate: An Update. Immunol. Allergy Clin. 2018, 38, 667–678. [Google Scholar] [CrossRef] [PubMed]
- Houspie, L.; de Coster, S.; Keyaerts, E.; Narongsack, P.; de Roy, R.; Talboom, I.; Sisk, M.; Maes, P.; Verbeeck, J.; van Ranst, M. Exhaled Breath Condensate Sampling Is Not a New Method for Detection of Respiratory Viruses. Virol. J. 2011, 8, 98. [Google Scholar] [CrossRef] [PubMed]
- Ryan, D.J.; Toomey, S.; Madden, S.F.; Casey, M.; Breathnach, O.S.; Morris, P.G.; Grogan, L.; Branagan, P.; Costello, R.W.; de Barra, E.; et al. Use of Exhaled Breath Condensate (EBC) in the Diagnosis of SARS-COV-2 (COVID-19). Thorax 2021, 76, 86–88. [Google Scholar] [CrossRef]
- Nidheesh, V.R.; Mohapatra, A.K.; Unnikrishnan, V.K.; Sinha, R.K.; Nayak, R.; Kartha, V.B.; Chidangil, S. Breath Analysis for the Screening and Diagnosis of Diseases. Appl. Spectrosc. Rev. 2021, 56, 702–732. [Google Scholar]
- Adigal, S.S.; Rayaroth, N.V.; John, R.V.; Pai, K.M.; Bhandari, S.; Mohapatra, A.K.; Lukose, J.; Patil, A.; Bankapur, A.; Chidangil, S. A Review on Human Body Fluids for the Diagnosis of Viral Infections: Scope for Rapid Detection of COVID-19. Expert Rev. Mol. Diagn. 2021, 21, 31–42. [Google Scholar] [CrossRef]
- Subali, A.D.; Wiyono, L.; Yusuf, M.; Zaky, M.F.A. The Potential of Volatile Organic Compounds-Based Breath Analysis for COVID-19 Screening: A Systematic Review & Meta-Analysis. Diagn. Microbiol. Infect. Dis. 2022, 102, 115589. [Google Scholar] [CrossRef]
- Zakharkina, T.; Koczulla, A.R.; Mardanova, O.; Hattesohl, A.; Bals, R. Detection of Microorganisms in Exhaled Breath Condensate during Acute Exacerbations of COPD. Respirology 2011, 16, 932–938. [Google Scholar] [CrossRef]
- Van Oort, P.M.; Povoa, P.; Schnabel, R.; Dark, P.; Artigas, A.; Bergmans, D.C.J.J.; Felton, T.; Coelho, L.; Schultz, M.J.; Fowler, S.J.; et al. The Potential Role of Exhaled Breath Analysis in the Diagnostic Process of Pneumonia—A Systematic Review. J. Breath Res. 2018, 12, 024001. [Google Scholar] [CrossRef]
- Leung, N.H.L.; Chu, D.K.W.; Shiu, E.Y.C.; Chan, K.H.; McDevitt, J.J.; Hau, B.J.P.; Yen, H.L.; Li, Y.; Ip, D.K.M.; Peiris, J.S.M.; et al. Respiratory Virus Shedding in Exhaled Breath and Efficacy of Face Masks. Nat. Med. 2020, 26, 676–680. [Google Scholar] [CrossRef]
- Fabian, P.; McDevitt, J.J.; Lee, W.M.; Houseman, E.A.; Milton, D.K. An Optimized Method to Detect Influenza Virus and Human Rhinovirus from Exhaled Breath and the Airborne Environment. J. Environ. Monit. 2009, 11, 314–317. [Google Scholar] [CrossRef] [Green Version]
- Pierucci, P.; Vaschetto, R.; Carpagnano, G.E. Is It Feasible to Collect Exhaled Breath Condensate in COVID-19 Patients Undergoing Noninvasive Ventilatory Support? ERJ Open Res. 2021, 7, 00071–2021. [Google Scholar] [CrossRef] [PubMed]
- Loconsole, D.; Pierucci, P.; Casulli, D.; Barratta, F.; Chironna, M.; Carpagnano, G.E. Exhaled Breath Condensate (EBC) for SARS-CoV-2 Diagnosis Still an Open Debate. J. Breath Res. 2022, 16, 027101. [Google Scholar] [CrossRef] [PubMed]
- Maniscalco, M.; Ambrosino, P.; Ciullo, A.; Fuschillo, S.; Valente, V.; Gaudiosi, C.; Paris, D.; Cobuccio, R.; Stefanelli, F.; Motta, A. A Rapid Antigen Detection Test to Diagnose Sars-Cov-2 Infection Using Exhaled Breath Condensate by a Modified Inflammacheck® Device. Sensors 2021, 21, 5710. [Google Scholar] [CrossRef] [PubMed]
- Barberis, E.; Amede, E.; Khoso, S.; Castello, L.; Sainaghi, P.P.; Bellan, M.; Balbo, P.E.; Patti, G.; Brustia, D.; Giordano, M.; et al. Metabolomics Diagnosis of COVID-19 from Exhaled Breath Condensate. Metabolites 2021, 11, 847. [Google Scholar] [CrossRef]
- Sawano, M.; Takeshita, K.; Ohno, H.; Oka, H. RT-PCR Diagnosis of COVID-19 from Exhaled Breath Condensate: A Clinical Study. J. Breath Res. 2021, 15, 037103. [Google Scholar] [CrossRef] [PubMed]
- Li, X.; Li, J.; Ge, Q.; Du, Y.; Li, G.; Li, W.; Zhang, T.; Tan, L.; Zhang, R.; Yuan, X.; et al. Detecting SARS-CoV-2 in the Breath of COVID-19 Patients. Front. Med. 2021, 8, 604392. [Google Scholar] [CrossRef]
- Viklund, E.; Kokelj, S.; Larsson, P.; Nordén, R.; Andersson, M.; Beck, O.; Westin, J.; Olin, A. Severe Acute Respiratory Syndrome Coronavirus 2 Can Be Detected in Exhaled Aerosol Sampled during a Few Minutes of Breathing or Coughing. Influenza Other Respir. Viruses 2022, 16, 402–410. [Google Scholar] [CrossRef]
- Nwanochie, E.; Linnes, J.C. Review of Non-Invasive Detection of SARS-CoV-2 and Other Respiratory Pathogens in Exhaled Breath Condensate. J. Breath Res. 2022, 16, 024002. [Google Scholar] [CrossRef]
- Maestrelli, P.; Mason, P.; Guarnieri, G. Update on Exhaled Breath Condensate Analyses in Occupational Disease. Curr. Opin. Allergy Clin. Immunol. 2020, 20, 85–89. [Google Scholar] [CrossRef]
- Giovannini, G.; Haick, H.; Garoli, D. Detecting COVID-19 from Breath: A Game Changer for a Big Challenge. ACS Sens. 2021, 6, 1408–1417. [Google Scholar] [CrossRef] [PubMed]
- Green, D.A.; Zucker, J.; Westblade, L.F.; Whittier, S.; Rennert, H.; Velu, P.; Craney, A.; Cushing, M.; Liu, D.; Sobieszczyk, M.E.; et al. Clinical Performance of SARS-CoV-2 Molecular Tests. J. Clin. Microbiol. 2020, 58, e00995. [Google Scholar] [CrossRef] [PubMed]
- Ma, J.; Qi, X.; Chen, H.; Li, X.; Zhang, Z.; Wang, H.; Sun, L.; Zhang, L.; Guo, J.; Morawska, L.; et al. Exhaled Breath Is a Significant Source of SARS-CoV-2 Emission. medRxiv 2020. [Google Scholar] [CrossRef]
- Exline, M.C.; Stanacevic, M.; Bowman, A.S.; Gouma, P.I. Exhaled Nitric Oxide Detection for Diagnosis of COVID-19 in Critically Ill Patients. PLoS ONE 2021, 16, e0257644. [Google Scholar] [CrossRef] [PubMed]
- Moher, D.; Liberati, A.; Tetzlaff, J.; Altman, D.G.; Altman, D.; Antes, G.; Atkins, D.; Barbour, V.; Barrowman, N.; Berlin, J.A.; et al. Preferred Reporting Items for Systematic Reviews and Meta-Analyses: The PRISMA Statement. PLoS Med. 2009, 6, e1000097. [Google Scholar] [CrossRef]
- Luijendijk, H.J. How to Create PICO Questions about Diagnostic Tests. BMJ Evid. Based Med. 2021, 26, 155–157. [Google Scholar] [CrossRef]
- Riccò, M.; Ferraro, P.; Gualerzi, G.; Ranzieri, S.; Henry, B.M.; Said, Y.B.; Pyatigorskaya, N.V.; Nevolina, E.; Wu, J.; Bragazzi, N.L.; et al. Point-of-Care Diagnostic Tests for Detecting SARS-CoV-2 Antibodies: A Systematic Review and Meta-Analysis of Real-World Data. J. Clin. Med. 2020, 9, 1515. [Google Scholar] [CrossRef]
- Whiting, P.F.; Rutjes, A.W.S.; Westwood, M.E.; Mallett, S.; Deeks, J.J.; Reitsma, J.B.; Leeflang, M.M.G.; Sterne, J.A.C.; Bossuyt, P.M.M. QUADAS-2: A Revised Tool for the Quality Assessment of Diagnostic Accuracy Studies. Ann. Intern. Med. 2011, 155, 529–536. [Google Scholar] [CrossRef]
- Bizzaro, N.; Villalta, D.; Giavarina, D.; Tozzoli, R. Are Anti-Nucleosome Antibodies a Better Diagnostic Marker than Anti-DsDNA Antibodies for Systemic Lupus Erythematosus? A Systematic Review and a Study of Metanalysis. Autoimmun. Rev. 2012, 12, 97–106. [Google Scholar] [CrossRef]
- R Development Core Team. R: A Language and Environment for Statistical Computing: Reference Index; R Foundation for Statistical Computing: Vienna, Austria, 2010; ISBN 3900051070. [Google Scholar]
- Malik, M.; Kunze, A.C.; Bahmer, T.; Herget-Rosenthal, S.; Kunze, T. SARS-CoV-2: Viral Loads of Exhaled Breath and Oronasopharyngeal Specimens in Hospitalized Patients with COVID-19. Int. J. Infect. Dis. 2021, 110, 105–110. [Google Scholar] [CrossRef]
- Tang, Y.-W.; Schmitz, J.E.; Persing, D.H.; Stratton, C.W. The Laboratory Diagnosis of COVID-19 Infection: Current Issues and Challenges. J. Clin. Microbiol. 2020, 58, e00512-20. [Google Scholar] [CrossRef] [Green Version]
- European Centre for Diseases Prevention and Control (ECDC). An Overview of the Rapid Test Situation for COVID-19 Diagnosis in the EU/EEA; European Centre for Diseases Prevention and Control (ECDC): Stockholm, Sweden, 2020. [Google Scholar]
- Scohy, A.; Anantharajah, A.; Bodéus, M.; Kabamba-mukadi, B.; Verroken, A.; Rodriguez-villalobos, H. Low Performance of Rapid Antigen Detection Test as Frontline Testing for COVID-19 Diagnosis. J. Clin. Virol. 2020, 129, 104455. [Google Scholar] [CrossRef] [PubMed]
- Riccò, M.; Ranzieri, S.; Marchesi, F. Rapid Antigen Tests for Large-Scale Diagnostic Campaigns: A Case Study from North-Eastern Italy. J. Infect. 2021, 82, e39–e40. [Google Scholar] [CrossRef] [PubMed]
- Ricco, M. A Systematic Review on Rapid Antigen Test Devices for SARS-CoV-2 in Nursing Homes: Useful, but Handle with Care. Enferm. Infecc. Microbiol. Clin. 2022, 40, 412–414. [Google Scholar] [CrossRef]
- Scheiblauer, H.; Filomena, A.; Nitsche, A.; Puyskens, A.; Corman, V.M.; Drosten, C.; Zwirglmaier, K.; Lange, C.; Emmerich, P.; Muller, M.; et al. Comparative Sensitivity Evaluation for 122 CE-Marked Rapid Diagnostic Tests for SARS-CoV-2 Antigen, Germany, September 2020 to April 2021. Eurosurveillance 2021, 26, 2100441. [Google Scholar] [CrossRef] [PubMed]
- Połomska, J.; Bar, K.; Sozańska, B. Exhaled Breath Condensate—A Non-Invasive Approach for Diagnostic Methods in Asthma. J. Clin. Med. 2021, 10, 2697. [Google Scholar] [CrossRef]
- Caraguel, C.G.B.; Vanderstichel, R. The Two-Step Fagan’s Nomogram: Ad Hoc Interpretation of a Diagnostic Test Result without Calculation. Evid. Based Med. 2013, 18, 125–128. [Google Scholar] [CrossRef] [PubMed]
- Ceron, J.J.; Lamy, E.; Martinez-Subiela, S.; Lopez-Jornet, P.; Capela e Silva, F.; Eckersall, P.D.; Tvarijonaviciute, A. Use of Saliva for Diagnosis and Monitoring the SARS-CoV-2: A General Perspective. J. Clin. Med. 2020, 9, 1491. [Google Scholar] [CrossRef]
- Wang, W.; Xu, Y.; Gao, R.; Lu, R.; Han, K.; Wu, G.; Tan, W. Detection of SARS-CoV-2 in Different Types of Clinical Specimens. JAMA 2020, 323, 1843–1844. [Google Scholar] [CrossRef]
- Hernández-Terán, A.; Garcíadiego-Fossas, P.; Villanueva-Reza, M.; Boukadida, C.; Taboada, B.; Porras, E.; Ahumada-Topete, V.; Tapia-Diaz, K.E.; Matías-Florentino, M.; Pérez-García, M.; et al. Clinical and Virological Features of Patients Hospitalized with Different Types of COVID-19 Vaccination in Mexico City. Vaccines 2022, 10, 1181. [Google Scholar] [CrossRef]
- Rabaan, A.A.; Bakhrebah, M.A.; Mutair, A.A.; Alhumaid, S.; Al-Jishi, J.M.; AlSihati, J.; Albayat, H.; Alsheheri, A.; Aljeldah, M.; Garout, M.; et al. Systematic Review on Pathophysiological Complications in Severe COVID-19 among the Non-Vaccinated and Vaccinated Population. Vaccines 2022, 10, 985. [Google Scholar] [CrossRef] [PubMed]
- Calabrese, C.; Annunziata, A.; Mariniello, D.F.; Coppola, A.; Mirizzi, A.I.; Simioli, F.; Pelaia, C.; Atripaldi, L.; Pugliese, G.; Guarino, S.; et al. Evolution of the Clinical Profile and Outcomes of Unvaccinated Patients Affected by Critical COVID-19 Pneumonia from the Pre-Vaccination to the Post-Vaccination Waves in Italy. Pathogens 2022, 11, 793. [Google Scholar] [CrossRef] [PubMed]
- Esterhuizen, T.M.; Thabane, L. Con: Meta-Analysis: Some Key Limitations and Potential Solutions. Nephrol. Dial. Transplant. 2016, 31, 882–885. [Google Scholar] [CrossRef]
- Imrey, P.B. Limitations of Meta-Analyses of Studies with High Heterogeneity. JAMA Netw Open 2020, 3, e1919325. [Google Scholar] [CrossRef] [PubMed]
- Sansone, N.M.S.; Boschiero, M.N.; Marson, F.A.L. Epidemiologic Profile of Severe Acute Respiratory Infection in Brazil During the COVID-19 Pandemic: An Epidemiological Study. Front. Microbiol. 2022, 13, 911036. [Google Scholar] [CrossRef] [PubMed]
- Vihta, K.D.; Pouwels, K.B.; Peto, T.E.; Pritchard, E.; House, T.; Studley, R.; Rourke, E.; Cook, D.; Diamond, I.; Crook1, D.; et al. Omicron-Associated Changes in SARS-CoV-2 Symptoms in the United Kingdom. Clin. Infect. Dis. 2022, ciac613. [Google Scholar] [CrossRef]
- Vihta, K.-D.; Pouwels, K.B.; Peto, T.E.A.; Pritchard, E.; Eyre, D.W.; House, T.; Gethings, O.; Studley, R.; Rourke, E.; Cook, D.; et al. Symptoms and Severe Acute Respiratory Syndrome Coronavirus 2 (SARS-CoV-2) Positivity in the General Population in the United Kingdom. Clin. Infect. Dis. 2021, 75, e329–e337. [Google Scholar] [CrossRef]
- Do, T.N.D.; Claes, S.; Schols, D.; Neyts, J.; Jochmans, D. SARS-CoV-2 Virion Infectivity and Cytokine Production in Primary Human Airway Epithelial Cells. Viruses 2022, 14, 951. [Google Scholar] [CrossRef]
- Escalera, A.; Gonzalez-Reiche, A.S.; Aslam, S.; Mena, I.; Laporte, M.; Pearl, R.L.; Fossati, A.; Rathnasinghe, R.; Alshammary, H.; van de Guchte, A.; et al. Mutations in SARS-CoV-2 Variants of Concern Link to Increased Spike Cleavage and Virus Transmission. Cell Host Microbe 2022, 30, 373–387.e7. [Google Scholar] [CrossRef]
- Micheli, V.; Bracchitta, F.; Rizzo, A.; Mancon, A.; Mileto, D.; Lombardi, A.; Stefanelli, P.; Gismondo, M.R. First Identification of the New SARS-CoV-2 Omicron Variant (B.1.1.529) in Italy. Clin. Infect. Dis. 2022, 75, 522–524. [Google Scholar] [CrossRef]
- Nyberg, T.; Ferguson, N.M.; Nash, S.G.; Webster, H.H.; Flaxman, S.; Andrews, N.; Hinsley, W.; Bernal, J.L.; Kall, M.; Bhatt, S.; et al. Comparative Analysis of the Risks of Hospitalisation and Death Associated with SARS-CoV-2 Omicron (B.1.1.529) and Delta (B.1.617.2) Variants in England: A Cohort Study. Lancet 2022, 10332, 1303–1312. [Google Scholar] [CrossRef]
- Riccò, M.; Valente, M.; Marchesi, F. Are Symptoms Associated with SARS-CoV-2 Infections Evolving over Time? Infect. Dis. Now 2022, 52, 110–112. [Google Scholar] [CrossRef] [PubMed]


| Item | Definition |
|---|---|
| Population of interest | Adults with suspected diagnosis of SARS-CoV-2 infection |
| Investigated test result | Results on RT-qPCR testing for SARS-CoV-2 infection performed on specimens collected as EBC |
| Comparator test result | Results on RT-qPCR testing for SARS-CoV-2 infection performed on specimens collected by means of nasal swabs |
| Outcome | SARS-CoV-2 positive status (or not) |
| Reference | Location (Settings) | Design | Characteristics of the Samples | Tester | Sample Collection |
|---|---|---|---|---|---|
| Ryan et al. 2021 [4] | Ireland (Hospital) | Prospective Observational Single center | Convenience sample; 40 patients including: 16 NPS positive, 15 NPS negative but clinical diagnosis of COVID, 9 negative cases with another respiratory disorder | RTube Condenser (Commercial) | Participants breathed for 2 min through the mouthpiece. |
| Maniscalco et al. 2021 [14] | Italy (Hospital) | Prospective Cross-Sectional Multicenter (2 independent hospitals) | Convenience Sample; 4 groups of subjects (i.e., 1 clinically suspected COVID19; 2 convalescent COVID19; 3 asymptomatic individuals at risk for COVID19; 4 asymptomatic individuals not at risk for COVID19) | Inflammacheck (Commercial) | Participants breathed into a disposable breath collection unit until enough condensate is formed (20–30 µL; usually 45 to 90 s) |
| Li et al. 2021 [17] | China (Laboratory + Hospital) | Prospective Proof of Concept Cross-Sectional Multicenter (2 independent hospitals) | Convenience 27 COVID-19 cases 12 healthy volunteers | In house | Participants breathed into a exhalation tube connected to a sampling head, that in turn is connected to a collection bottle, until enough condensate is collected (1.5 mL; usually 3–5 min) |
| Viklund et al. 2022 [18] | Sweden (Hospital) | Prospective Observational Single center | Convenience Samples from Healthcare workers either tested positive (No. 25) or negative (No. 11) at medical surveillance. | PExA AB (Commercial) | Participants inhaled air through a high-efficiancy particle arresting (HEPA) filter to remove ambient particles in order to remove external particles, then breathed through a mouthpiece. Three procedures were performed (normal breathing, airway opening maneuver; cough) with collection of 1.5 mL (time not specified). |
| Sawano et al. 2021 [16] | Japan (Hospital) | Prospective Observational Single center | Convenience sample, 50 patients with a previous diagnosis of COVID-19 | RTube/R-tube Vent Condenser (Commercial) | Participants breathed freely through the mouthpiece to collect 0.5–1.0 mL of EBC (usually, 5 to 7 min) |
| Loconsole et al. 2022 [13] | Italy (Hospital) | Prospective Observational Single center | Convenience Sample from ICU with ARDS; 17 consecutive patients | Turbo DECCS System (Commercial) | Within 24 h from the collection of conventional specimens; participants breathed freely through the mouthpiece up to 20 min in order to collect up to 1.0 mL of EBC. |
| Malik et al. 2021 [31] | Germany (Hospital) | Prospective Proof of Concept Single center | Convenience sample of 100 EBC samples from 15 hospitalized patients with previous diagnosis of COVID-19 | Sens-Abues (Commercial) | Participants breathed through a filter-based device consisting of a mouthpiece, a polymeric electret filter enclosed in a plastic collection chamber. Patients inhale through the nose and tidally exhale 20 times though the mouthpiece. |
| Reference | No. of Samples | TP | FP | FN | TN | Se. | Sp. | PPV | PNV | Accuracy | Cohen’s Kappa |
|---|---|---|---|---|---|---|---|---|---|---|---|
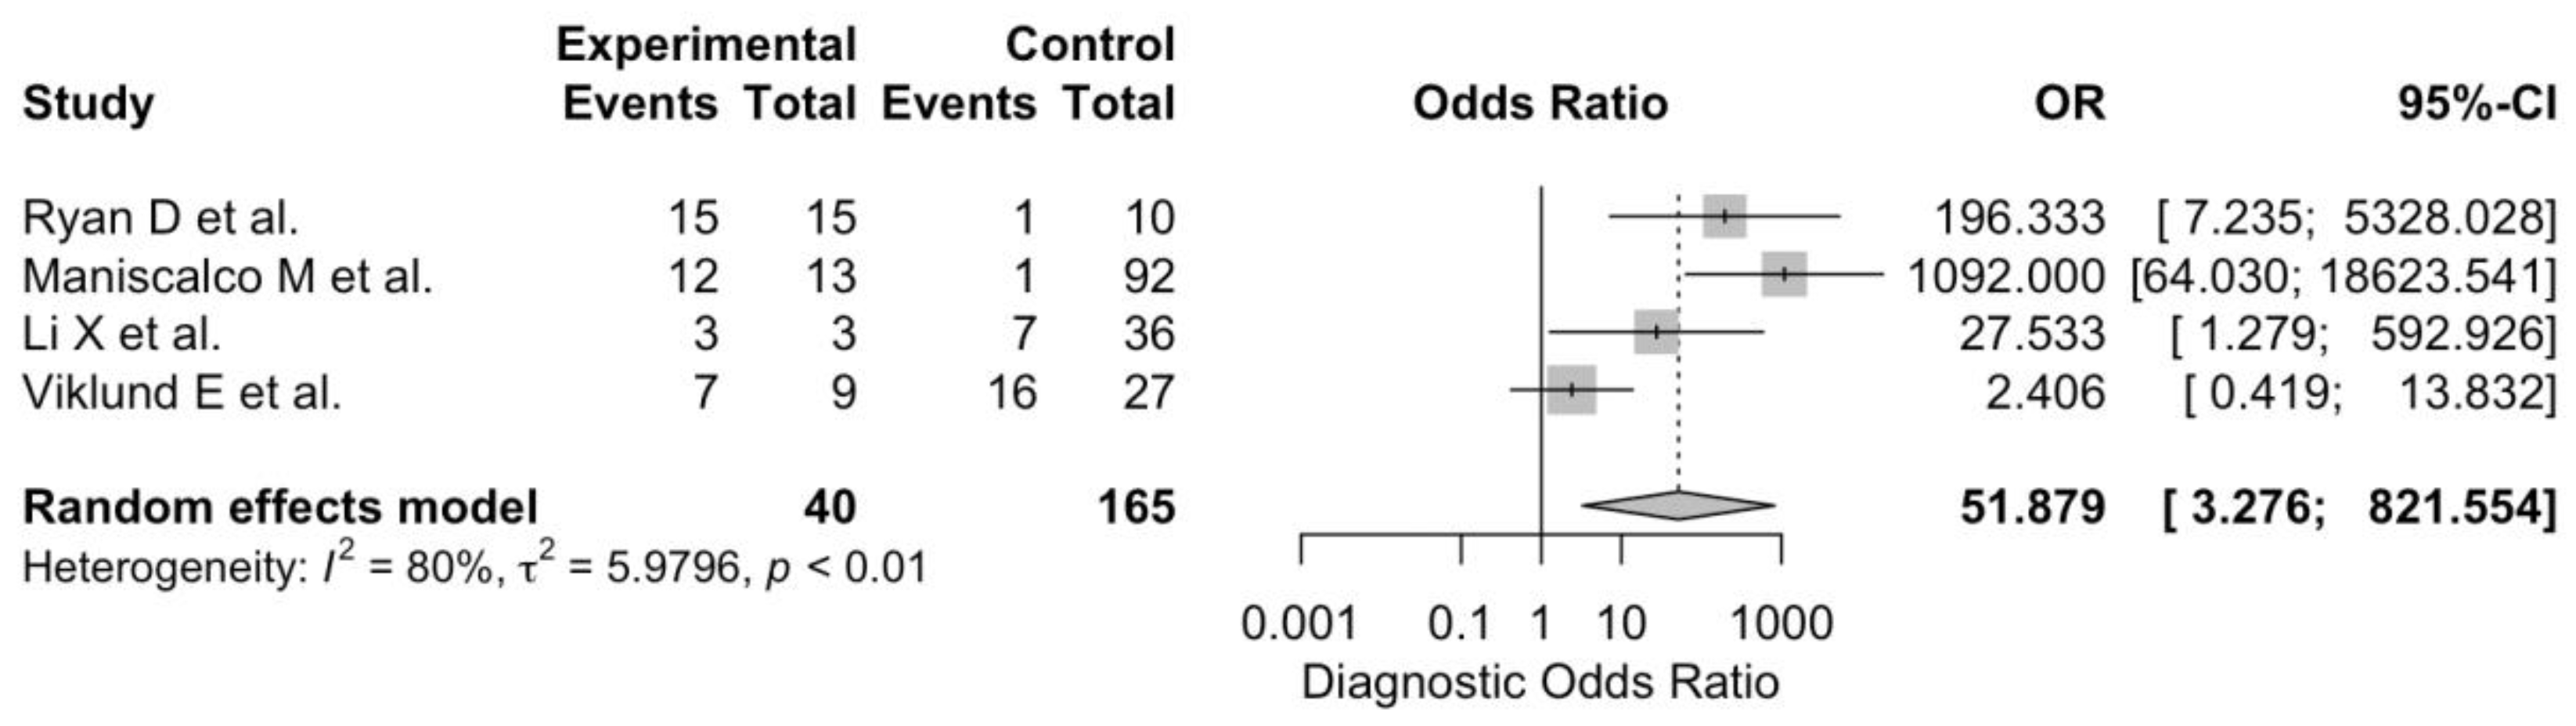
| Ryan et al. 2021 [4] | 25 | 15 | 0 | 1 | 9 | 93.8% | 100% | 100% | 90.0% | 96.0% | 0.915 |
| Maniscalco et al. 2021 [14] | 105 | 12 | 1 | 1 | 91 | 92.3% | 98.9% | 92.3% | 98.9% | 98.1% | 0.912 |
| Li et al. 2021 [17] | 39 | 3 | 0 | 7 | 29 | 30.0% | 100% | 100% | 80.6% | 82.1% | 0.389 |
| Viklund et al. 2022 [18] | 36 | 7 | 2 | 16 | 11 | 30.4% | 84.6% | 77.8% | 40.7% | 50.0% | 0.122 |
| Sawano et al. 2021 [16] | 39 | 16 | 0 | 24 | 0 | 38.5% | - | - | - | - | - |
| Loconsole et al. 2022 [13] | 17 | 1 | 0 | 16 | 0 | 5.9% | - | - | - | - | - |
| Malik et al. 2021 [31] | 100 | 70 | 0 | 30 | 0 | 70.0% | - | - | - | - | - |
| Value | 95%CI | |
|---|---|---|
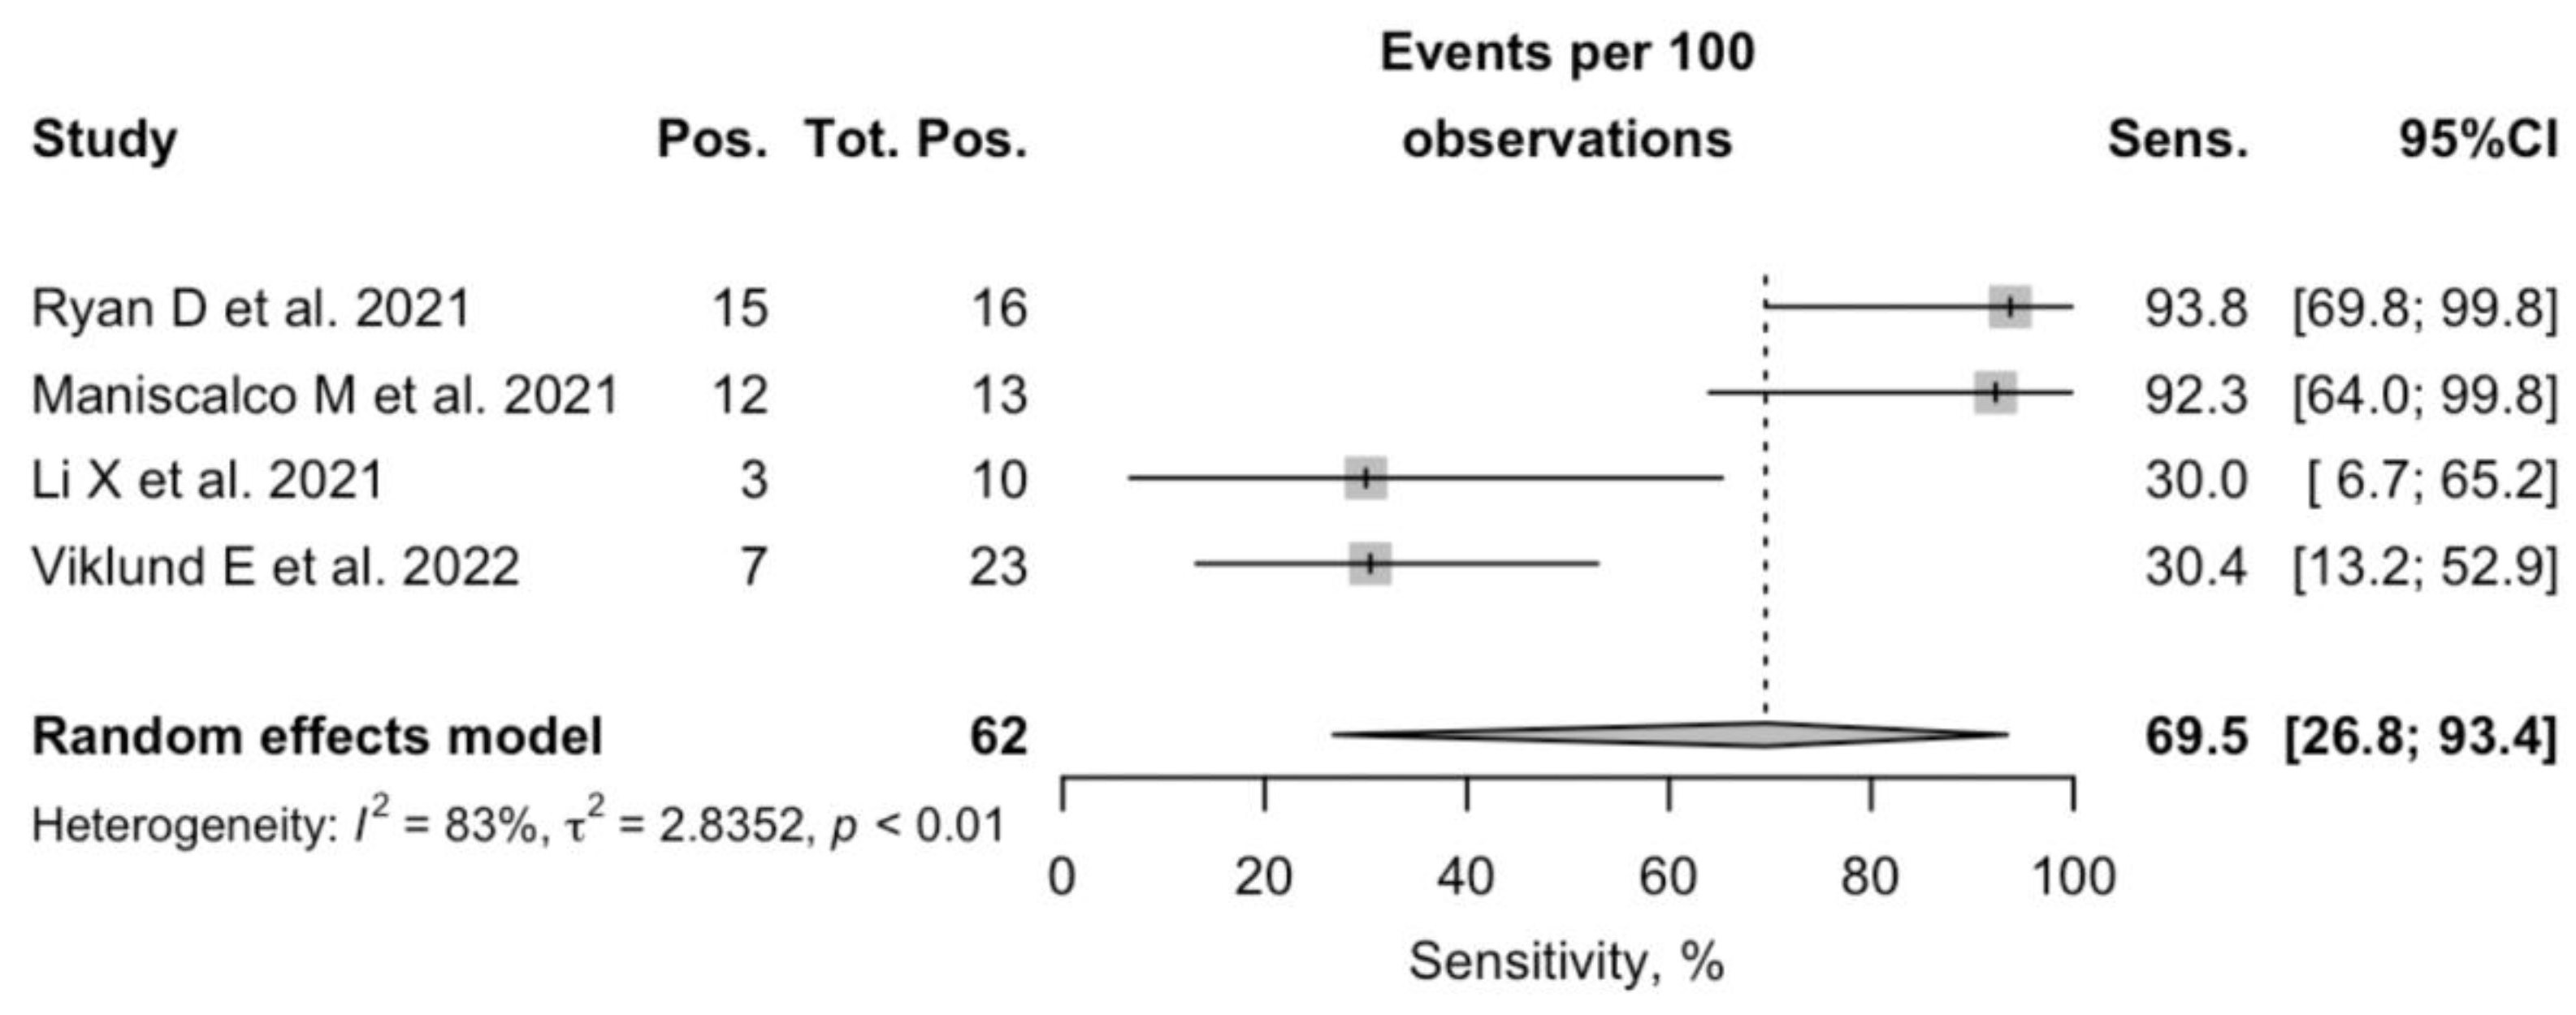
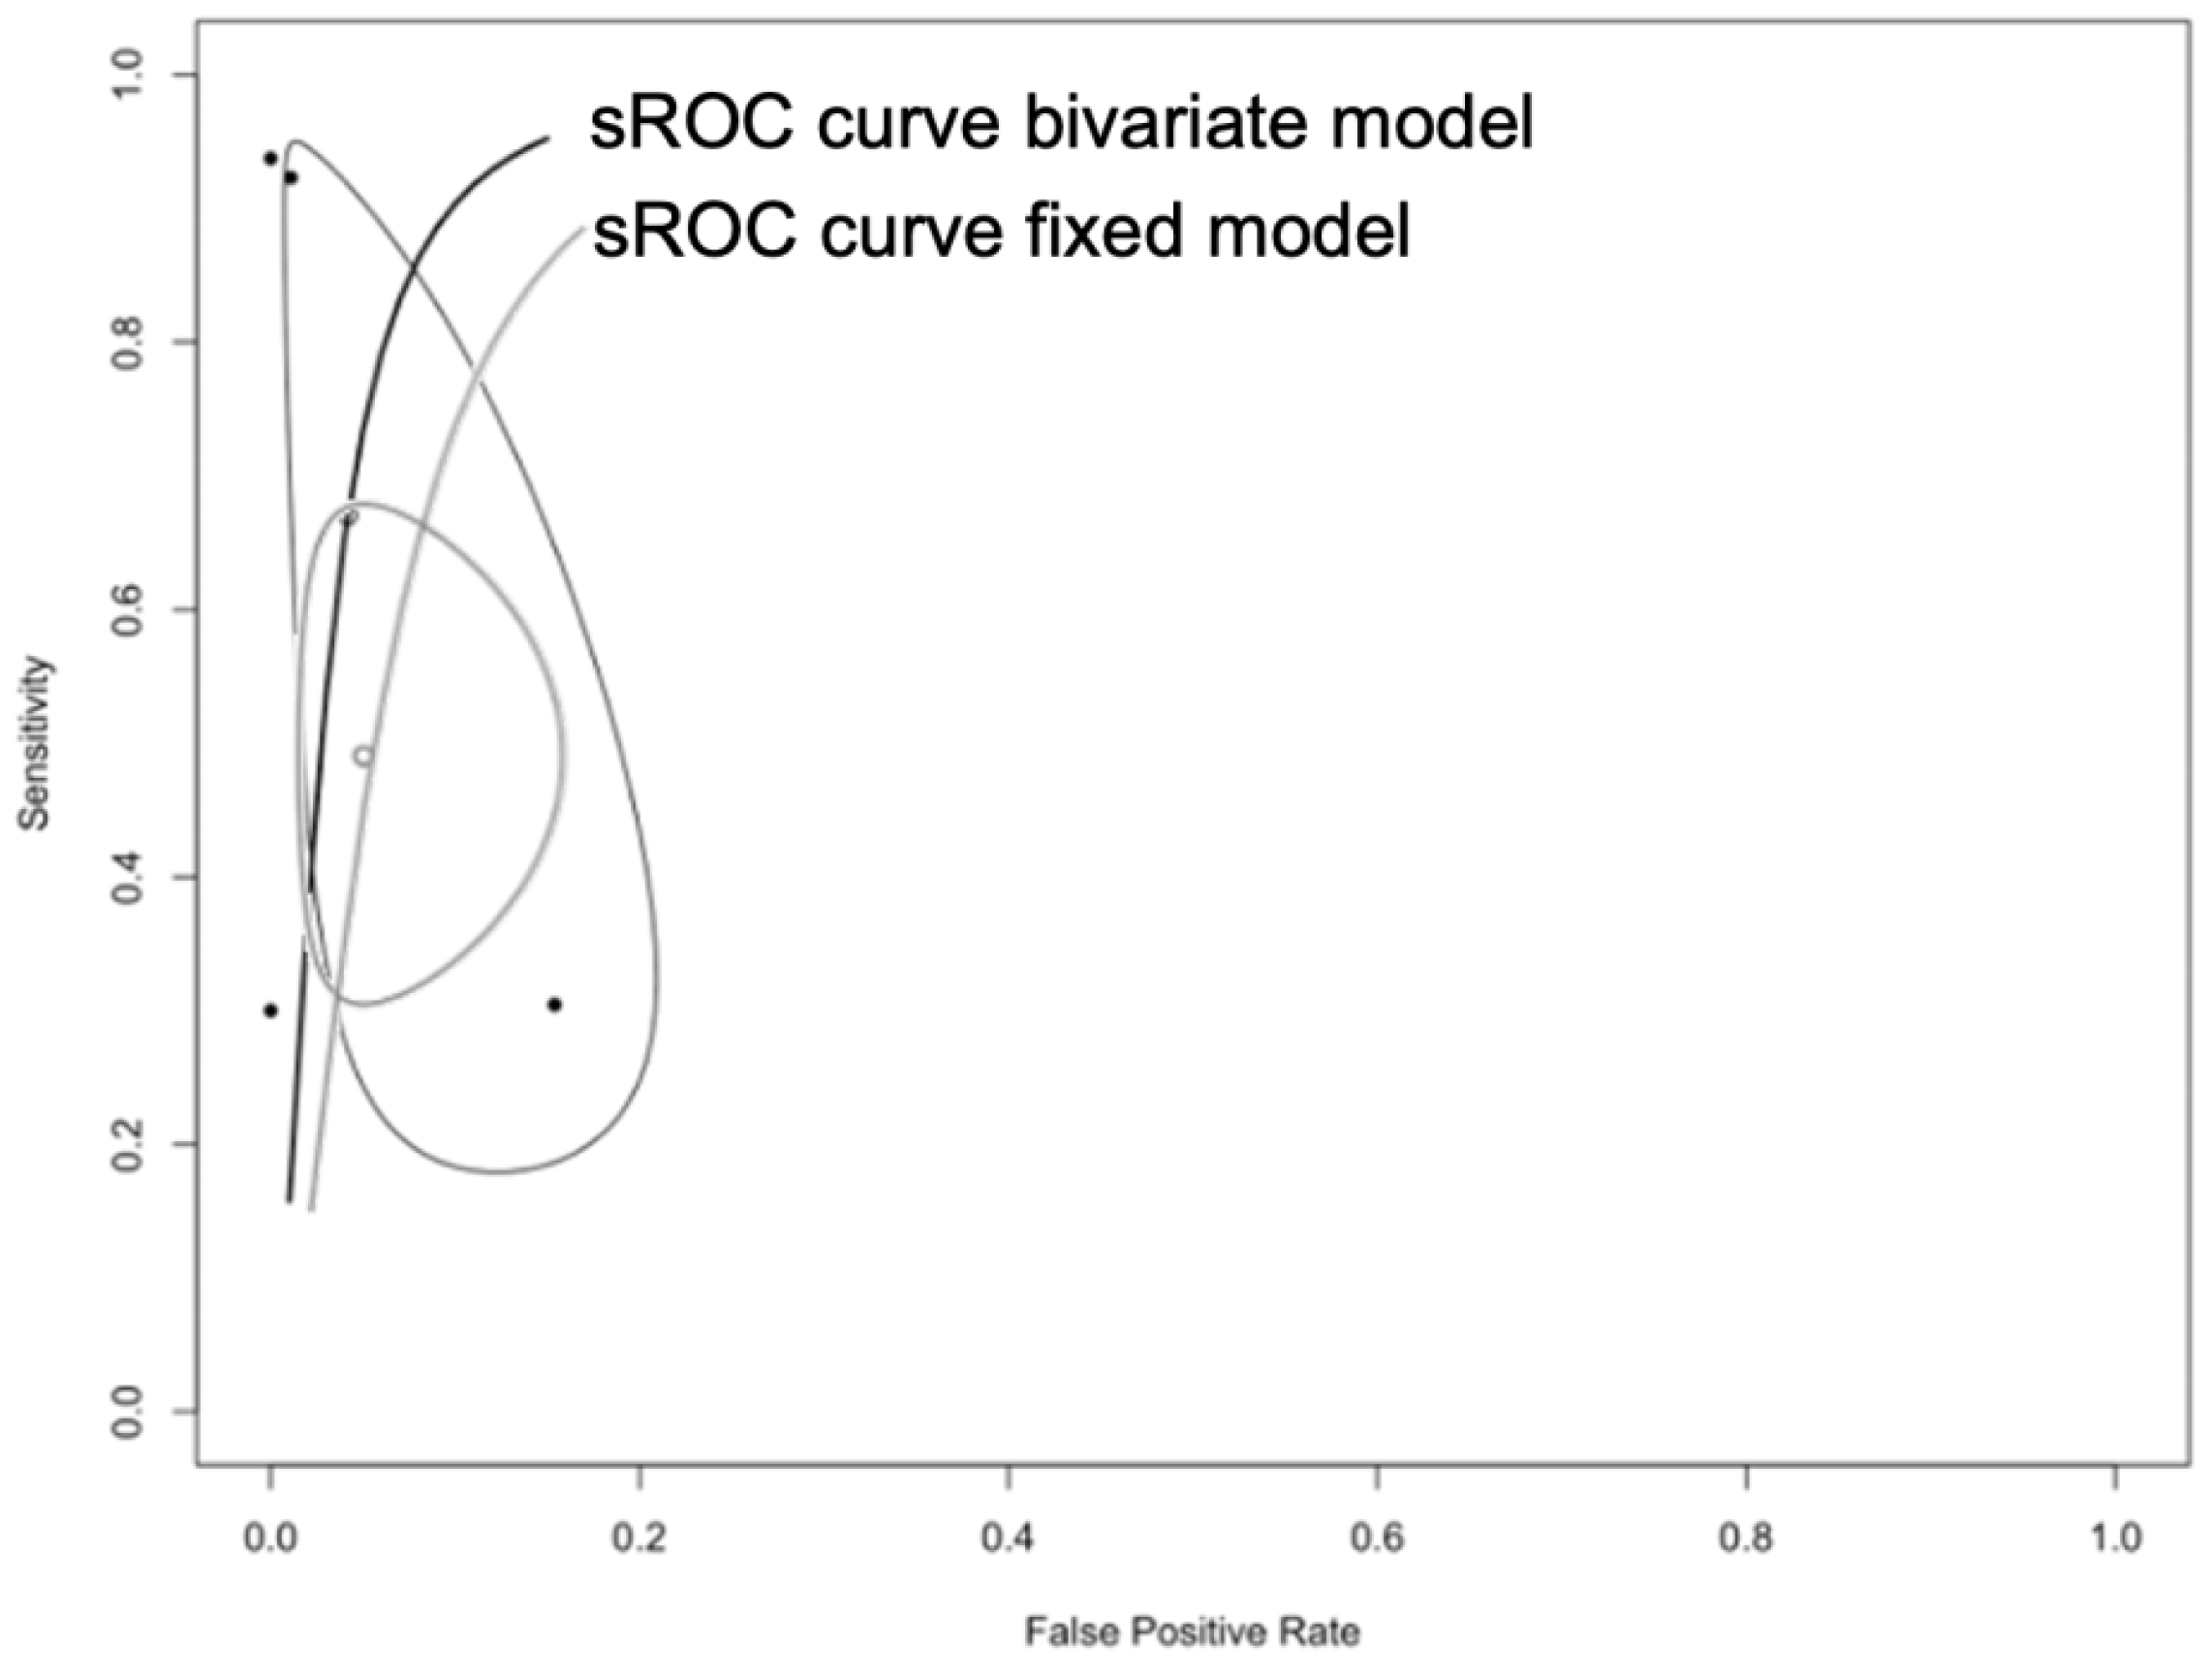
| Sensitivity | 69.5% | 26.8 to 93.4 |
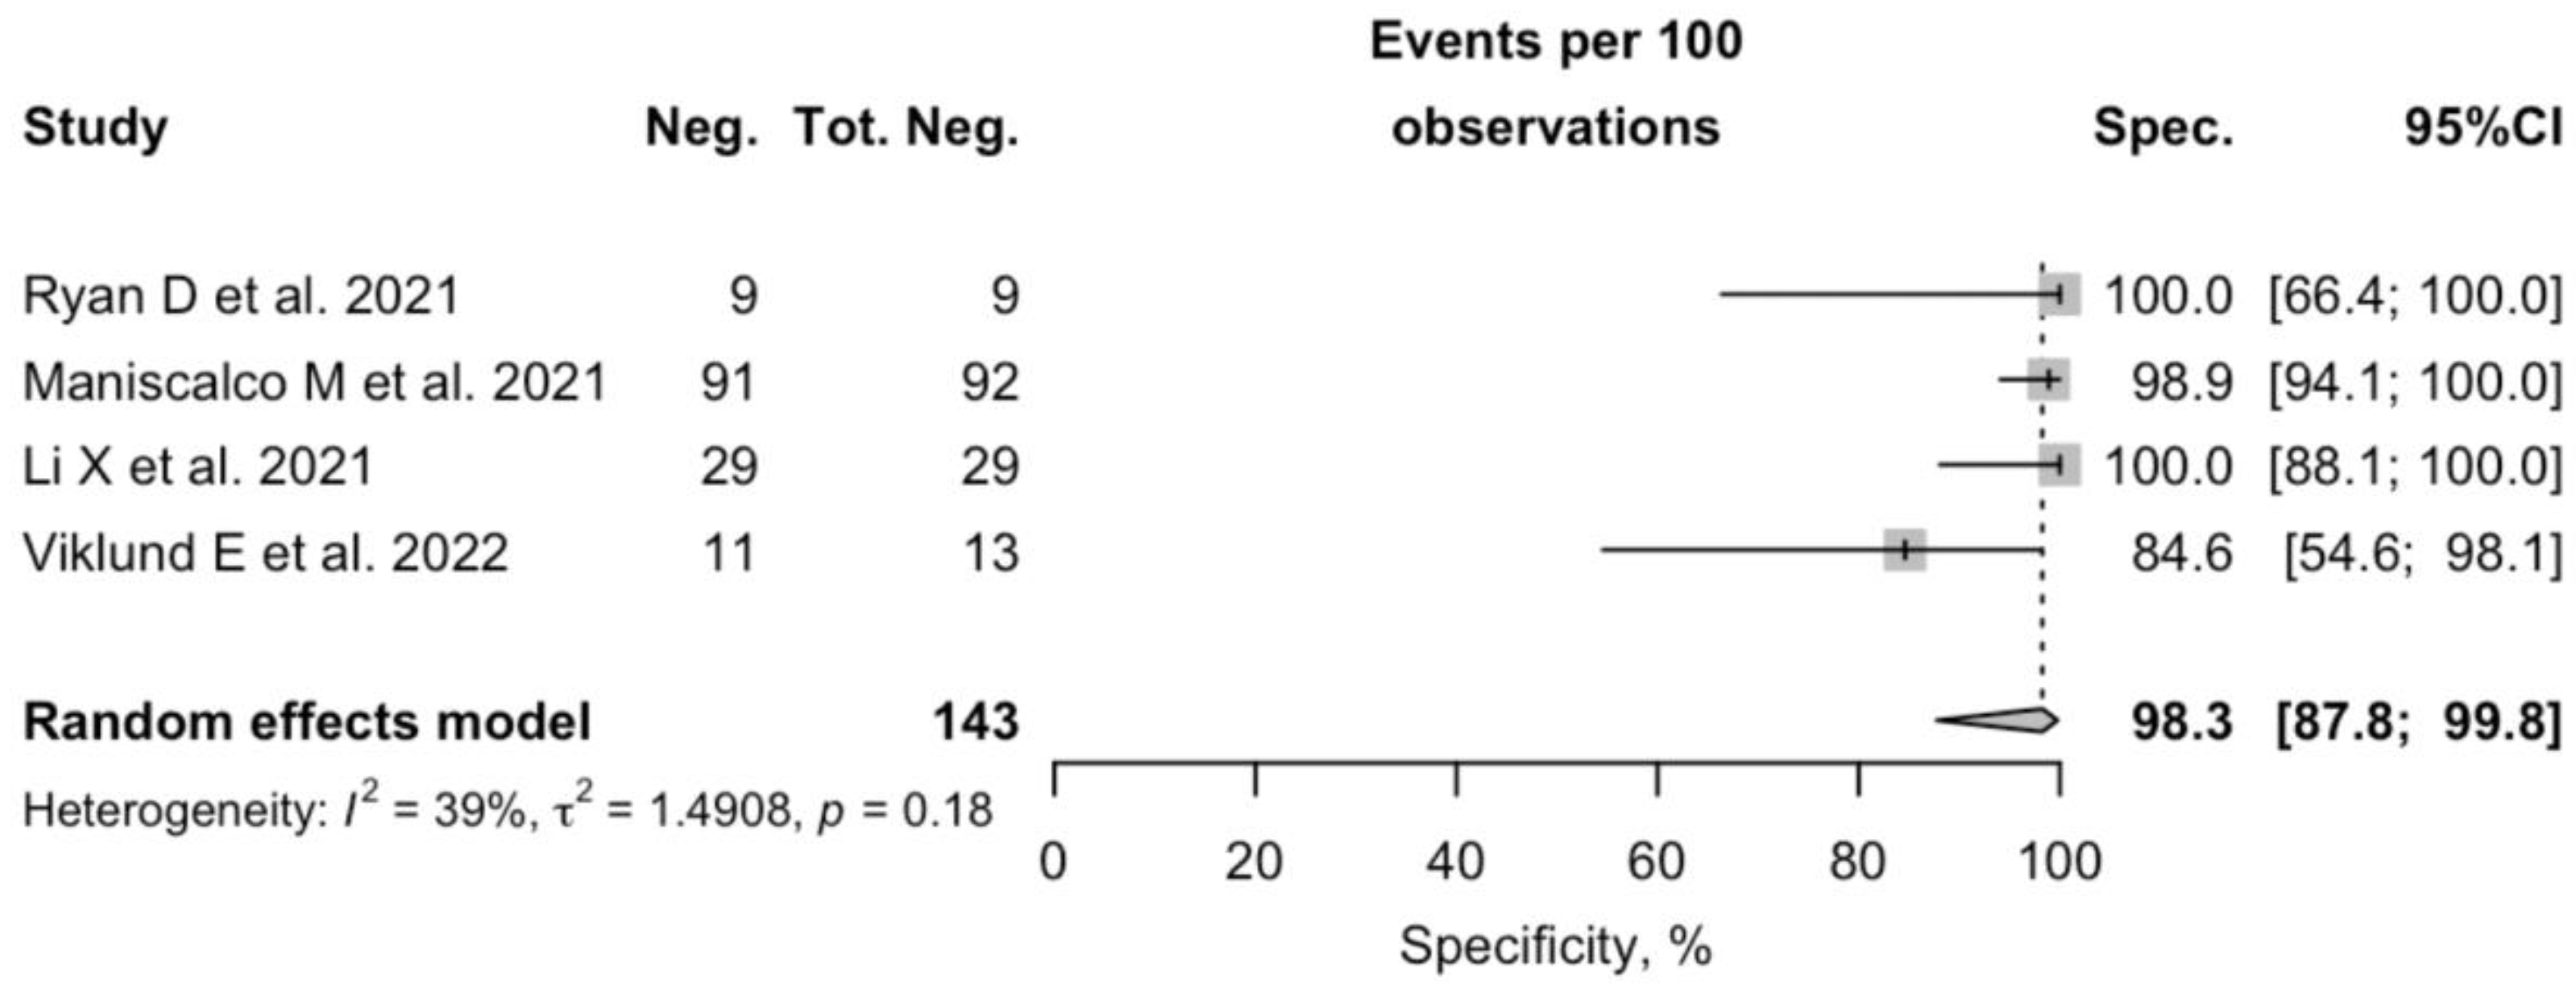
| Specificity | 98.3% | 87.8 to 99.8 |
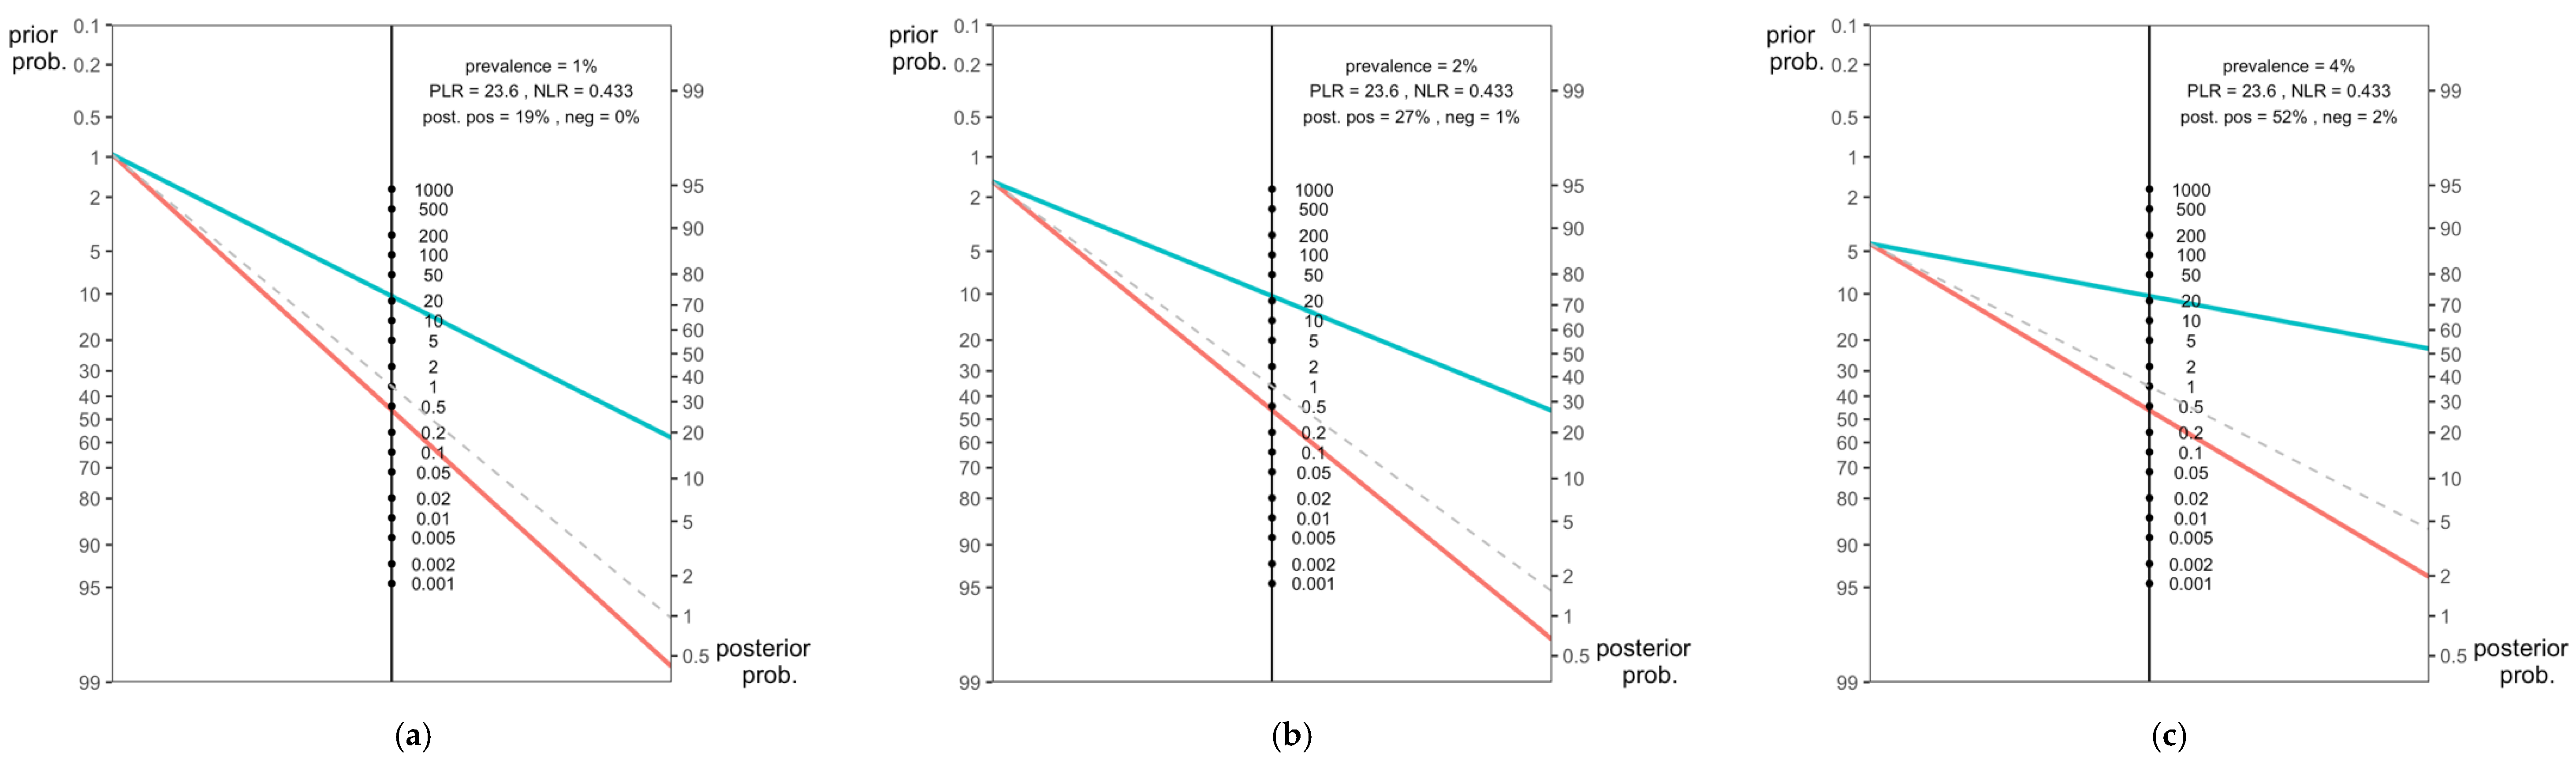
| Positive Likelihood Ratio | 23.608 | 20.752 to 26.464 |
| Negative Likelihood Ratio | 0.433 | 0.384 to 0.482 |
| Positive Predictive Value | 92.5% | 91.2% to 93.8% |
| Negative Predictive Value | 77.6% | 74.3% to 80.8% |
| Accuracy | 81.5% | 78.7% to 84.3% |
| DOR | 51.8 | 3.276 to 821.554 |
| Cohen’s K Score | 0.585 | 0.535 to 0.635 |
Publisher’s Note: MDPI stays neutral with regard to jurisdictional claims in published maps and institutional affiliations. |
© 2022 by the authors. Licensee MDPI, Basel, Switzerland. This article is an open access article distributed under the terms and conditions of the Creative Commons Attribution (CC BY) license (https://creativecommons.org/licenses/by/4.0/).
Share and Cite
Riccò, M.; Zaniboni, A.; Satta, E.; Ranzieri, S.; Marchesi, F. Potential Use of Exhaled Breath Condensate for Diagnosis of SARS-CoV-2 Infections: A Systematic Review and Meta-Analysis. Diagnostics 2022, 12, 2245. https://doi.org/10.3390/diagnostics12092245
Riccò M, Zaniboni A, Satta E, Ranzieri S, Marchesi F. Potential Use of Exhaled Breath Condensate for Diagnosis of SARS-CoV-2 Infections: A Systematic Review and Meta-Analysis. Diagnostics. 2022; 12(9):2245. https://doi.org/10.3390/diagnostics12092245
Chicago/Turabian StyleRiccò, Matteo, Alessandro Zaniboni, Elia Satta, Silvia Ranzieri, and Federico Marchesi. 2022. "Potential Use of Exhaled Breath Condensate for Diagnosis of SARS-CoV-2 Infections: A Systematic Review and Meta-Analysis" Diagnostics 12, no. 9: 2245. https://doi.org/10.3390/diagnostics12092245