
Quantification of Thyroid Viscosity in Healthy Subjects Using Ultrasound Shear Wave Dispersion (Viscosity PLUS)

 ,
,  , ,
, ,
Abstract
:1. Introduction
2. Materials and Methods
2.1. Study Population
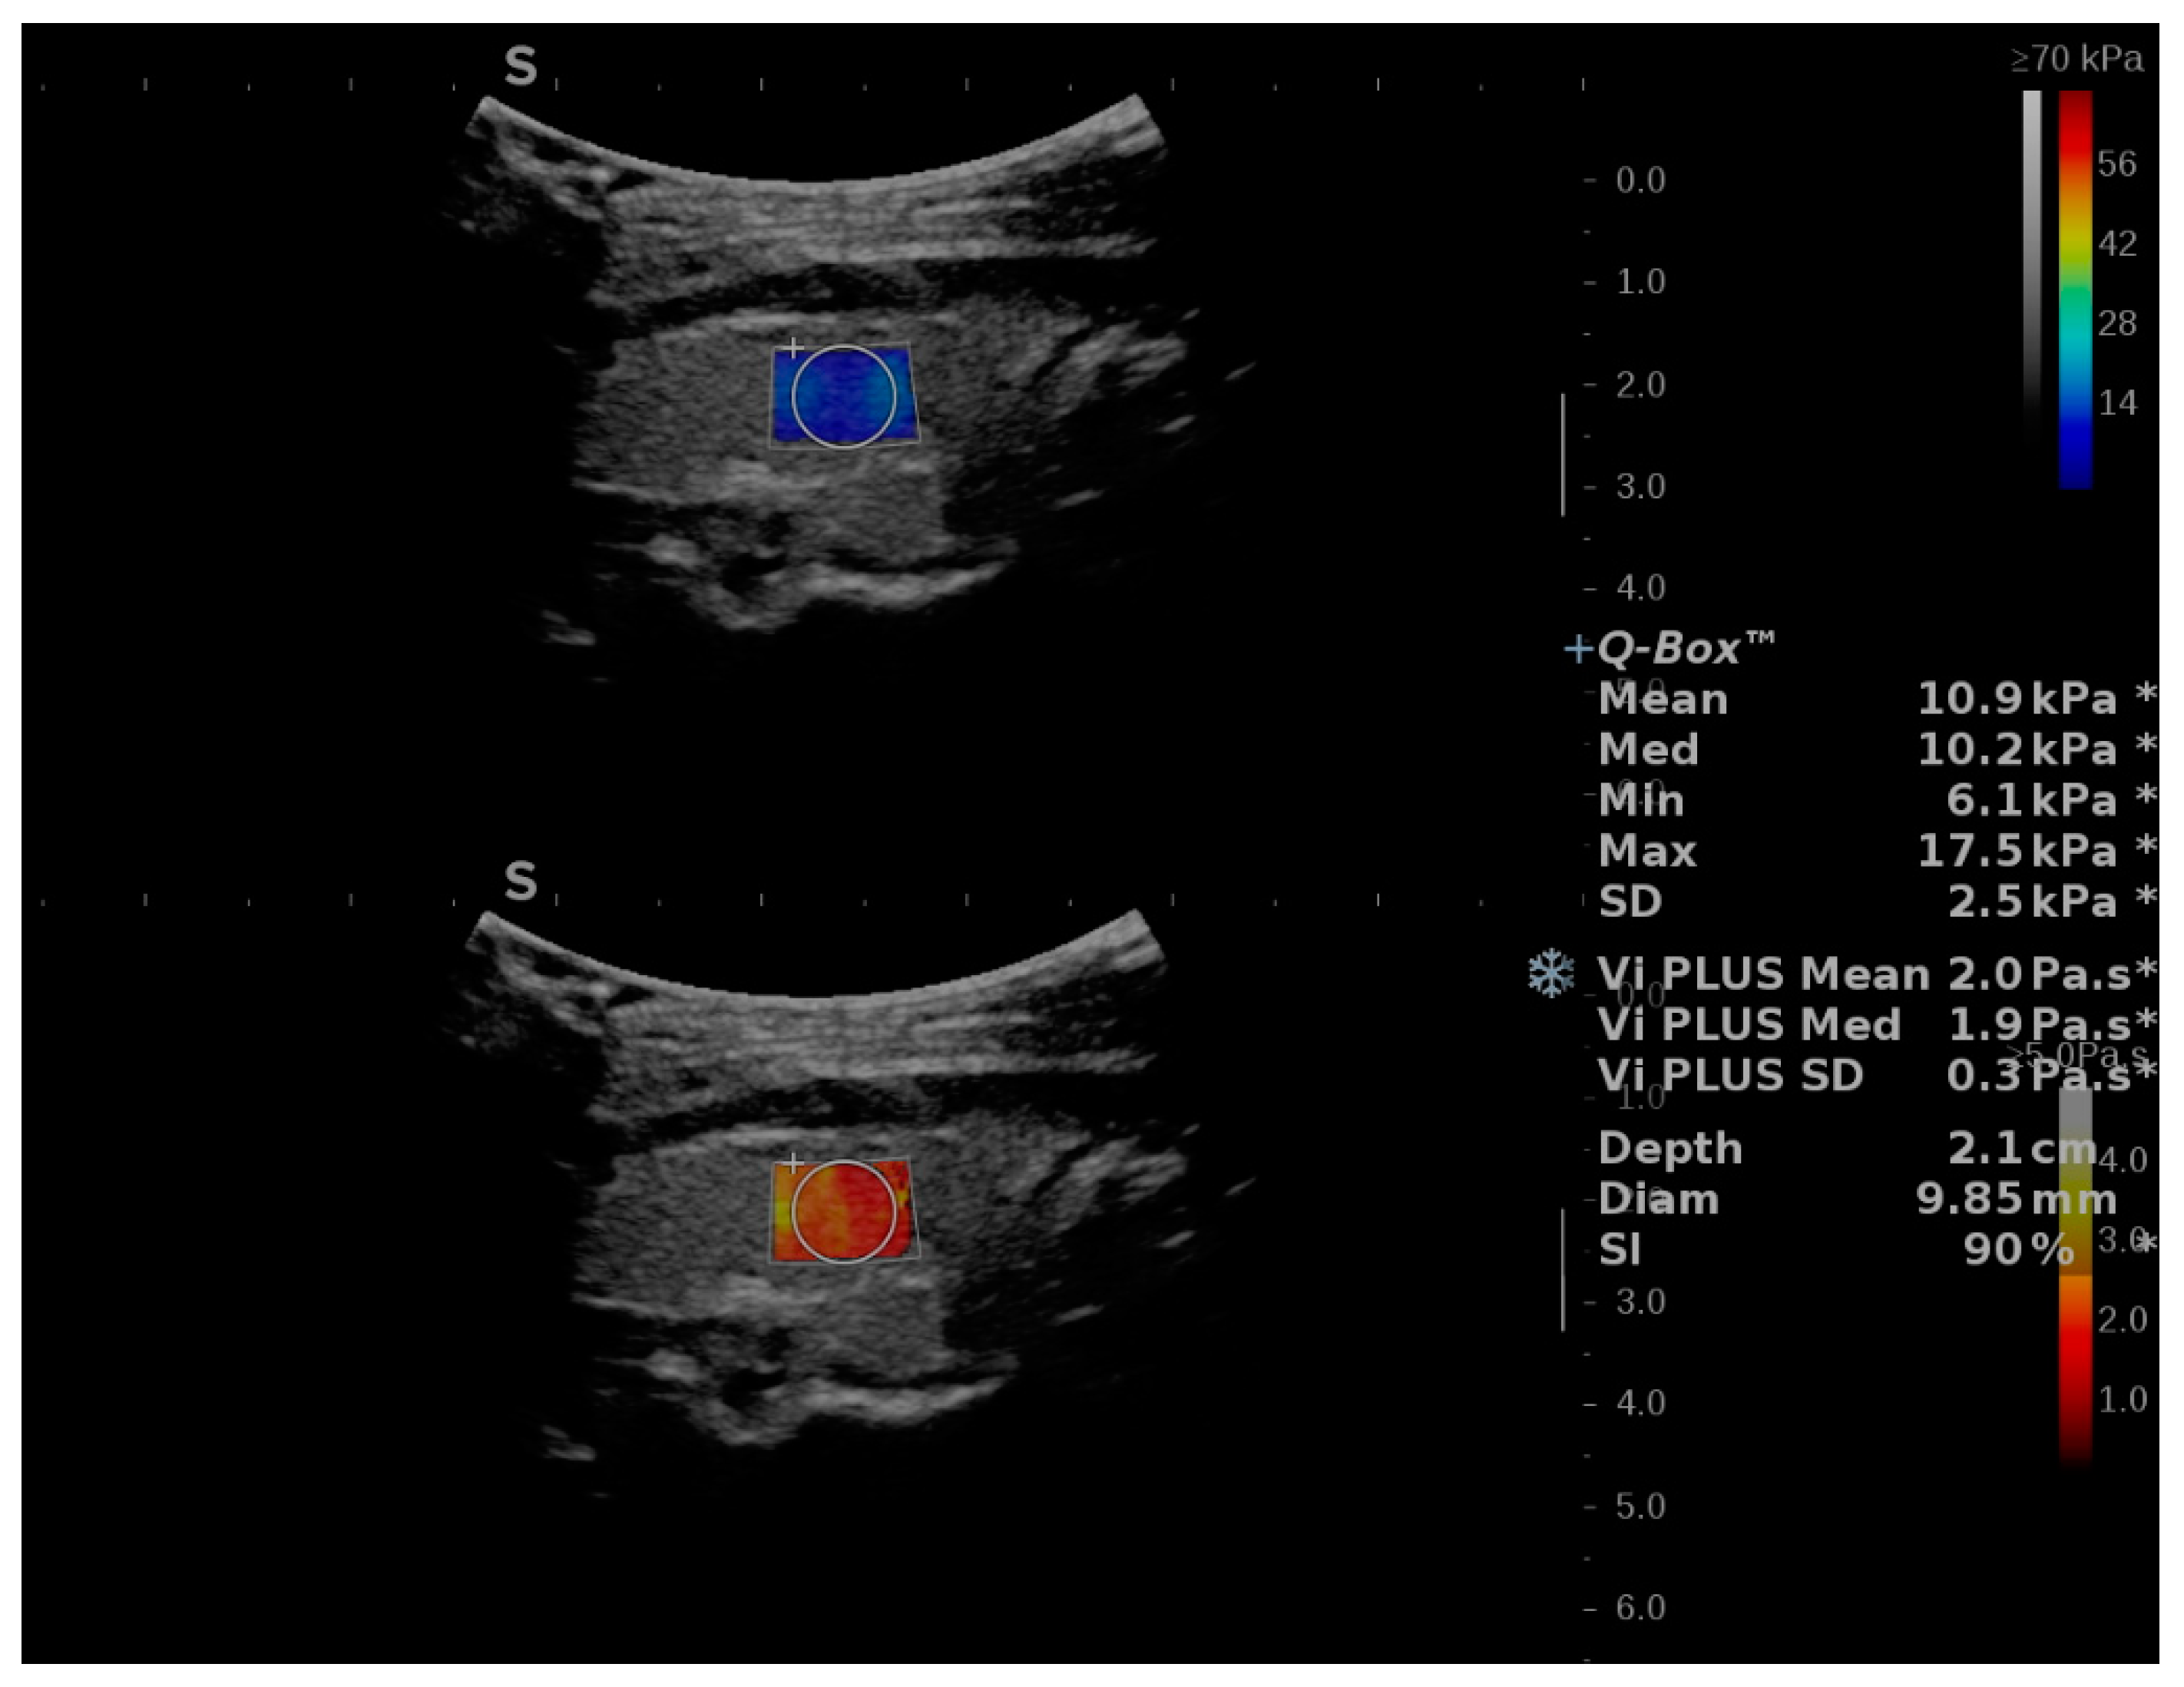
2.2. Two-Dimensional SWE PLUS and Viscosity PLUS Measurements
2.3. Statistical Analysis
3. Results
3.1. Baseline Characteristics
3.2. Feasibility and Reproducibility of ViPLUS
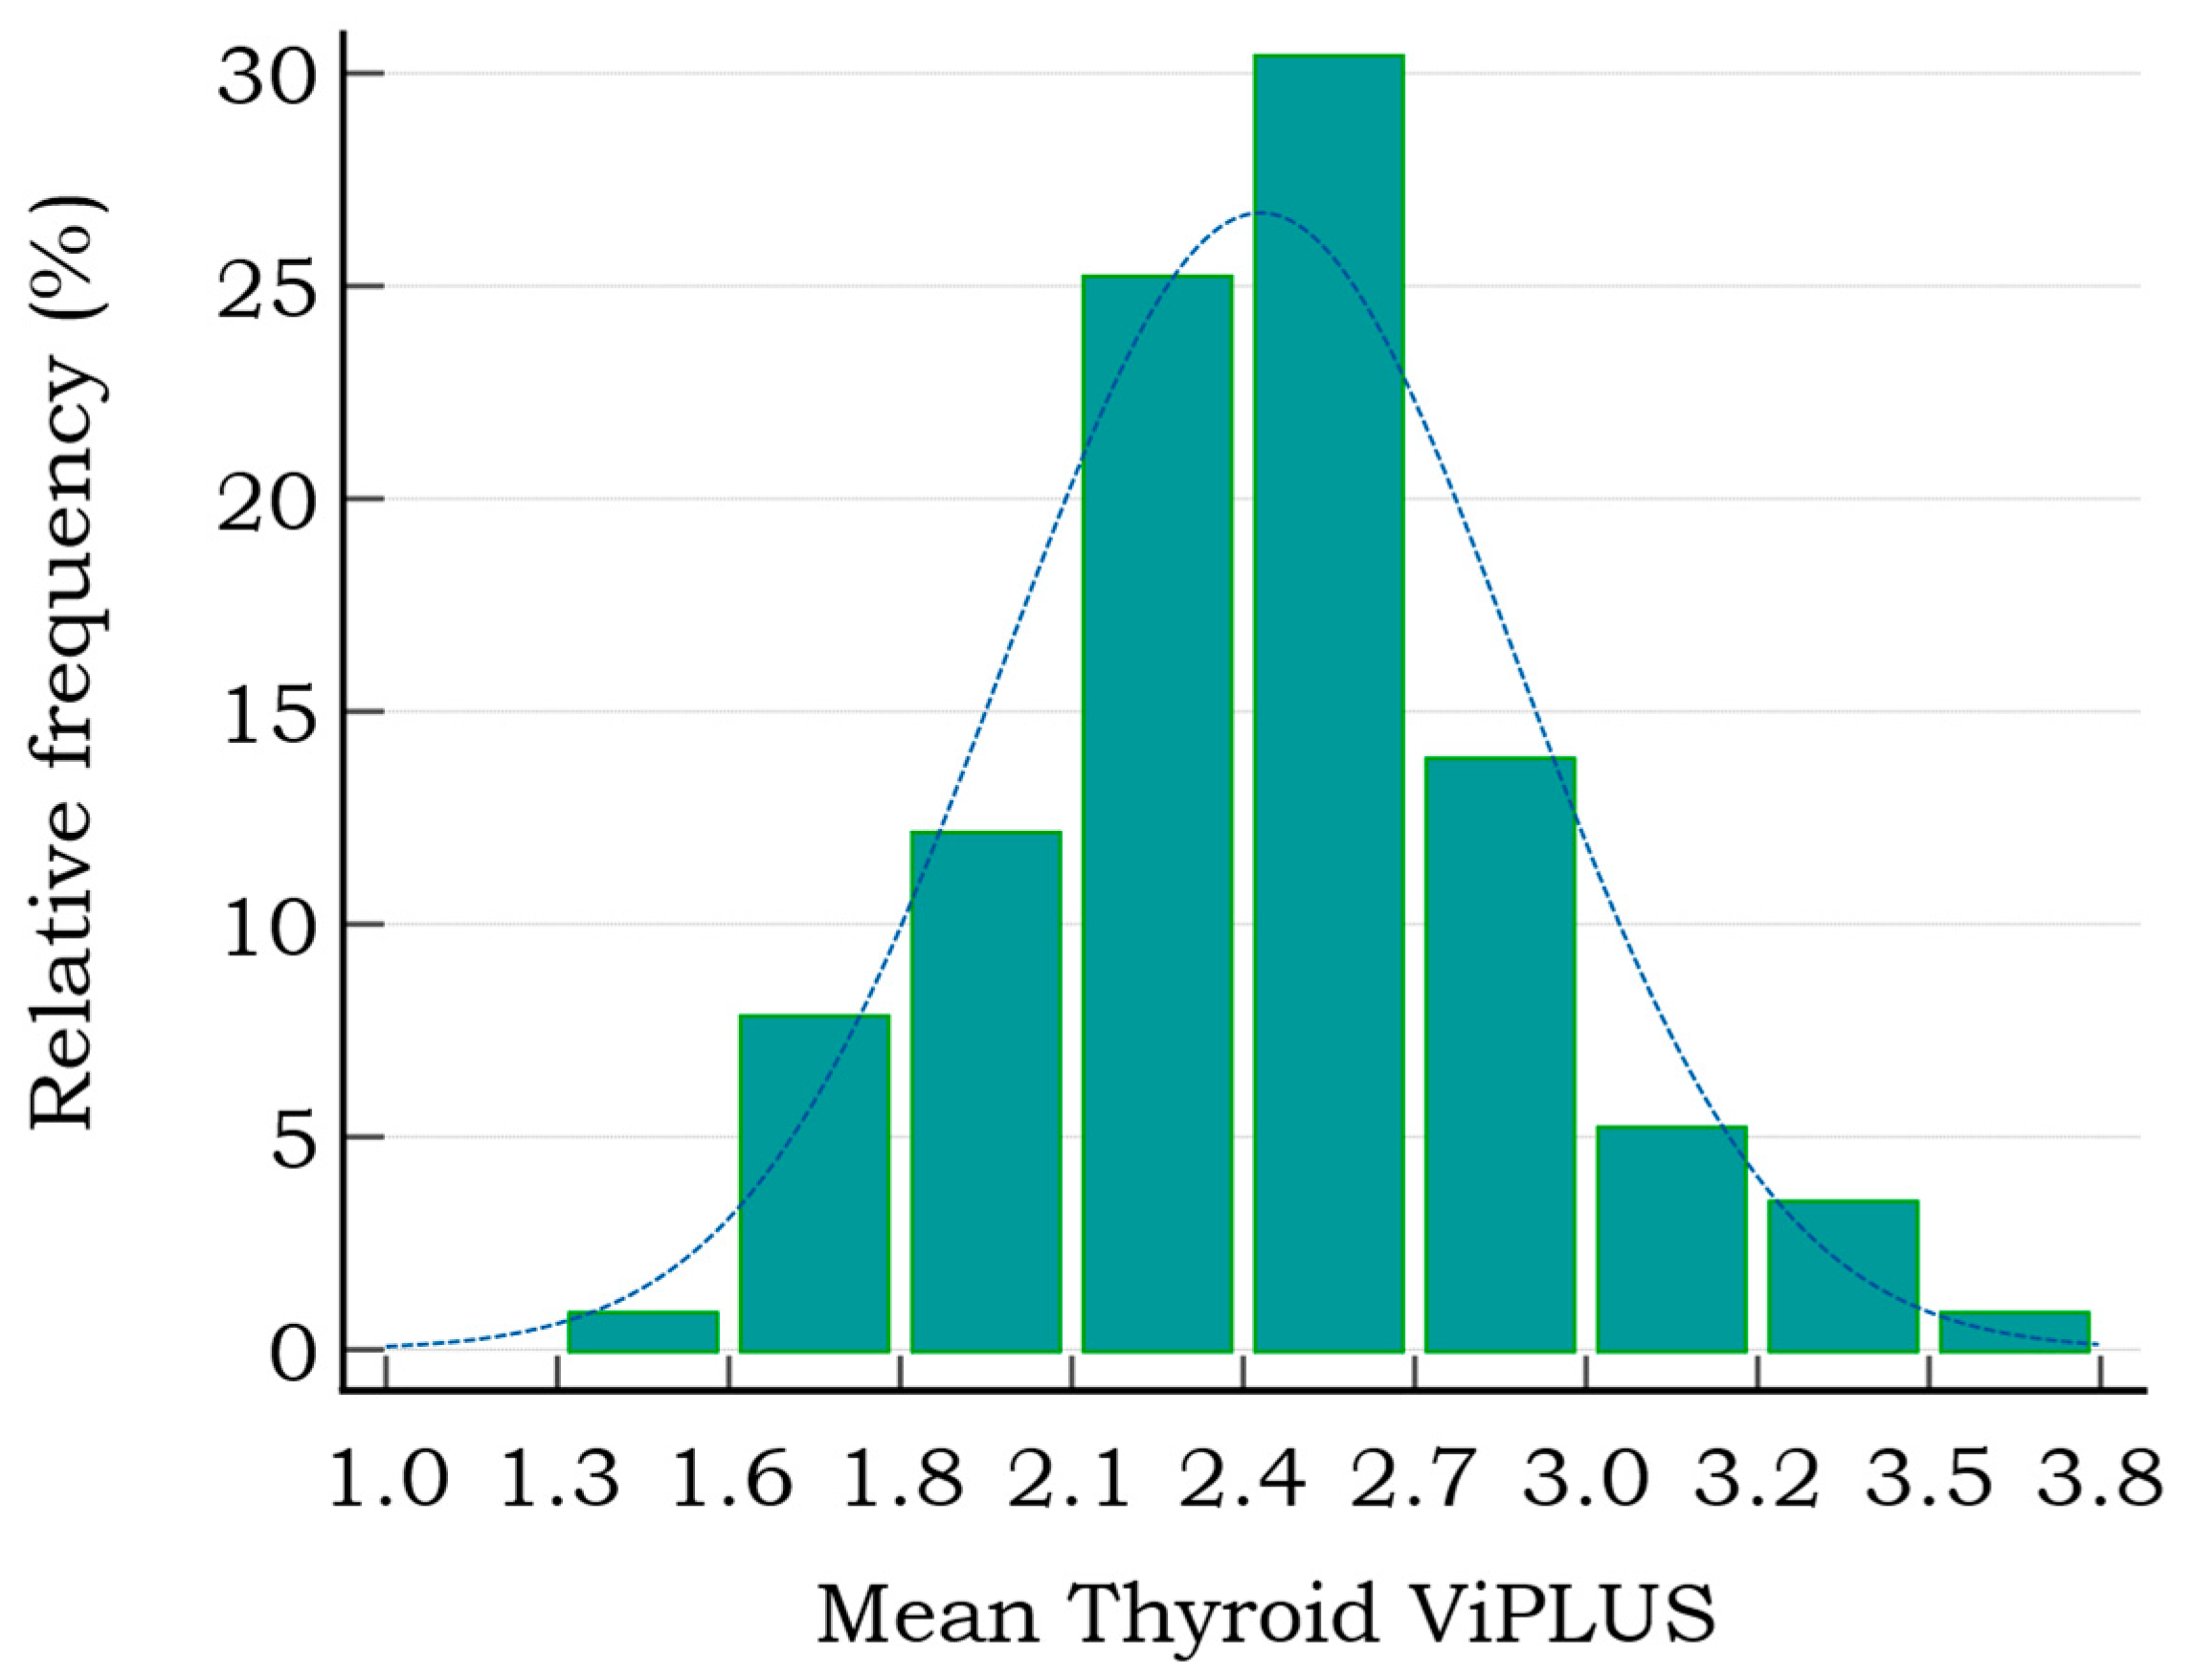
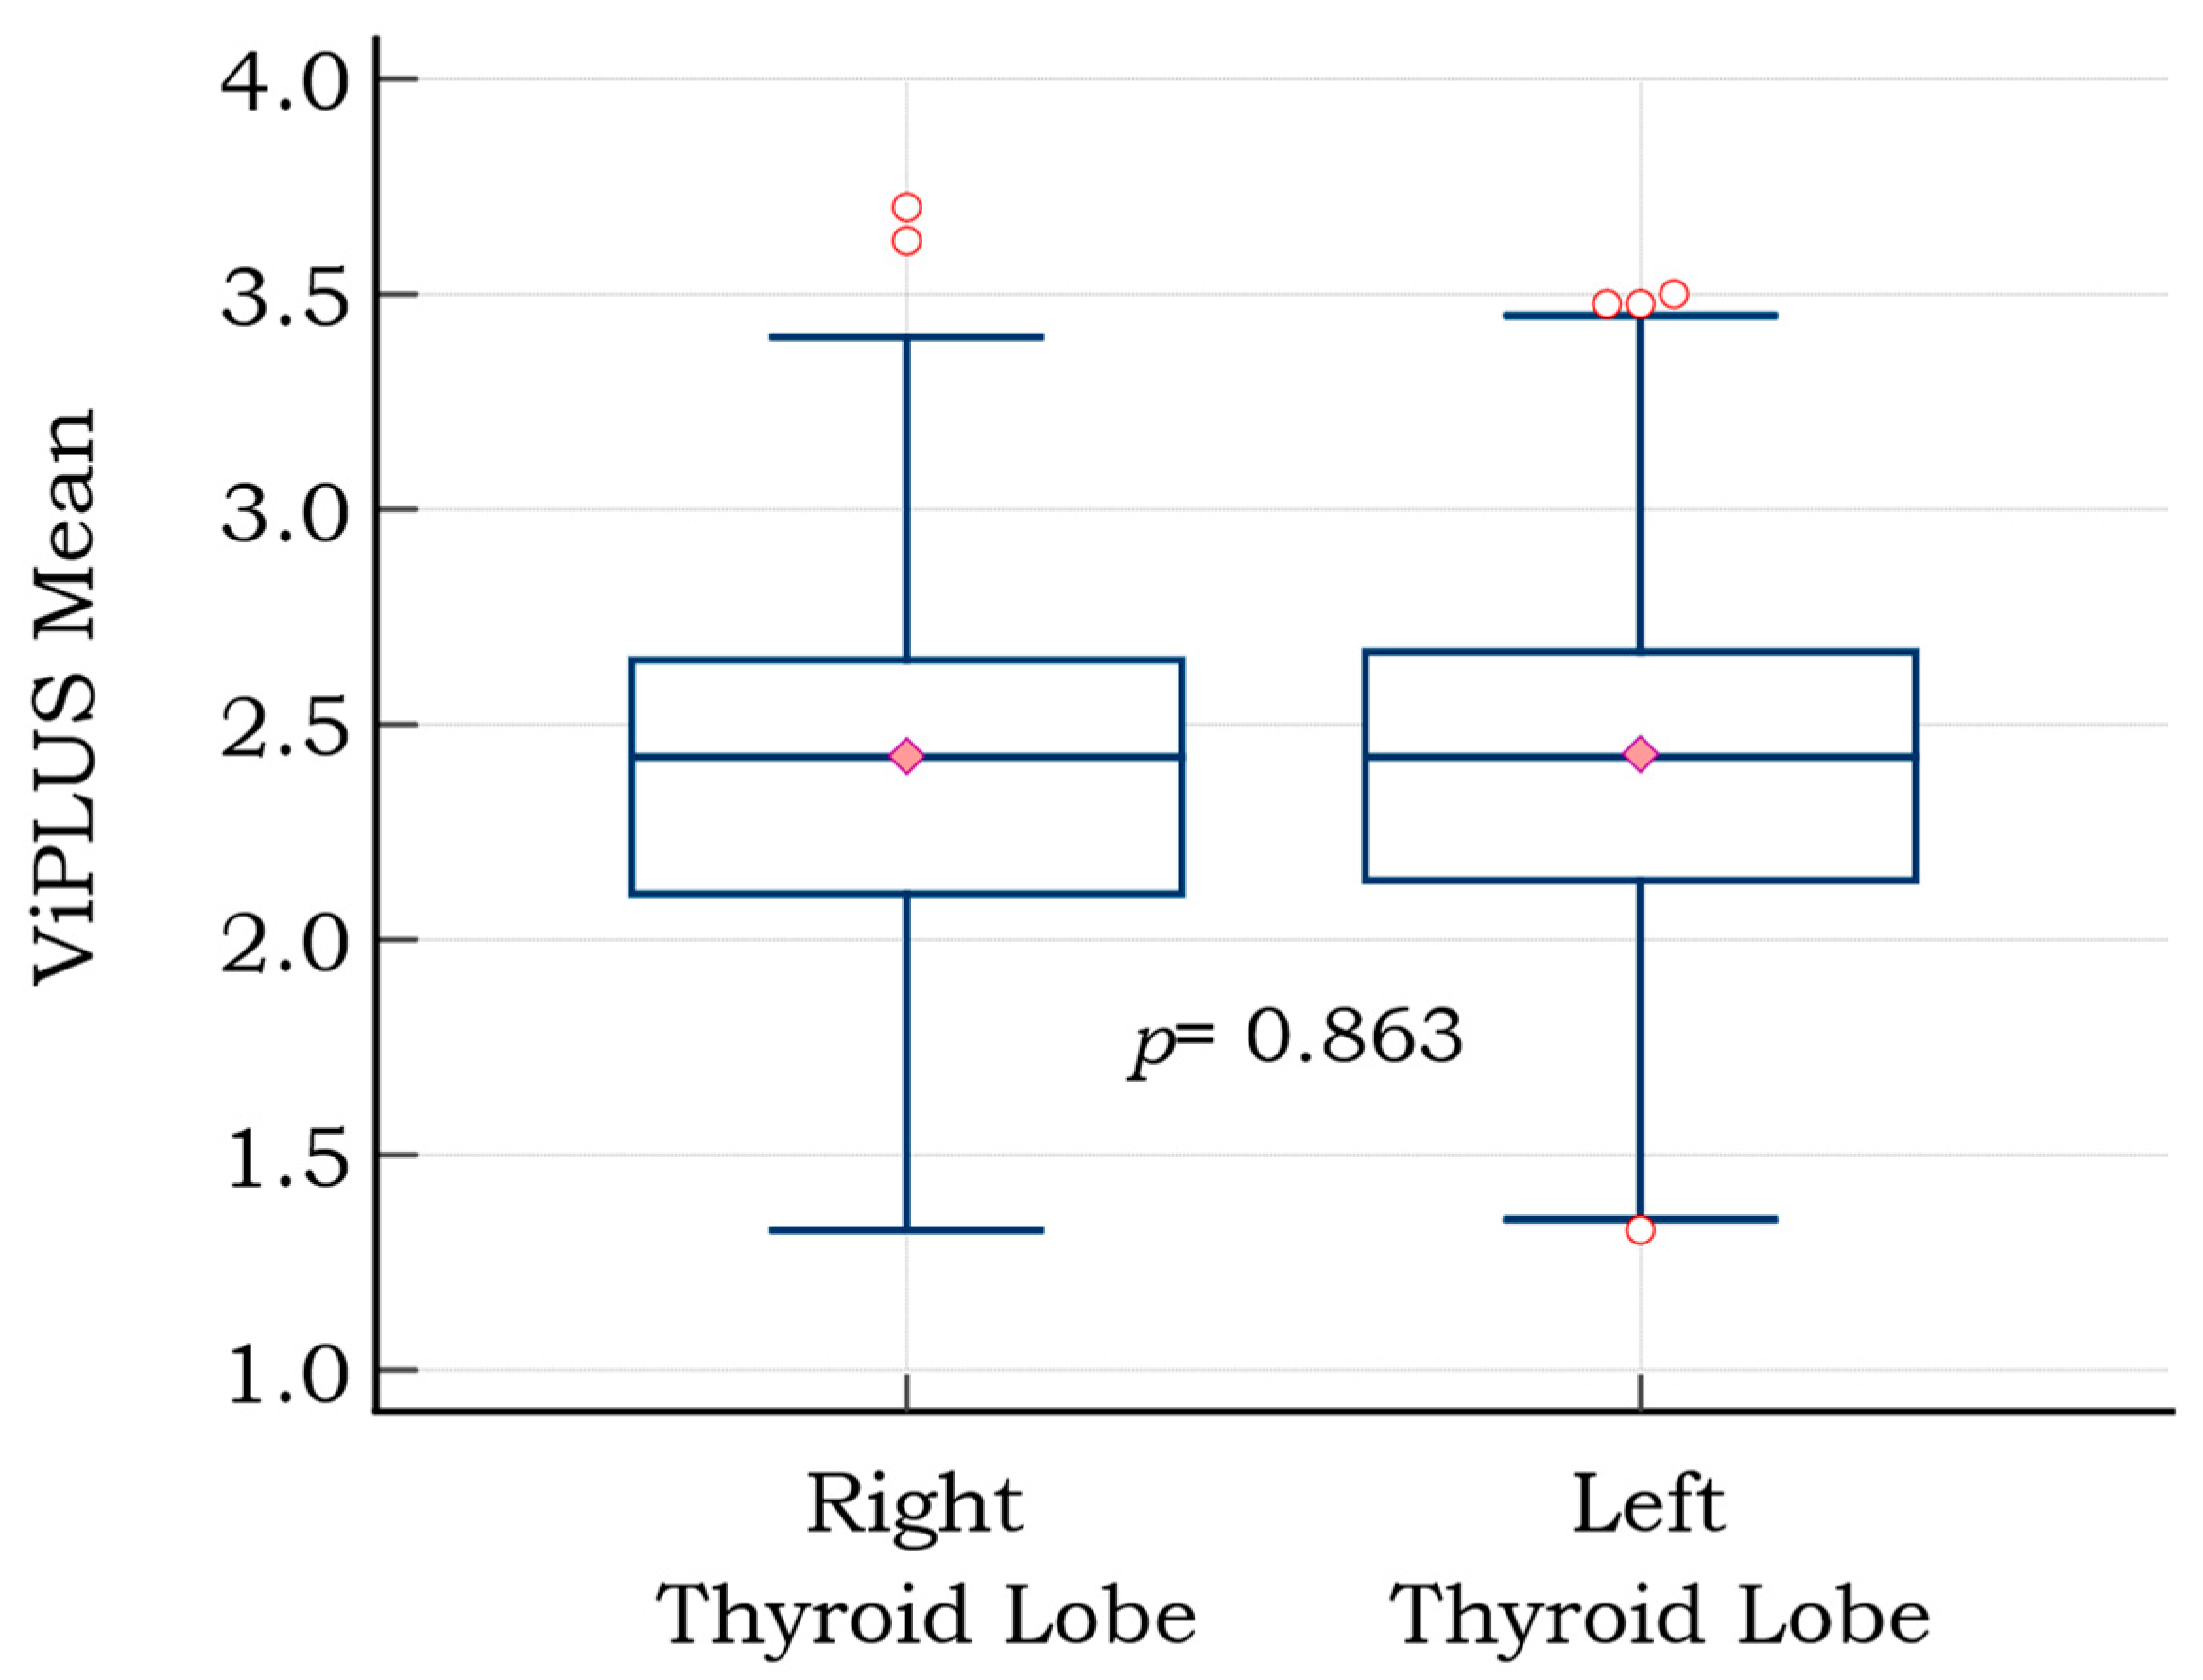
3.3. Vi PLUS Values in the Healthy Thyroid Cohort and the Influence of Subjects’ Characteristics
4. Discussion
5. Conclusions
Author Contributions
Funding
Institutional Review Board Statement
Informed Consent Statement
Conflicts of Interest
References
- Braverman, L.E.; Cooper, D. Werner & Ingbar’s the Thyroid: A Fundamental and Clinical Text; Lippincott Williams & Wilkins: Philadelphia, PA, USA, 2012. [Google Scholar]
- Harris, R.D.; Langer, J.E.; Levine, R.A.; Sheth, S.; Abramson, S.J.; Gabriel, H.; Patel, M.D.; Craychee, J.A.; Miller, C.A.; Rosenberg, H.K.; et al. AIUM Thyroid and parathyroid ultrasound examination. J. Ultrasound Med. 2013, 32, 1319–1329. [Google Scholar]
- Vanderpump, M.P.J. The epidemiology of thyroid disease. Br. Med. Bull. 2011, 99, 39–51. [Google Scholar] [CrossRef] [PubMed]
- Zhao, C.-K.; Xu, H.-X. Ultrasound Elastography of the Thyroid: Principles and Current Status. Ultrasonography 2019, 38, 106–124. Available online: https://pubmed.ncbi.nlm.nih.gov/30690960 (accessed on 12 August 2022). [CrossRef]
- Popa, A.; Șirli, R.; Popescu, A.; Bâldea, V.; Lupușoru, R.; Bende, F.; Cotrău, R.; Sporea, I. Ultrasound-Based Quantification of Fibrosis and Steatosis with a New Software Considering Transient Elastography as Reference in Patients with Chronic Liver Diseases. Ultrasound Med. Biol. 2021, 47, 1692–1703. [Google Scholar] [CrossRef] [PubMed]
- Herrmann, E.; De Lédinghen, V.; Cassinotto, C.; Chu, W.C.W.; Leung, V.Y.-F.; Ferraioli, G.; Filice, C.; Castera, L.; Vilgrain, V.; Ronot, M.; et al. Assessment of biopsy-proven liver fibrosis by two-dimensional shear wave elastography: An individual patient data-based meta-analysis. Hepatology 2018, 67, 260–272. [Google Scholar] [CrossRef]
- Cosgrove, D.; Barr, R.; Bojunga, J.; Cantisani, V.; Chammas, M.C.; Dighe, M.; Vinayak, S.; Xu, J.-M.; Dietrich, C.F. WFUMB Guidelines and Recommendations on the Clinical Use of Ultrasound Elastography: Part 4. Thyroid. Ultrasound Med. Biol. 2017, 43, 4–26. [Google Scholar] [CrossRef]
- Stoian, D.; Bogdan, T.; Craina, M.; Craciunescu, M.; Timar, R.; Schiller, A. Elastography: A New Ultrasound Technique in Nodular Thyroid Pathology. In Thyroid Cancer—Advances in Diagnosis and Therapy; IntechOpen: London, UK, 2016. [Google Scholar]
- Eremici, I.; Dumitru, C.; Navolan, D.; Craina, M.; Ivan, V.; Borcan, F.; Dehelean, C.A.; Mozos, I.; Stoian, D. Diagnostic Value of Different Risk-Stratification Algorithms in Solid Breast Lesions. Appl. Sci. 2020, 10, 6943. [Google Scholar] [CrossRef]
- Barr, R.G. Real-time ultrasound elasticity of the breast: Initial clinical results. Ultrasound Q. 2010, 26, 61–66. [Google Scholar] [CrossRef]
- Itoh, A.; Ueno, E.; Tohno, E.; Kamma, H.; Takahashi, H.; Shiina, T.; Yamakawa, M.; Matsumura, T. Breast Disease: Clinical Application of US Elastography for Diagnosis. Radiology 2006, 239, 341–350. [Google Scholar] [CrossRef]
- Ozturk, A.; Grajo, J.R.; Dhyani, M.; Anthony, B.W.; Samir, A.E. Principles of ultrasound elastography. Abdom. Radiol. 2018, 43, 773–785. [Google Scholar] [CrossRef]
- Kara, T.; Ateş, F.; Durmaz, M.S.; Akyürek, N.; Durmaz, F.G.; Özbakır, B.; Öztürk, M. Assessment of thyroid gland elasticity with shear-wave elastography in Hashimoto’s thyroiditis patients. J. Ultrasound 2020, 23, 543–551. [Google Scholar] [CrossRef] [PubMed]
- Chen, M.; Zhang, K.-Q.; Xu, Y.-F.; Zhang, S.-M.; Cao, Y.; Sun, W.-Q. Shear wave elastography and contrast-enhanced ultrasonography in the diagnosis of thyroid malignant nodules. Mol. Clin. Oncol. 2016, 5, 724–730. [Google Scholar] [CrossRef] [PubMed]
- Park, A.Y.; Son, E.J.; Han, K.; Youk, J.H.; Kim, J.-A.; Park, C.S. Shear wave elastography of thyroid nodules for the prediction of malignancy in a large scale study. Eur. J. Radiol. 2015, 84, 407–412. [Google Scholar] [CrossRef]
- Bhatia, K.S.S.; Tong, C.S.L.; Cho, C.C.M.; Yuen, E.H.Y.; Lee, Y.Y.P.; Ahuja, A.T. Shear wave elastography of thyroid nodules in routine clinical practice: Preliminary observations and utility for detecting malignancy. Eur. Radiol. 2012, 22, 2397–2406. [Google Scholar] [CrossRef]
- Dighe, M.K. Elastography of Thyroid Masses Discussion of Problem/Clinical Presentation. Ultrasound Clin. 2014, 9, 13. [Google Scholar] [CrossRef] [PubMed]
- Chang, N.; Zhang, X.; Wan, W.; Zhang, C.; Zhang, X. The Preciseness in Diagnosing Thyroid Malignant Nodules Using Shear-Wave Elastography. Med Sci. Monit. 2018, 24, 671–677. [Google Scholar] [CrossRef]
- Shiina, T.; Nightingale, K.R.; Palmeri, M.L.; Hall, T.J.; Bamber, J.C.; Barr, R.G.; Castera, L.; Choi, B.I.; Chou, Y.-H.; Cosgrove, D.; et al. WFUMB Guidelines and Recommendations for Clinical Use of Ultrasound Elastography: Part 1: Basic Principles and Terminology. Ultrasound Med. Biol. 2015, 41, 1126–1147. [Google Scholar] [CrossRef]
- Popa, A.; Bende, F.; Șirli, R.; Popescu, A.; Bâldea, V.; Lupușoru, R.; Cotrău, R.; Fofiu, R.; Foncea, C.; Sporea, L. Quantification of Liver Fibrosis, Steatosis, and Viscosity Using Multiparametric Ultrasound in Patients with Non-Alcoholic Liver Disease: A “Real-Life” Cohort Study. Diagnostics 2021, 11, 783. [Google Scholar] [CrossRef]
- Rus, G.; Faris, I.H.; Torres, J.; Callejas, A.; Melchor, J. Why Are Viscosity and Nonlinearity Bound to Make an Impact in Clinical Elastographic Diagnosis? Sensors 2020, 20, 2379. [Google Scholar] [CrossRef]
- Sugimoto, K.; Moriyasu, F.; Oshiro, H.; Takeuchi, H.; Yoshimasu, Y.; Kasai, Y.; Itoi, T. Clinical utilization of shear wave dispersion imaging in diffuse liver disease. Ultrasonography 2019, 39, 3–10. [Google Scholar] [CrossRef]
- Rianna, C.; Radmacher, M. Comparison of viscoelastic properties of cancer and normal thyroid cells on different stiffness substrates. Eur. Biophys. J. 2017, 46, 309–324. [Google Scholar] [CrossRef] [PubMed]
- Simescu, M.; Popescu, R.; Ionitiu, D.; Zbranca, E.; Grecu, E.; Marinescu, E.; Tintea, L.; Nicolaescu, E.; Purice, M.; Popa, M.; et al. The Status of Iodine Nutrition in Romania. In Iodine Deficiency in Europe: A Continuing Concern; Delange, F., Dunn, J.T., Eds.; Springer: Boston, MA, USA, 1993; pp. 383–388. Available online: https://doi.org/10.1007/978-1-4899-1245-9_50 (accessed on 12 August 2022).
- Gao, L.; Parker, K.; Lerner, R.; Levinson, S. Imaging of the elastic properties of tissue—A review. Ultrasound Med. Biol. 1996, 22, 959–977. [Google Scholar] [CrossRef]
- Dudea, S.M.; Jid, C.B. Ultrasound elastography in thyroid disease. Med. Ultrason. 2015, 17, 74–96. [Google Scholar] [CrossRef] [PubMed]
- Choi, I.; Na, D.G. Can ultrasound echogenicity of normal parotid and submandibular glands be used as a reference standard for normal thyroid echogenicity? Ultrasonography 2022, 28. [Google Scholar] [CrossRef] [PubMed]
- Deffieux, T.; Gennisson, J.-L.; Bousquet, L.; Corouge, M.; Cosconea, S.; Amroun, D.; Tripon, S.; Terris, B.; Mallet, V.; Sogni, P.; et al. Investigating liver stiffness and viscosity for fibrosis, steatosis and activity staging using shear wave elastography. J. Hepatol. 2015, 62, 317–324. [Google Scholar] [CrossRef]
- Popa, A.; Sporea, I.; Bende, F.; Popescu, A.; Fofiu, R.; Borlea, A.; Bâldea, V.; Pascu, A.; Foncea, C.G.; Cotrău, R.; et al. The Non-Invasive Ultrasound-Based Assessment of Liver Viscosity in a Healthy Cohort. Diagnostics 2022, 12, 1451. [Google Scholar] [CrossRef]
- Mohammed, S.; Thadathil, N.; Selvarani, R.; Nicklas, E.H.; Wang, D.; Miller, B.F.; Richardson, A.; Deepa, S.S. Necroptosis contributes to chronic inflammation and fibrosis in aging liver. Aging Cell 2021, 20, e13512. [Google Scholar] [CrossRef]
- Stahl, E.C.; Haschak, M.J.; Popovic, B.; Brown, B.N. Macrophages in the Aging Liver and Age-Related Liver Disease. Front. Immunol. 2018, 9, 2795. [Google Scholar] [CrossRef]
- Bende, F.; Tudoran, C.; Sporea, I.; Fofiu, R.; Bâldea, V.; Cotrău, R.; Popescu, A.; Sirli, R.; Ungureanu, B.; Tudoran, M. A Multidisciplinary Approach to Evaluate the Presence of Hepatic and Cardiac Abnormalities in Patients with Post-Acute COVID-19 Syndrome—A Pilot Study. J. Clin. Med. 2021, 10, 2507. [Google Scholar] [CrossRef]
- Dong, Y.; Qiu, Y.; Zhang, Q.; Yang, D.; Yu, L.; Wang, W.-P.; Dietrich, C.F. Preliminary Clinical Experience with Shear Wave Dispersion Imaging for Liver Viscosity in Preoperative Diagnosis of Focal Liver Lesions. 2020, 58, pp. 847–854. Available online: http://www.thieme-connect.com/products/ejournals/html/10.1055/a-1217-7465 (accessed on 15 August 2022).
- Maralescu, F.-M.; Chiodan, M.; Sircuta, A.; Schiller, A.; Petrica, L.; Bob, F. Are the Currently Available Elastography Methods Useful in the Assessment of Chronic Kidney Disease? A Systematic Review and a Meta-Analysis. Appl. Sci. 2022, 12, 2359. Available online: https://www.mdpi.com/2076-3417/12/5/2359 (accessed on 1 August 2022). [CrossRef]
- McFarlin, B.L.; Kumar, V.; Bigelow, T.A.; Simpson, D.G.; White-Traut, R.C.; Abramowicz, J.S.; O’Brien, W.D. Beyond Cervical Length: A Pilot Study of Ultrasonic Attenuation for Early Detection of Preterm Birth Risk. Ultrasound Med. Biol. 2015, 41, 3023–3029. [Google Scholar] [CrossRef] [PubMed] [Green Version]
- Chen, S.; Urban, M.W.; Pislaru, C.; Kinnick, R.; Zheng, Y.; Yao, A.; Greenleaf, J.F. Shearwave dispersion ultrasound vibrometry (SDUV) for measuring tissue elasticity and viscosity. IEEE Trans. Ultrason. Ferroelectr. Freq. Control 2009, 56, 55–62. [Google Scholar] [CrossRef] [PubMed] [Green Version]


| Parameter | Value | |
|---|---|---|
| Total number | 115 | |
| Gender | Male | 33 (28.7%) |
| Female | 82 (71.3%) | |
| Mean BMI | 24.02 ± 4.35 kg/m2 | |
| Mean age | 34 ± 12.7 years | |
| Age groups (number of subjects) | 18–25 | 39 |
| 26–40 | 48 | |
| >40 | 28 | |
| US-Based Parameter | Value | |
|---|---|---|
| Mean 2D-SWE PLUS (kPa) | Mean ± SD | 13.34 ± 3.2 |
| Min | 6.0 | |
| Max | 22.1 | |
| ViPLUS (Pa·s) | Mean ± SD | 2.42 ± 0.41 |
| Min | 1.33 | |
| Max | 3.58 | |
| Depth | 1.6 ± 0.26 cm | |
| Age Subgroup | Mean 2D-SWE PLUS (kPa) | Mean ViPLUS (Pa·s) | ||
|---|---|---|---|---|
| 18–25 | 13.6 ± 3.2 | p = 0.500 | 2.38 ± 0.38 | p = 0.391 |
| 26–40 | 12.9 ± 2.9 | p = 0.310 | 2.49 ± 0.43 | p = 0.127 |
| >40 | 13.57 ± 3.64 | p = 0.661 | 2.36 ± 0.43 | p = 0.376 |
| BMI | Depth | Age | Gender | Mean SWE | ||
|---|---|---|---|---|---|---|
| Mean SWE | Correlation coefficient | −0.195 | 0.018 | 0.008 | 0.008 | - |
| Significance Level p | 0.1498 | 0.8466 | 0.9283 | 0.9243 | ||
| n | 115 | 115 | 115 | 115 | ||
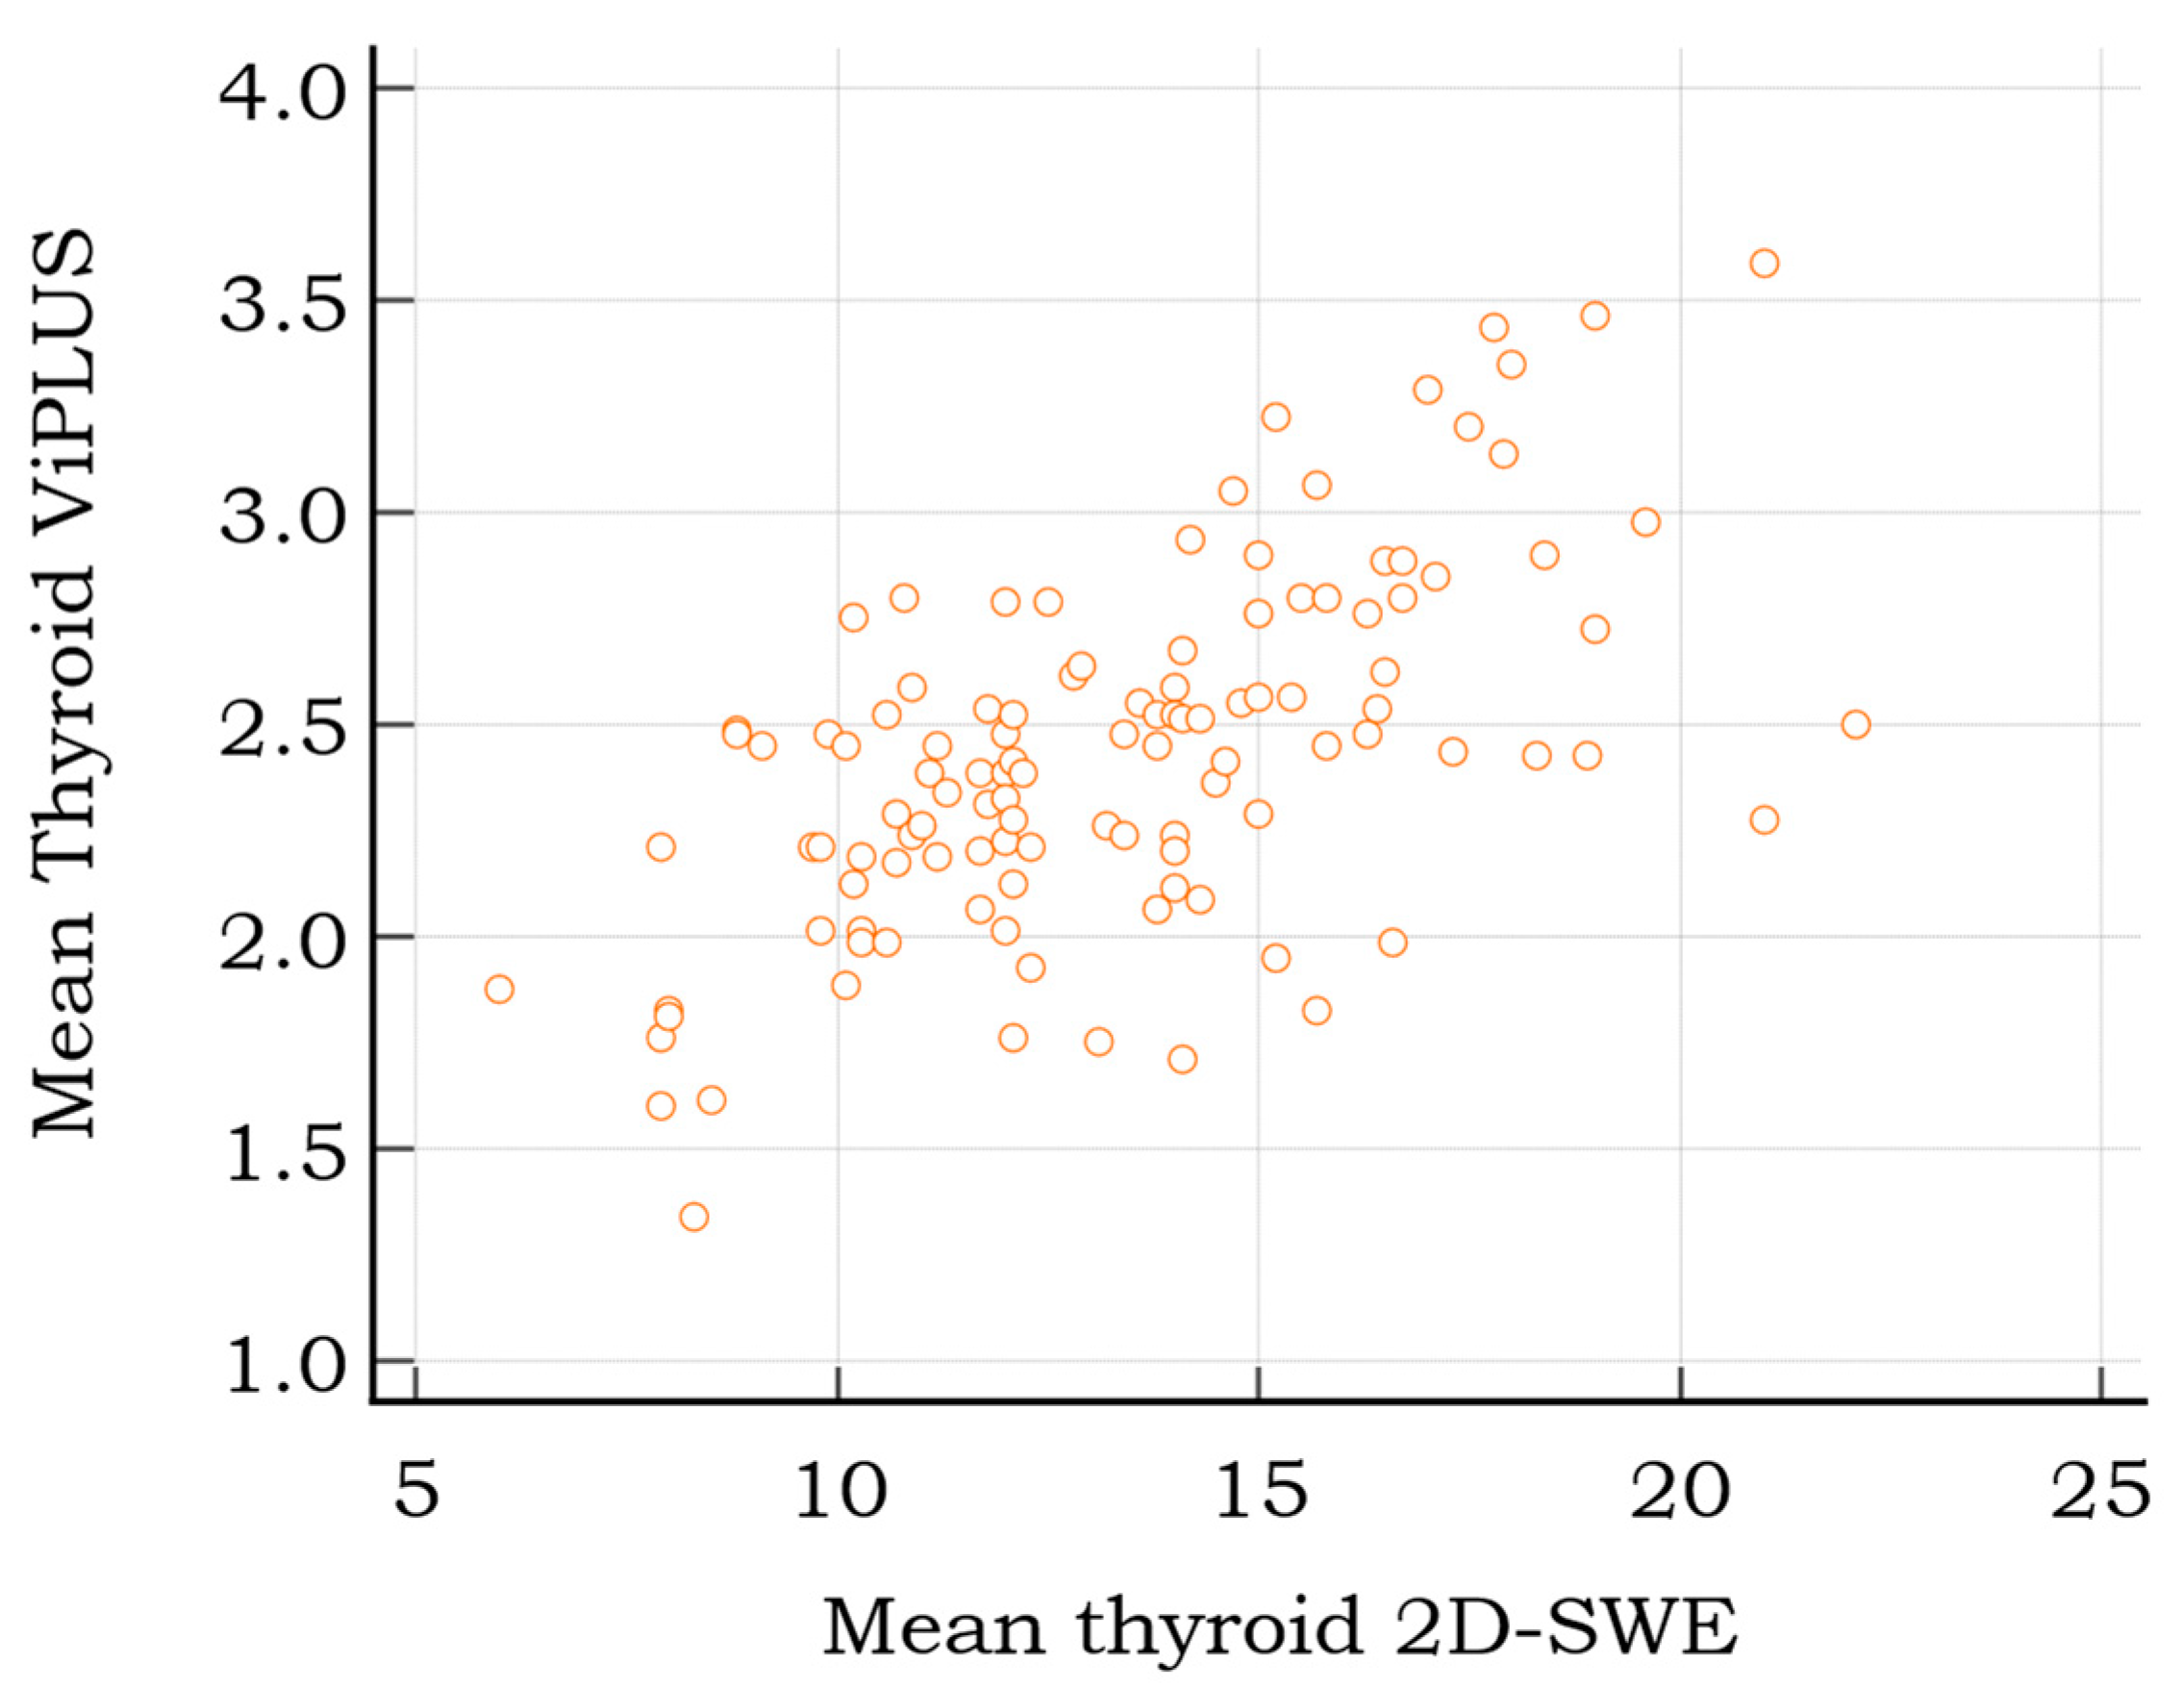
| Mean ViPLUS | Correlation coefficient | 0.025 | 0.096 | −0.101 | 0.178 | 0.608 |
| Significance Level p | 0.8563 | 0.3088 | 0.2842 | 0.0566 | <0.0001 | |
| n | 115 | 115 | 115 | 115 | 115 |
Publisher’s Note: MDPI stays neutral with regard to jurisdictional claims in published maps and institutional affiliations. |
© 2022 by the authors. Licensee MDPI, Basel, Switzerland. This article is an open access article distributed under the terms and conditions of the Creative Commons Attribution (CC BY) license (https://creativecommons.org/licenses/by/4.0/).
Share and Cite
Stoian, D.; Moisa, L.; Taban, L.; Sporea, I.; Popa, A.; Bende, F.; Popescu, A.; Borlea, A. Quantification of Thyroid Viscosity in Healthy Subjects Using Ultrasound Shear Wave Dispersion (Viscosity PLUS). Diagnostics 2022, 12, 2194. https://doi.org/10.3390/diagnostics12092194
Stoian D, Moisa L, Taban L, Sporea I, Popa A, Bende F, Popescu A, Borlea A. Quantification of Thyroid Viscosity in Healthy Subjects Using Ultrasound Shear Wave Dispersion (Viscosity PLUS). Diagnostics. 2022; 12(9):2194. https://doi.org/10.3390/diagnostics12092194
Chicago/Turabian StyleStoian, Dana, Luciana Moisa, Laura Taban, Ioan Sporea, Alexandru Popa, Felix Bende, Alina Popescu, and Andreea Borlea. 2022. "Quantification of Thyroid Viscosity in Healthy Subjects Using Ultrasound Shear Wave Dispersion (Viscosity PLUS)" Diagnostics 12, no. 9: 2194. https://doi.org/10.3390/diagnostics12092194